Article

Evaluation of Autonomous Mowers Weed Control Effect in Globe Artichoke Field

Department of Agriculture, Food and Environment, University of Pisa, Via del Borghetto 80, 56124 Pisa, Italy
*
Author to whom correspondence should be addressed.
Appl. Sci. 2021, 11(24), 11658; https://doi.org/10.3390/app112411658
Submission received: 3 November 2021 / Revised: 30 November 2021 / Accepted: 4 December 2021 / Published: 8 December 2021
(This article belongs to the Special Issue New Trends in Weed Control and Smart Agriculture)

Abstract

:
The development of a fully automated robotic weeder is currently hindered by the lack of a reliable technique for weed-crop detection. Autonomous mowers moving with random trajectories rely on simplified computational resources and have shown potential when applied for agricultural purposes. This study aimed to evaluate the applicability of these autonomous mowers for weed control in globe artichoke. A first trial consisting of the comparison of the performances of three different autonomous mowers (AM1, AM2 and AM3) was carried out evaluating percentage of area mowed and primary energy consumption. The most suitable autonomous mower was tested for its weed control effect and compared with a conventional weed management system. Average weeds height, weed cover percentage, above-ground weed biomass, artichoke yield, primary energy consumption and cost were assessed. All the autonomous mowers achieved a percentage of area mowed around the 80% after 180 min. AM2 was chosen as the best compromise for weed control in the artichoke field (83.83% of area mowed after 180 min of mowing, and a consumption of 430.50 kWh⋅ha−1⋅year−1). The autonomous mower weed management achieved a higher weed control effect (weed biomass of 71.76 vs. 143.67 g d.m.⋅m−2), a lower energy consumption (430.5 vs. 1135.13 kWh⋅ha−1⋅year−1), and a lower cost (EUR 2601.84 vs. EUR 3661.80 ha−1·year−1) compared to the conventional system.

1. Introduction

The adoption of autonomous technologies is becoming increasingly popular in agriculture as they are able to improve the quality and quantity of agricultural products [1,2] as well as reduce productive costs [3]. These new technologies allow for the innovation of production processes and can also favor a more sustainable economic development [4]. For these reasons, since 2012, investments relating to advanced agricultural technologies have increased annually by 80% [5], and a significant amount has been used for automation [6]. Robots can be used to conduct autonomously repetitive and hazardous agricultural practices such as harvesting, spraying and weed management [7], some of the most important challenges in the agricultural industry [8].
Vegetables are high-value crops and total production value can reach USD 19,385 ha−1; therefore, effective weed control is crucial to achieve an adequate yield [9]. Indeed, weeds represent a major issue for vegetable production causing yield losses worldwide. Several previous studies have reported yield loss caused by weeds in vegetables. For example, Dusky et al. found that weed competition for the entire growing season reduced the yield of lettuce by 56% [10], whereas in broccoli, the presence of ryegrass (Lolium spp.) at 600 plants m−2 within the row has resulted in the loss of the entire production [11]. In addition to yield losses, weeds can also reduce products quality and their commercial value [12].
To date, the availability of herbicides for vegetable producers is limited and the production of new herbicides for crops such as vegetables is not a priority for the industry [13,14]. To compensate the lack of effective herbicides, vegetables producers rely on manual weeding. However, problems related to labor shortage and high labor cost have led to an increasing interest for the development of autonomous robotic weeders [15]. Within the last decade, new technologies for weed control have been developed, some of which have been commercialized. Robovator (F. Poulsen Engineering ApS, Hvalsø, Denmark), for example, is a commercially available tractor-mounted intrarow weeder that relies on hoeing tools controlled by cameras to control weeds [16]. Lati et al. [17] tested this machine in broccoli and lettuce and found that Robovator was able to remove 18 to 41% more weeds than the standard cultivator. Nevertheless, Robovator, like other commercially available robotic weeders, such as IC-Cultivator (Machinefabriek Steketee, Netherlands) and Ferrari Remoweed (Costruzioni macchine Ferrari, Italy) are not able to differentiate crop and weeds, but the technology is based on crop recognition by row pattern [13]. Consequently, if weeds reach the same size of the crop, or the weed density is high enough to hide the row pattern, those machines did not show acceptable performances [18]. Nowadays, the development of a fully automated robotic weeder is mainly hindered by the lack of an automated and reliable technique for distinguishing crops and weeds [19]. Over the years, researchers have developed and evaluated various techniques to differentiate crop and weeds. Machine vision is one of the most used techniques for this purpose [20]. Many researches have been conducted on the 2-D approach, but to date its application is limited to field with low or moderate weed densities [21]. The 3-D approach, being able to use much richer features that can be extracted from 3D data, presents the potential to overcome many limitations in 2D imaging. However, its slow operation speed respect to a 2-D approach, and its computational complexity limits its wider adoption [19]. Weed and crop differentiation should be fast enough to operate at normal field speeds above 0.5 m·s−1 in order to be useful in agriculture [18]. Machine learning techniques have also been used to distinguish crops and weeds [22]. However, machine learning algorithms such as convolutional neural networks (CNN) and classic Bayesian classifiers still present insufficient computational performance to classify plants in complex scenes, such as high weed density [22]. Moreover, these techniques require large data sets to train the model, and in many cases the multi-year seasonal stability of the data has not been demonstrated [19]. Crop signaling could be a promising novel technique consisting of marking vegetables crops with a fluorescent machine readable compound, not present on weeds, to facilitate an accurate weed-crop discrimination [19,23].
Autonomous mowers moving with random trajectories, despite being developed mainly for lawn mowing, have shown an interesting potential when applied for agricultural purposes, such as weed and cover crop management, both in vineyard [24,25] and horticultural contexts [26,27]. The adoption of these autonomous mowers in agriculture presents several advantages. Indeed, small autonomous machines such as these exert a reduced pressure on the soil, and usually have a low energy consumption and low cost [28]. Their high cutting frequency hinders the weed growth, thus limiting their competition with the crop [24]. In addition, random path planning means there is no need for expensive computational resources or complex sensors for localization [29]. Furthermore, weed control with mowing allows to maintain a permanent sod that helps to prevent soil erosion [30]; therefore, the adoption of a conservative approach is favored, which turns out to be more sustainable for the environment.
The globe artichoke (Cynara cardunculus var. scolymus Hayek L.) is a typical vegetable of the Mediterranean basin currently cultivated on all continents [31,32]. Italy is the largest producer with 39,420 ha·year−1 and 378,820 t·year−1 [33]. This horticultural crop presents a plant density of about 7000–10,000 plants per hectare; the distance between the rows generally ranges from 1 m to 1.8 m, while the distance ranges from 0.6 to 1.3 m across the row [34]. Due to the large planting layout, the globe artichoke could be particularly suitable for the use of autonomous mowers with random trajectories as means of weed control. Hence, the aim of the present study was to evaluate if these autonomous mowers could provide for an acceptable weed control on globe artichoke. The specific objectives of this study were: (1) to evaluate the performances of three different autonomous mowers in a globe artichoke field; (2) to compare the weed management of an autonomous mower with a conventional weed management system.

2. Materials and Methods

Two trials were conducted from March to June 2021 in a flat globe artichoke field (Cynara cardunculus var. scolymus Hayek L., cv. ’Violetto’) located at the Agriculture and Environmental Research Centre “Enrico Avanzi”, San Piero a Grado (Pisa), Italy (43°40′48″ N, 10°20′48″ E, 1 m.a.s.l.). The first trial aimed to evaluate the most suitable autonomous mower for weed control in a globe artichoke field. Subsequently, a second trial was carried out to compare the weed control effect of the selected autonomous mower with a conventional weed management system that consisted of multiple mowing operations with a walk-behind flail mower.

2.1. The Globe Artichoke Field

The globe artichoke was established during 2020 with a planting distance of 2.0 m between rows, and 0.9 m within rows (5556 plants ha−1). The crop growth cycle was poliannual and was managed according to the criteria of organic farming (Reg. CE 834/2007). Figure 1 shows cumulative precipitations and maximum and minimum average temperatures recorded from January to June 2021 for each decade of the months.
Major weeds present in the field were: the monocotyledons Cyperus rotundus L., Cynodon dactylon L. Pers., and Poa annua L., and the eudicotyledons Convolvulus arvensis L., Anagallis arvensis L., and Veronica persica Poir.

2.2. Experimental Set up and Design of the Two Trials

2.2.1. Trial 1: Performance Evaluation of Three different Autonomous Mowers

In March 2021, the performances of three different autonomous mowers were tested. A Husqvarna Automower® 310 (Husqvarna, Stockholm, Sweden), hereafter AM1, a Husqvarna Automower® 550 (AM2), and a Husqvarna Automower® 535 (AM3), were compared. These battery-powered machines operate following random trajectories within a defined area. The working area is delimited by a boundary wire, which produces an electromagnetic field. The autonomous mowers stop and change direction whenever they reach the boundary wire or hit an obstacle. The characteristics of the three autonomous mowers [35,36,37] are shown in Table 1. The AM1 (Figure 2a) was chosen for the trial because of its smaller size compared to the others, which could have allowed it to move more easily in confined spaces such as between artichoke plants. The AM2 (Figure 2b), on the other hand, was chosen as it is more of a performing machine, being equipped with a larger battery, a greater working capacity, a higher forward speed and a slightly higher cutting width than the others. Regarding the AM3 (Figure 2c), the choice is due to the fact that the four-wheel drive could have facilitated the movement of the machine in the field since it is within an agricultural context.
Autonomous mowers were left to work on an area of 150 m2 (25 × 6 m) containing four artichoke rows and a buffer area of 18 m2 between the base station and the crop rows. Autonomous mower’ performances were evaluated based on the percentage of area mowed and total primary energy consumption. Details about the above-mentioned assessments are reported in Section 2.3 (Data Collection). Based on previous experience in agricultural contexts, an acceptable weed control effect was achieved when the percentage of area mowed was around 80% [25]. Thus, this level of coverage was assumed as the target of the studied machines. Each autonomous mower was set to work 3 h (charging time excluded). The three autonomous mowers were tested one at a time, six times each.

2.2.2. Trial 2: Comparison between the Weed Control Effect of Autonomous Mower and Conventional Weed Management

From April to June 2021 a second trial was carried out to compare the weed control effect of the selected autonomous mower with the conventional weed management system. The chosen autonomous mower was set to work two days a week, on an area of 150 m2, with a mowing time of 3 h. In this case, weed cover percentage, average weeds height, above-ground weed biomass, globe artichoke yield, primary energy consumption and cost of the two weed management systems were assessed. Details about the above-mentioned assessment are reported in Section 2.3 (Data Collection). For this trial, the randomized complete block design was adopted.
The conventional weed management system consisted of multiple mowing operations of spontaneous species. Being a small farm, mowing was conventionally carried out with a walk-behind flail mower Orec HR531 (Orec, Fukuoka, Japan) powered by a 4.3 kW gasoline engine. The flail mower was equipped with a cutting unit rotor with 32 “Y” tines frame in welded and stamped steel. The mower had a cutting width of 0.52 m and an adjustable cutting height of 0.05–0.1 m. The weight of the machine was 124 kg [38]. During 2020, mowing was performed on 12 September, 21 October and 15 November, while during 2021 mowing treatments were provided on 27 February, 21 March, 9 April and 20 May, for a total of seven treatments in the 2020–2021 artichoke growing season.

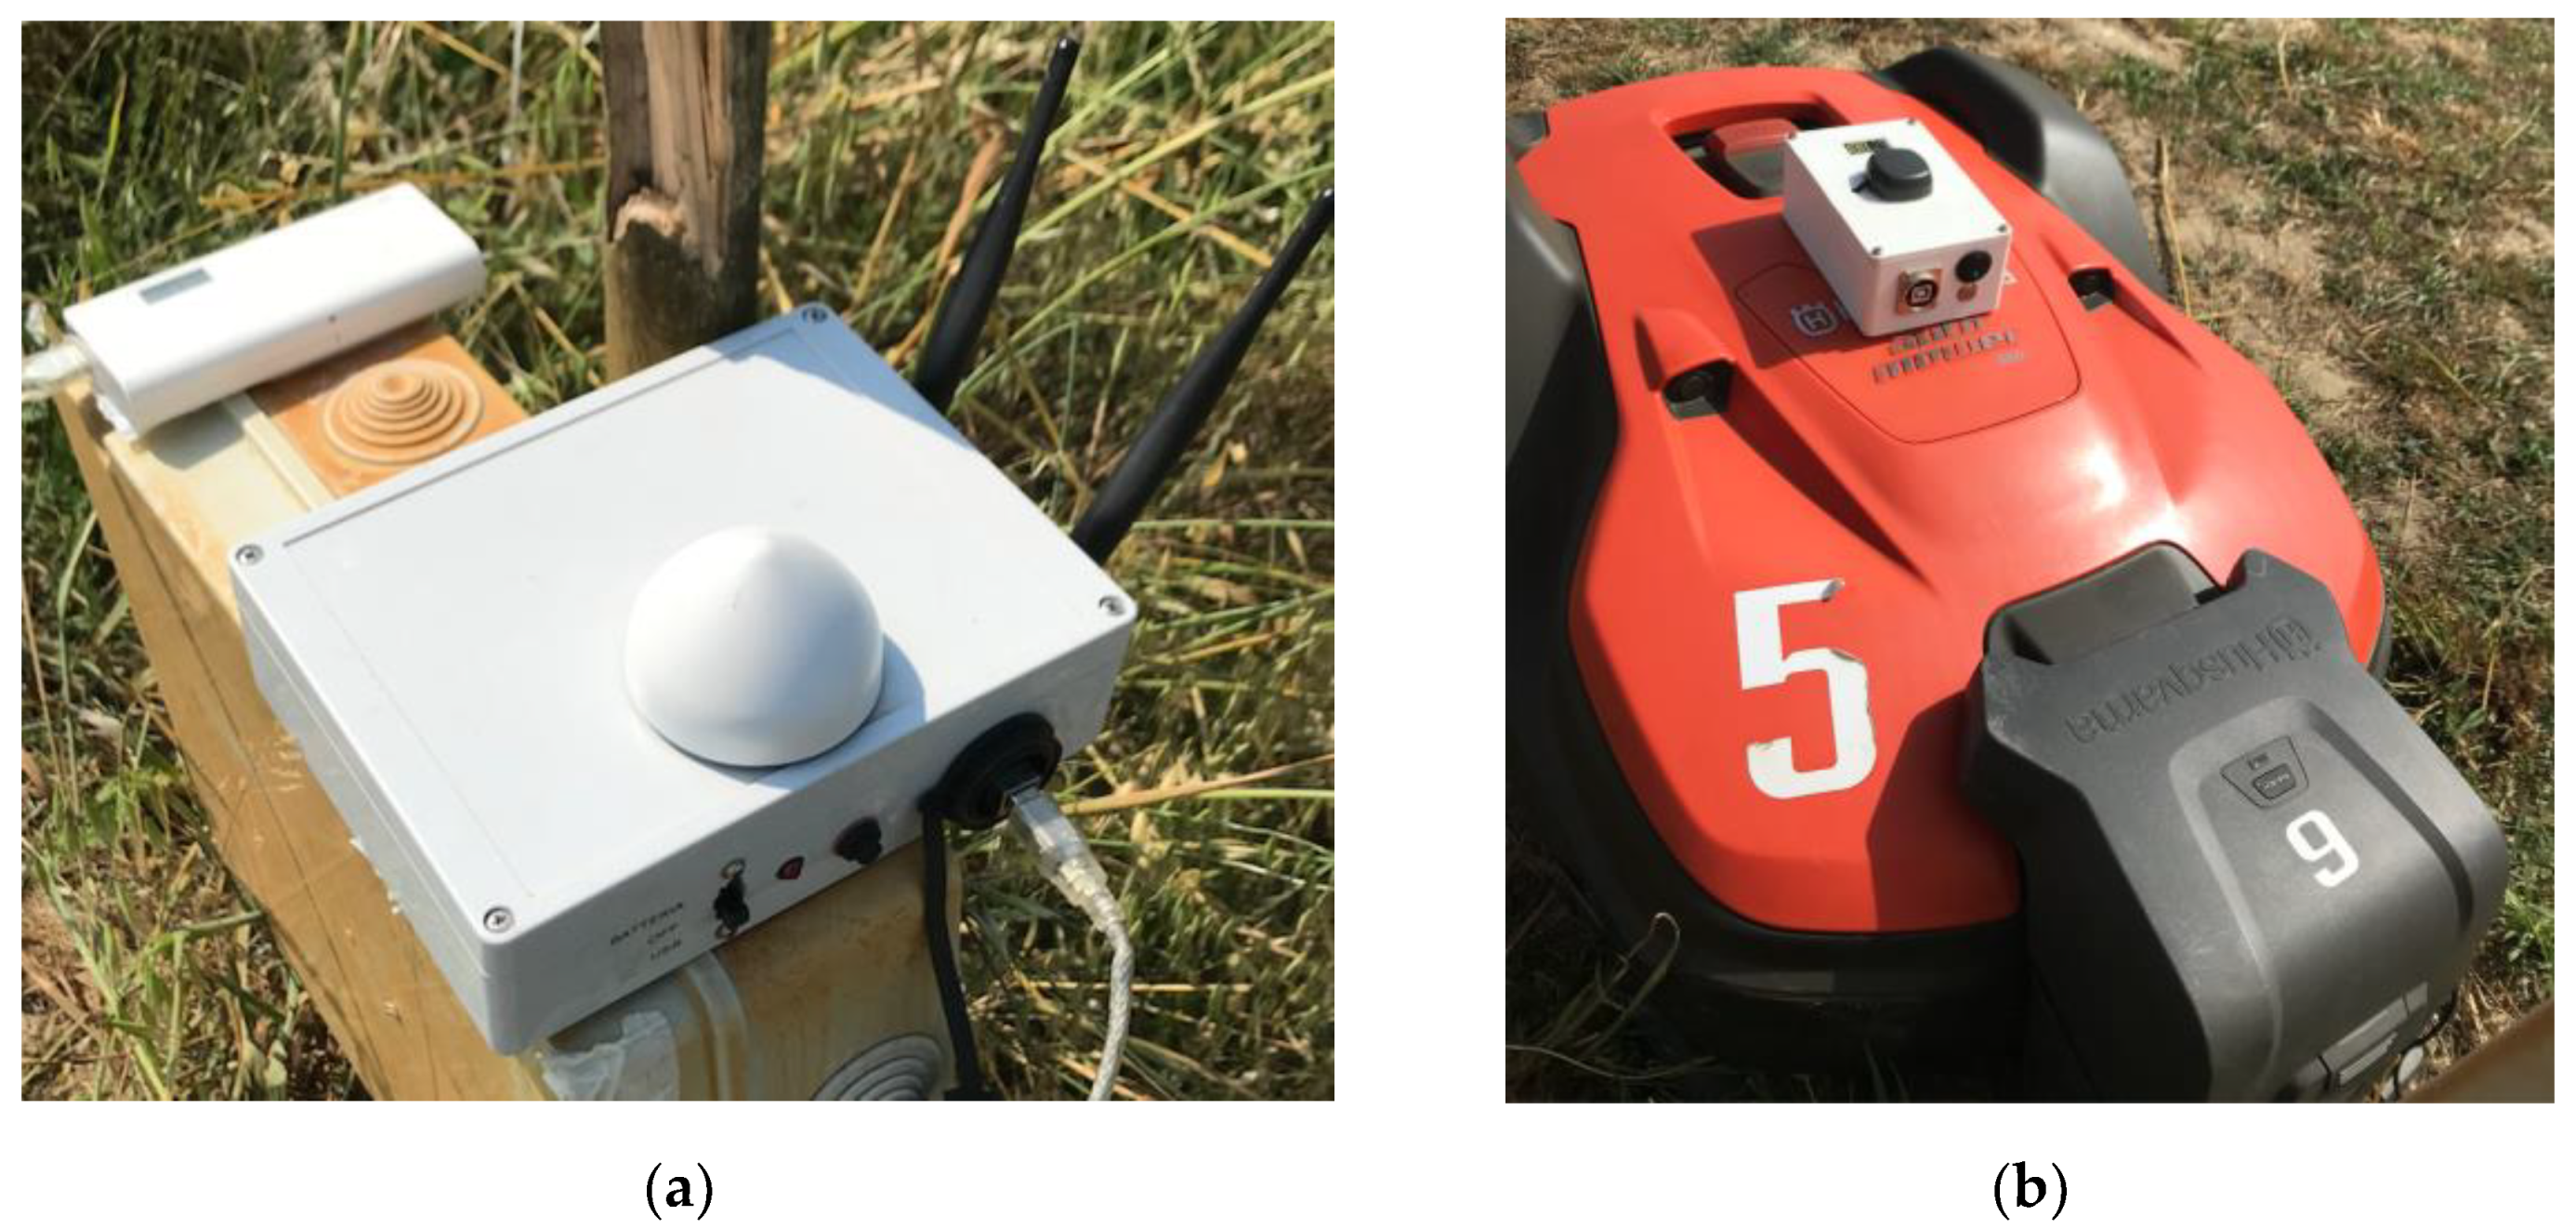
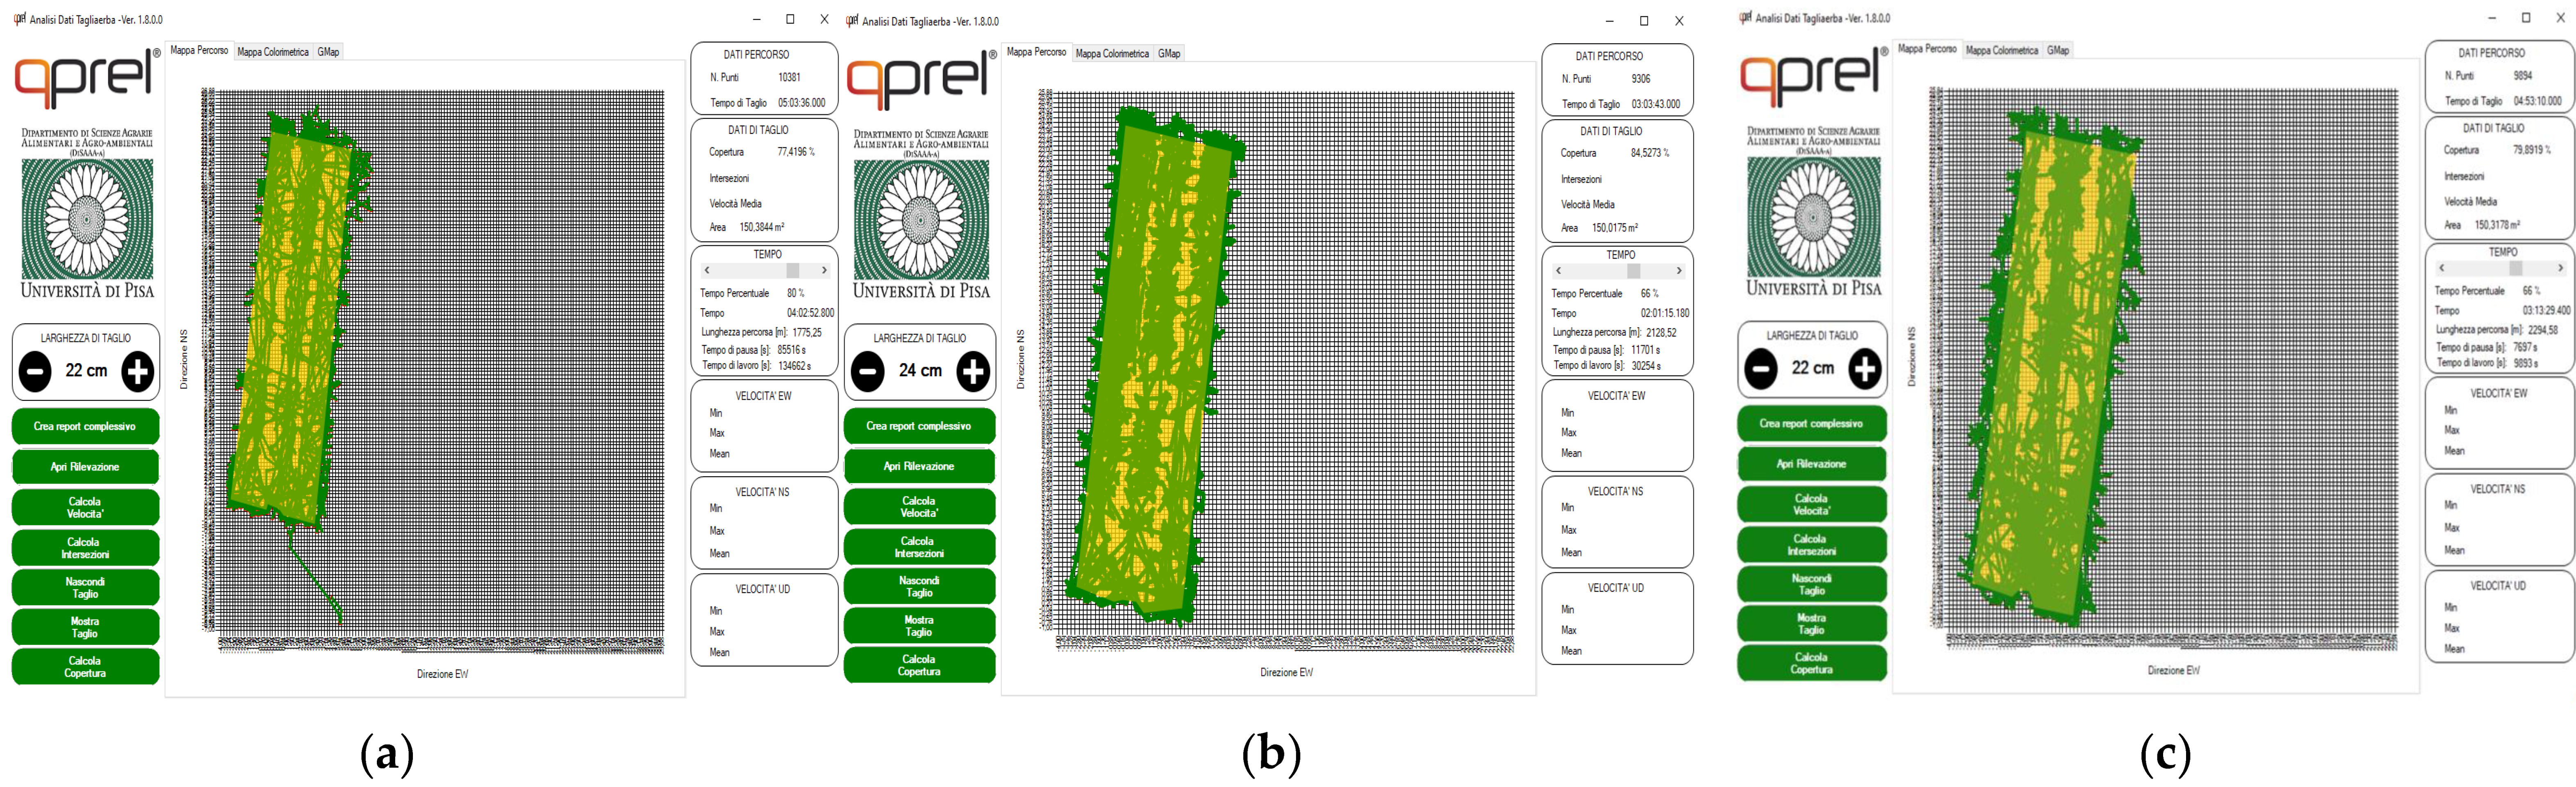
2.3. Data Collection

Autonomous mowers’ operational data were assessed with a remote sensing system, together with two software to extract, process and display data [39]. The remote sensing system consisted of two Emlid Reach RTK devices (Emlid Ltd., Hong Kong, China) [40]; the base station was placed near the autonomous mowers charging base (Figure 3a), while the rover was installed on the autonomous mowers (Figure 3b). After the positioning and time data acquired were downloaded from the Emlid Reach RTK devices, the RTKLIB software (T. Tokasu, Tokyo, Japan) [41] processed the data and created a .pos file. Subsequently, the .pos file of each survey was processed with a custom-built software called “Robot mower tracking data calculator” (Qprel®srl, Pistoia, Italy). This software can calculate the percentage of area mowed that was recorded every 15 min for a total time of 3 h of mowing (Figure 4) [26]. For AM1 and AM3 it was necessary to purge the charge times. Thirteen time periods for six replicates of the assessment for each autonomous mower were obtained for this parameter.
Weed cover percentage and average weed height were measured monthly for both types of weed management. Measurements were performed on 20 April, 19 May and 25 June 2021. The measurement of the weed cover percentage was obtained by processing digital images with the Canopeo app (Mathworks, Inc., Natick, MA, USA). The Canopeo app, by measuring the green cover percentage of the images, gives as a result the weed cover percentage. A Nikon Coolpix 7600 (Nikon corporation, Tokyo, Japan) was used to shoot the pictures within a square frame of 30 × 30 cm. After taking the picture, the average weed height was measured using a grass height meter within the same square frame. For both the weed cover percentage and the average weed height, six measures in the inter-row and six measures on the row were executed during each sampling for each weed management system. The above-ground weed biomass was detected monthly on 19 May and 25 June 2021. The measurement took place by cutting and collecting the live weed biomass present within the square frame of 30 × 30 cm. The biomass was then dried at 100 °C for 3–4 days (until weight was constant) and weighed. For this parameter, three surveys in the inter-rows and three on the crop rows were carried out during each sampling for both the weed management systems. Globe artichoke yield assessment was carried out on nine plants previously selected on studied areas. Yield was gradually assessed from April to May, when the artichoke heads reached the commercial characteristics (diameter of 7 cm). Globe artichoke heads were harvested and weighed, and the number and the fresh weight of heads produced for each individual plant were recorded. From these production data, the number and weight of artichoke heads produced per hectare with the two different weed management systems were calculated.
The primary energy consumption of the autonomous mowers and the walk-behind flail mower were estimated. The hourly gasoline consumption of the flail mower was calculated using the following Equation (1):
C h = W · d · C s
where Ch corresponds to the hourly consumption of the flail mower (kg of gasoline·h−1), W is the power of the engine (kW), d is the effort percentage of the flail mower engine, and Cs is the energetic efficiency of the flail mower engine (kg gasoline·kWh−1). The parameters W and Cs, as reported in the Honda engine GX200 manual, correspond to 4.3 kW and 0.35 kg·kWh−1, respectively [42], while d was assigned depending on the weed infestation level. The measurement of the primary energy consumption of the flail mower was carried out considering the gasoline heating value, that is 12.22 kWh·kg−1 [43]. The flail mower work schedule considered for the estimation consisted of a total of seven treatments carried out during the artichoke growing season.
Regarding the autonomous mowers, power consumptions of 0.025 kWh·h−1, 0.035 kWh·h−1 and 0.04 kWh·h−1 were assumed for AM1, AM2 and AM3, respectively [35,36,37]. For the estimation, a mowing area of 150 m2 and a percentage of area mowed of 80% was considered. The mowing time of each autonomous mower corresponds to the value obtained by the regression model for reaching the 80% of coverage of the area (see Section 2.4 Statistical Analysis). The 150 m2 area is considered to be mowed two days a week per 18 weeks a year (during the artichoke growing season). Considering that each autonomous mower works for its daily maximum active time, every day of the week, the mowable area per day and per week, and the energy consumption per week and per year were calculated. For each autonomous mower type, the annual energy consumption and the number of autonomous mowers needed for the management of one hectare per week were then estimated. Subsequently, the annual primary energy consumption per hectare of each autonomous mower type was calculated. In order to calculate the total primary energy consumption, the primary energy consumption of the charging bases with boundary wires was also calculated for each autonomous mower type. The power consumption of the charging bases with boundary wires was measured with a Primera-Line Wattage and current meter PM 231 E (Brennenstuhl®, Baar, Switzerland) and corresponded to 0.0059 kWh for AM3 and AM2, and to 0.0025 kWh for AM1. All the autonomous mowers tested were set in ECO mode, which means that the boundary wires consumed energy only during mowing. In accordance with the methodology followed by Pirchio et al. [44] for the estimation of the primary energy consumption of the autonomous mowers and the charging bases with the boundary wires, the efficiency of the Italian National Electric System equal to 0.562 [45], and the charging efficiency of Li-ion batteries that is 91% [46] were considered.
The costs of the selected autonomous mower and the flail mower weed management systems were estimated in relation to the management of 1 ha. For the two weed management systems the above-mentioned work-schedules described for the estimation of primary energy consumption were considered. Fixed costs (purchase cost and depreciation) and variable costs (gasoline consumption and labor for the flail mower, electric energy consumption for the autonomous mower and maintenance for both the machines) were estimated. Labor cost was EUR 25 h−1, gasoline and electric energy costs were EUR 1.38 L−1 and EUR 0.20 kWh−1, respectively. A machine life of 1500 h and 15,000 h were assumed for the flail mower and the autonomous mower respectively. It was considered that at end of their life both machines would not have a commercial value. For the autonomous mower weed management the cost of the installation of boundary wire (EUR 1.5 m−1) and the related depreciation were also considered. A boundary wire life of 10 years was assumed.

2.4. Statistical Analysis

Statistical software R was used for data analysis [47]. For the first trial, to evaluate the significance (p < 0.05) of different autonomous mowers on area mowed, the one-way Anova test was performed for the percentages of area mowed obtained every 30 min of mowing. Data were eventually square root transformed in order to fit normality assumption. After the Anova analysis, the post hoc LSD test at the 0.05 probability level was executed. The LSD post hoc test was provided by the package (“agricolae”). In order to fit the nonlinear regression model, plot graphs, estimate the parameters and determine the effective time values, the extension package “drc” (dose–response curve) [48] of R was used [39]. The non-linear function consisted of a two parameter asymptotic regression (2):
f x = d 1 e x p x e
The parameter d correspond to the upper limit (for x going to infinity), while the parameter e > 0 determines the steepness of the increase as x [49]. To compare the estimated values in pairs the following Equation (3) was used:
C I   d i f f e r e n c e = x 1 x 2 ± 1.96   S E x 1 2 + S E x 2 2
The parameter x1 is the mean of the first value, and x2 is the mean of the second one. SEx1 and SEx2 are the standard errors of x1 and x2, respectively. The values were compared by estimating the 95% confidence interval of the difference between the values. To refuse the null hypothesis that the compared values were not different, the confidence interval (CI) should not cross the value 0.
For the second trial, a three-way Anova was performed to evaluate the effect of the weed management systems, positions (inter row or on the row) and dates on weed cover percentage, average weeds height, and above-ground weed biomass. Data of “weed cover percentage” were eventually square root transformed in order to fit normality assumption. When the factor “dates” significantly affected one of the dependent variables, the post hoc LSD test at the 0.05 probability level was performed. The one-way Anova was performed to investigate the significance of the differences between the two weed management systems regarding the globe artichoke yield.

3. Results

3.1. Performances of the Three Autonomous Mowers

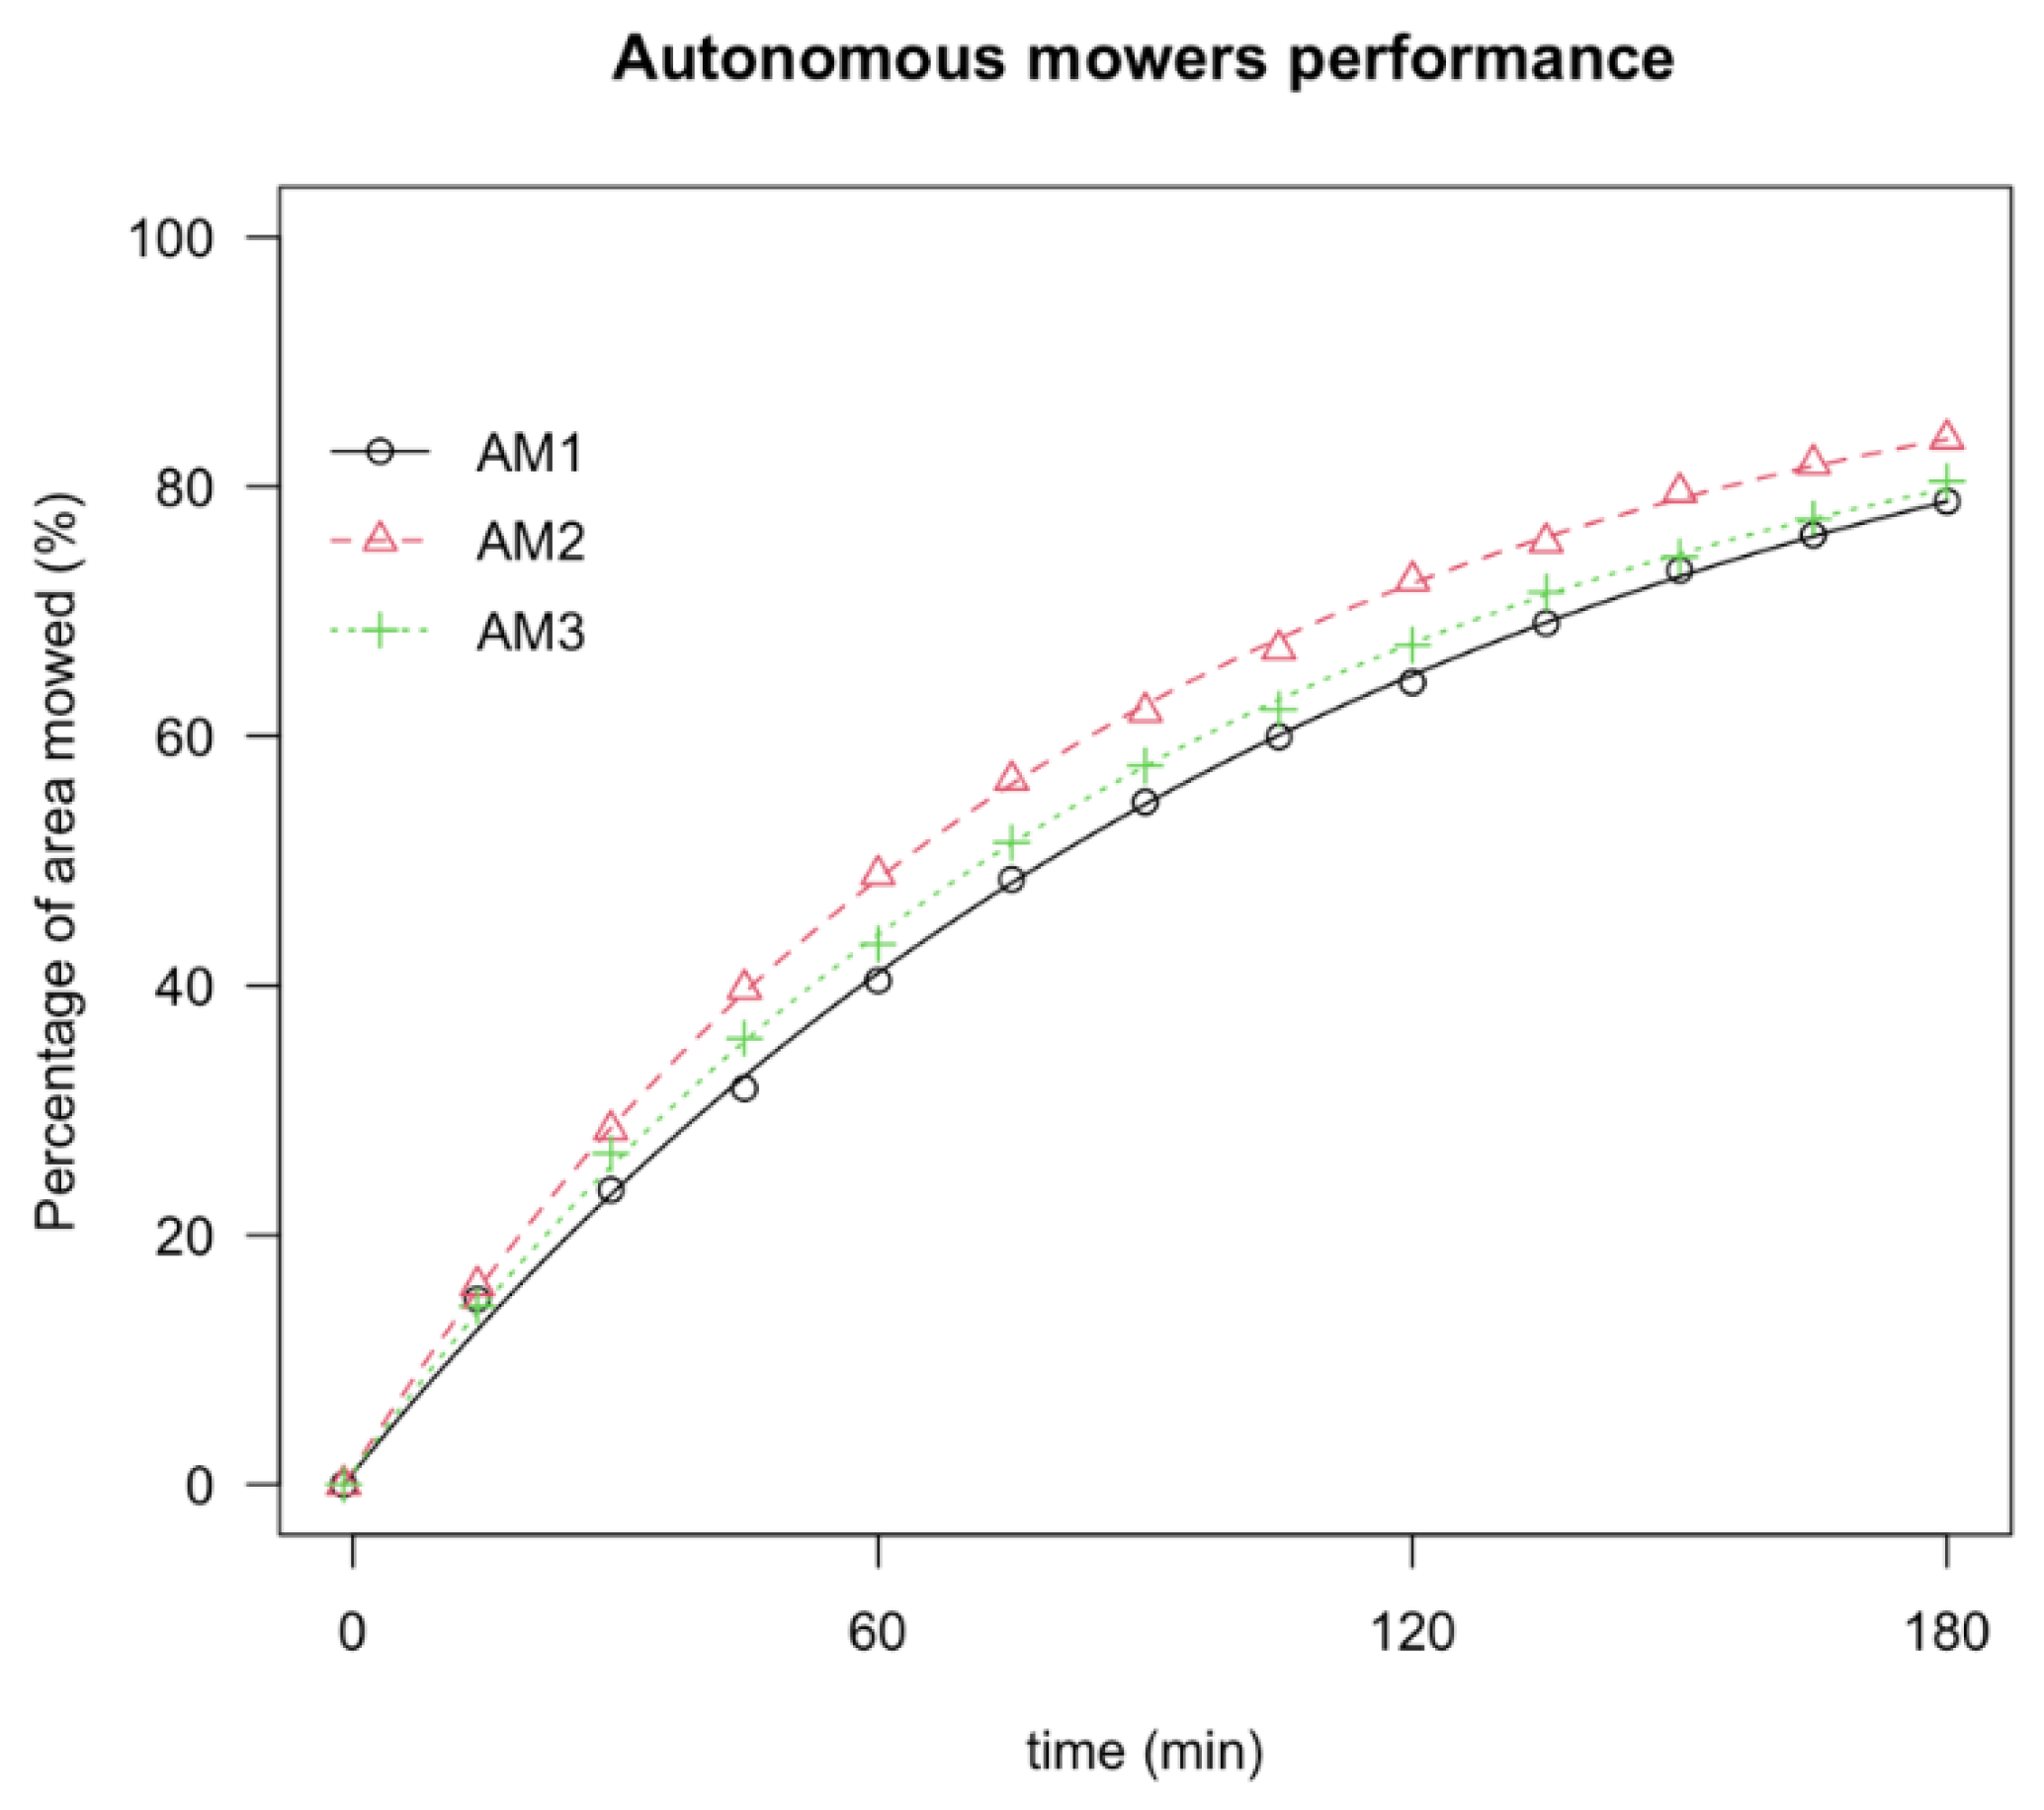
3.1.1. The Percentage of Area Mowed

The percentages of area mowed (back-transformed mean values) after 30, 60, 90, 120, 150 and 180 min of AM1, AM2 and AM3 are shown in Table 2.
The three autonomous mowers mowed more than 40% of the area after 60 min, showing no statistical differences between them. After 120 min, the autonomous mowers managed more than 60% of the area. For this lapse of time, the percentage of area mowed by AM2 was significantly higher (p < 0.05) than the one achieved by AM1, with an increase of 12.8%. After 180 min, the autonomous mowers managed more than 78% of the area, and the area mowed by AM1 was again significantly lower (p < 0.05) compared to that managed by AM2, with a decrease of 6.1%. The performance of AM3 was statistically similar to that of AM2 and AM1, after both 120 and 180 min of mowing.
In accordance with the lack-of-fit test (p = 1.0000), data recorded using the custom-built software fitted the asymptotic regression model. Figure 5 displays trends of the percentage of area mowed as function of time of the three autonomous mowers. The parameters of the non-linear asymptotic regressions and the effective times to mow 50% and 80% of the area estimated from the two-stage meta-analysis dose–response model are reported in Table 3.
The 50% of the area mowed was reached in a higher amount of time for AM1 compared to AM2 (95% confidence interval (CI) = 6.14–32.02) with a difference of 19.081 min. AM3 required a similar time as AM2 and AM1 (95% confidence interval (CI) = −2.97–18.12, and (CI) = −25.50–2.49, respectively). AM2 required less time than AM1 even for the mowing of 80% of the area (95% confidence interval (CI) = −74.36–−14.25), with a difference of 44.304 min. The time required by AM3 to mow 80% of the area was again similar to that required by AM1 and AM2 (95% confidence interval (CI) = −59.21–5.78, and (CI) = −6.9–42.08).

3.1.2. Energy Consumption of the Three Autonomous Mowers

The energy consumption estimations of the three autonomous mowers are shown in Table 4.
AM2 presented a higher mowable area per week than AM1 and AM3, with an increase of 168.94% and 20.21%, respectively. The lowest weekly energy consumption was estimated for AM1, followed by AM2, then AM3. To manage 1 ha per week 2.2 autonomous mowers of the AM2 type are required, while for AM3 and AM1 2.62 and 5.85 autonomous mowers are required, respectively. Table 4 shows that the total primary energy consumption per year (considering the management of 1 ha per week, for a total of 18 weeks) of AM2 is higher than that of AM1, but lower than that of AM3, with an increase of 11.89% and a decrease of 21.19%, respectively.
Based on these results, the AM2 was selected and used in the artichoke crop cycle for weed control. Details about the choice of the autonomous mower are reported in Section 4 (Discussion).

3.2. Comparison of the Two Weed Management Systems

3.2.1. Energy Consumption of the Flail Mower

The estimated energy consumption of the Orec HR531 walk-behind flail mower are shown in Table 5.
Comparing the total primary energy consumption of the selected autonomous mower (Table 4) with the flail mower consumption, it is possible to observe the higher consumption of the conventional weed management system with a difference of 704.63 kWh⋅ha−1⋅year−1.

3.2.2. Average Weeds Height, Weed Cover Percentage, Above-Ground Weed Biomass and Globe Artichoke Yield

The three-way Anova test revealed that the interactions between the three factors (weed management systems, positions, and dates) and the positions did not affect average weeds height, weed cover percentage and above-ground biomass. The weed management systems had a significant effect on average weed height (p < 0.01), weed cover percentage (p < 0.001), and above-ground weed biomass (p < 0.05). Dates affected only the weed cover percentage (p < 0.01). The one-way Anova highlighted that there were no significant differences between the autonomous mower and the conventional system, in terms of both the number and weight of heads per hectare. Results of both the three-way Anova and one-way Anova are reported on Table 6.
The autonomous mower weed management system showed a higher weed control effect compared to the conventional system. When plots were managed with the autonomous mower, the average weed height was lower than plots conventionally managed, with a difference of 10.23 cm. Weed cover percentage resulted higher in conventionally managed plots compared to plots managed with the autonomous mower, with an increase of 98.41%. Moreover, the above-ground weed biomass was lower in plots managed with autonomous mower compared to plots conventionally managed, with a decrease of 50.05%. Concerning the factor “dates”, in April the weed cover percentage (7.67%) was significantly lower than in May and June (p < 0.05), while in May and June the percentages were statistically similar with an average value of 17.31% (p < 0.05). Artichoke yield was similar in the two weed management systems, which resulted in an average number and weight of artichoke heads per hectare equal to 33,641.98 heads⋅ha −1 and 6.35 Mg⋅ha −1. Mean values of all the studied parameters for each weed management system are shown in Table 7.

3.2.3. Estimated Cost of the Two Weed Management Systems

The cost estimation of the two weed management systems is shown in Table 8. The comparison of the estimated annual cost of the two weed management systems highlights that the cost of the autonomous mower management is lower compared to the conventional system, with a saving of EUR 1059.96 ha−1·year−1. The parameter that mostly affected the annual cost of the conventional weed management system is the cost of labor required, which instead was not considered for the autonomous mower as it is an autonomous machine.

4. Discussion

The aim of this study was to evaluate the applicability of autonomous mowers with random trajectories for weed management in the globe artichoke crop. During the research, two trials were performed. In the first trial the performances of three different autonomous mowers were evaluated, with the aim of identifying the most suitable one for weed control in the crop. In the second trial, the autonomous mower weed management system was compared with a conventional weed management system based on the use of a walk-behind flail mower. Concerning the first trial, results showed that all three autonomous mowers were able to manage the experimental area. Despite differing in their main characteristics, all the autonomous mowers achieved coverage values around the target percentage of 80% after 180 min of mowing. Significant differences were revealed only between AM2 and AM1. AM2 covered a slightly higher percentage of area after 120 (72.42% vs. 64.19%) and 180 min of mowing (83.83% vs. 78.75%). This was probably due to the higher forward speed of AM2 compared to AM1 (0.65 vs. 0.38 m·s−1). No statistically significant differences emerged between AM2 and AM3, nor between AM3 and AM1. This latter result suggested that the smaller size of AM1 probably compensated for the slower forward speed compared to AM3 (0.38 vs. 0.61 m·s−1). Moreover, Sportelli et al. [26] found that smaller dimensions of an autonomous mower could facilitate the movement of the machine between obstacles, represented in this case by artichoke plants. A similar trend was observed for the estimated effective time to mow the 50 and 80% of the area. Significant differences emerged only between AM2 and AM1 according to which AM2 required less time than AM1 to mow the 50% and 80% of the area, with a difference of 19.081 and 44.304 min, respectively. The total primary energy consumption estimated in accordance with the chosen work schedule was lowest for AM1, and highest for AM3, while AM2 obtained an intermediate value. This parameter was significantly influenced by the power consumption during mowing of each autonomous mower type. However, AM1, due to the lower work capacity than the other two autonomous mowers, required the greater number of machines to comply with the work schedule. This involves a greater waste of time for the installation of charging bases and boundary wires of each autonomous mower, and for the machines management and maintenance. Based on the results obtained, AM2 was considered the best compromise among the three autonomous mowers tested for weed control in the artichoke field. Indeed, this machine proved to be a little more performing, and capable of reaching the target coverage of 80% in less time than AM1. The use of AM2 in artichoke crop cycle means that fewer machines are needed to comply with the chosen work schedule compared to the other autonomous mowers tested, which results in time saving. Furthermore, the total primary energy consumption is lower than AM3. Nevertheless, the test was conducted on a well-leveled and not sloping field. In a more challenging agricultural scenario, AM3, being equipped with four-wheel drive, may be more suitable [25].
Regarding the comparison between the two weed management systems, the higher average weed height in plots managed with flail mower was linked to its lower frequency of mowing. The autonomous mower, on the other hand, due to its higher mowing frequency was able to maintain a weed height close to the height of the cutting disc. During May and June, weeds showed a greater cover percentage than in April, as the abundant rainfall in the second decade of April together with the increase in temperatures favored weed growth in the following months. Autonomous mower weed management achieved the lower weed cover percentage. Probably, autonomous mowers’ high mowing frequency may have contributed to reduce weed seed production as reported by Sheley [50], limiting the spread of these. Furthermore, a lower above-ground biomass was found in plots managed by the autonomous mower, which usually results in less competition with the crop [51]. This finding may confirm the efficiency of this type of machines for weed control [25]. Moreover, despite the use of the autonomous mower involves a longer working time, the primary energy consumption was lower compared to the flail mower. According to Pirchio et al. [52], the lower energy consumption of the autonomous mower with respect to a gasoline mower could be linked to its low power required to perform mowing, also due to the tendency to cut only small clippings due to the higher mowing frequency. Overall, the efficiency of the battery powered autonomous mower is higher compared to the gasoline mower. Indeed, considering the efficiency of the brushless motor (90%), the charging efficiency of Li-ion batteries (91%), and the Italian National Electricity System (0.562), the overall efficiency of the autonomous mower is equivalent to 0.46, while that of a small gasoline engine ranges from 0.20 to 0.25 [53]. In addition, battery powered mowers are able to adjust the energy consumption depending on mowing load, in order to maintain the blade rpm constant. On the other hand, gasoline mowers usually work at full throttle, and this consequently can result in a partial waste of power [44]. This result suggested that the autonomous mower weed management system might be more sustainable than the considered conventional system. Furthermore, the second trial showed that there were no differences about the globe artichoke yield between the two systems. Usually, several years of study are required to evaluate the effects of a type of management on crop yield [31,54,55]. Nevertheless, it is possible to state that the autonomous mower, by not causing damage to the artichoke plants, did not negatively affect the crop yield during the study. Concerning costs, although the purchase cost of the autonomous mower AM2 was higher compared to the flail mower, the annual cost of the autonomous mower weed management was lower compared to the conventional weed management system (EUR 2601.84 vs. EUR 3661.80 ha−1·year−1). The higher annual cost of the conventional system was mainly due to the cost of the required labor. Despite the good results obtained by the autonomous mower management, for the mechanization of a professional farm, further research is necessary in order to develop specific machines designed for this purpose. To date, the implementation of machines with internet of things sensors, artificial intelligence algorithms, and the development of smart farming robots able to perform more agricultural operations is crucial for more efficient and sustainable farm management, and to meet the food needs of an expanding population [56,57,58]. However, autonomous mowers with random trajectories could represent a satisfactory solution for weed control in the increasingly promoted urban agriculture. Indeed, these contexts, considered crucial for a more sustainable urban development [59] and for agri-food sustainability [60], are often represented by small areas destinated for food production [61,62,63], which are better suited to the work capacity of these machines. In addition, the use of these autonomous mowers in urban agriculture could also provide a sustainable solution for weed management to address the growing concern about the environmental risks associated with this type of agriculture [62,64].

5. Conclusions

In the present study, the use of autonomous mower with random trajectories for weed management in globe artichoke showed encouraging results. All three autonomous mowers showed satisfactory performances, suggesting their suitability in a horticultural crop with a plant spacing as large as that of the globe artichoke considered in the research. The autonomous mower weed management resulted in an overall higher weed control, obtaining a lower average height, cover and biomass of weeds, compared to the conventional system. The primary energy consumption estimated for the autonomous mower weed management was lower than the conventional system consumption, with a difference of 704.63 kWh⋅ha−1⋅year−1. Furthermore, the comparison of the estimated annual cost of the two weed management systems highlighted that the autonomous mower management was cheaper compared to the conventional system, with a saving of EUR 1059.96 ha−1·year−1.
Such findings help to corroborate favorable results obtained by other authors regarding the possibility to employ autonomous mowers with random trajectories in an agricultural context [25,26]. Further studies would be useful to investigate the effects of these autonomous mowers’ weed management on weed biodiversity, to better understand the consequences of their use on the environment. Furthermore, another interesting future prospective for this technology could be the improvement of the autonomous mowers for working in a fleet with a RTK positioning system in order to remove the physical boundary wire and provide each machine with a working area and a specific working path. The interactions between the autonomous mowers and data sharing could lead to improve or modify the working areas and the working patterns according to more efficient weed management.

Author Contributions

Conceptualization, M.F. and C.F.; methodology, M.F., L.G., C.F. and M.S.; software, M.F. and L.G.; validation, M.F., M.S. and L.G.; formal analysis, M.F.; investigation, L.G.; resources, M.F.; data curation, M.F., C.F. and L.G.; writing—original draft preparation, L.G.; writing—review and editing, M.S., M.P., M.R. and A.P.; visualization, M.R.; supervision, M.F.; project administration, M.F. and M.R.; funding acquisition, M.R. and A.P. All authors have read and agreed to the published version of the manuscript.

Funding

This research received no external funding.

Acknowledgments

The authors would like to acknowledge the Husqvarna group for providing the three autonomous mowers and technical support; the Agriculture and Environmental Research Centre “Enrico Avanzi” for hosting the trials, and for the technical support.

Conflicts of Interest

The authors declare no conflict of interest.

References

  1. Marinoudi, V.; Sørensen, C.G.; Pearson, S.; Bochtis, D. Robotics and Labour in Agriculture. A Context Consideration. Biosyst. Eng. 2019, 184, 111–121. [Google Scholar] [CrossRef]
  2. Auat Cheein, F.A.; Carelli, R. Agricultural Robotics: Unmanned Robotic Service Units in Agricultural Tasks. IEEE Ind. Electron. Mag. 2013, 7, 48–58. [Google Scholar] [CrossRef]
  3. Eberhardt, M.; Vollrath, D. The Effect of Agricultural Technology on the Speed of Development. World Dev. 2018, 109, 483–496. [Google Scholar] [CrossRef]
  4. Vasconez, J.P.; Kantor, G.A.; Auat Cheein, F.A. Human–Robot Interaction in Agriculture: A Survey and Current Challenges. Biosyst. Eng. 2019, 179, 35–48. [Google Scholar] [CrossRef]
  5. Walker, D.; Kurth, T.; Wyck, J.V.; Tilney, M. Lessons from the Front Lines of the Agtech Revolution. Boston Consult. Group 2016, 4, 2020. [Google Scholar]
  6. Oberti, R.; Shapiro, A. Advances in Robotic Agriculture for Crops. Biosyst. Eng. 2016, 146, 1–2. [Google Scholar] [CrossRef]
  7. Spykman, O.; Gabriel, A.; Ptacek, M.; Gandorfer, M. Farmers’ Perspectives on Field Crop Robots—Evidence from Bavaria, Germany. Comput. Electron. Agric. 2021, 186, 106176. [Google Scholar] [CrossRef]
  8. Raja, R.; Nguyen, T.T.; Slaughter, D.C.; Fennimore, S.A. Real-Time Weed-Crop Classification and Localisation Technique for Robotic Weed Control in Lettuce. Biosyst. Eng. 2020, 192, 257–274. [Google Scholar] [CrossRef]
  9. Smith, R.; Klonsky, K.; De Moura, R. Sample Costs to Produce Iceberg Lettuce; University of California Cooperative Extension Publication: Davis, CA, USA, 2007. [Google Scholar]
  10. Dusky, J.A.; Stall, W.M. Weed Management Practices for Lettuce Production Using Imazethapyr. In Proceedings of the the 108th Florida State Horticultural Society, Lake Alfred, FL, USA, 22 October 1995; pp. 204–207. [Google Scholar]
  11. Bell, C.E. Broccoli (Brassica Oleracea Var. Botrytis) Yield Loss from Italian Ryegrass (Lolium Perenne) Interference. Weed Sci. 1995, 43, 117–120. [Google Scholar] [CrossRef]
  12. Mennan, H.; Jabran, K.; Zandstra, B.H.; Pala, F. Non-Chemical Weed Management in Vegetables by Using Cover Crops: A Review. Agronomy 2020, 10, 257. [Google Scholar] [CrossRef] [Green Version]
  13. Fennimore, S.A.; Cutulle, M. Robotic Weeders Can Improve Weed Control Options for Specialty Crops. Pest Manag. Sci. 2019, 75, 1767–1774. [Google Scholar] [CrossRef]
  14. Turini, T.; Stewart, D.; Murdock, J. Sample Costs to Produce Processing Tomatoes, Sub-Surface, Drip Irrigated (SDI), San Joaquin Valley South, Fresno County; UC Cooperative Extension-Agricultural Issues Center: Davis, CA, USA, 2018. [Google Scholar]
  15. Fennimore, S.A.; Slaughter, D.C.; Siemens, M.C.; Leon, R.G.; Saber, M.N. Technology for Automation of Weed Control in Specialty Crops. Weed Technol. 2016, 30, 823–837. [Google Scholar] [CrossRef]
  16. ROBOVATOR. Available online: Https://Www.Robovator.Com/ (accessed on 21 June 2021).
  17. Lati, R.N.; Siemens, M.C.; Rachuy, J.S.; Fennimore, S.A. Intrarow Weed Removal in Broccoli and Transplanted Lettuce with an Intelligent Cultivator. Weed Technol. 2016, 30, 655–663. [Google Scholar] [CrossRef]
  18. Su, W.-H.; Fennimore, S.A.; Slaughter, D.C. Development of a Systemic Crop Signalling System for Automated Real-Time Plant Care in Vegetable Crops. Biosyst. Eng. 2020, 193, 62–74. [Google Scholar] [CrossRef]
  19. Raja, R.; Slaughter, D.C.; Fennimore, S.A.; Nguyen, T.T.; Vuong, V.L.; Sinha, N.; Tourte, L.; Smith, R.F.; Siemens, M.C. Crop Signalling: A Novel Crop Recognition Technique for Robotic Weed Control. Biosyst. Eng. 2019, 187, 278–291. [Google Scholar] [CrossRef]
  20. Steward, B.L.; Gai, J.; Tang, L. The Use of Agricultural Robots in Weed Management and Control. In Robotics and Automation for Improving Agriculture; Billingsley, J., Ed.; Burleigh Dodds Science Publishing Limited: Cambridge, UK, 2019. [Google Scholar]
  21. Slaughter, D.C.; Chen, P.; Curley, R.G. Vision Guided Precision Cultivation. Precis. Agric. 1999, 1, 199–216. [Google Scholar] [CrossRef]
  22. Milioto, A.; Lottes, P.; Stachniss, C. Real-Time Semantic Segmentation of Crop and Weed for Precision Agriculture Robots Leveraging Background Knowledge in CNNs. In Proceedings of the 2018 IEEE International Conference on Robotics and Automation (ICRA), Brisbane, Australia, 21 May 2018; p. 7. [Google Scholar]
  23. Slaughter, D.C.; Giles, D.K.; Fennimore, S.A.; Nguyen, T.T.; Vuong, V.; Neilson, L.; Vannucci, B. Robotic Plant Care Systems and Methods: Google Patents. 2019. Available online: https://patents.google.com/patent/WO2017181127A1/en. (accessed on 22 June 2021).
  24. Magni, S.; Sportelli, M.; Grossi, N.; Volterrani, M.; Minelli, A.; Pirchio, M.; Fontanelli, M.; Frasconi, C.; Gaetani, M.; Martelloni, L.; et al. Autonomous Mowing and Turf-Type Bermudagrass as Innovations for An Environment-Friendly Floor Management of a Vineyard in Coastal Tuscany. Agriculture 2020, 10, 189. [Google Scholar] [CrossRef]
  25. Sportelli, M.; Frasconi, C.; Fontanelli, M.; Pirchio, M.; Raffaelli, M.; Magni, S.; Caturegli, L.; Volterrani, M.; Mainardi, M.; Peruzzi, A. Autonomous Mowing and Complete Floor Cover for Weed Control in Vineyards. Agronomy 2021, 11, 538. [Google Scholar] [CrossRef]
  26. Sportelli, M.; Pirchio, M.; Fontanelli, M.; Volterrani, M.; Frasconi, C.; Martelloni, L.; Caturegli, L.; Gaetani, M.; Grossi, N.; Magni, S.; et al. Autonomous Mowers Working in Narrow Spaces: A Possible Future Application in Agriculture? Agronomy 2020, 10, 553. [Google Scholar] [CrossRef] [Green Version]
  27. Sanchez, J.; Gallandt, E.R. Functionality and Efficacy of Franklin Robotics’ TertillTM Robotic Weeder. Weed Technol. 2021, 35, 166–170. [Google Scholar] [CrossRef]
  28. Bechar, A.; Vigneault, C. Agricultural Robots for Field Operations. Part 2: Operations and Systems. Biosyst. Eng. 2017, 153, 110–128. [Google Scholar] [CrossRef]
  29. Galceran, E.; Carreras, M. A Survey on Coverage Path Planning for Robotics. Robot. Auton. Syst. 2013, 61, 1258–1276. [Google Scholar] [CrossRef] [Green Version]
  30. Pergher; Gubiani; Mainardis Field Testing of a Biomass-Fueled Flamer for In-Row Weed Control in the Vineyard. Agriculture 2019, 9, 210. [CrossRef] [Green Version]
  31. Raffaelli, M.; Filippi, F.; Peruzzi, A.; Graifenberg, A. Flaming for Intra-Row Weed Control in Globe Artichoke. In Proceedings of the 6th EWRS Workshop on Physical and Cultural Weed Control, Lillehammer, Norway, 8 March 2004; p. 1. [Google Scholar]
  32. Lenzi, A.; Baldi, A.; Tesi, R. Artichoke (Cynara Scolymus L.) as Cash-Cover Crop in an Organic Vegetable System. Acta Agric. Slov. 2015, 105, 53–60. [Google Scholar] [CrossRef]
  33. FAO FAOSTAT. Statistical Database. Available online: https://www.fao.org/faostat/en/#home (accessed on 15 September 2021).
  34. Calabrese, N. Impianto. In Il Carciofo e il Cardo; Bayer Crop Science Inc., Script: Bologna, Italy, 2009; pp. 168–171. [Google Scholar]
  35. Husqvarna. Husqvarna Automower 310/315 Operator’s Manual; Husqvarna AB: Stockholm, Sweden, 2016. [Google Scholar]
  36. Husqvarna. Husqvarna Automower 520/550 Operator’s Manual; Husqvarna AB: Stockholm, Sweden, 2018. [Google Scholar]
  37. Husqvarna. Husqvarna Automower 535 AWD Operator’s Manual; Husqvarna AB: Stockholm, Sweden, 2019. [Google Scholar]
  38. Orec. Orec HR531 Operator’s Manual; Orec CO., LTD: Fukuoka, Japan, 2008. [Google Scholar]
  39. Martelloni, L.; Fontanelli, M.; Pieri, S.; Frasconi, C.; Caturegli, L.; Gaetani, M.; Grossi, N.; Magni, S.; Pirchio, M.; Raffaelli, M.; et al. Assessment of the Cutting Performance of a Robot Mower Using Custom Built Software. Agronomy 2019, 9, 230. [Google Scholar] [CrossRef] [Green Version]
  40. Emlid. A Reach RTK Docs. Specification. Available online: https://docs.emlid.com/reach/specs/ (accessed on 31 August 2021).
  41. Takasu, T. RTKLIB Ver. 2.4.2 Manual. Available online: http://www.rtklib.com/prog/manual_2.4.2.pdf (accessed on 31 August 2021).
  42. Honda GX200, Horizontal Shaft Gasoline (Petrol) Engine Manual. Available online: https://www.honda-engines-eu.com›TS_GX200 (accessed on 1 September 2021).
  43. Hoepli, Manuali Hoepli.It. 2019. Available online: https://www.manualihoepli.it/media/doc/pr243.pdf (accessed on 1 September 2021).
  44. Pirchio, M.; Fontanelli, M.; Labanca, F.; Sportelli, M.; Frasconi, C.; Martelloni, L.; Raffaelli, M.; Peruzzi, A.; Gaetani, M.; Magni, S.; et al. Energetic Aspects of Turfgrass Mowing: Comparison of Different Rotary Mowing Systems. Agriculture 2019, 9, 178. [Google Scholar] [CrossRef] [Green Version]
  45. ISPRA—Istituto Superiore per La Protezione e La Ricerca Ambientale. Rapporti 343/2021. Available online: https://www.isprambiente.gov.it/files2021/pubblicazioni/rapporti/r343-2021.pdf (accessed on 1 September 2021).
  46. Valøen, L.O.; Shoesmith, M.I. The Effect of PHEV and HEV Duty Cycles on Battery and Battery Pack Performance. In Proceedings of the The PHEV 2007 Conference: Where the Grid Meets the Road, Winnipeg, MB, Canada, 1–2 November 2007; p. 9. [Google Scholar]
  47. R Core Team. R: A Language and Environment for Statistical Computing; R Foundation for Statistical Computing: Vienna, Austria, 2021. [Google Scholar]
  48. Ritz, C.; Baty, F.; Streibig, J.C.; Gerhard, D. Dose-Response Analysis Using R. PLoS ONE 2015, 10, e0146021. [Google Scholar] [CrossRef] [Green Version]
  49. Ritz, C. Asymptotic Regression Model. In Analysis of Dose-Response Curves; Ritz, C., Strebig, J.C., The Comprehensive R Archive Network, Eds.; 2016; pp. 7–8. [Google Scholar]
  50. Sheley, R. Mowing to Manage Noxious Weeds. Ext. Serv. MontGuide 2017, MT200104AG. [Google Scholar]
  51. Adeux, G.; Vieren, E.; Carlesi, S.; Bàrberi, P.; Munier-Jolain, N.; Cordeau, S. Mitigating Crop Yield Losses through Weed Diversity. Nat. Sustain. 2019, 2, 1018–1026. [Google Scholar] [CrossRef]
  52. Pirchio, M.; Fontanelli, M.; Frasconi, C.; Martelloni, L.; Raffaelli, M.; Peruzzi, A.; Gaetani, M.; Magni, S.; Caturegli, L.; Volterrani, M.; et al. Autonomous Mower vs. Rotary Mower: Effects on Turf Quality and Weed Control in Tall Fescue Lawn. Agronomy 2018, 8, 15. [Google Scholar] [CrossRef] [Green Version]
  53. Grossi, N.; Fontanelli, M.; Garramone, E.; Peruzzi, A.; Raffaelli, M.; Pirchio, M.; Martelloni, L.; Frasconi, C.; Caturegli, L.; Gaetani, M.; et al. Autonomous Mower Saves Energy and Improves Quality of Tall Fescue Lawn. HortTechnology 2016, 26, 825–830. [Google Scholar] [CrossRef] [Green Version]
  54. Antichi, D.; Sbrana, M.; Martelloni, L.; Abou Chehade, L.; Fontanelli, M.; Raffaelli, M.; Mazzoncini, M.; Peruzzi, A.; Frasconi, C. Agronomic Performances of Organic Field Vegetables Managed with Conservation Agriculture Techniques: A Study from Central Italy. Agronomy 2019, 9, 810. [Google Scholar] [CrossRef] [Green Version]
  55. Campiglia, E.; Mancinelli, R.; Radicetti, E.; Caporali, F. Effect of Cover Crops and Mulches on Weed Control and Nitrogen Fertilization in Tomato (Lycopersicon Esculentum Mill.). Crop Prot. 2010, 29, 354–363. [Google Scholar] [CrossRef]
  56. Chand, A.A.; Prasad, K.A.; Mar, E.; Dakai, S.; Mamun, K.A.; Islam, F.R.; Mehta, U.; Kumar, N.M. Design and Analysis of Photovoltaic Powered Battery-Operated Computer Vision-Based Multi-Purpose Smart Farming Robot. Agronomy 2021, 11, 530. [Google Scholar] [CrossRef]
  57. Charania, I.; Li, X. Smart Farming: Agriculture’s Shift from a Labor Intensive to Technology Native Industry. Internet Things 2020, 9, 100142. [Google Scholar] [CrossRef]
  58. Saiz-Rubio, V.; Rovira-Más, F. From Smart Farming towards Agriculture 5.0: A Review on Crop Data Management. Agronomy 2020, 10, 207. [Google Scholar] [CrossRef] [Green Version]
  59. Zasada, I.; Weltin, M.; Zoll, F.; Benninger, S.L. Home Gardening Practice in Pune (India), the Role of Communities, Urban Environment and the Contribution to Urban Sustainability. Urban Ecosyst. 2020, 23, 403–417. [Google Scholar] [CrossRef]
  60. Caputo, P.; Zagarella, F.; Cusenza, M.A.; Mistretta, M.; Cellura, M. Energy-Environmental Assessment of the UIA-OpenAgri Case Study as Urban Regeneration Project through Agriculture. Sci. Total Environ. 2020, 729, 138819. [Google Scholar] [CrossRef]
  61. Orsini, F.; Pennisi, G.; Michelon, N.; Minelli, A.; Bazzocchi, G.; Sanyé-Mengual, E.; Gianquinto, G. Features and Functions of Multifunctional Urban Agriculture in the Global North: A Review. Front. Sustain. Food Syst. 2020, 4, 562513. [Google Scholar] [CrossRef]
  62. FAO. Urban and Peri-Urban Agriculture. FAO: Rome, Italy, 1999. [Google Scholar]
  63. Langemeyer, J.; Madrid-Lopez, C.; Mendoza Beltran, A.; Villalba Mendez, G. Urban Agriculture—A Necessary Pathway towards Urban Resilience and Global Sustainability? Landsc. Urban Plan. 2021, 210, 104055. [Google Scholar] [CrossRef]
  64. Tapia, C.; Randall, L.; Wang, S.; Aguiar Borges, L. Monitoring the Contribution of Urban Agriculture to Urban Sustainability: An Indicator-Based Framework. Sustain. Cities Soc. 2021, 74, 103130. [Google Scholar] [CrossRef]
Figure 1. Cumulative precipitations and maximum and minimum average temperatures recorded by the meteorological station in Bocca d’Arno (Pisa, Italy) (43°40′51.6″ N, 10°16′48.0″ E).
Applsci 11 11658 g001
Figure 2. The three autonomous mowers compared during the first trial: (a) AM1, (b) AM2 and (c) AM3.
Applsci 11 11658 g002
Figure 3. The Emlid Reach RTK devices: (a) the base station and (b) the rover installed on the autonomous mower AM2.
Applsci 11 11658 g003
Figure 4. Screens of the “Robot mower tracking data calculator” software displaying the mowed area after 3 h of work by (a) AM1, (b) AM2 and (c) AM3.
Applsci 11 11658 g004
Figure 5. Percentages of area mowed as function of time (min) on the fitted asymptotic regression curves of each autonomous mower.
Applsci 11 11658 g005
Table 1. Autonomous mowers’ main characteristics.
Autonomous Mowers
Automower® 310 (AM1)Automower® 550 (AM2)Automower® 535
(AM3) 1
Type of engine electricelectricelectric
Dimensions (lenght × height × width)cm63 × 25 × 5172 × 31 × 5693 × 29 × 55
Vehicle weightkg913.917.3
Number of driving wheels 224
Cutting widthcm222422
Working capacitym2⋅day−11000 ± 20%5000 ± 20%3500 ± 20%
Average mowing time on one rechargemin70270100
Average charging timemin606030
Blade motor speedrpm230023002475
Total power consumption during mowing 2W25 ± 20%35 ± 20%40 ± 20%
Max active time per day 3min⋅day−1108014401440
Standby time per daymin⋅day−136000
Forward speedm⋅s−10.380.650.61
1 To prevent AM3 from getting stuck among the artichoke plants, a customized cowling was applied on the autonomous mower. 2 Total power consumption during mowing is the sum of the consumption of three electric motors: two for the wheels and one for the cutting disc. 3 Max active time includes both the time of work and charge of the autonomous mower.
Table 2. Back-transformed mean values of the percentage of area mowed after 30, 60, 90, 120, 150 and 180 min by the three different autonomous mowers.
Percentage of Area Mowed (%)
Autonomous Mower Type
Mowing Time (min)AM1AM2AM3LSDp-Value
3023.27 28.33 26.15 ns
6040.18b48.84a43.06ab0.582.
9054.58b61.85a57.50ab0.466.
12064.19b72.42a64.39ab0.358*
15073.20b79.54a74.34ab0.307.
18078.75b83.83a80.41ab0.214*
* p < 0.05; . p < 0.1; ns, not significant. Means on the same line denoted by different letter differ significantly at p < 0.05 (LSD test).
Table 3. Parameters of the nonlinear asymptotic regressions (2) and effective mowing times of each autonomous mower estimated from the two-stage meta-analysis dose-response model.
Effective Time (min)
Autonomous MowerdeET50ET80
AM1 98.275(4.025)111.144(8.265)77.039(5.729)178.879(13.302)
AM2 94.808(2.504)83.616(4.739)57.958(3.285)134.575(7.627)
AM3 93.803(3.066)94.544(6.149)65.533(4.262)152.163(9.896)
d corresponds to the upper limit of the curve; e determines the steepness of the increase as time; ET50 is the time (min) to mow 50% of the area; ET80 is the time (min) to mow 80% of the area.
Table 4. Estimated energy consumption values for each type of autonomous mower according to the chosen work schedule.
Autonomous Mower Type
AM1AM2AM3
Unit Values
Effective mowing time per dayh9.7119.6418.47
Effective charging time per dayh8.294.365.53
Effective time for mowing 150 m2 1h2.982.242.54
Mowable area per day 2m2488.301313.221092.45
Mowable area per weekm21709.034596.283823.57
Weekly electric energy consumption during mowingkWh⋅week−11.704.815.17
Annually electric energy consumption during mowingkWh⋅year−130.5786.6093.09
Annually electric energy consumption considering the mowing of 1 ha per weekkWh⋅ha−1⋅year−1178.88188.41243.46
Number of autonomous mowers required to mow 1 ha per week 5.852.22.62
Primary energy consumption of the autonomous mowers per yearkWh⋅ha−1⋅year−1349.77368.40476.05
Electric energy consumption of the charging base with the boundary wire per weekkWh·week−10.170.810.76
Electric energy consumption of the charging base with the boundary wire per yearkWh·year−13.0614.6013.73
Electric energy consumption of the charging bases with the boundary wires of all necessary autonomous mowers to mow 1 hakWh⋅ha−1·year−117.8931.7635.91
Primary energy consumption of the charging bases with the boundary wires per yearkWh⋅ha−1⋅year−134.9862.1070.22
Total primary energy consumption per year 3kWh⋅ha−1⋅year−1384.75430.50546.27
1 The aim is to mow 80% of the area. 2 Considering each autonomous mower works for its daily maximum active time, every day of the week. 3 The total primary energy consumption includes the primary energy consumption of both the battery charging of the autonomous mowers and the boundary wires.
Table 5. Estimated energy consumption of the flail mower.
Flail Mower
UnitValues
Hourly gasoline consumptionkg⋅h−10.75
Estimated work capacitym2⋅h−1567.06
Hourly Energy requirementkWh⋅h−19.20
Time needed to mow 1 hah17.63
Number of treatments per year per hectare 7
Total mowing time per yearh123.44
Primary energy consumption per yearkWh⋅ha−1⋅year−11135.13
Table 6. Results of three-way Anova testing the effect of weed management systems, positions and dates on average weeds height, weed cover percentage and above-ground weed biomass, and results of one-way Anova testing the effect of weed management systems on artichoke yield parameters.
Average Weeds HeightWeed Cover PercentageAbove-Ground Weed BiomassNumber of Artichoke Heads per HectareWeight of Artichoke Heads per Hectare
Pr(>F)Pr(>F)Pr(>F)Pr(>F)Pr(>F)
Factors
Weed management systems0.0064 **0.0007 ***0.0402 *nsns
Positionsnsns0.0593
Datesns0.0015 **ns
No significant interactions were observed. *** p < 0.001; ** p < 0.01; * p < 0.05; . p < 0.1; ns, not significant.
Table 7. Mean values of average weeds height, weed cover percentage, above-ground weed biomass, number and weight of artichoke heads per hectare for both the weed management systems.
Average Weeds HeightWeed Cover PercentageAbove-Ground Weed BiomassNumber of Artichoke Heads per HectareWeight of Artichoke Heads per Hectare
Weed management systems(cm)(%)(g d.m.⋅m−2)n⋅ha−1Mg⋅ha−1
Autonomous mower weed management system3.409.4171.7632,098.776.58
Conventional weed management system13.6318.67143.6735,185.196.12
Table 8. Cost estimation of the two weed management systems.
Flail Mower
UnitValues
Purchase costEUR€3280.00
Depreciation of purchase costEUR⋅ha−1⋅year−1269.92
Maintenance costEUR1640.00
Depreciation of maintenence costEUR⋅ha−1⋅year−1134.96
Labor costEUR⋅ha−1⋅year−13086.00
Gasoline costEUR⋅ha−1⋅year−1170.91
Total annual costEUR⋅ha−1⋅year−13661.80
Autonomous Mower (AM2)
Purchase cost 1EUR5190.00
Depreciation of purchase cost 1EUR⋅year−1856.23
Maintenance cost 1EUR1557.00
Depreciation of maintenence cost 1EUR⋅year−1256.87
Electric energy cost 1 EUR⋅year−117.13
Cost of an autonomous mowerEUR⋅year−11130.22
Cost of all the autonomous mowers needed 2EUR⋅ha−1⋅year−12486.49
Cost of the boundary wire installation 3EUR⋅ha−11089.99
Depreciation of boundary wire installationEUR⋅ha−1⋅year−1109.00
Electric energy cost of charging bases with boundary wiresEUR⋅ha−1⋅year−16.35
Total annual costEUR⋅ha−1⋅year−12601.84
1 Parameters and values refer to a single autonomous mower AM2. 2 Including all the autonomous mowers needed for the management of 1 ha per week. 3 Considering the amount of boundary wire required for the management of 1 ha.
Publisher’s Note: MDPI stays neutral with regard to jurisdictional claims in published maps and institutional affiliations.

