1. Introduction
The advance of the digitalization of teaching in recent years has promoted the implementation of digital content creation (DCC) tools in the classroom in order to optimize the results of the teaching–learning process from a holistic approach that allows the inclusion of knowledge and the development of student competencies [
1].
This progress has become more evident in the last academic year as a result of the situation generated by COVID-19. According to an open consultation of the European Union, almost 60% of European teachers had not used online learning before the health crisis and the same percentage considered that they had improved their digital skills during this time, which means a high self-concept about their own teaching evolution [
2]. In the aforementioned questionnaire, respondents reflected the need to provide more relevant, interactive, and user-friendly digital teaching resources and content, and 95% of teachers considered the pandemic to be a turning point in the use of DCC. This allows us to affirm that, although there has been progress in the digitization of teaching, this process still requires measures that enhance the development of teachers’ digital competence and the implementation of tools that really optimize results in the classroom [
3].
Thus, the situation generated by the global pandemic has introduced a process of reflection on the educational system, in order to achieve the creation of high-performance digital ecosystems accessible to all. These objectives are at the foundation of international programs of global reflection on the future of education, such as the European Union’s Agenda 2030 [
2,
4,
5].
In the context of university education, teachers are expected to evolve rapidly in the technological world, as higher education institutions play a crucial role in developing the digital competence of tomorrow’s professionally active citizens [
6]. However, the effectiveness of this development can only be assessed by evaluating the teachers’ perception of the use of DCC tools and the teaching results obtained in the classroom on concrete actions [
7,
8,
9]. In this area, it has been found that the positive perception of the use of DCC tools in the classroom by teachers does not always coincide with the real capacity of teachers to adapt their programs to the virtual classroom with digital resources [
10,
11]. This deficit in the development of digital competence seems to be greater when we refer to the creation of digital content [
12,
13]. However, the use of these types of resources is recognized as one of the most effective strategies of connection between teacher and student for the meaningful transmission of content, attitudes, and procedures, especially when they are designed from and for the specific needs of the students [
14].
At the base of this imbalance, the development of self-efficacy in the use of DCC tools by teachers is revealed as a key to overcome these difficulties [
15]. So is the development of the competencies that teachers should acquire for their adaptability to be effective, such as soft skills [
16] or professional digital competence [
17,
18]. With respect to all these dimensions, there are factors that limit the process of digitalization of the teaching activity, such as the high cost that some authors attribute to its implementation. This causes difficulties in accessing digital materials, especially for certain sectors of the student body, in some geographical areas that suffer from high levels of social inequality, such as Latin America [
19,
20]. The specialized literature also recognizes that there are certain characteristics of university teachers that influence the development of their digital competencies. Among these characteristics, the most common are gender and experience. The results show that, in general, males use advanced training materials more assiduously in the classroom and are more prepared for their use [
21,
22].
Thus, the objective of the present research is to analyze the relationship between the perception of university teachers on the use of DCC tools and their actual implementation in the classroom as a teaching strategy to optimize the results of e-learning training actions both in the teaching process and in the evaluation of acquired competencies. The target population in which these aspects will be discussed is a group of Latin American university teachers. This geographical area is, on the one hand, particularly sensitive to social inequality, which could influence the teachers’ perception of the didactic use of digital materials. On the other hand, it is an area where important efforts are being made to integrate digital resources in the classroom [
23,
24]. Likewise, in order to deepen the perception of university teachers about their digital teaching competence, the perception about their skills will be distinguished from the opinion about the educational effectiveness of digital resources. All this will be carried out by differentiating the teachers participating in the study by gender, in order to explore the existence of gaps with respect to the analyzed dimensions of digital teaching competence.
Specifically, this article analyzes the self-concept that Latin American university teachers participating in the study have about their competence in the use of DCC tools and their influence on the development of teaching–learning activities in the classroom. This analysis takes into account the age, teaching experience, area of knowledge, and academic level of the participants, and identifies gender gaps in the opinions expressed within each value of the above variables. In this sense, although the literature collects works that analyze the opinion of teachers on the use of DCC tools [
14,
18], usually the context is not the university setting. Regarding the geographical location of the study participants, there are studies that address the use of DCC tools and ICT with didactic applications in Latin America [
19,
20], although none of them explore the perspective of university teachers. Finally, the identification of gender gaps in the opinion of university teachers is a new topic in the specialized literature, only addressed, to our knowledge, in [
16]. However, in this work, the object of interest is specified to be the use of DCC tools, and the geographical horizon and the academic and sociological profile of the participants are expanded with respect to [
16]. Consequently, this study introduces a new perspective in the line of work in which it is framed.
2. Materials and Methods
This study is quantitative research based on the answers of a group of Latin American university teachers to a self-designed questionnaire (
Table A1) about their perception of the use of DCC tools in higher education. The main objective was to analyze the evaluation of a group of Latin American university teachers on the didactic use of advanced training materials in the classroom and to identify gender gaps in these evaluations. For this purpose, a questionnaire was used, which was sent by telematic means to the participants. The sample consisted of 564 university teachers working in universities in different Latin American countries (Argentina, Bolivia, Chile, Colombia, Costa Rica, Cuba, Ecuador, El Salvador, Honduras, Mexico, Panama, Paraguay, Peru, Dominican Republic, Uruguay, and Venezuela). These teachers were selected by a process of purposive convenience sampling after several training courses on digital content for university teachers. The participants who attended such sessions were contacted via Google Forms
TM and responded to the survey voluntarily, freely, and anonymously. All the university teachers completed the questionnaire and all the surveys obtained were valid. The sociological and academic profile of the participants was elaborated through the independent variables indicated in
Table 1.
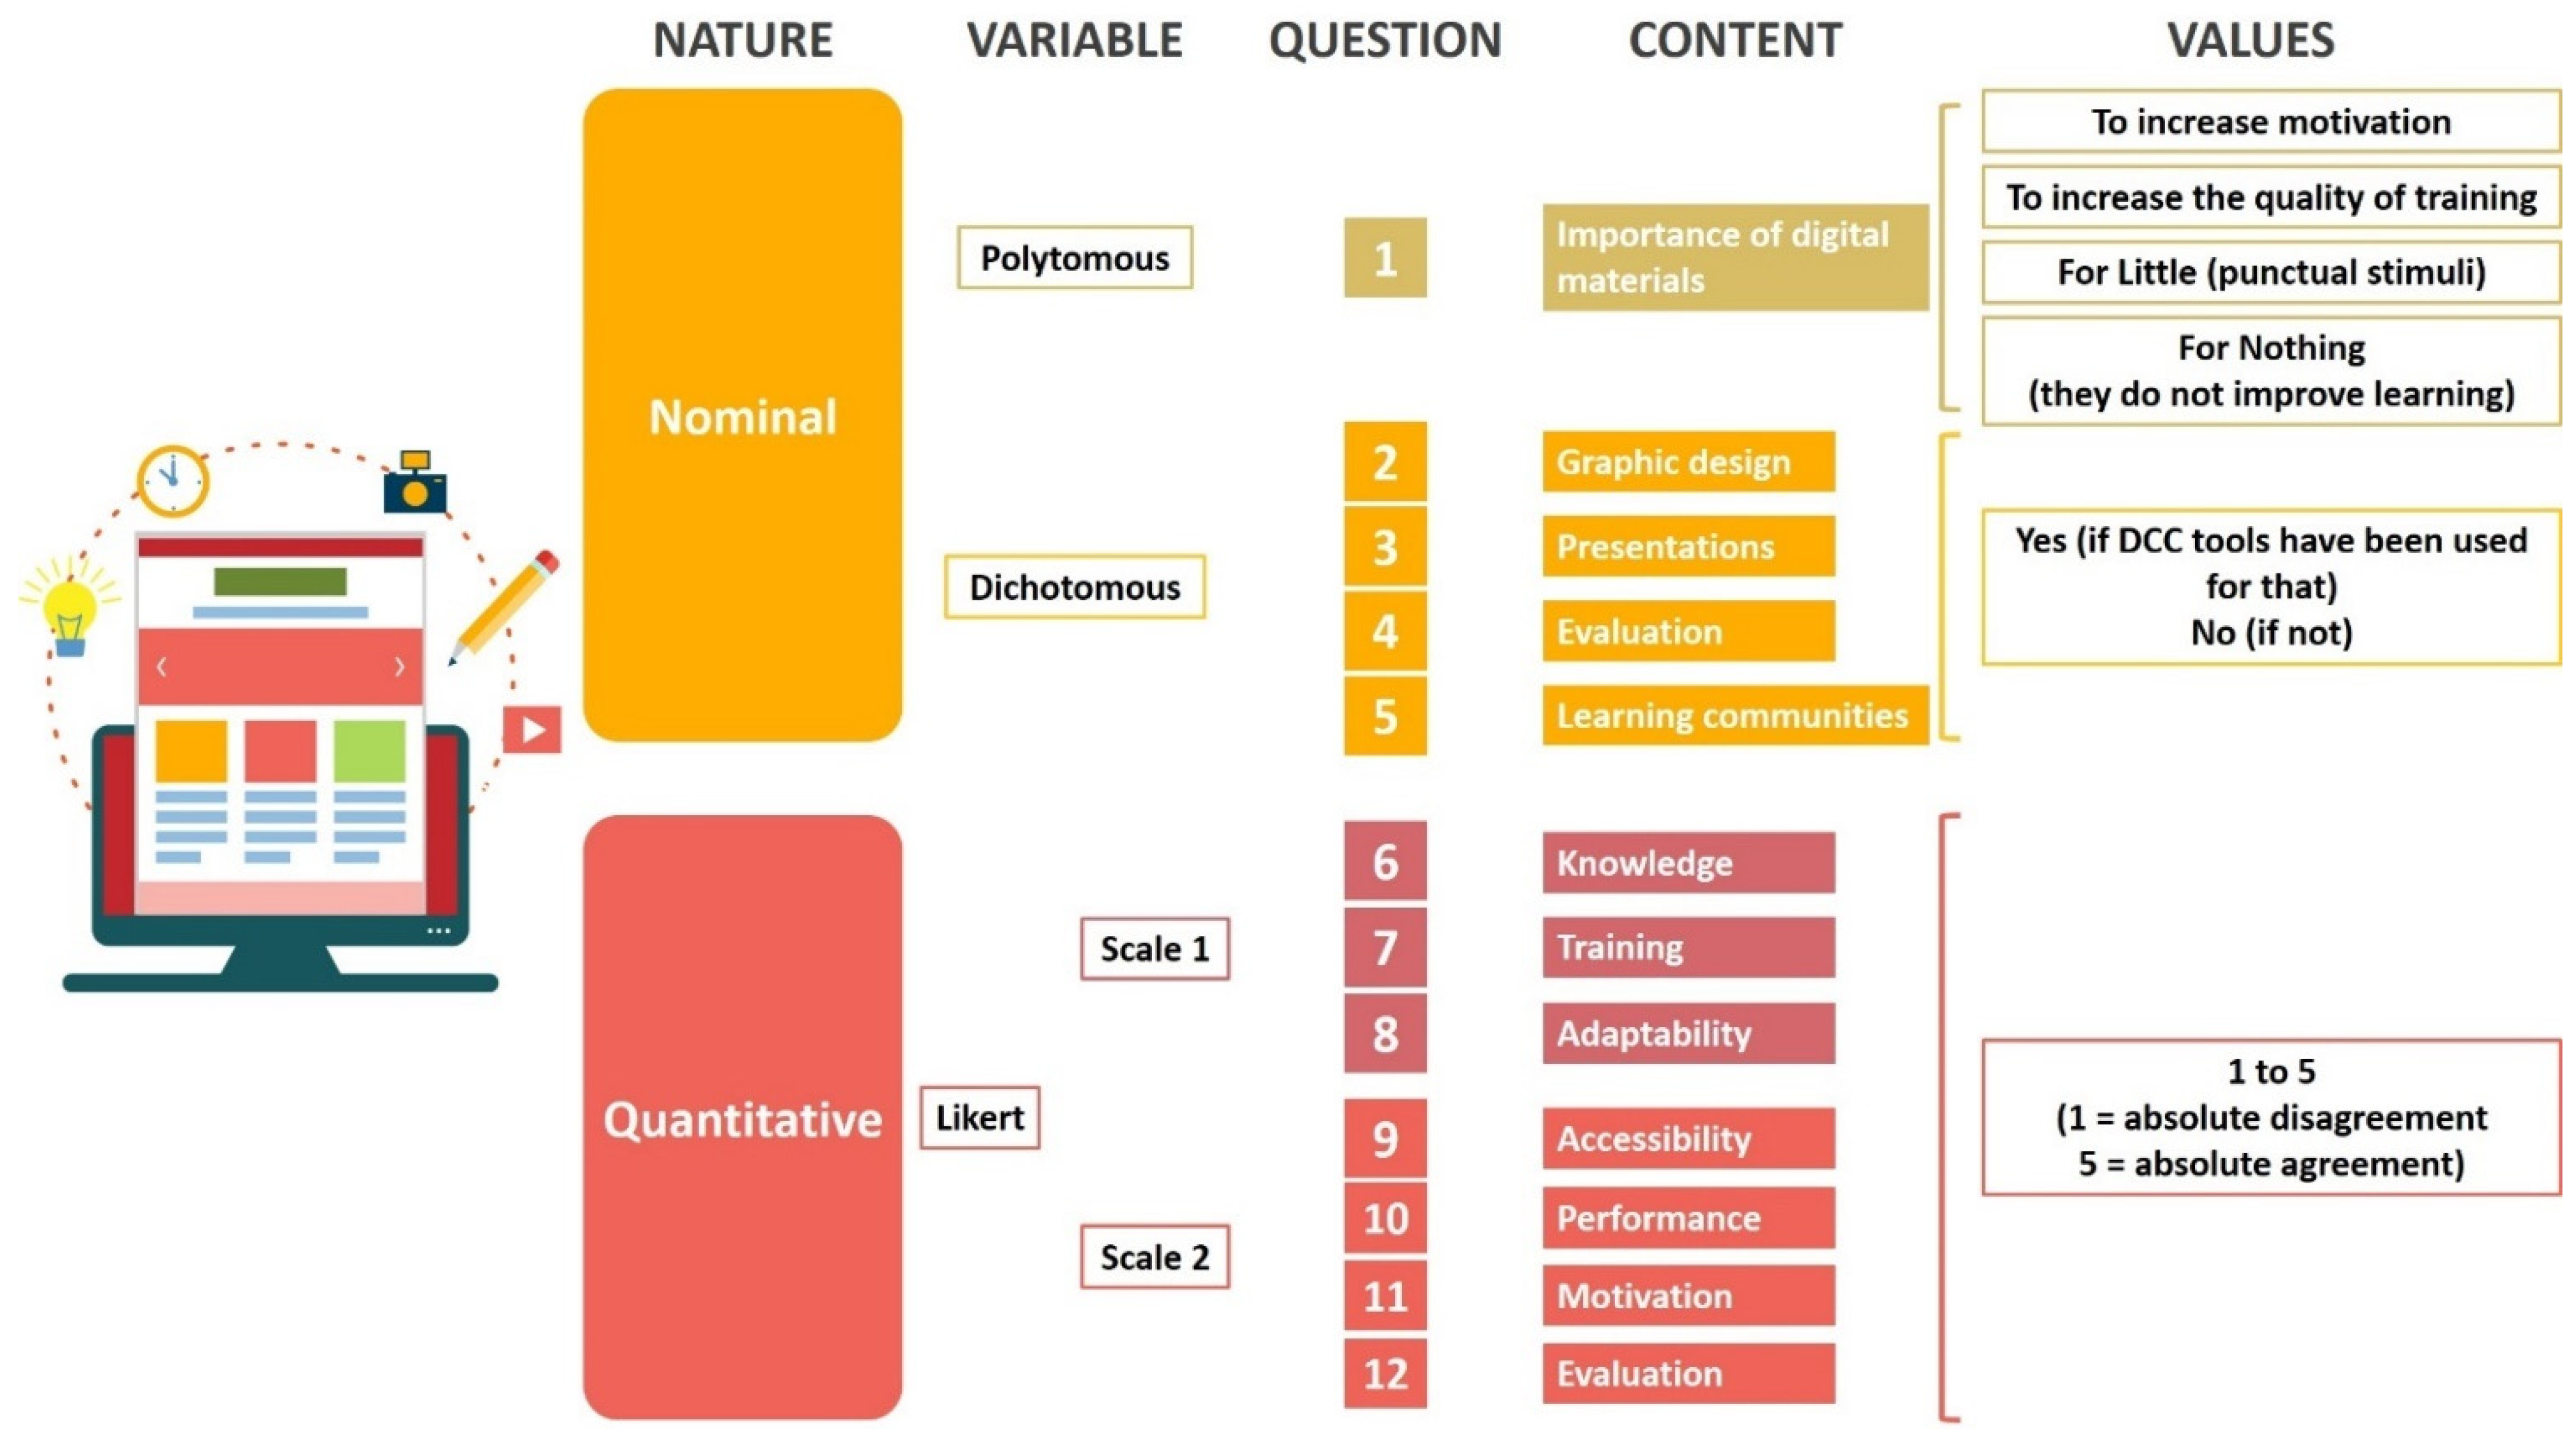
A scheme of the aspects considered to carry out this research work is shown in
Figure 1. Thus, the survey was composed of 12 questions, which are explained as follows. There was one polytomous question, on the importance of the use of digital materials, and four dichotomous questions, on whether the respondent uses digital resources in different dimensions of teaching. In the case of an affirmative answer, the respondent was asked to provide the tool he/she uses most frequently in this regard.
The five questions above assess the five nominal dependent variables of the questionnaire. Next, there were seven Likert-type questions, divided into two scales, which assess, respectively, the skills with the use of DCC tools and the expected training effectiveness for those resources (
Table 2). The first scale, which we will call Teacher skills, assesses the perception that the teachers surveyed have of the following dependent variables: (i) their knowledge of digital tools, (ii) the training they have received, and (iii) their ability to adapt to these types of materials for use in learning environments. The second scale, called Educational effectiveness, measures the teachers’ perception of the impact of the use of digital materials on the teaching–learning process and on the progress of the subjects. Specifically, it is measured through the following dependent variables: (i) accessibility by students, (ii) performance, (iii) motivation generated in students, and (iv) usability to carry out evaluation processes. These scales have been validated for internal consistency through Cronbach’s alpha parameter, whose values are shown in
Table 2. As can be seen, the parameters exceed 0.7, which shows that the instrument enjoys good internal consistency. The validation of the Likert-type scales has also been carried out through Pearson correlations (
Table 3), which show a moderate correlation between the two scales but a high correlation of each of them with respect to the global scale.
The analysis combines a descriptive and an inferential part. The first is based on the analysis of frequencies and Cramer’s V statistics (for nominal variables) and means, standard deviations, and Spearman’s r coefficients (for quantitative variables). The second is applied to Likert scales and makes use of (i) Student’s t-tests and multifactor ANOVA (hereafter, MANOVA) for the comparison of means and (ii) Levene’s and Bartlett’s tests for the comparison of deviations. All tests were performed at the 0.05 significance level.
3. Results
3.1. Nominal Variables
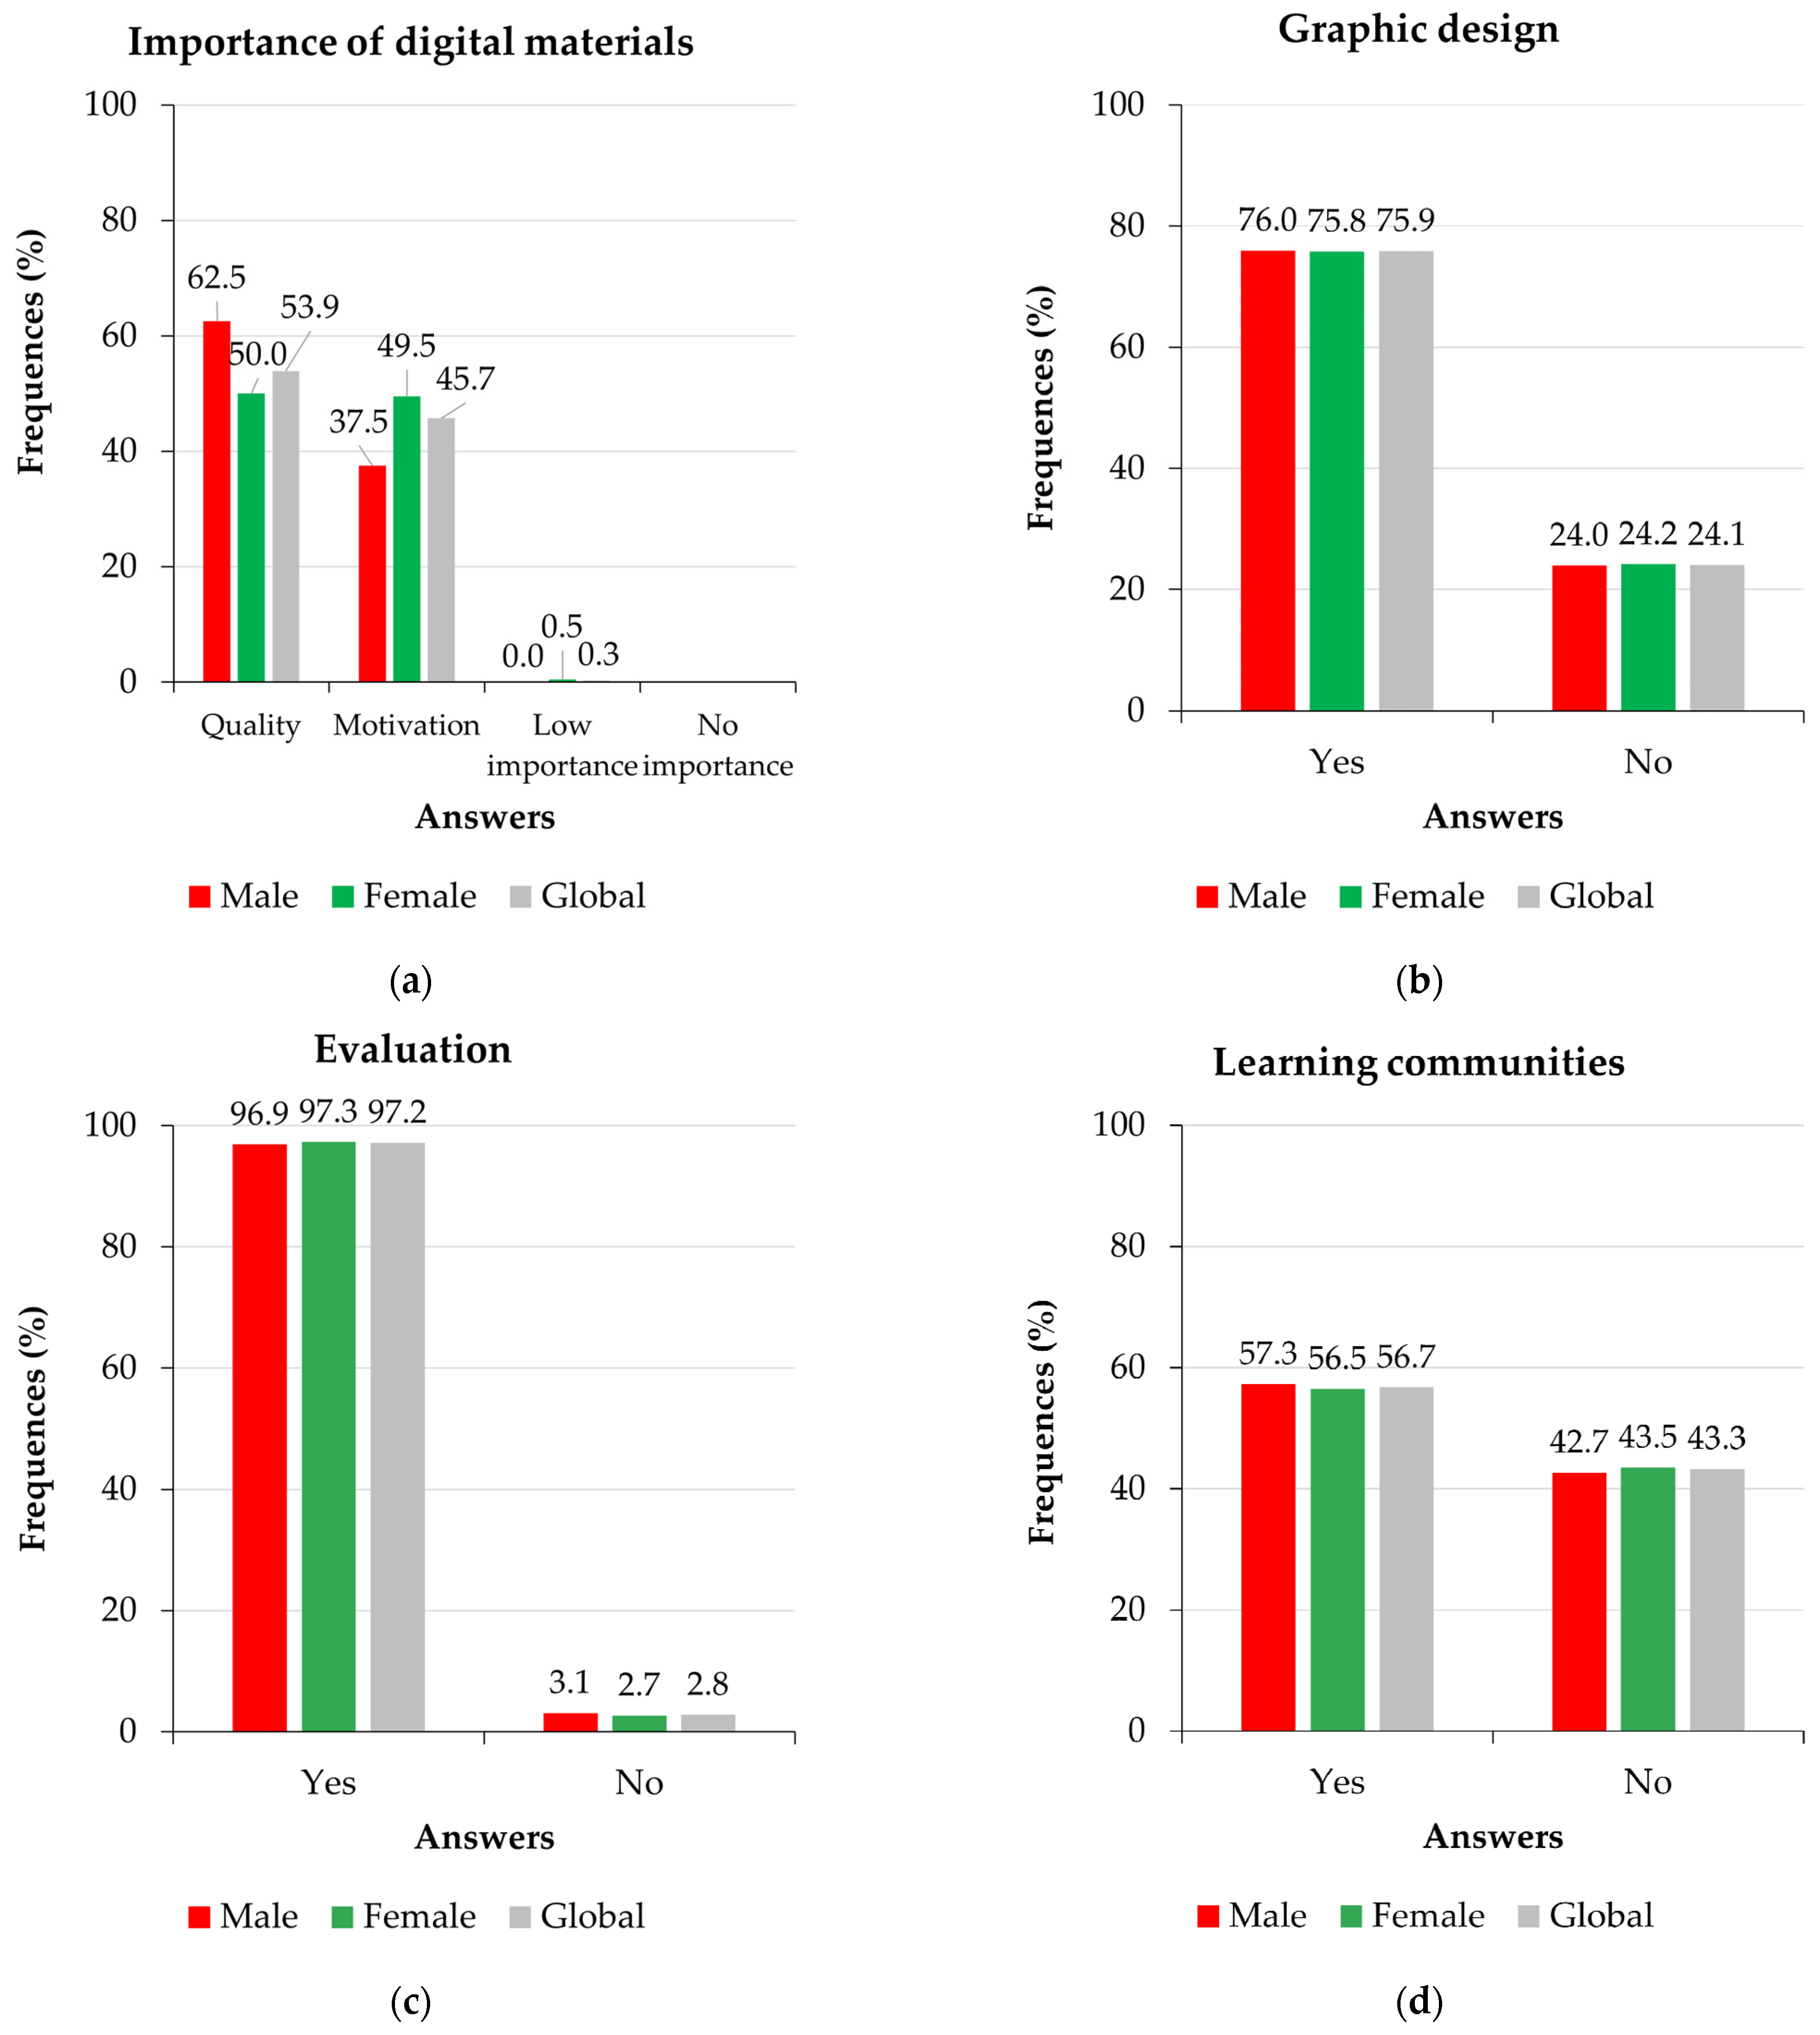
Figure 2 shows the frequencies, both overall and by gender, of the answers to the polytomous question (on the importance of using digital materials) and three of the four dichotomous questions (graphic design, evaluation, and learning communities). The question on the use of DCC tools in presentations was answered affirmatively by 100% of the participants, so it was not represented. The answers to the first question show that almost all of the respondents consider advanced training materials as essential elements in today’s higher education didactics, although they are divided, approximately in half, when it comes to choosing whether their greatest benefit lies in increasing the quality of the teaching process or the motivation of students. On the other hand, about three quarters of the participants use advanced training materials as graphic design tools, all of them for presentations and almost all of them as a tool for evaluation. On the other hand, just over half of the participants work with learning communities. The answers vary only slightly from the overall data, depending on the gender of the participants.
The values of Cramer’s V statistic, which measures the degree of this association for nominal variables on a scale from 0 (no association) to 1 (complete association), when the results of the polytomous and dichotomous questions of the survey are crossed with all the independent variables, are shown in
Table 4. In the analysis, the question about whether digital resources are used to make presentations has been omitted because all the respondents answered affirmatively. With respect to the rest of the questions, it can be seen that Cramer’s V-values indicate weak or very weak associations. This confirms the observation made in the previous descriptive analysis based on
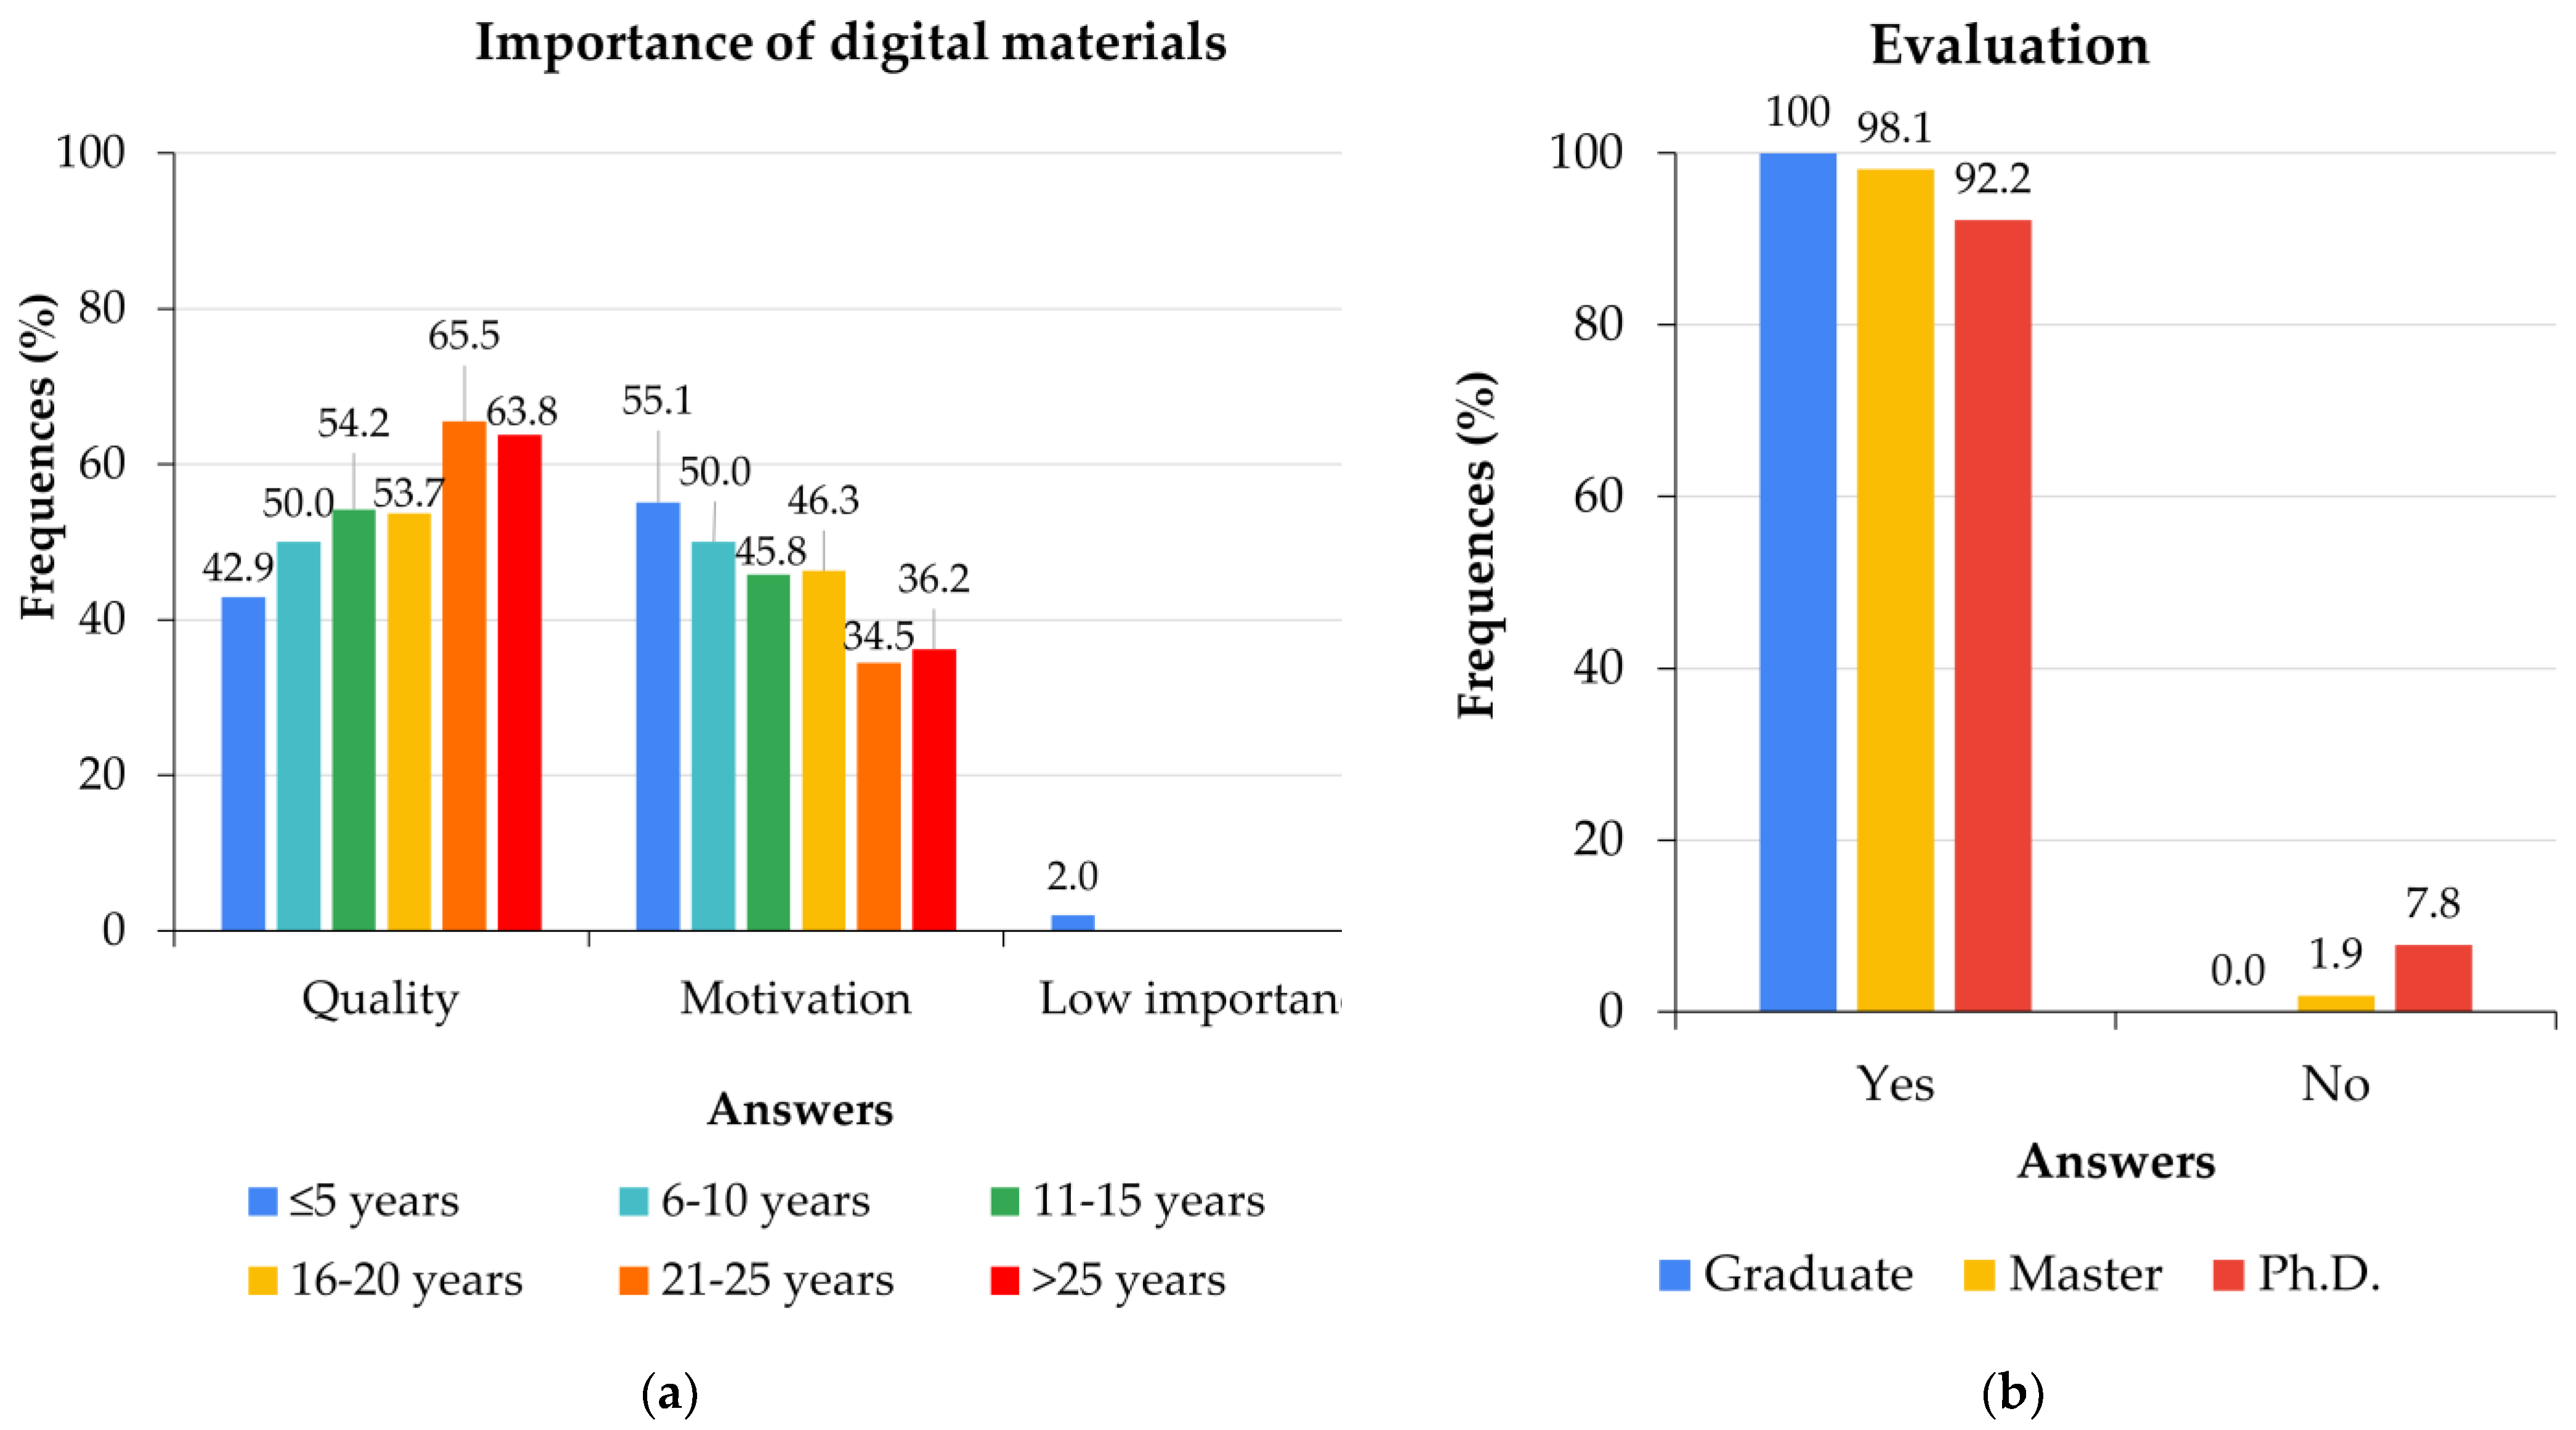
Figure 2 that gender is not a discriminating variable for any of the nominal variables. Regarding the rest of the independent variables, all but two of the values of Cramer’s V lack statistical significance. The frequencies of the answers to the corresponding questions are illustrated in
Figure 3. Academic level explains the use of digital tools for evaluation (PhDs use it more frequently than graduates), but it is a weak discrimination. For its part, teaching experience is explanatory of the reasons why digital resources are valued as suitable for university teaching (the less experienced tend to value motivation more).
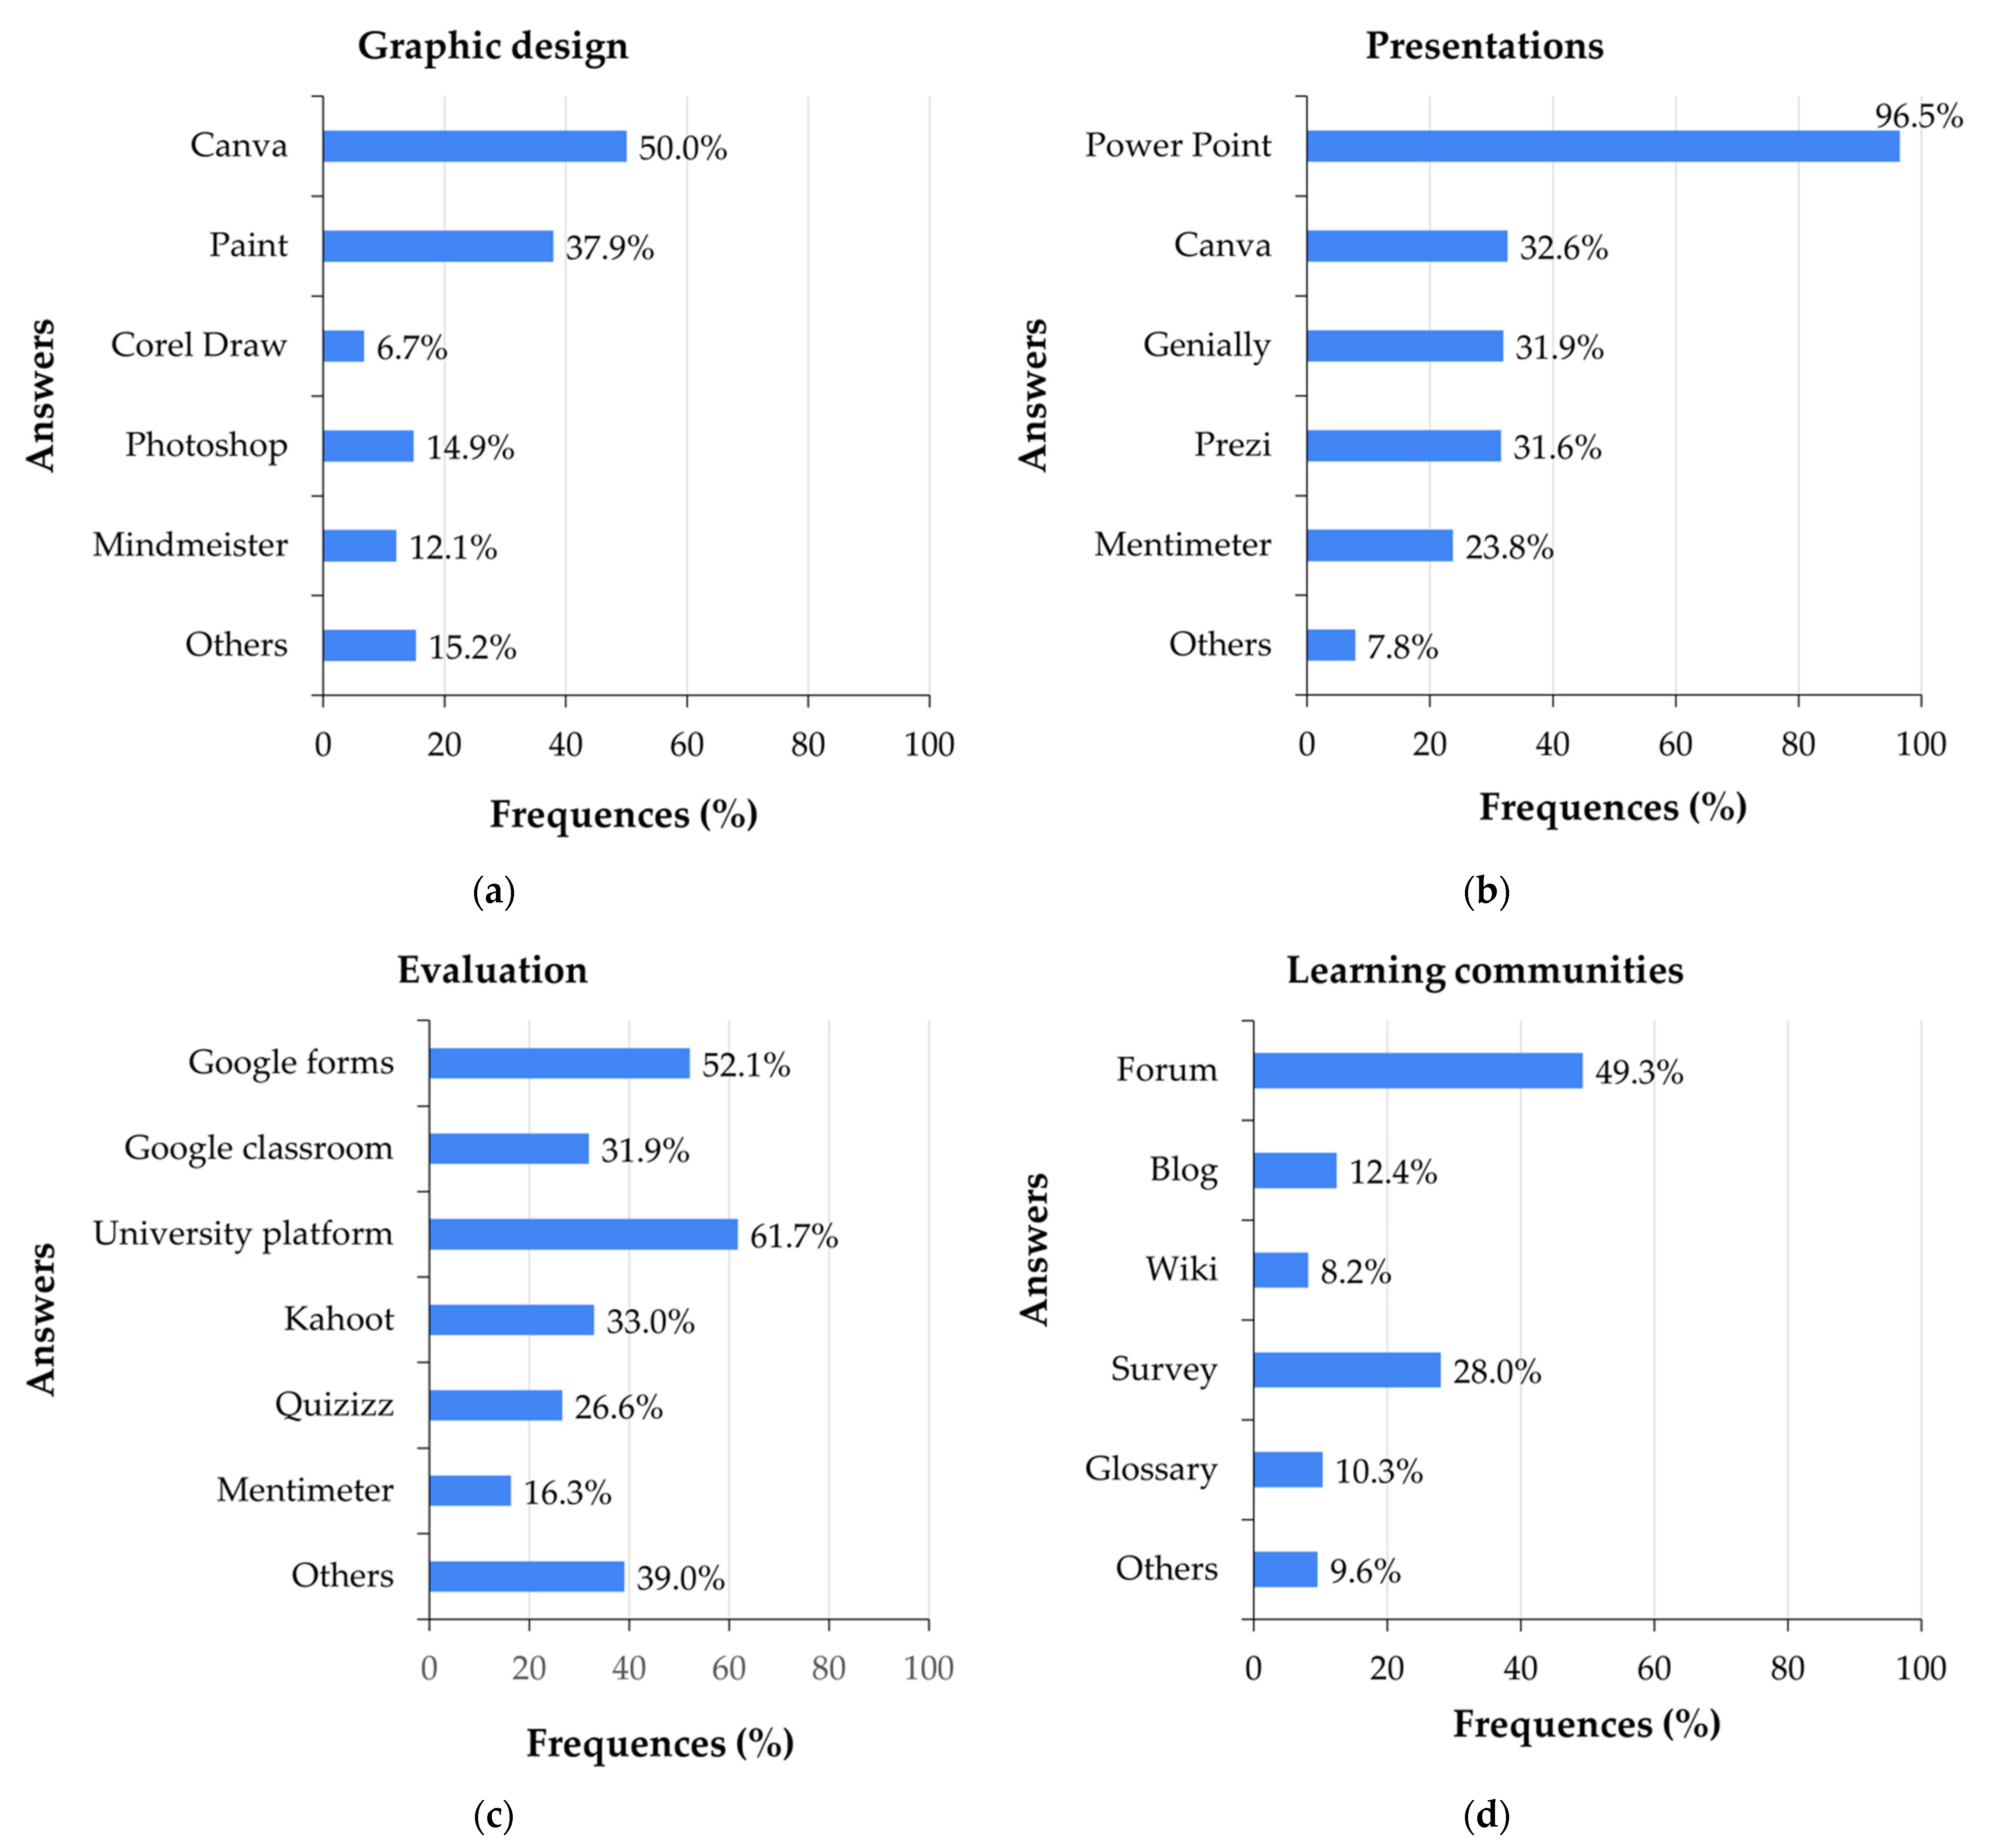
Regarding the tools most used by the participants,
Figure 4 shows the relative frequencies of each of them for graphic design, class presentations, evaluation, and creation of learning communities. It should be noted that, in many of the answers, the same participant may have indicated more than one tool. The most frequently selected tools are highlighted here. For graphic design, the most frequently used resources are Paint and Canva (81.3% of respondents indicated either or both). Other minority options are Photoshop, CorelDRAW, and MindMeister, but the proportion of respondents who use either of them without combining them with Paint or Canva does not reach 20%.
To support their presentations in class, almost all participants use PowerPoint as the digital resource (96.5%), although up to 32.6% of them combine it with the use of Canva, 31.9% do so with Genially, 31.6% with Prezi, and 23.8% with Mentimeter (all participants who have chosen any of these tools have also indicated PowerPoint). The rest of the resources cited by the participants are very few and insignificant. As digital tools for evaluation, almost all the respondents use Google Forms, Google Classroom, Kahoot, or a combination of some of these three resources, although there are other much less frequent options, such as Mentimeter, Quizizz, or the specific evaluation tools included in the digital learning platform used by the respective university (usually Moodle or Blackboard). Only 19.1% of the questionnaire respondents use their university’s platform and do not employ Google Forms, Google Classroom, or Kahoot. On the other hand, all participants who use a different tool (Mentimeter, Quizizz) do so in combination with one of the three majority tools (81.9%). As for the tools for generating learning communities, the participants opt mainly for forums (49.3%) and questionnaires (28.0%), although a proportion of between 8% and 12% say that they also use blogs, glossaries, and/or wikis. The latter also use forums and/or questionnaires. Only one respondent confessed to using only blogs, another to using only wikis, and only one to using only glossaries. Finally, 9.2% of the participants opt for other tools, but do not specify which ones.
3.2. Quantitative Variables
The statistics presented in
Table 5 show that the participants give intermediate ratings on the different dimensions measured by the variables of the teaching skills scale, but high or very high ratings on the scale measuring the educational effectiveness variables. Therefore, teachers perceive advanced training materials as more beneficial for learning than they recognize themselves as skilled for use in the classroom. Within the educational effectiveness scale, the low score on the accessibility item should be highlighted, an aspect in which the participants identify a limitation of these resources. The deviations are smaller in the educative effectiveness scale (accessibility, performance, motivation, and evaluation), which shows that the participants are more confident and unanimous in their evaluations of these items than when self-evaluating their own abilities.
Table 6 shows the Spearman’s r coefficients when all the independent variables are crossed with all the dependent variables, measured from the Likert scales. The coefficients that are statistically significant are also highlighted. As can be seen, all the coefficients are very close to 0, which indicates a low degree of discrimination, in general, of the independent variables considered with respect to the dependent variables. If statistical significance is also required, the number of discriminating variables is even lower. However, it is clear that, of all the independent variables, gender is the most discriminatory. Indeed, gender is explanatory for all the items of the educative effectiveness scale. The positive values show that the answers are distributed in such a way that females give higher scores than males on all these items. Age is explanatory of the participants’ knowledge of digital didactic materials, this time with a negative coefficient. This indicates that the self-perception of their knowledge decreases with the age of the participants. Academic level also influences the distribution of the answers on evaluation, so that the higher the academic level of the teacher, the less satisfied he/she is with digital resources as a means of student evaluation.
The mean values and statistics of the Student’s t-test when differentiated by gender shown in
Table 7 confirm the results obtained from Spearman’s r. In fact, it can be assumed that there are significant mean differences by gender in the items of the educative effectiveness scale (the
p-values corresponding to the accessibility and evaluation variables are not less than the level of the gender level). Indeed, it can be seen that it can be assumed that there are significant mean differences by gender in the items of the educative effectiveness scale (the
p-values corresponding to the accessibility and evaluation variables are not less than the level of significance but are very close). Specifically, females rate performance and motivation items higher than males. In general, although the participants express high or very high ratings, females express higher ratings than males in all the considered variables. All this is in a situation of homoscedasticity for all the items, as shown in
Table 8. Consequently, it cannot be said that either gender has more solidly formed concepts in this regard than the other.
The MANOVA test applied to differentiate the sample by age range did not identify significant differences between genders in the mean answers to any of the items (
Table 9). Although Spearman’s r coefficient had found a certain decrease with age in the participants’ knowledge ratings, this trend is weak (below 0.2) and does not translate into a significant difference in the mean values by gender. Nor do the Bartlett’s test statistics, presented in
Table 10, show statistically significant differences in the dispersions of the answers. Consequently, age cannot be taken, within each gender, as a variable that significantly affects the perception of the teachers surveyed on the use of DCC tools.
Although there is a certain association between the distributions of the variables age and teaching experience, in the sense that greater experience means greater age, Cramer’s V statistic confirms that this dependence is not strong, although it is statistically significant (V = 0.6680, df = 20,
p-value = 0.0000). For this reason, there is a certain divergence between the results found for the age variable and those obtained for the teaching experience variable, which are shown in
Table 11 and
Table 12. The MANOVA test identifies significant differences between genders in the answers on motivation when the sample is differentiated by years of teaching experience. Specifically, among females, it is the least experienced (with less than 5 years of experience) who perceive to a lesser extent an increase in student motivation when digital materials are used. On the other hand, among males, this position is occupied by the most experienced (with more than 25 years of experience). More precisely, females only rank behind males in their assessment of the motivation variable among participants with less than 5 years of experience and among those with 16 to 25 years of experience. In the rest of the ranges, it is males who score motivation the highest.
As for the dispersions, there are significant differences by gender in the items of academic performance, motivation, and employability for evaluation. The behavior of the distributions of the three items is, in this sense, similar for both genders. Males manifest less dispersion and, therefore, more solidly formed concepts, within the population with less than 5 years of experience, with 16 to 20 years of experience and also within those with more than 25 years of experience (the extreme and the central ranges). With respect to the rest of the independent variables of an academic nature (area of knowledge and academic level), none of them yield significant mean differences by gender, as indicated by the statistics in
Table 13 and
Table 14. Consequently, none of the areas of knowledge considered present significant gender gaps.
On the other hand, it is possible to assume significant differences in the deviations between genders when differentiating by area of knowledge (
Table 15), but not by academic degree (
Table 16). Specifically, the area of knowledge allows us to distinguish the dispersions of the variables on academic performance and motivation. The most notable observation in this respect affects the area of Social Sciences. Contrary to what occurs in the rest of the areas, the dispersion of the answers on academic achievement and motivation are greater in males than in females in this area. This shows that the concepts in this regard are more weakly formed in males, which explains the greater heterogeneity of responses.
In the rest of the areas, it is females who express themselves with less unanimity and it is to them, therefore, that we must attribute a greater weakness in the formation of the concepts. In the areas of Arts and Humanities, Health Sciences, and Engineering and Architecture, dispersions are higher among males than females. Therefore, the concepts presented by male participants from these areas of knowledge are more weakly formed. It can be concluded that male teachers in humanistic and scientific–technical areas are more insecure than female teachers in these same areas, while in the social–scientific area the opposite effect occurs (although there are no significant differences between the mean answers between genders in any of the areas). Regarding the area of pure Sciences, females respond more confidently and unanimously to the performance variable but are slightly more insecure in the motivation variable.
4. Discussion
This article has shown that the university teachers surveyed almost unanimously use DCC tools in the development of their classes and in the evaluation processes. Moreover, they consider these materials as an essential part of the didactic action, although the opinion about whether they increase student motivation or performance is divided. This result is common to other studies [
3,
6,
10,
12,
13,
14,
25,
26]. In general, university teachers feel prepared for the irruption of the digital era in higher education in terms of their own digital and digital-teaching competencies [
16], but also as trainers of students who have to develop professional digital competencies in the different fields of working life [
27,
28]. However, some studies highlight certain problems of adaptability to the pace of incorporation of DCC tools in university classrooms, mainly derived from the COVID-19 crisis [
29]. Other studies point out some limitations of the incorporation of advanced training materials in university teaching, the most frequent being the necessary economic investment and the potential inequalities that can be generated in the student body in terms of access to these resources [
30,
31,
32]. In this sense, accessibility has been identified in the present study as the worst valued variable among those that refer to the increase in educational quality generated by the teaching materials, which is in line with the previous results. In addition, it has been found that, in this respect, gender influences the perception of the respondents. However, further research on this aspect would be necessary in order to identify in detail the causes of these perceptions. However, there are other limitations, such as teachers’ resistance to the methodological shift required by the incorporation of DCC tools [
33,
34], which in the present study are analyzed linked to years of teaching experience.
The specialized literature contains a large number of elements that would help university teachers to increase the use of advanced training materials and their perception of them. The most common are practice [
35], positive attitude [
3,
36], cooperative collaboration between teachers [
15], or the conditions of approach to teaching [
37]. The identification of factors influencing the use and perception of materials as digital resources in the classroom is also frequently addressed. One variable that has been widely studied is the geographic area. Indeed, numerous studies show that the conception of the didactic use of DCC tools is very sensitive to location [
38]. This article has shown that the Latin American geographical area has high levels of use and appreciation of digital teaching materials in higher education. This fact may be due to the fact that, despite the social inequalities in the countries of the area studied, university teachers are usually part of the most privileged social sector and university campuses are located in the most economically powerful cities. In fact, there are studies that point to this element of social inequality to denounce the gap that exists between the good preparation of teachers and universities with respect to the use of DCC tools and the difficulty for students to access them, especially during the COVID-19 pandemic [
19]. The high ratings presented in this work may be due, in part, to the efforts of local governments and the European Union to finance the digitization of university centers through specific programs [
5,
20,
23,
24]. This fact is not exclusive to Latin America; there are other areas of the world whose governments are acting to try to alleviate the technological gap in their societies, leading to an increase in the use of advanced training materials in their universities [
39]. Other countries, such as India, have probably not yet addressed this problem, which causes their universities to lack adequate digitization [
40].
However, gender is the variable that is the focus of the present study and is of interest to a good collection of specialized works. Here it is shown that there is a real gender gap in the scale that measures the assessment of the educational effectiveness of digital materials, but this gap disappears when the teaching skills in this regard are analyzed. Differentiating between these two scales is key to finding the corresponding gaps. Indeed, these differences have been diluted when the component variables of digital skills and the perception of teaching effectiveness have not been differentiated in detail [
40]. On the other hand, there are studies that identify gender differences in favor of males with regard to the frequency of use of advanced training materials [
21,
22,
32]. The results presented in this paper follow the opposite trend: females have significantly higher ratings. The reason is that these ratings do not refer so much to the frequency of use (an aspect in which no differences were observed) as to the perception of didactic efficacy. It can be concluded that Latin American female teachers are more sensitive to these aspects than males. In [
22], it is also stated that male teachers have greater digital competence. The study is restricted to a very specific set of digital tools and to a very restricted population (Ecuador), so that, as the authors state, its results are not generalizable. The results of the polytomous and dichotomous questionnaire presented here show that these results do not generalize to Latin America, because the gender gap in self-perceived digital competence disappears. This suggests the existence of important differences between the different Latin American countries that would be interesting to explore in further studies.
Studies in Europe have shown that gender can be a discriminating variable depending on the context and area of knowledge in which advanced training materials are used [
41,
42]. Gender gaps in self-concept about digital competencies in favor of males have also been identified when studying populations of university students [
43]. However, in the geographic area analyzed in this study, these differences are almost completely diluted when differentiated by areas of knowledge or academic level. In contrast, gender gaps are identified when differentiating by teaching experience. Specifically, females with less experience value less the motivation generated by the use of advanced training materials among students, but among males it is the most experienced who value it less. Therefore, the dependence of gender differences with respect to academic aspects is located, in this study, in teaching experience. It would be interesting to explore the reasons for the link between gender and teaching experience in this regard, but that would require a more in-depth analysis that focuses on assessing these causes. Gender gaps in the use, skills, and perception of the didactic use of DCC tools also suffer from a strong dependence on the geographical area [
44]. For that reason, the results obtained here regarding gender differences are not, in principle, extrapolated to other geographical areas. Because of the sociological similarity between Latin American university faculties and some European societies, the results could be extrapolated to certain European countries such as Spain or Italy, but this generalization would require further research in this regard.
Regarding the rest of the independent variables that have not yet been discussed, it should be noted that no age gaps have been identified in any of the scales analyzed. This fact is in line with other studies that affirm that age is not a statistically discriminating factor for digital attitudes and competencies in a university faculty geographically located in areas of high social difference [
45]. Academic level has also been identified as a discriminating variable in the use of digital resources for student assessment. Specifically, teachers with a higher academic level are those who are more reluctant to use digital resources. This may be due to the fact that this sector of the teaching staff is the most accustomed to the use of traditional forms of evaluation, so that there may be an effect of resistance to change, which is noticeable when the participants express themselves on such a sensitive aspect as student evaluation.
5. Conclusions
The first conclusion to be drawn from the study is that Latin American university teachers have integrated digital teaching materials as fundamental tools in their training activities in e-learning environments. They use DCC tools almost unanimously, regardless of the area of knowledge, both for the illustration of specific concepts through graphic design tools and to support their class explanations and student evaluation processes. However, the resources most frequently used by teachers are the most popular in each of the aforementioned aspects of teaching activity (PowerPoint, Google Forms, or Google Classroom). The teachers recognize that they are knowledgeable and skilled with digital materials, but there is little variability in the tools they use. It would be advisable for the universities in the area to reinforce their teacher training plans in order to present more innovative and specific tools for each of the dimensions of their teaching activity to help them strengthen their skills in this regard.
With regard to digital teaching skills, there are no significant differences between the self-perceptions of males and females. However, there are when the teaching effectiveness of digital materials is judged. All participants express high ratings in this regard, but females do so more clearly than males. Consequently, it is possible to speak of a certain gender gap, but not in the sense that there is any kind of inequality in access to digital media or in training in their use, but in the sense that Latin American female teachers seem to perceive more clearly than males the didactic benefits of DCC tools.
The above observation confirms that it is not necessary for universities to implement measures to correct gender differences in the use of digital materials, because such differences do not exist. However, it should be taken into account that females are more open to the use of these resources, which is probably the reason for their greater appreciation of the didactic usefulness of these tools. This fact is also supported by the gender gap that has been identified in the assessment of student motivation according to the teacher’s years of teaching experience. Males with more experience are more skeptical than the rest with respect to the motivation induced in students by the use of advanced digital mathematics and e-learning training actions, while among females, experience generates optimism in this regard.
On the other hand, females also express more disparate opinions, which shows greater insecurity in their positions than males, in all areas of knowledge and all the considered variables, with the exception of Social Sciences. Consequently, although the behavior of the mean answers is homogeneous by gender, females present more weakly formed concepts than males, something that is especially significant in the assessment of performance and motivation but does not affect the area of Social Sciences. This fact is probably due to a greater presence of women among Social Science teachers and a greater experience among them in the use of DCC tools, although the exploration of the specific causes of this fact is a limitation of the study and an interesting line of future research. In this sense, it is suggested to intensify training in digital teacher training, both for males and females, but especially among women in scientific–technical and humanistic areas.
Gender has been shown to be a particularly discriminating variable when crossed with the teaching experience variable. This means that gender gaps identified in certain ranges of teaching experience are abundant. Specifically, when assessing the motivation of DCC tools, among the least experienced teachers, males are the ones who score this variable the highest, although they are also the least confident in their answer. This fact is probably projecting the opinion that these less experienced teachers have acquired from their student stage, which is very recent, so that these results are possibly reflecting the opinion of students in their final years. This would explain why motivation is, in general, less highly rated among less experienced teachers than among others, and why the gender gap is reversed among teachers in the immediately higher age ranges. However, from the results obtained it is not possible to conclude with certainty what is the reason behind this fact, but its identification constitutes an interesting new line of future research. In any case, this same trend, in which females undervalue motivation with respect to males, reappears among teachers with more than 15 years of teaching experience, which may be due more to a lack of training or skill on the part of female teachers in the use of digital tools. In any case, it seems necessary to incorporate training actions by universities focused on new teachers (this would probably help to acquire a homogeneous digital competence among men and women) and also among teachers with a long teaching career, to correct the gender differences that exist in fact. These measures should be supported by an increase in the capacity of teachers to access digital materials and by an economic effort on the part of universities and competent authorities to guarantee access by teachers and students to these materials and to the training required for their use.
If it were possible to confirm that less experienced teachers really project in their opinions the experiences they have had as students, then the existence of gender gaps in the perception of university students regarding the didactic use of DCC tools would be confirmed. This would make it possible to build bridges between higher education and university teacher training in order to demonstrate the need to establish measures to promote digital tools among female university students, with the aim of correcting, in advance, the gaps observed among the teaching staff. However, the verification of these theses requires further study.
The geographical location of the participants (Latin America) plays an important role in the study, because of the influence that the level of digital, technological, and social development could have on the use of DCC tools in university classrooms. For this reason, it is not possible to ensure that the results presented are generalizable. This is a new limitation of the work. As a line for future research, it would be interesting to propose a comparative analysis, in the same terms that have been proposed, of Latin American countries with those of North America and Europe.


 ,
, 


