
Application of Spectral Decomposition Technique to Delineate the Evolution of Karst on Carbonate Platforms of Central Luconia, Offshore Sarawak, Malaysia

 , , ,
, , ,
Abstract
:1. Introduction
- Dissolution aggressivity due to the mixing of fresh and salt water.
- Mixing environments from freshwater lens movement resulted from quaternary glacioeustasy.
- Presence of overprinting of glacioeustatic changes by local tectonic movements.
- Eogenetic (diagenetically immature) carbonate rocks.
- The classification of carbonate islands from simple to complex categories.
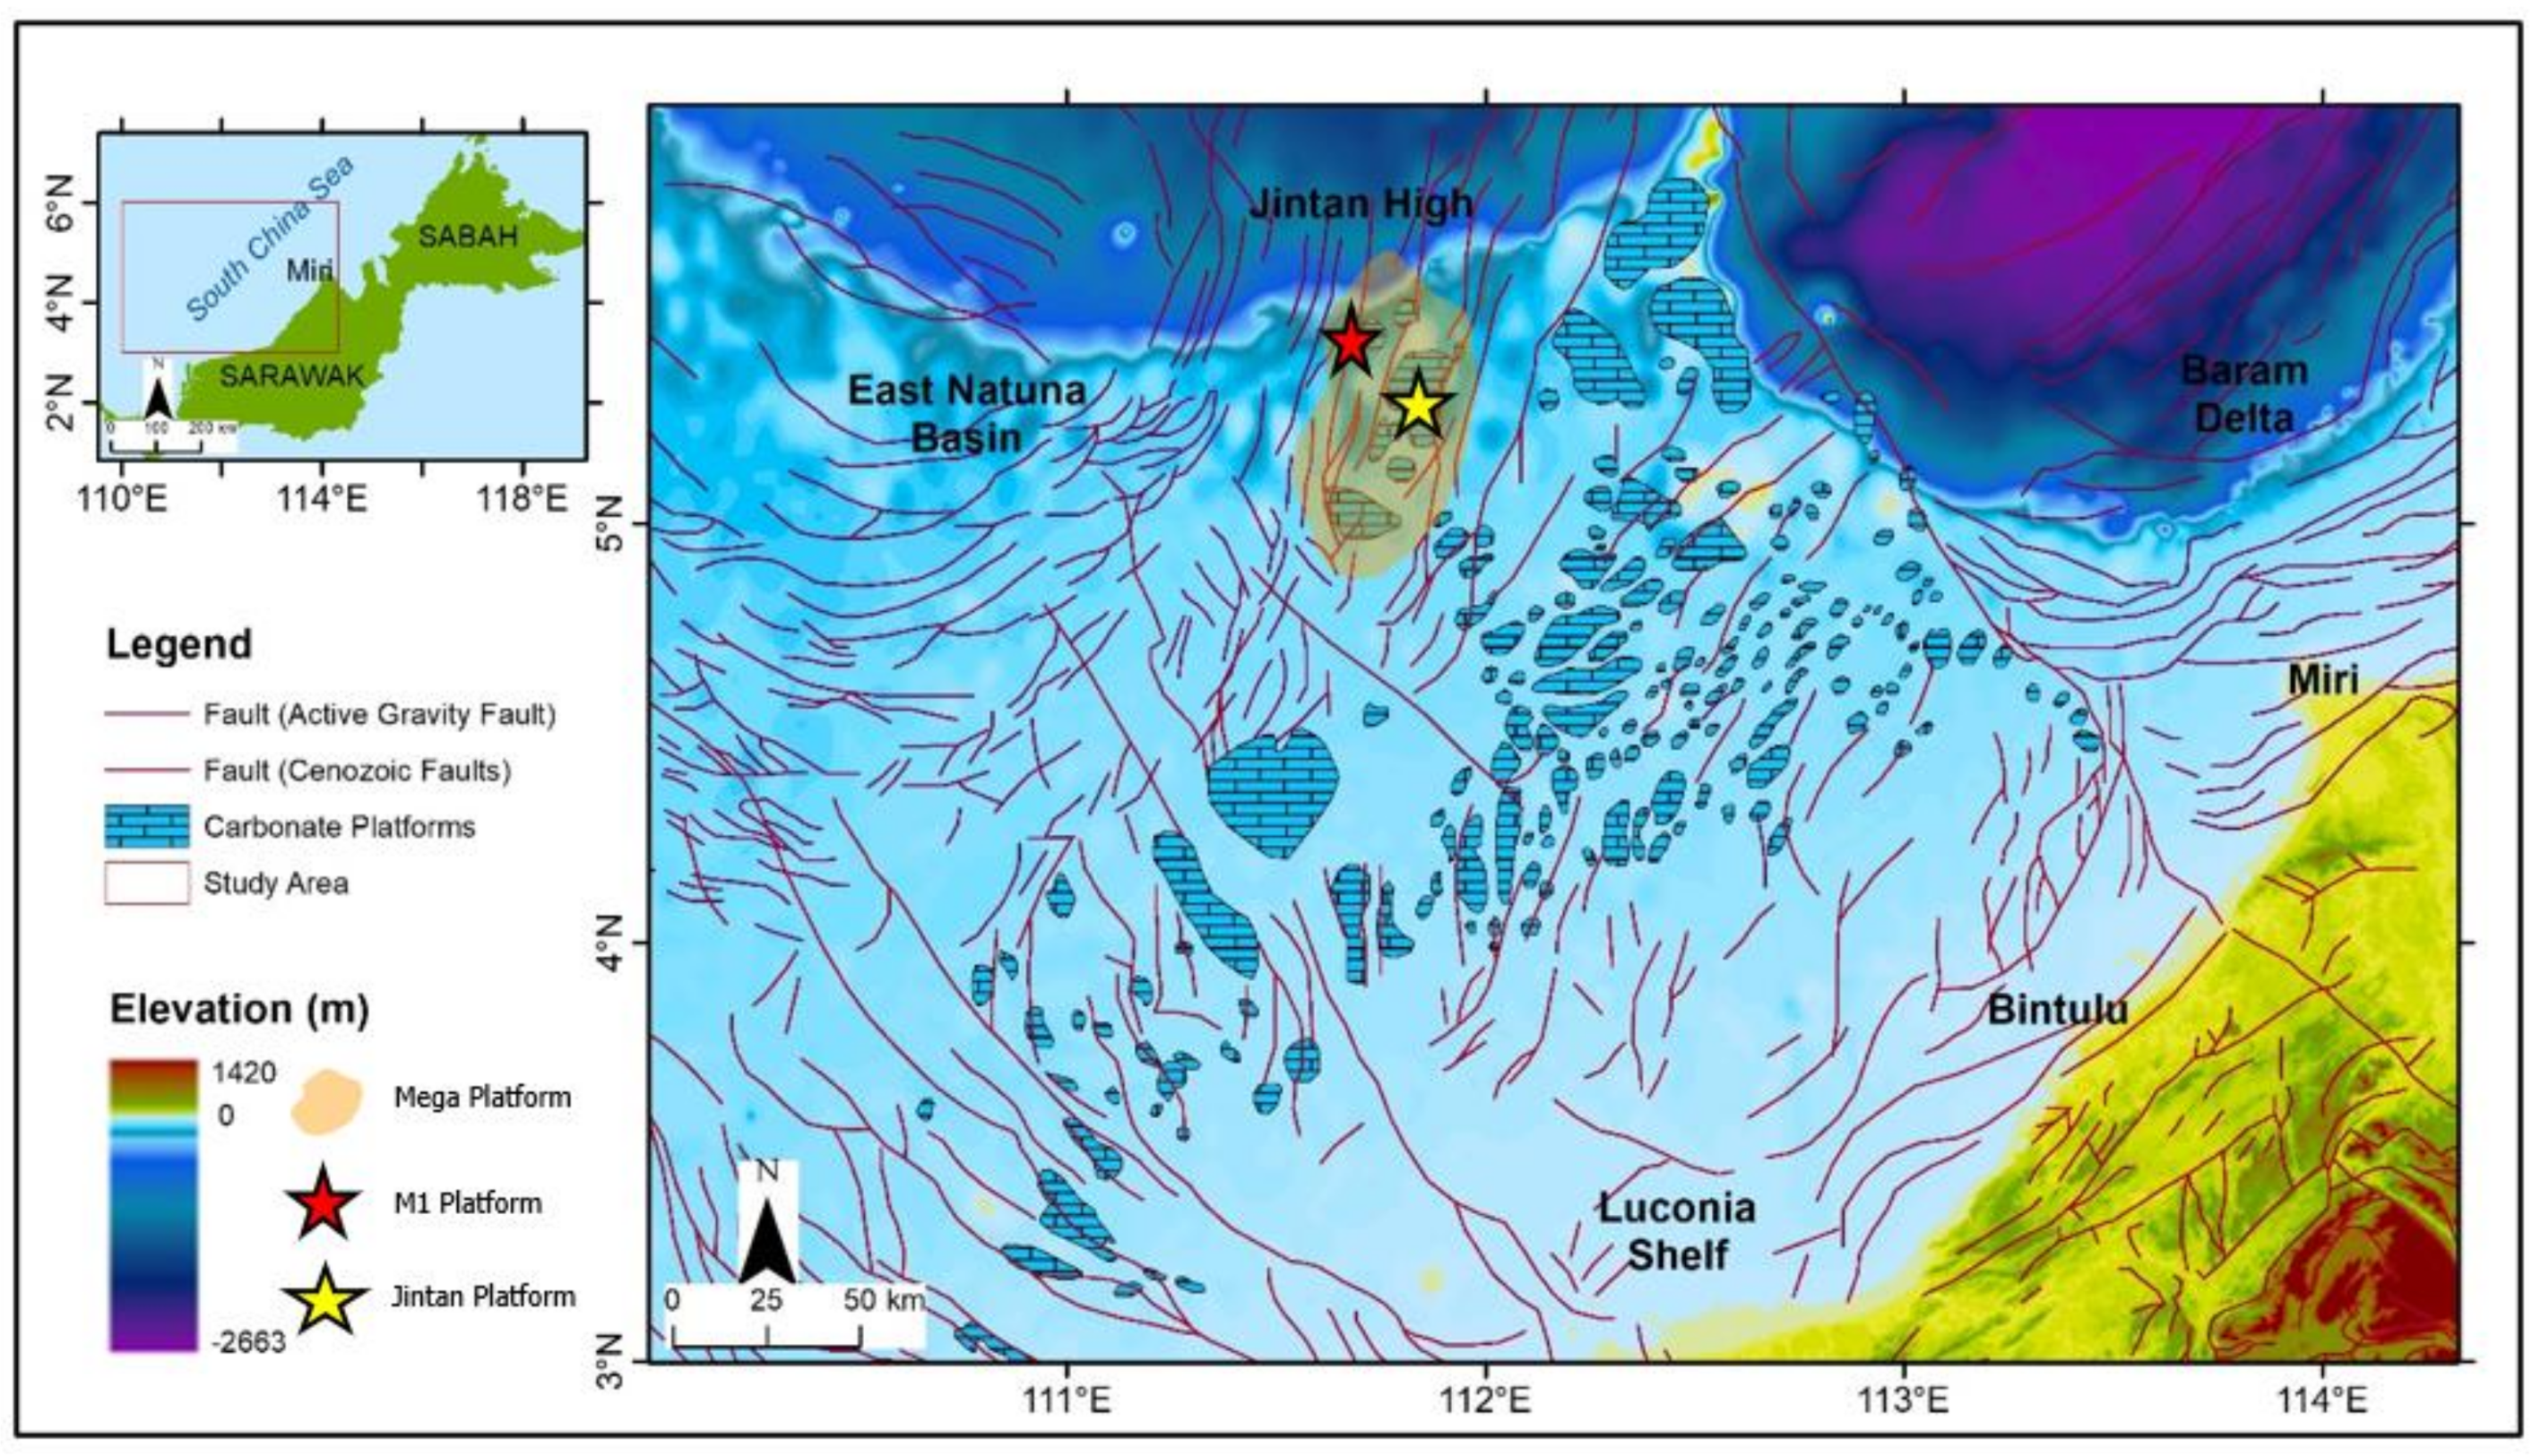
2. Geological Setting
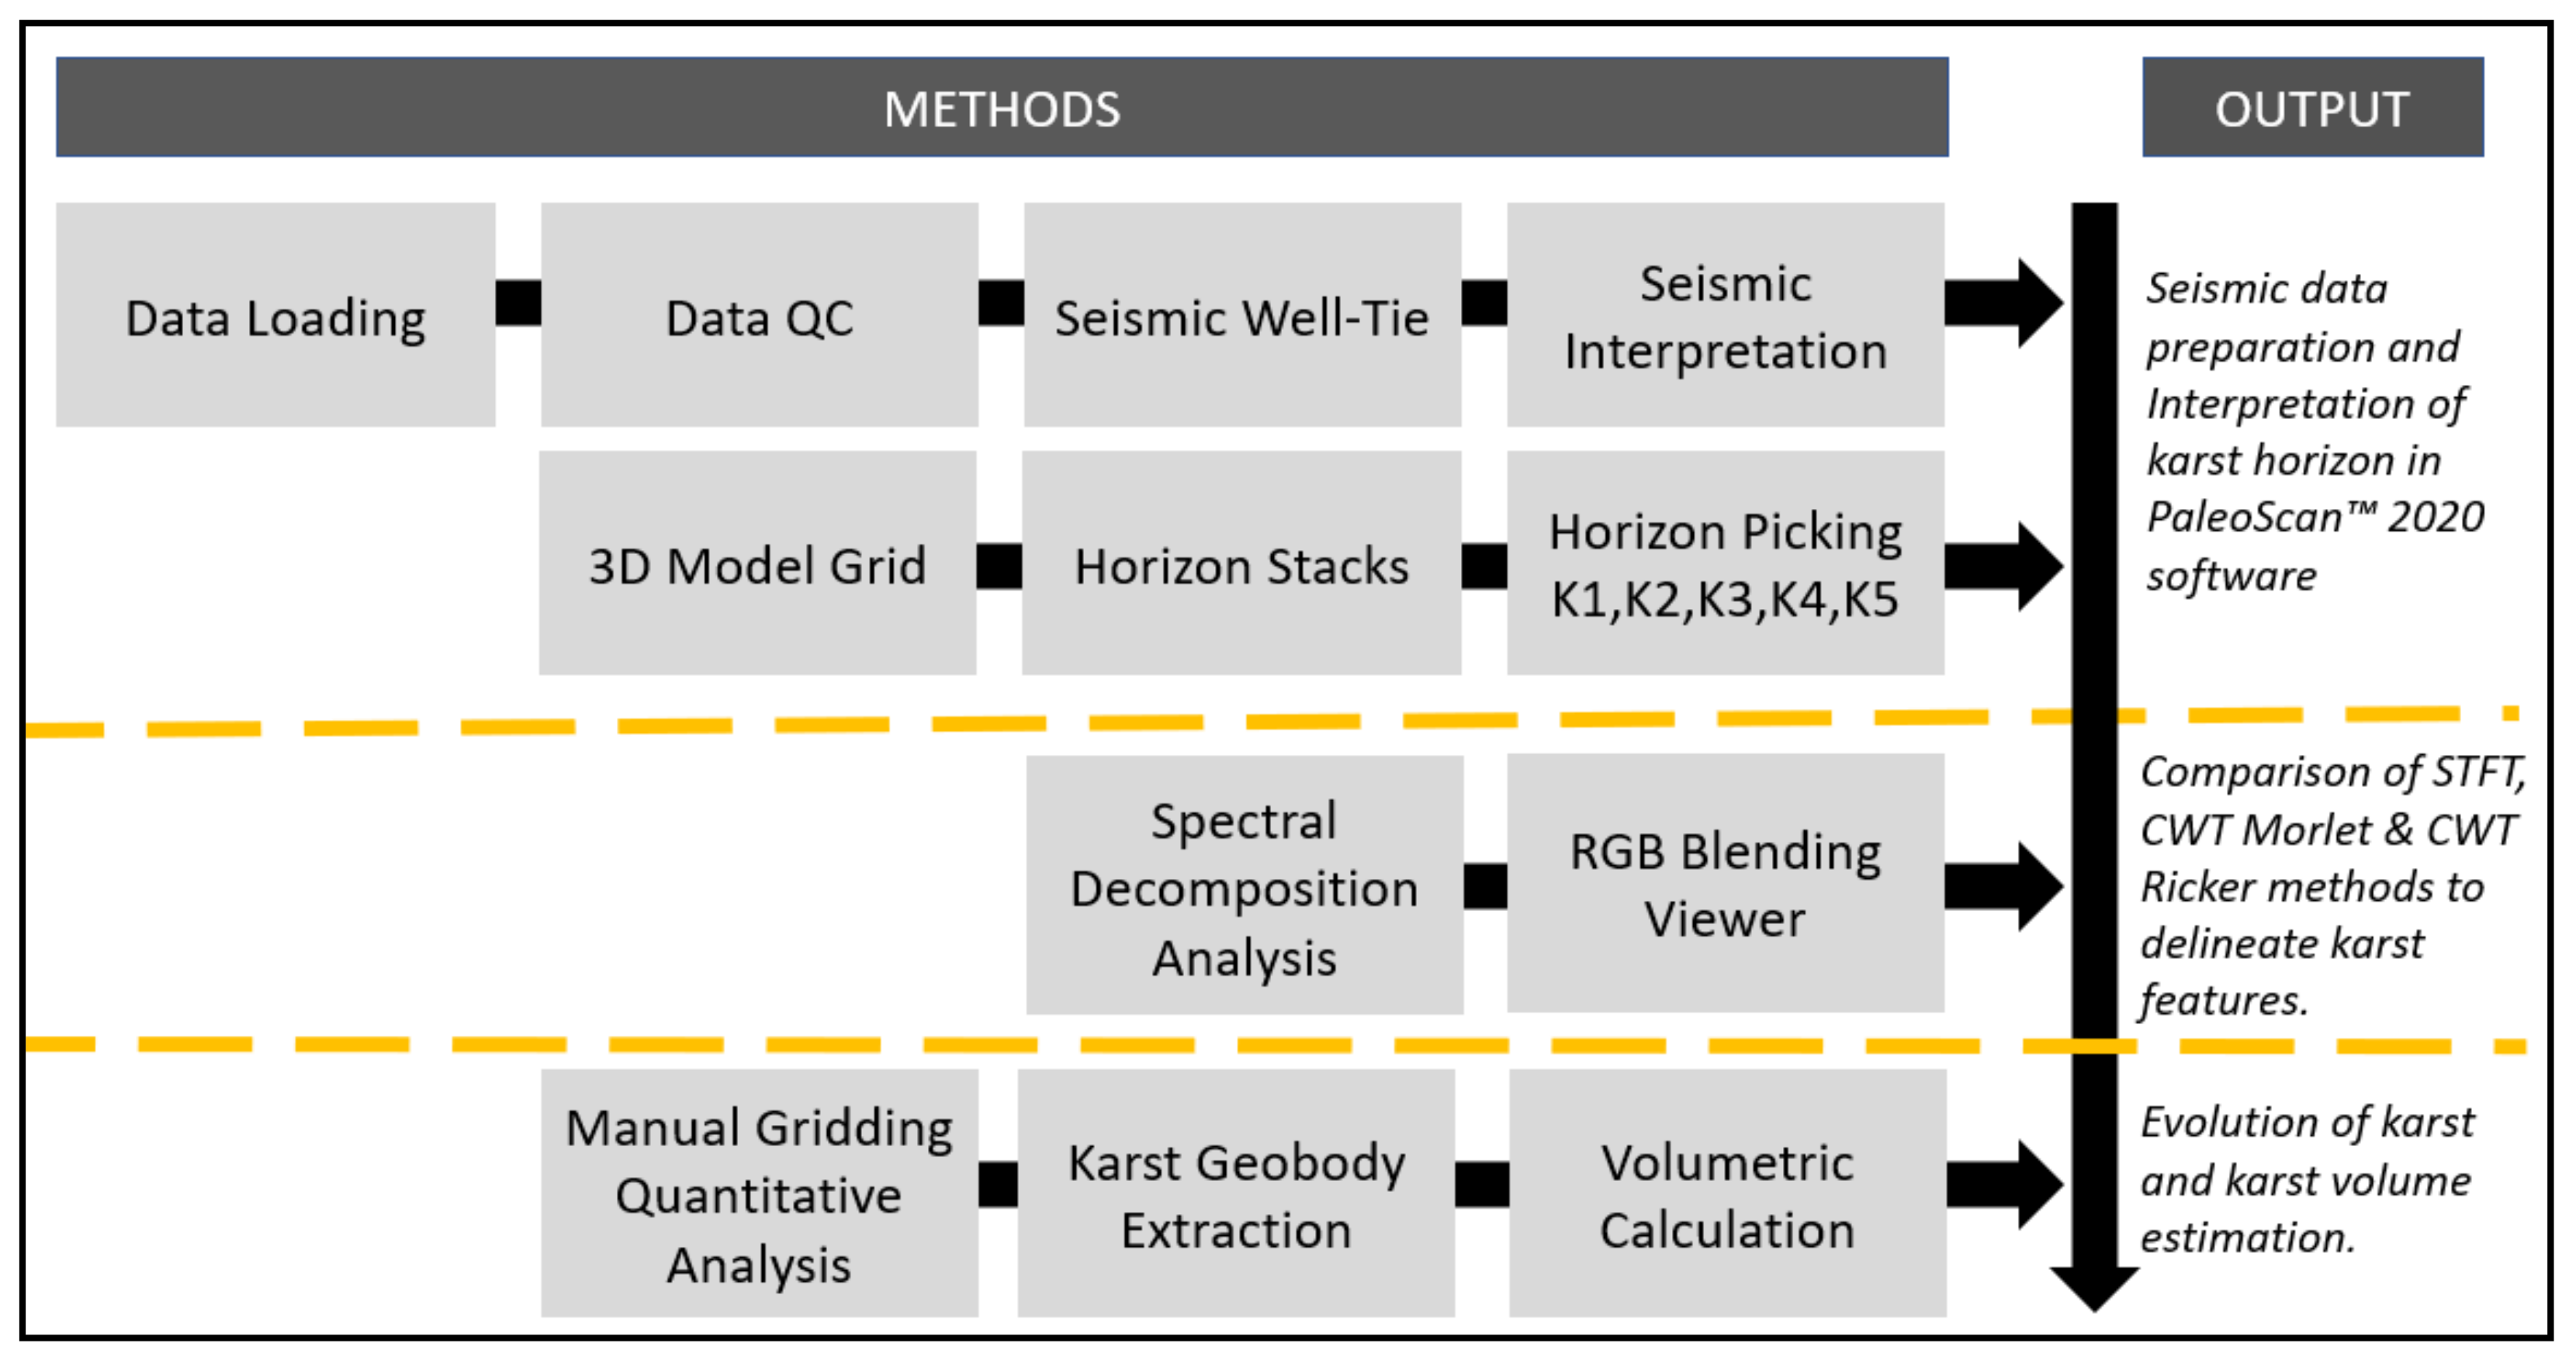
3. Materials and Methods
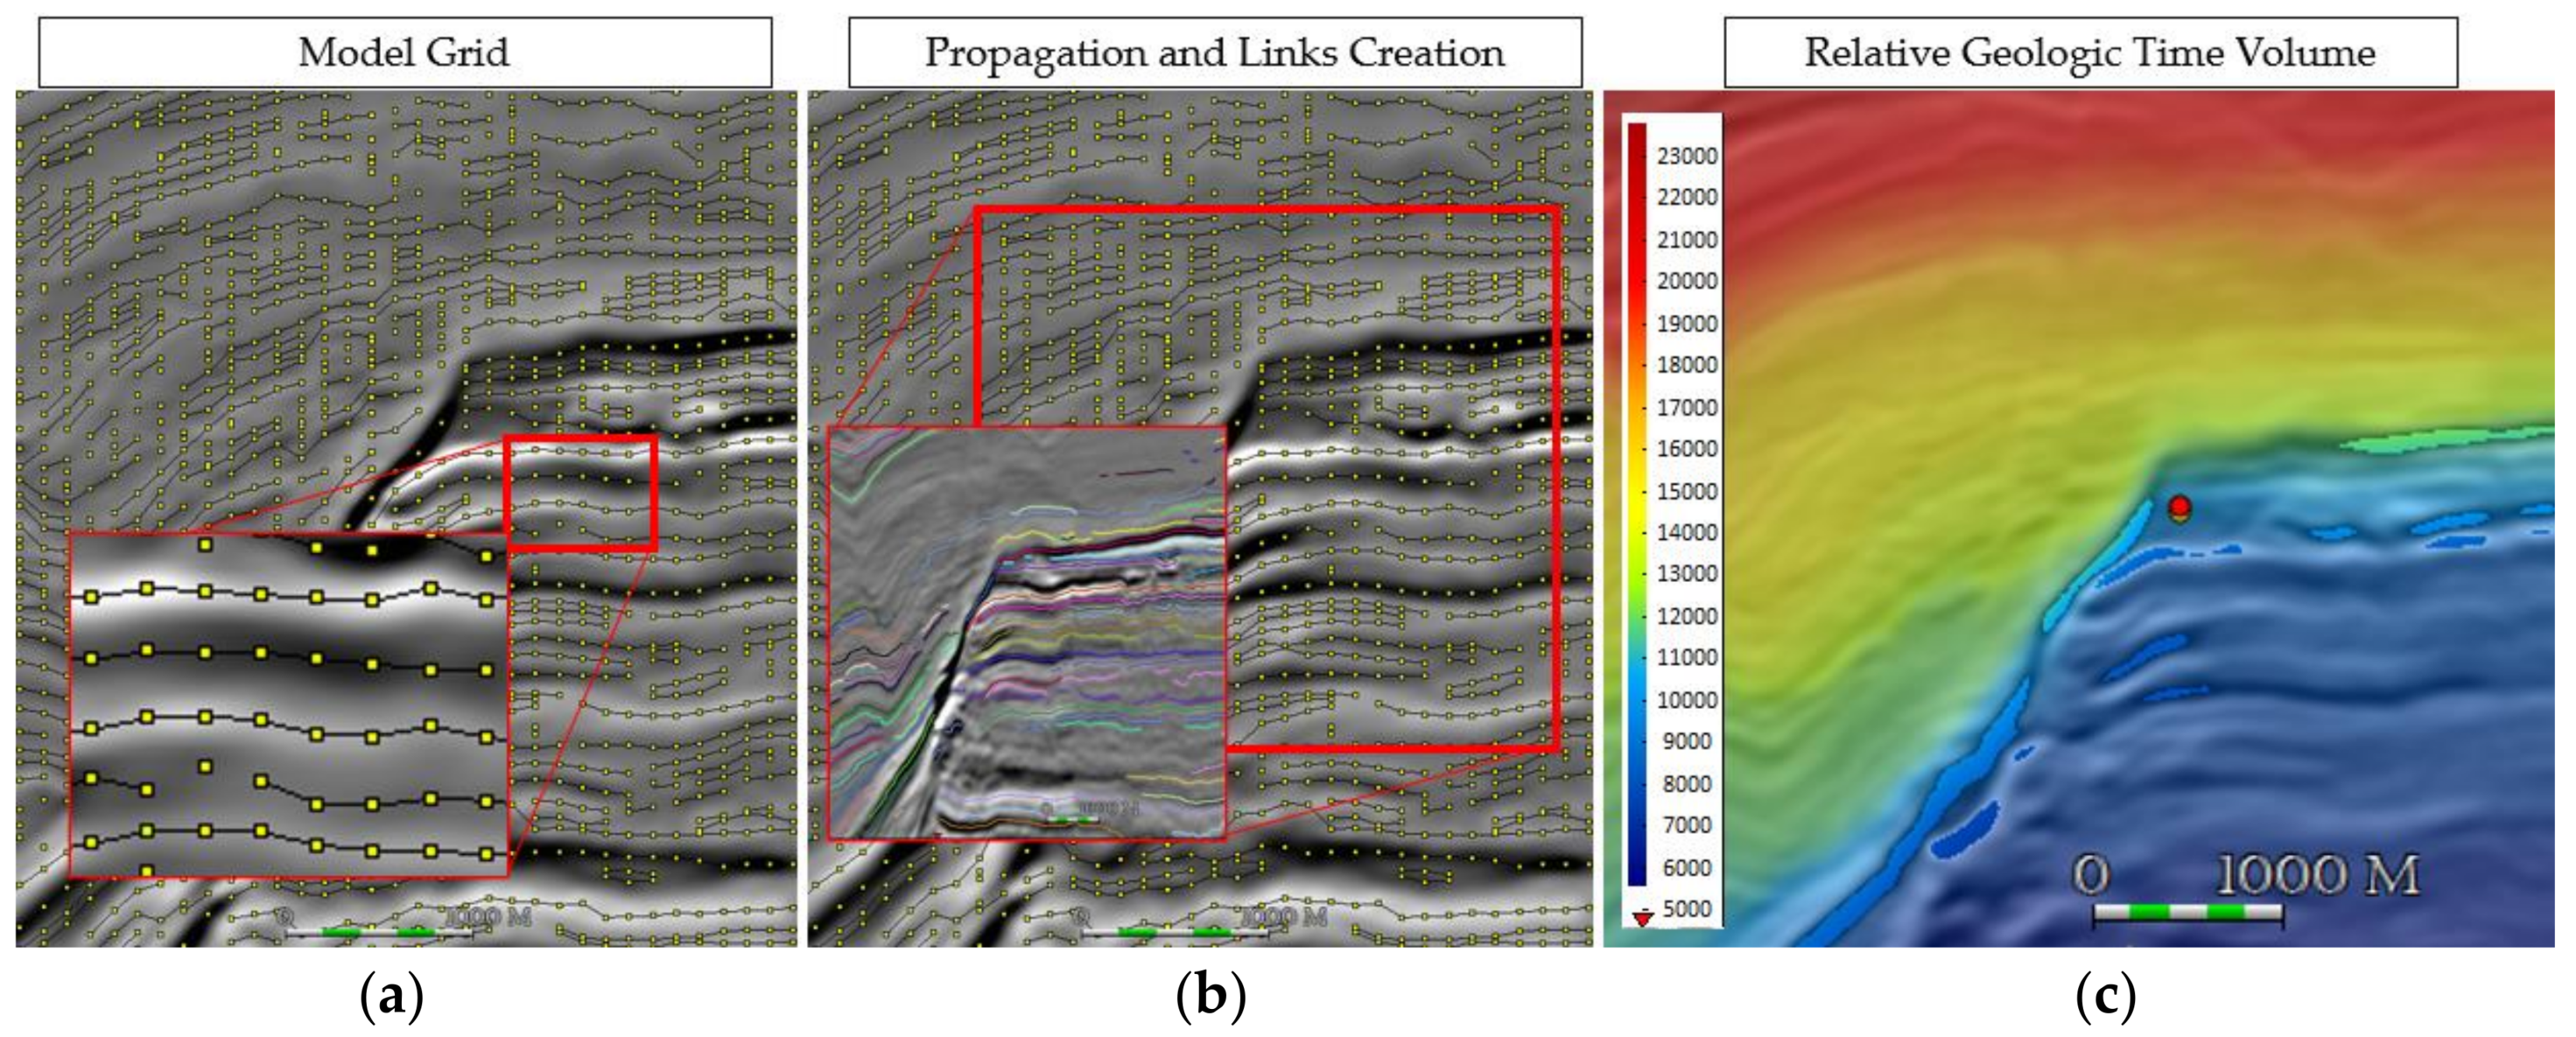
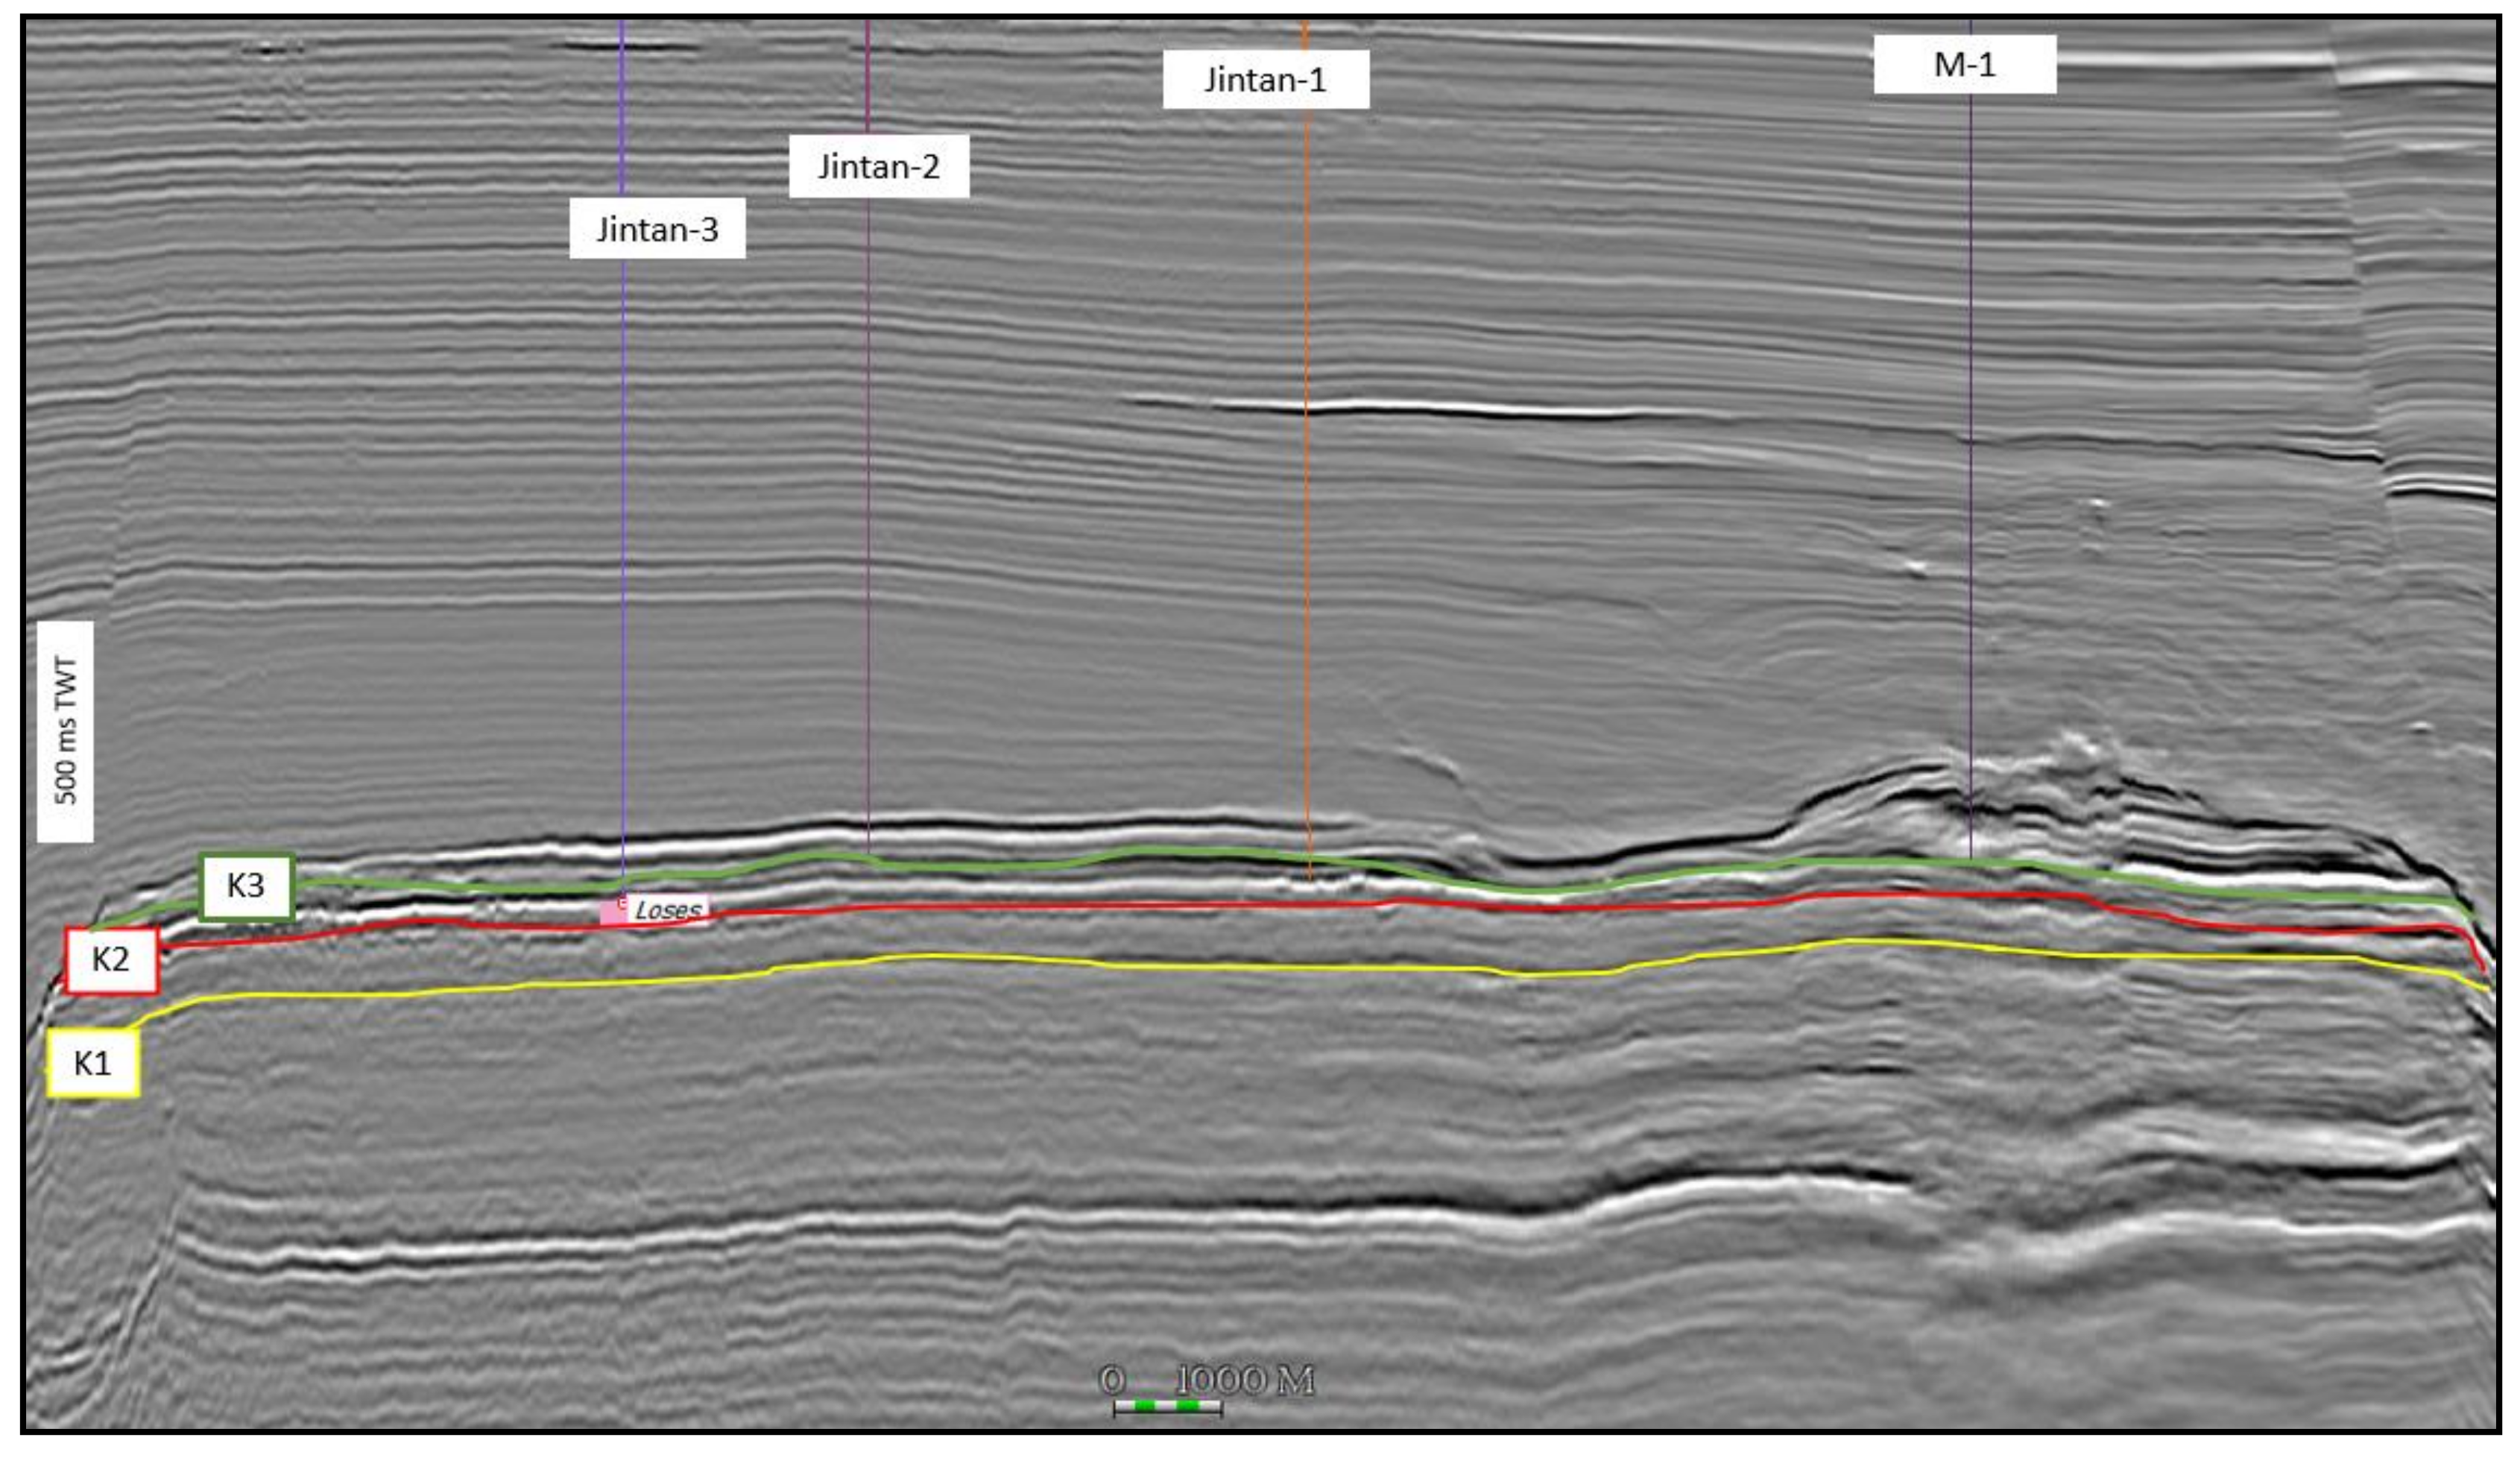
3.1. Seismic Interpretation
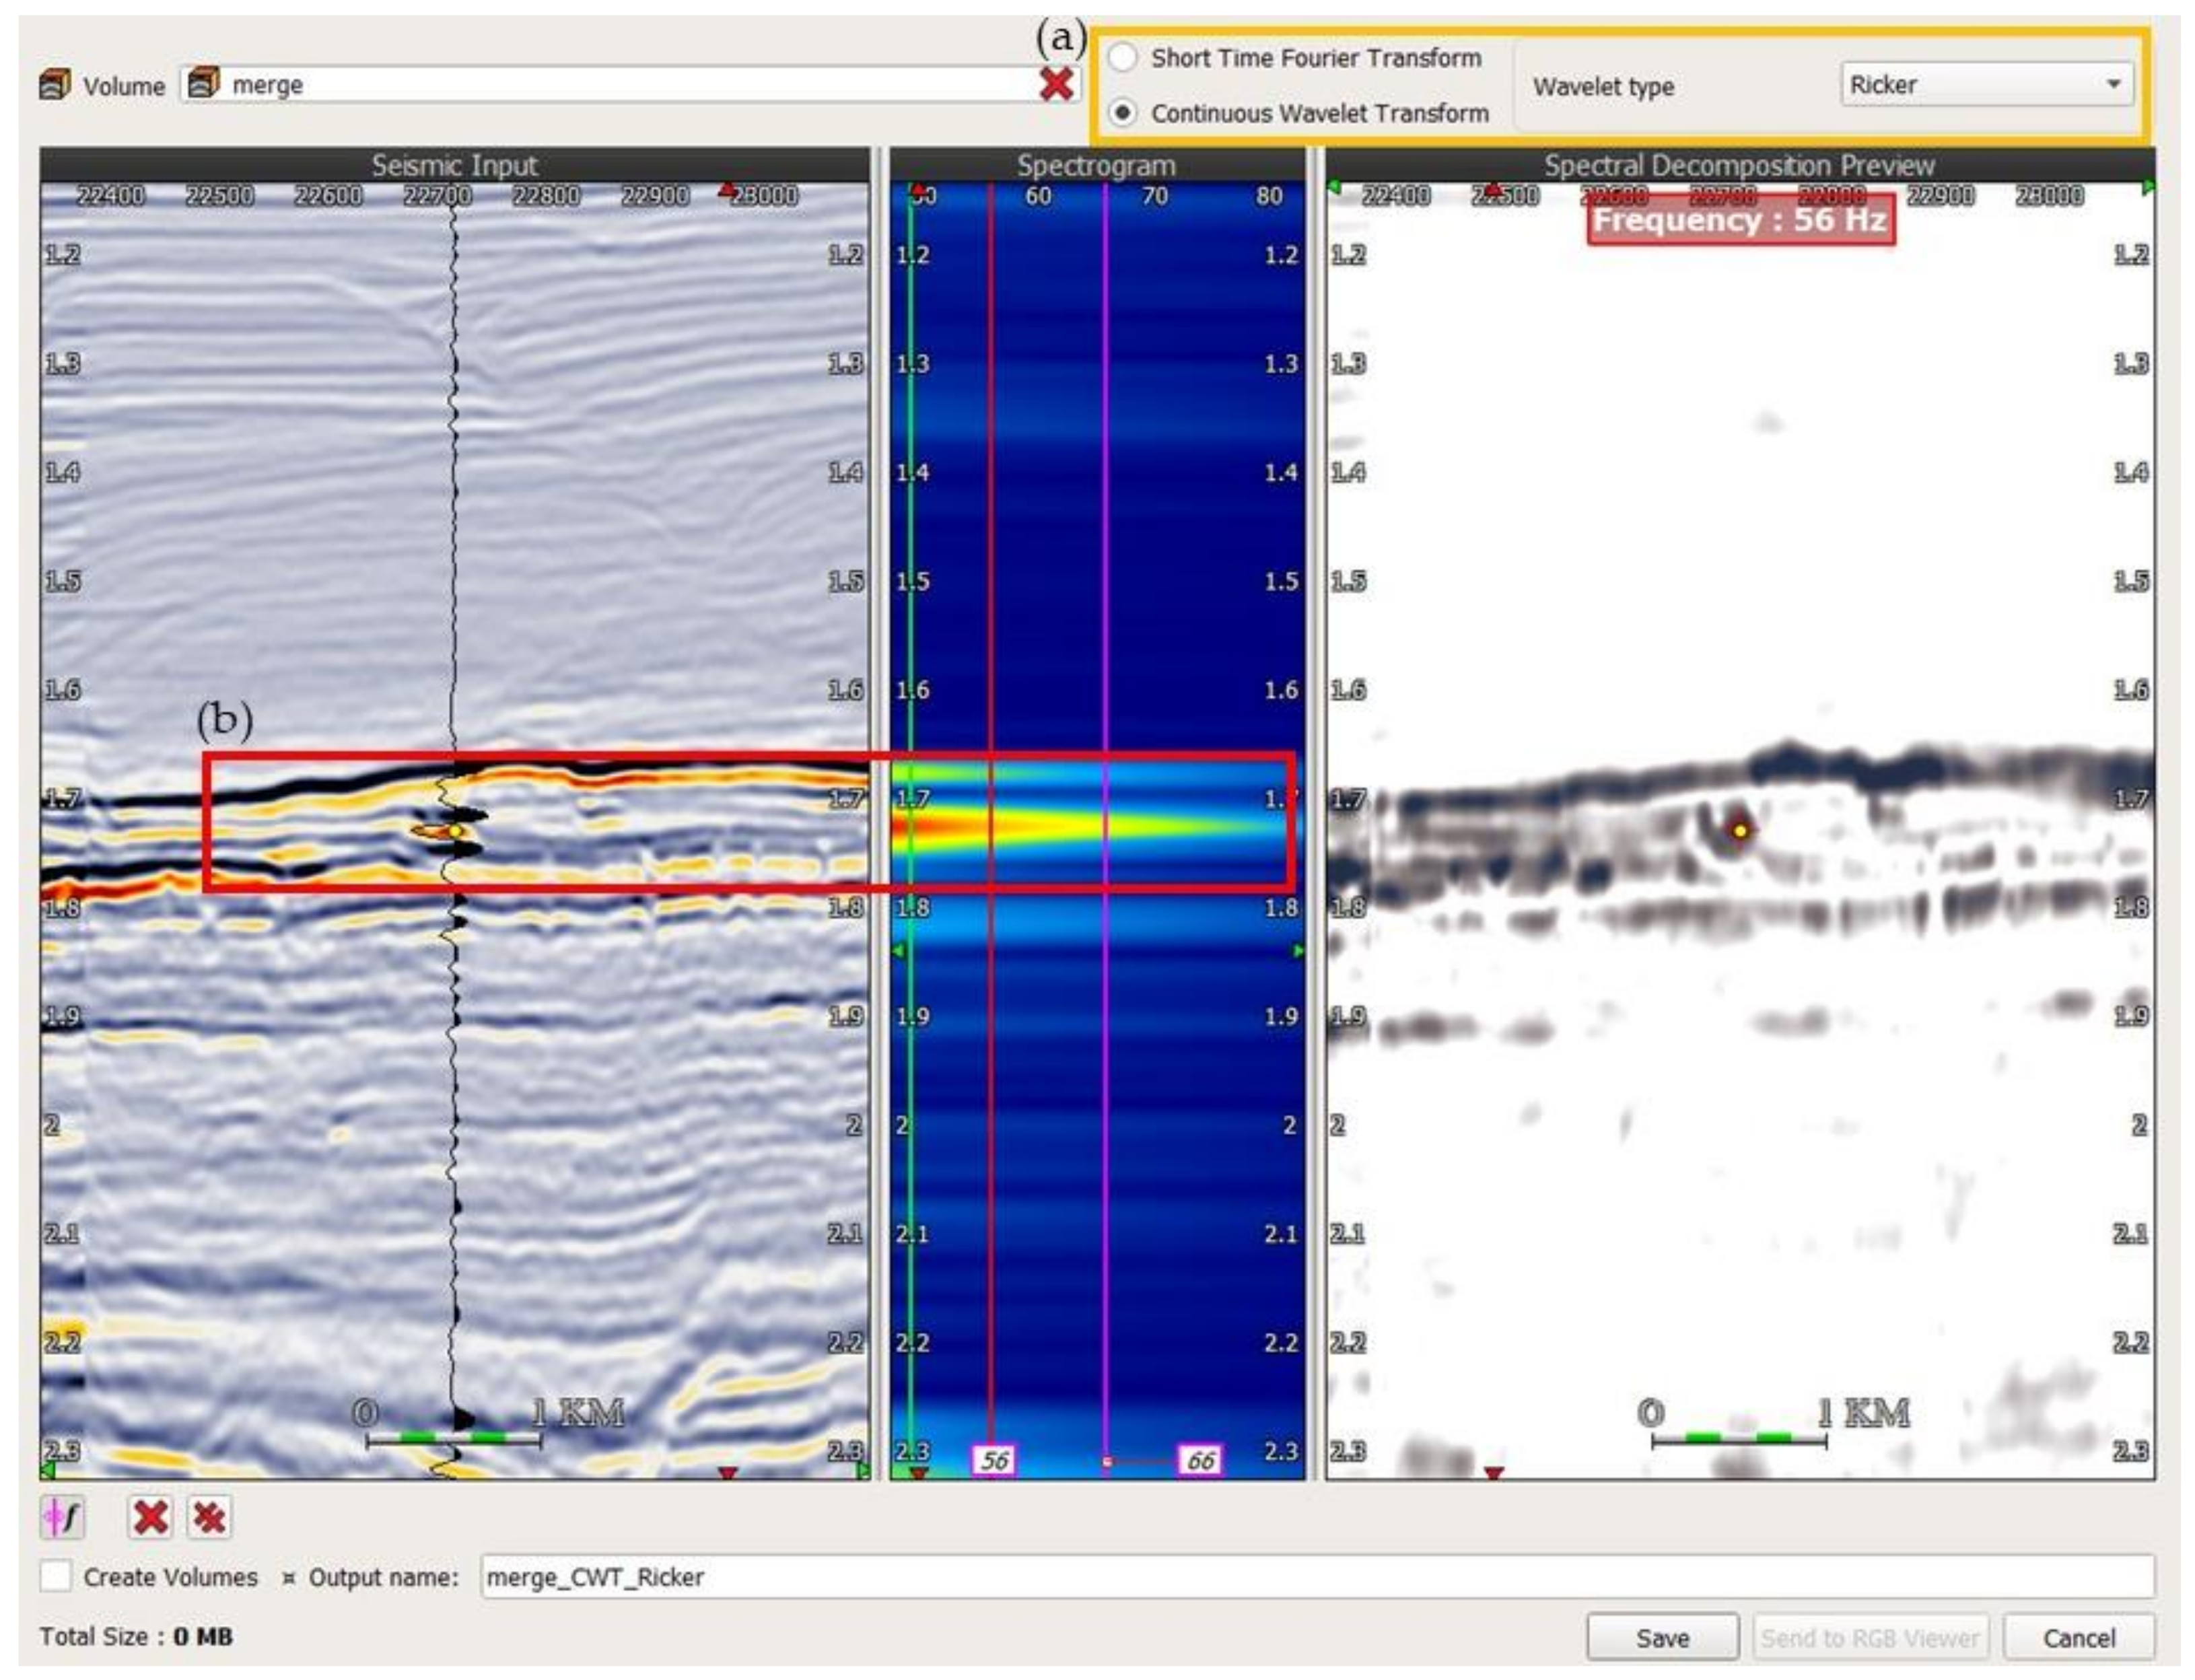
3.2. Spectral Decomposition
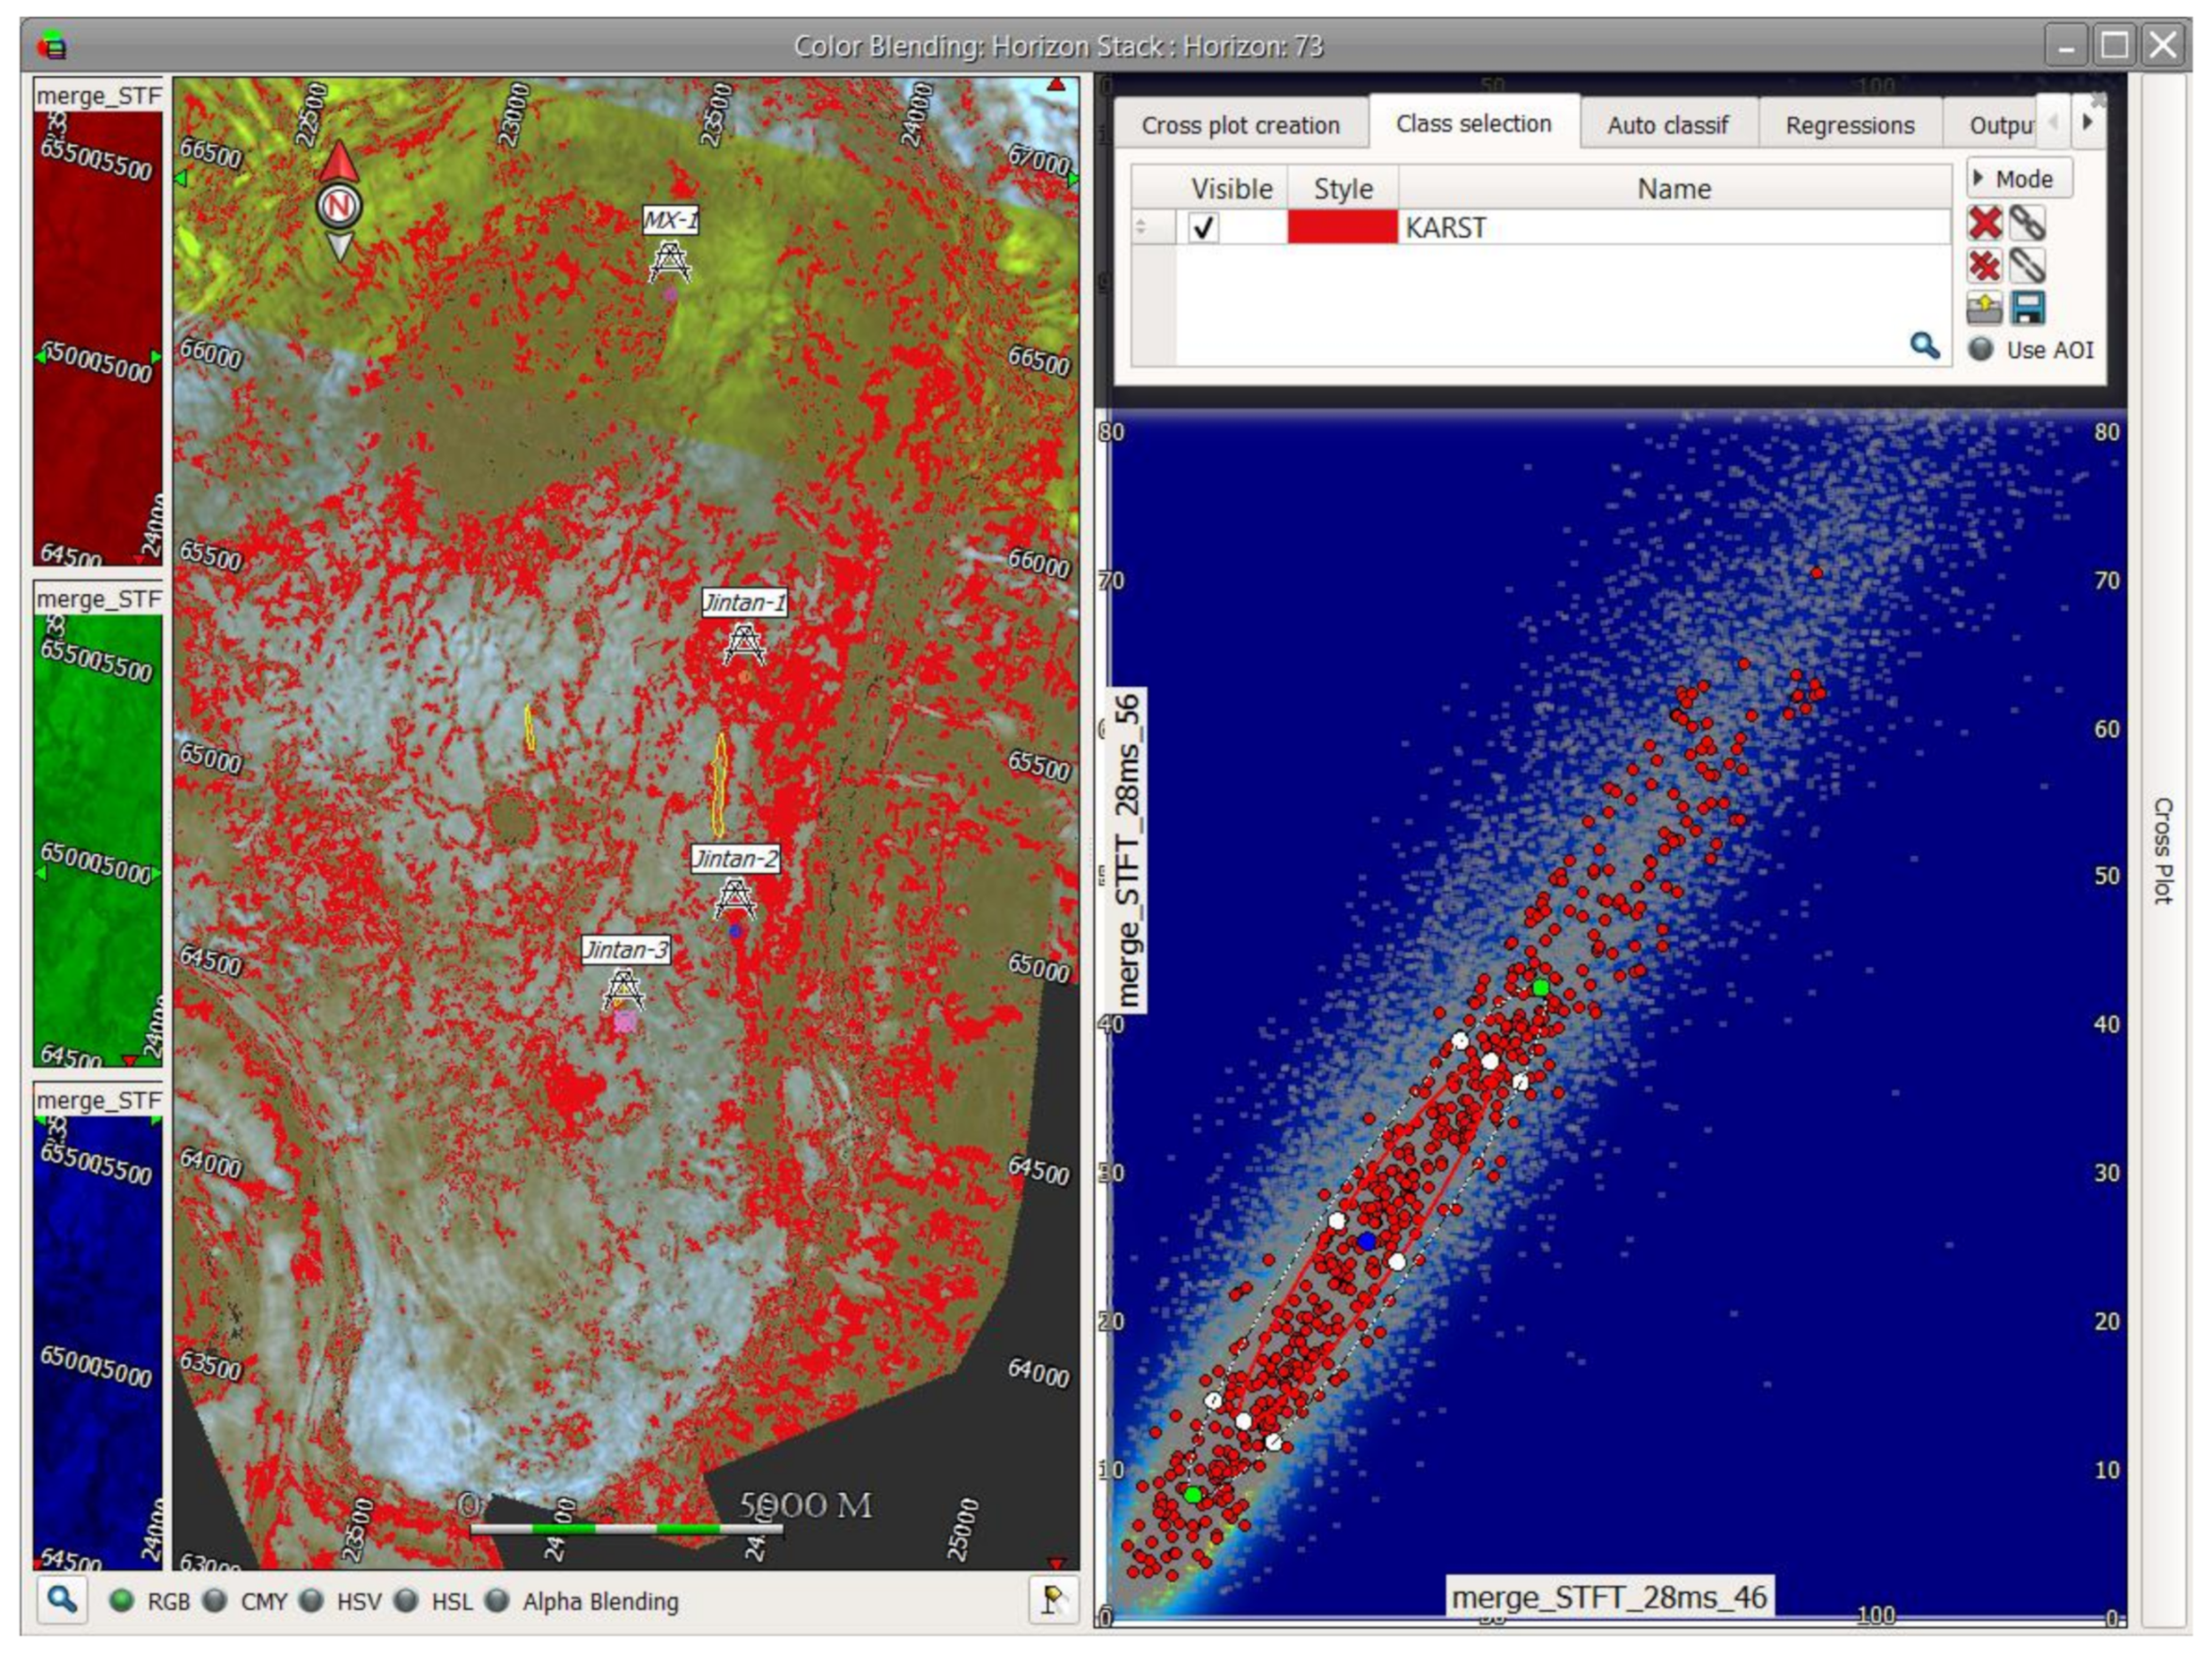
3.3. Cross Plot
4. Results and Discussions
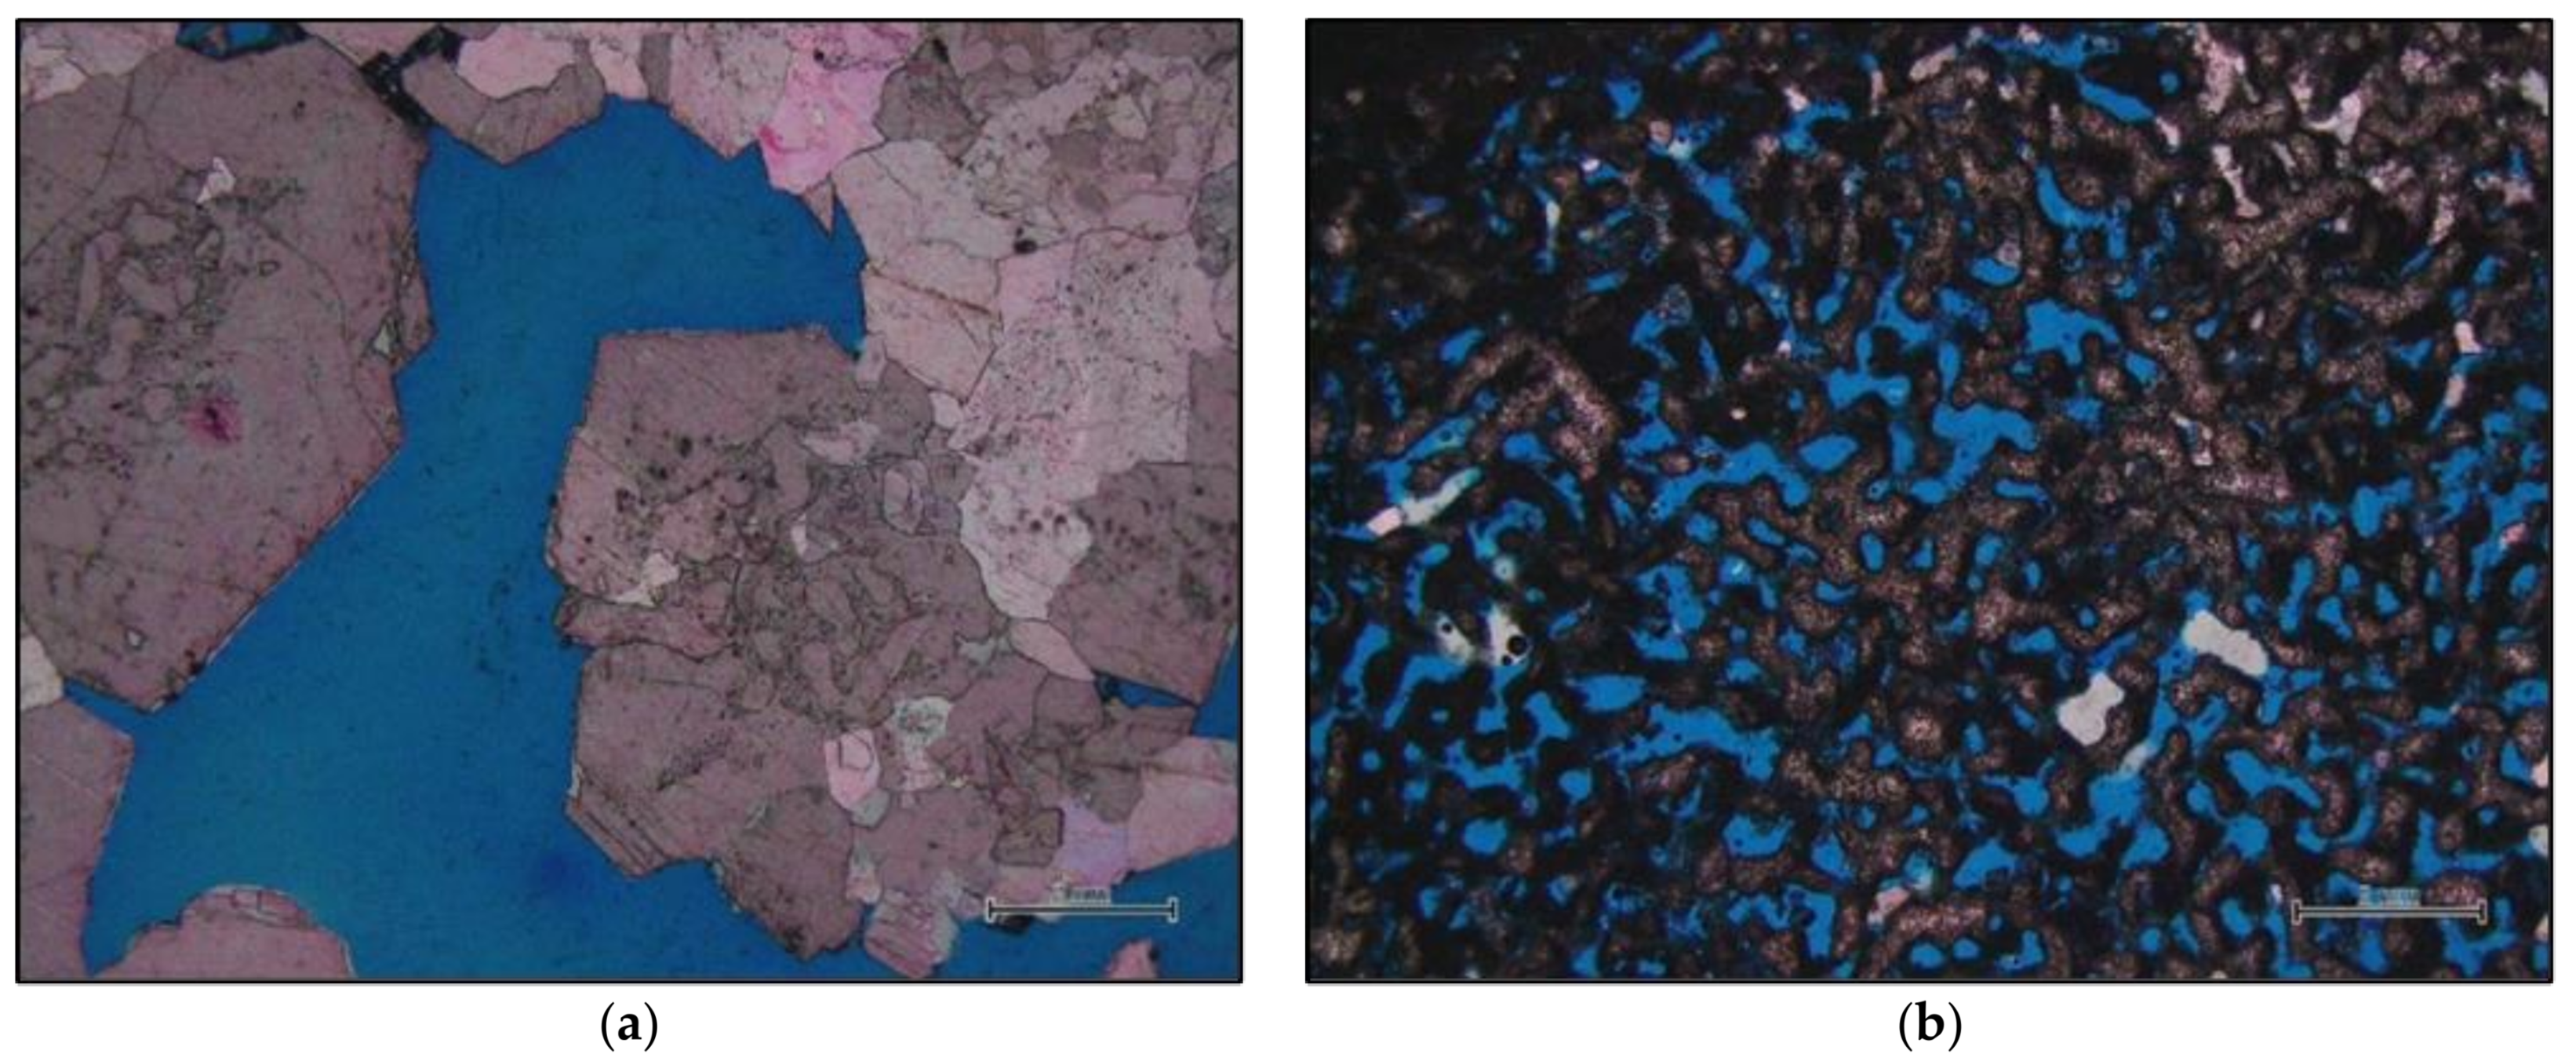
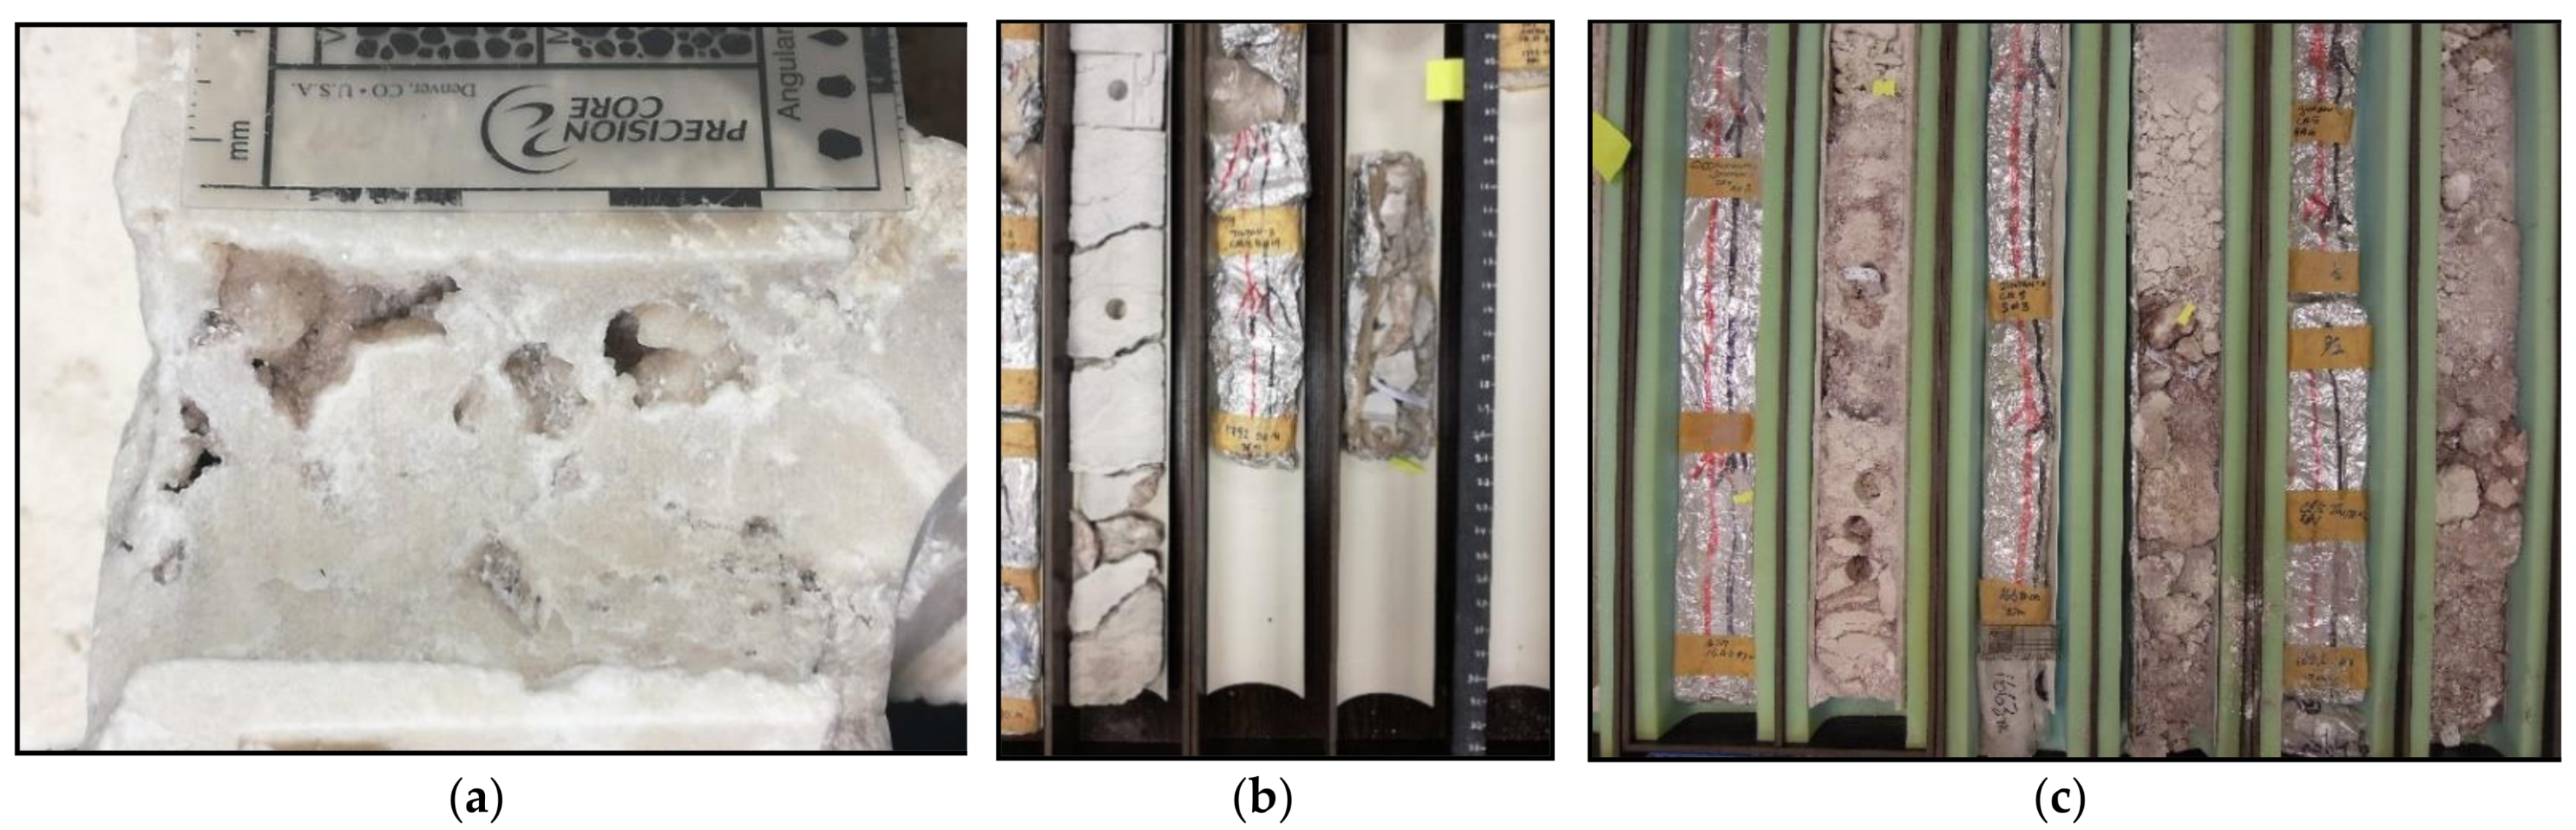
4.1. Loss Circulation Depth, Thin Sections and Core Description Analysis
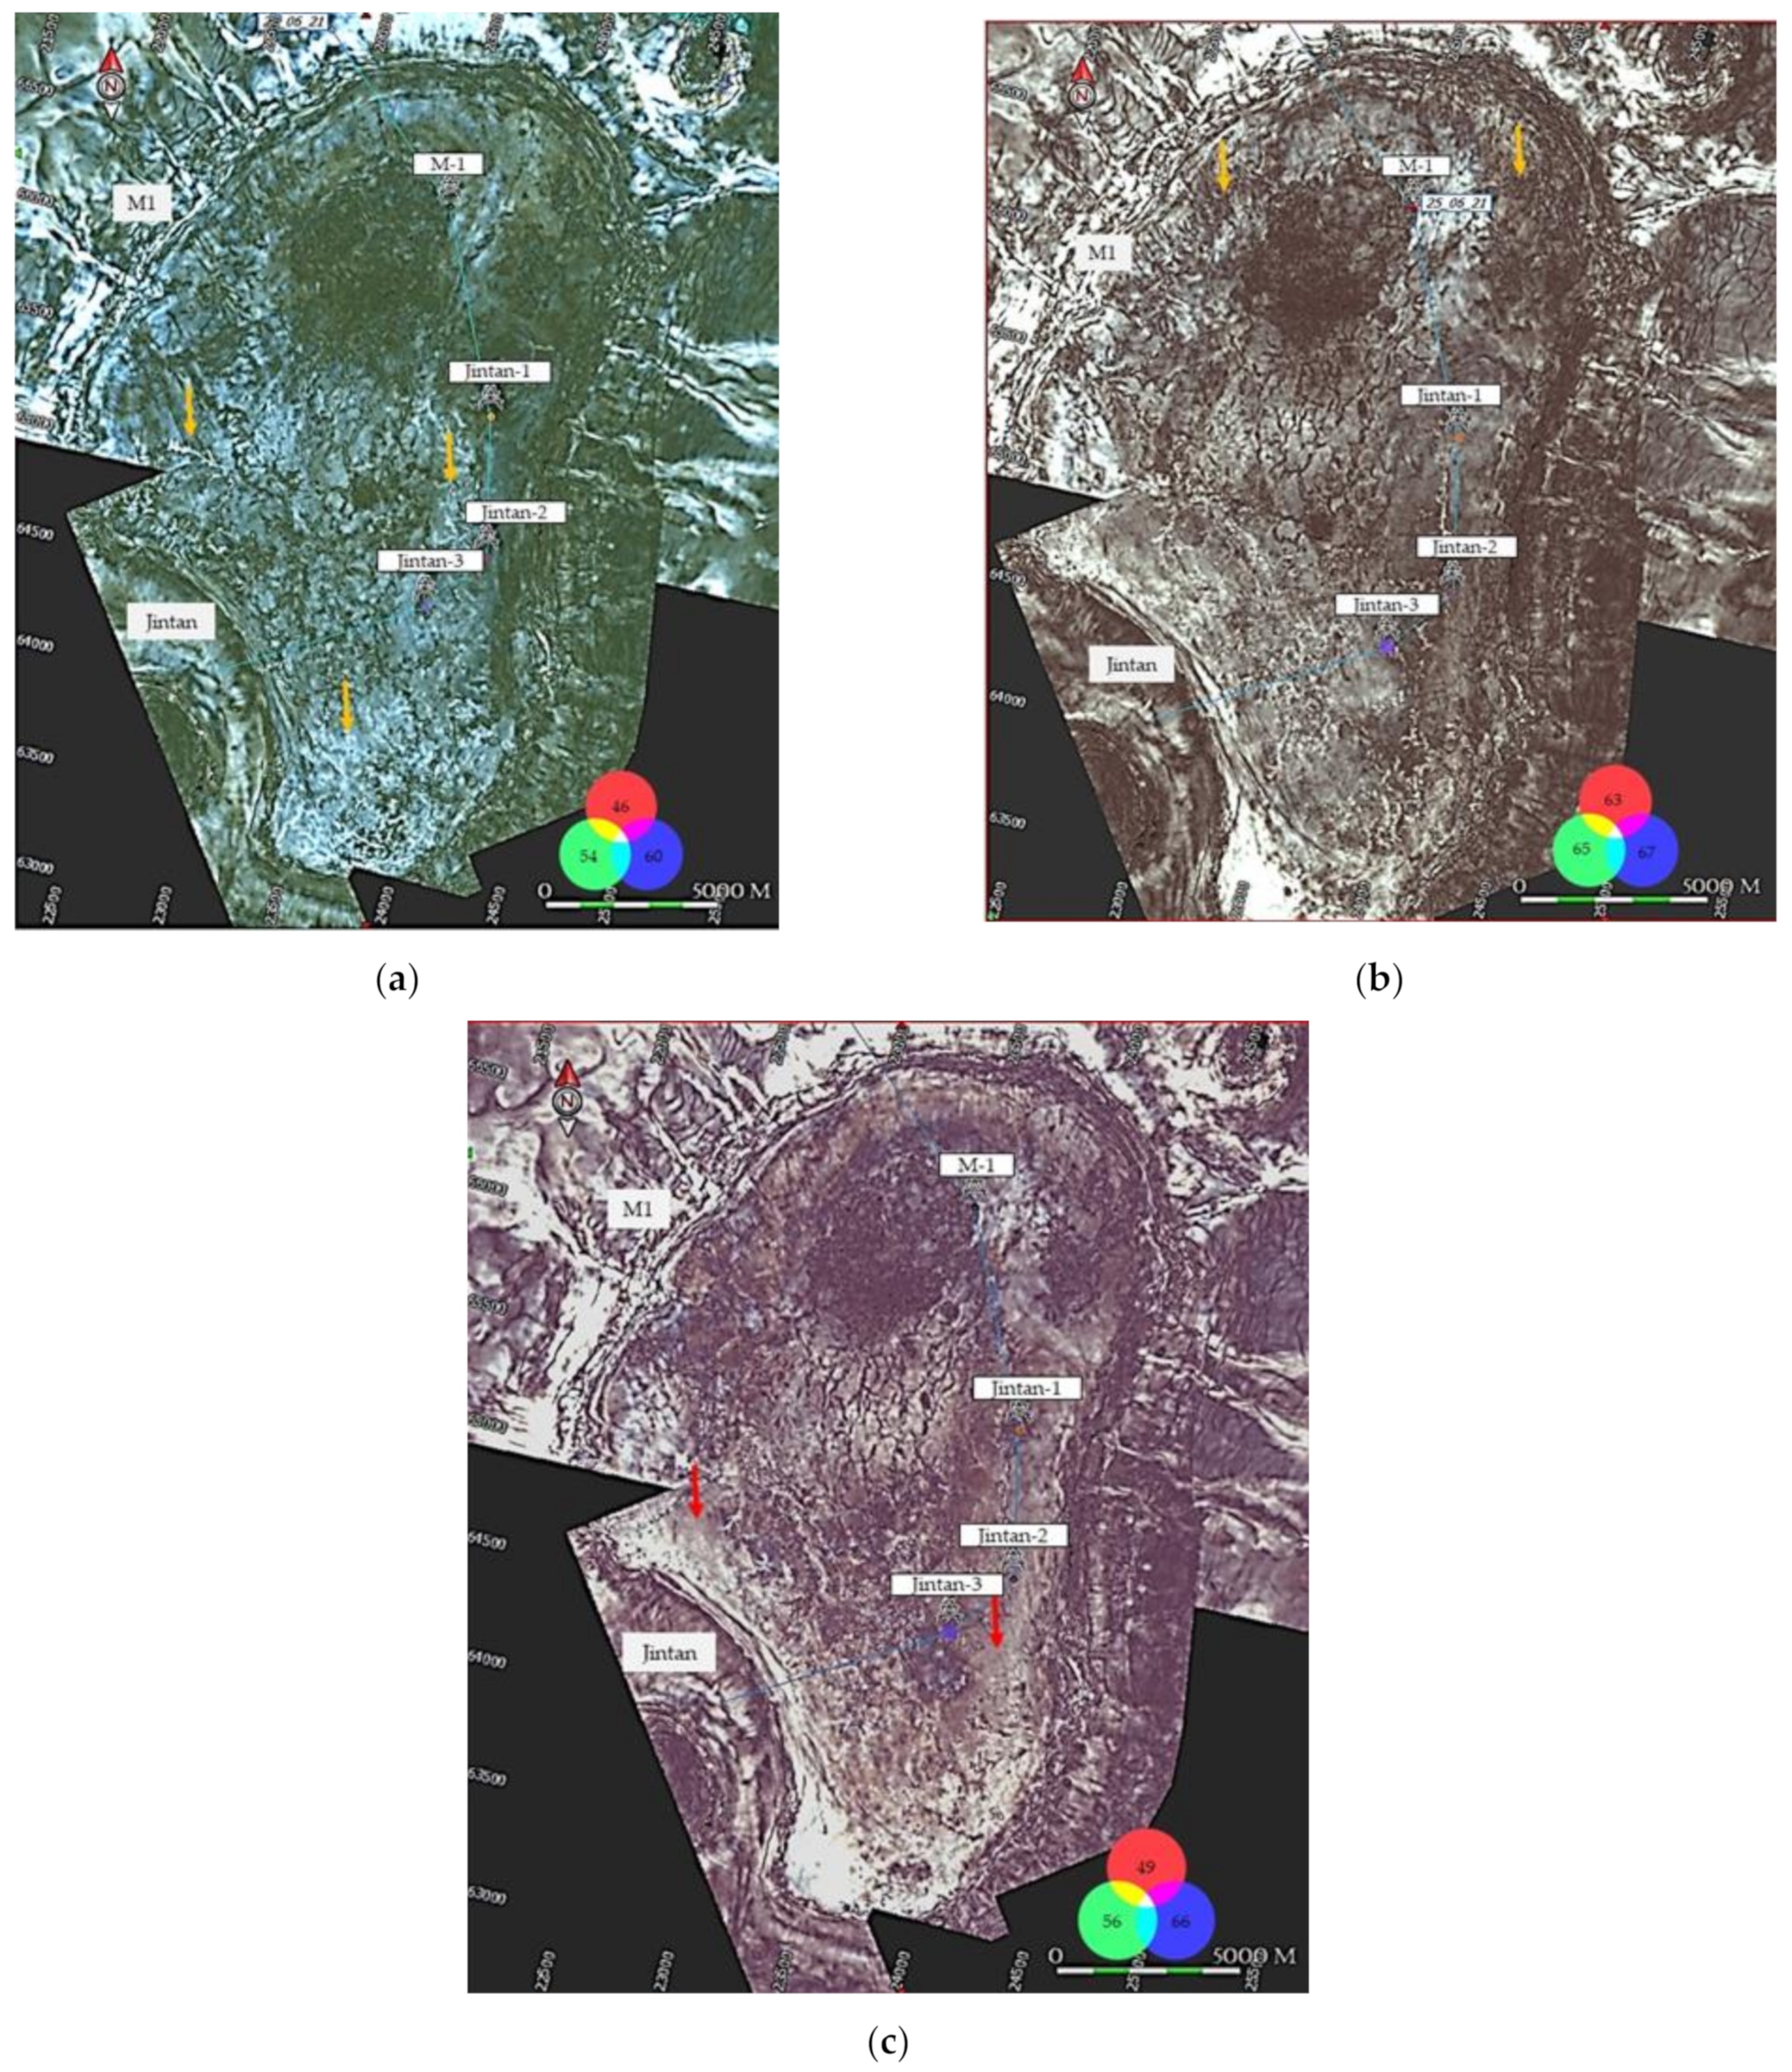
4.2. Spectral Decomposition Short-Time Fourier Transform (STFT), Continuous Wavelet Transform (CWT) Morlet, and CWT Ricker Methods
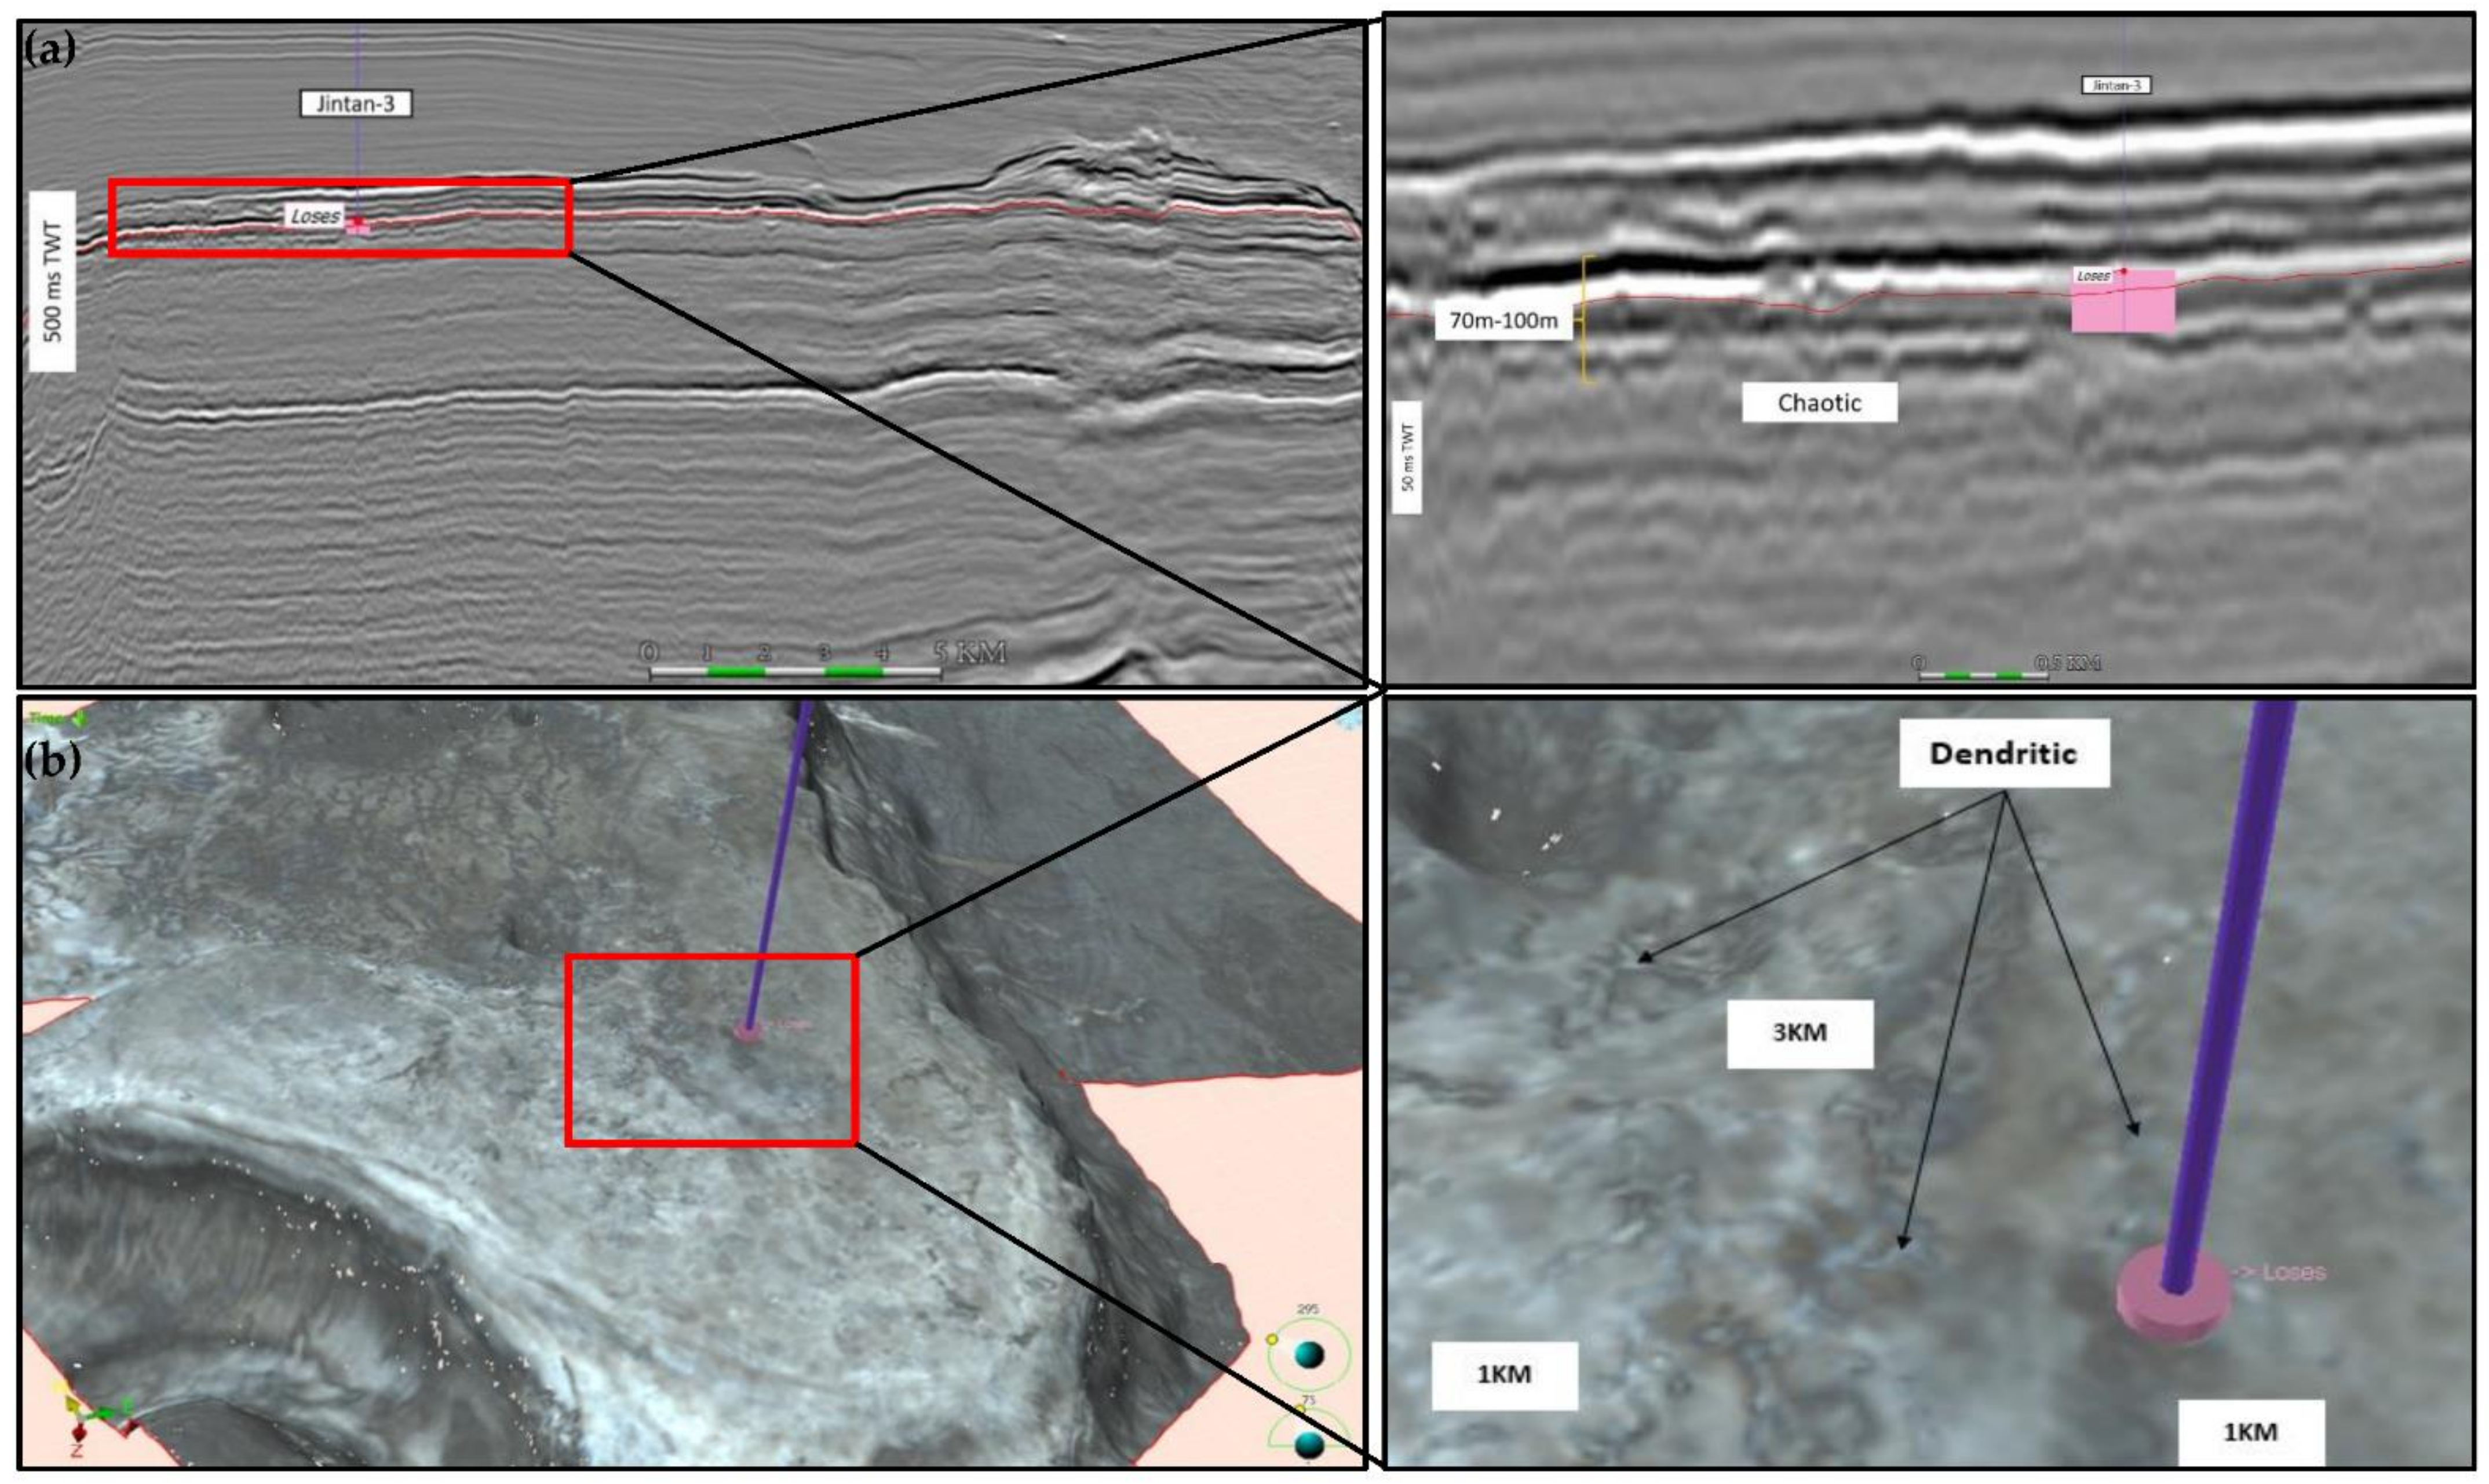
4.3. Evolution of Karst on Jintan and M1 Platform
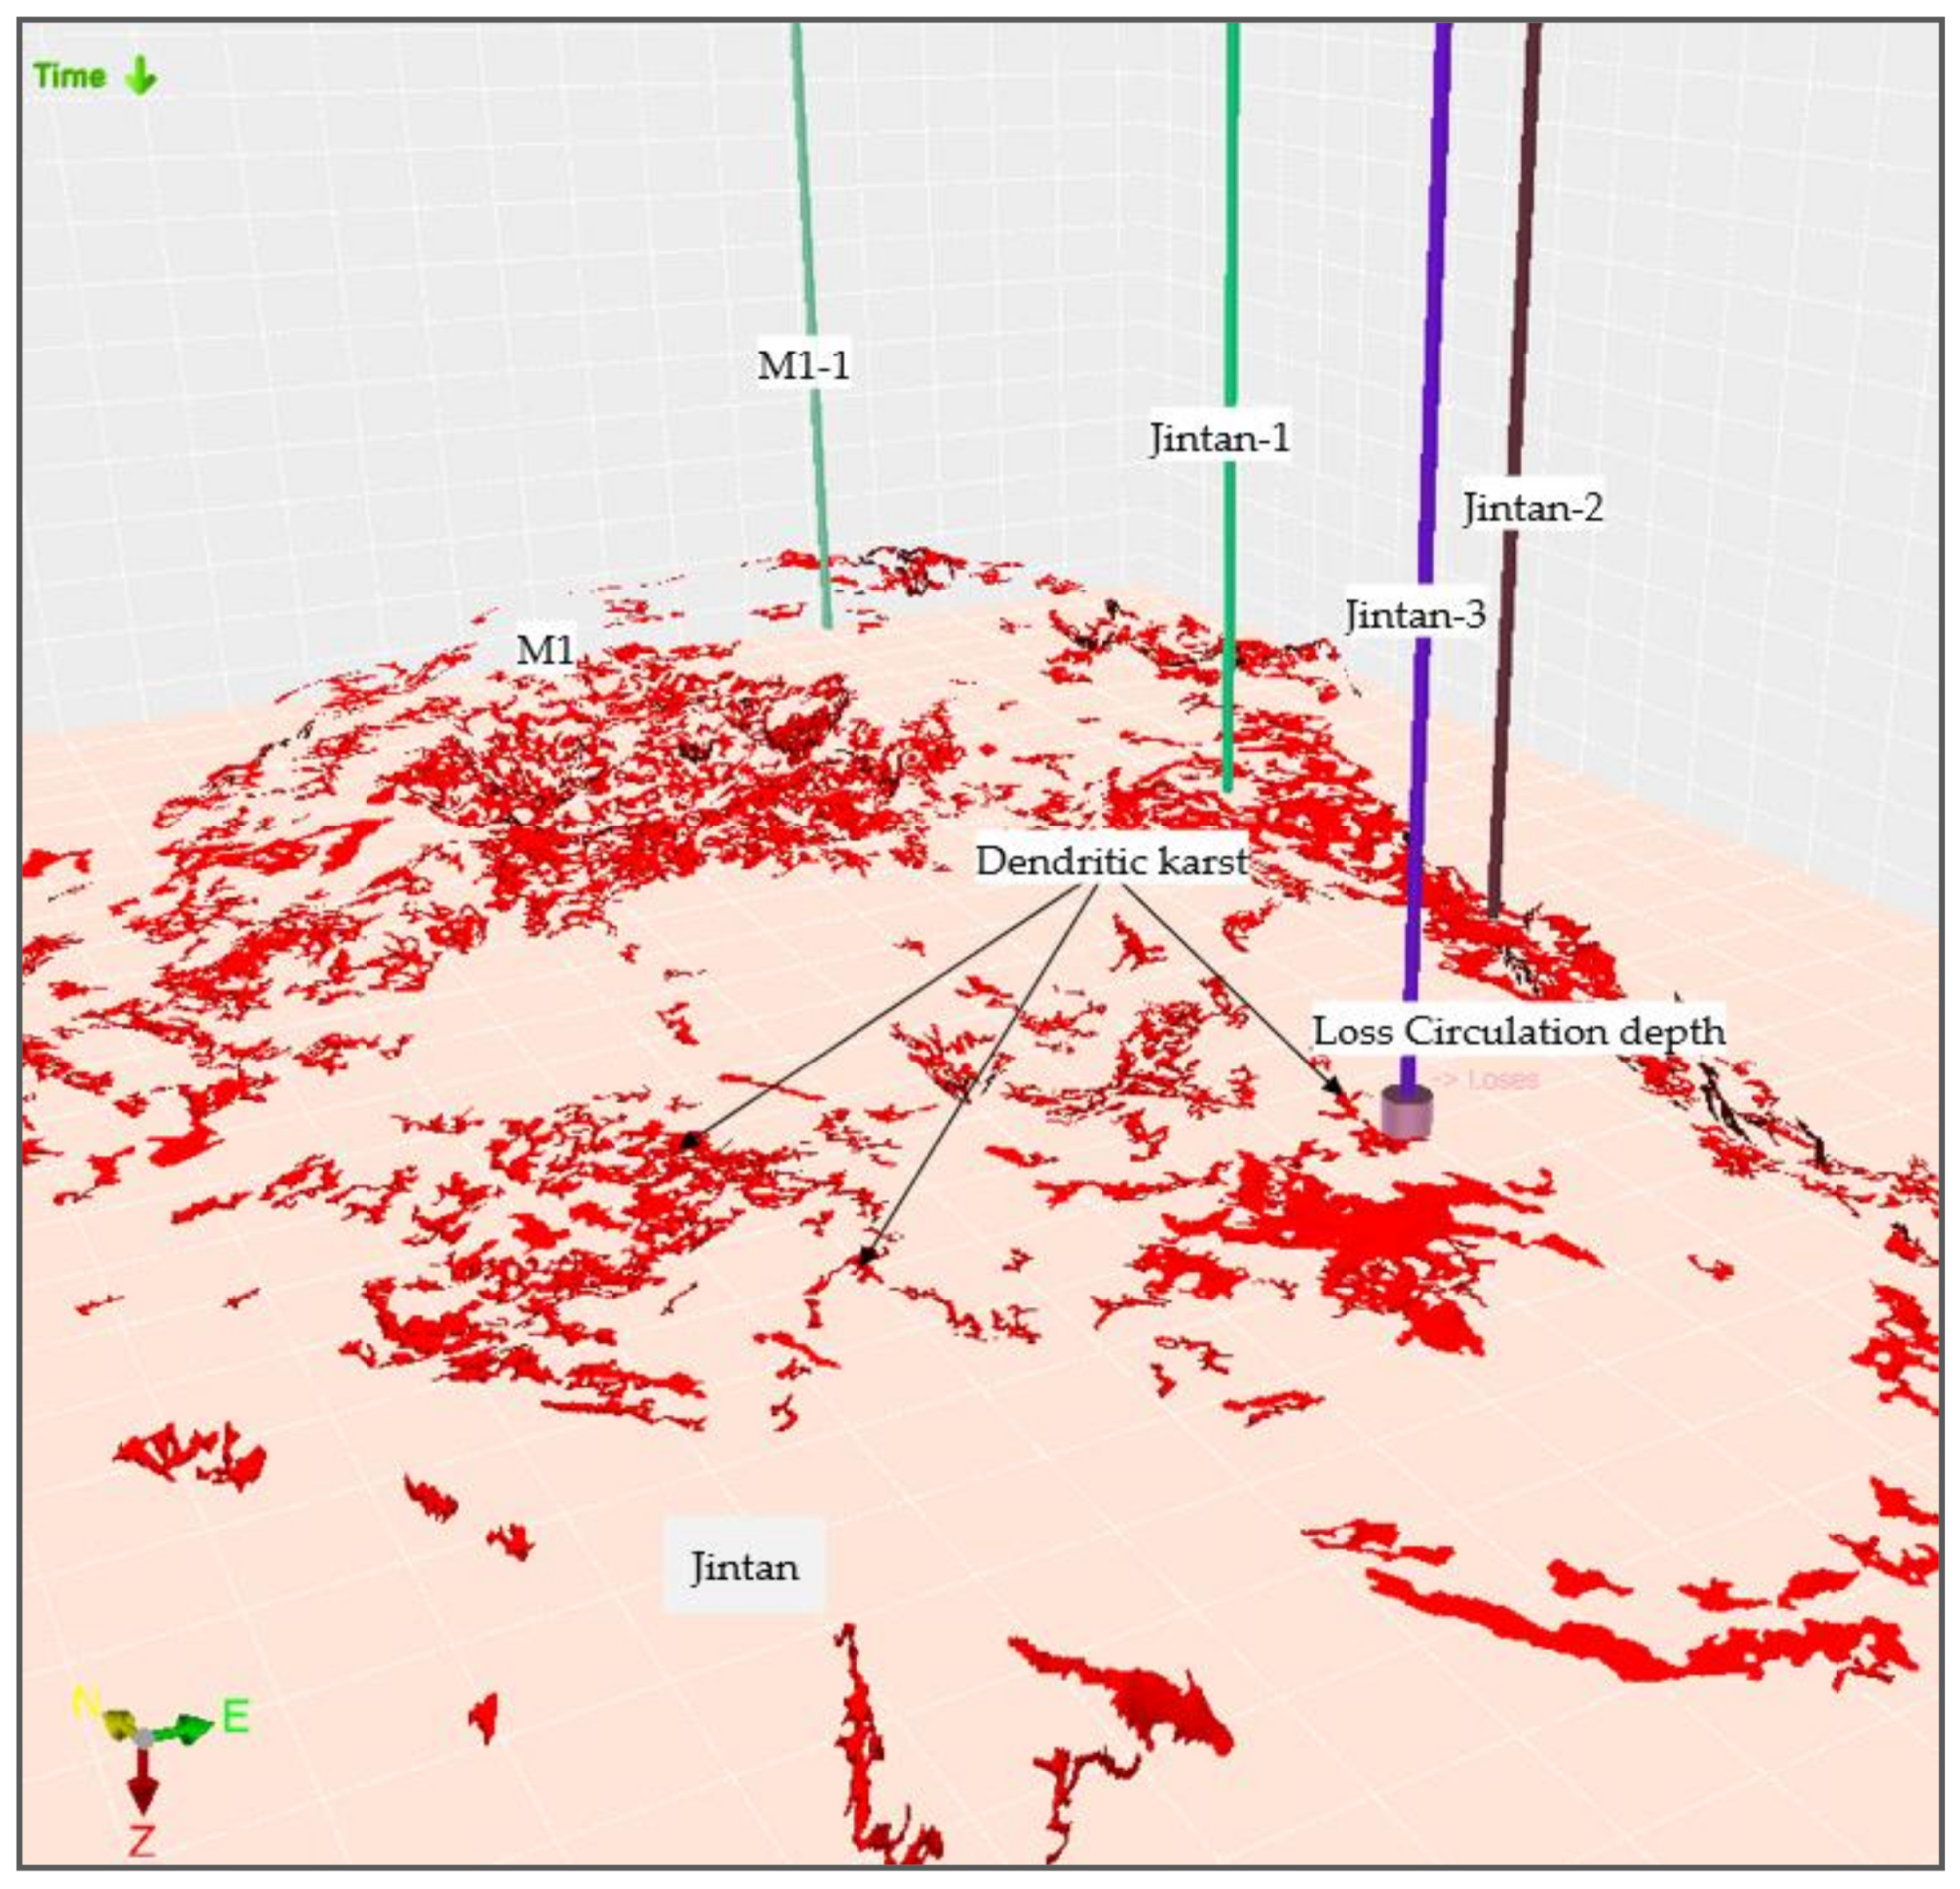
4.4. Volumetric Estimation of Karst
5. Conclusions
Author Contributions
Funding
Institutional Review Board Statement
Informed Consent Statement
Data Availability Statement
Acknowledgments
Conflicts of Interest
References
- Mylroie, J.E.; Carew, J.L. Karst development on carbonate islands. AAPG Mem. 1995, 63, 55–76. [Google Scholar]
- Columbia, B. Karst Management Handbook for British Columbia, 1st ed.; Ministry of Forests: Victoria, BC, Canada, 2003; pp. 1–69.
- Ford, D.; Williams, P.D. Karst Hydrogeology and Geomorphology; John Wiley & Sons: Hoboken, NJ, USA, 2013. [Google Scholar]
- Palmer, A.N. Variation in rates of karst processes. Acta Carsologica 2007, 36, 15–24. [Google Scholar] [CrossRef] [Green Version]
- Epting, M. Sedimentology of Miocene Carbonate Buildups, Central Luconia, Offshore Sarawak. Bull. Geol. Soc. Malays. 1980, 12, 17–30. [Google Scholar] [CrossRef]
- Vahrenkamp, V.C. Miocene carbonates of the Luconia province, offshore Sarawak: Implications for regional geology and reservoir properties from strontium-isotope stratigraphy. Bull. Geol. Soc. Malays. 1998, 42, 1–13. [Google Scholar] [CrossRef]
- Kosters, M.; Hague, P.F.; Hofmann, R.A.; Hughes, B.L.; Berhard, S.S. Integrated Modeling of Karstification of a Central Luconia Field, Sarawak. In Proceedings of the International Petroleum Technology Conference, Kuala Lumpur, Malaysia, 3–5 December 2008. [Google Scholar]
- Ting, K.K.; Chung, E.; Al Jaaidi, O. Evolution and controlling factors of Miocene carbonate build-up in Central Luconia, SE Asia: Insights from integration of geological and seismic characterization. In Proceedings of the Integrated Petroleum Engineering and Geosciences (ICIPEG), Kuala Lumpur, Malaysia, 16 June 2010. [Google Scholar]
- Chung, E.; King, T.K.; AlJaaidi, O. Karst Modeling of a Miocene Carbonate Build-Up in Central Luconia, SE Asia: Challenges in Seismic Characterisation and Geological Model Building. In Proceedings of the International Petroleum Technology Conference, Bangkok, Thailand, 7–9 February 2012. [Google Scholar]
- Jamaludin, S.N.F.; Mubin, M.; Latiff, A.H.A. Imaging of karst on buried Miocene Carbonate Platform. In Proceedings of the IOP Conference Series: Earth and Environmental Science, Bali, Indonesia, 20–21 May 2017. [Google Scholar] [CrossRef] [Green Version]
- Warrlich, G.M.; Adams, E.W.; Ryba, A.; Tam, T.; Ting, K.K.; Tang, H.K. What matters for flow and recovery in carbonate gas reservoirs: Insights from the mature Central Luconia Province, offshore Sarawak, Malaysia. AAPG Bull. 2019, 103, 691–721. [Google Scholar] [CrossRef]
- Yusliandi, A.; Sautter, B.; Poppelreiter, M.C. The various controls on the platform architecture of carbonate buildups in the Central Luconia Province, offshore Sarawak. Pet. Coal 2019, 61, 1425–1437. [Google Scholar]
- Rahman, S.S.A.; Beg, M.A.; Soto, G.J.; Bing, S.B.; Lubis, L.A.; Poppelreiter, M.C. Seismic multiattributes characterisation of Karst distribution pattern in an isolated Middle Miocene carbonate platform: FX field, Central Luconia Province Malaysia. Pet. Coal 2021, 63, 139–150. [Google Scholar]
- Makhankova, A.; Sautter, B.; Mathew, M.; Menier, D.; Poppelreiter, M. Seismic stratigraphy and sedimentology of a Miocene carbonate platform in Luconia, South China Sea. Geol. J. 2021, 56, 1–17. [Google Scholar] [CrossRef]
- Warrlich, G.E.; Taberner, C.O.; Asyee, W.E.; Stephenson, B.; Esteban, M.A.; Boya-Ferrero, M.A.; Dombrowski, A.N.; Van Konijnenburg, J.H. The impact of postdepositional processes on reservoir properties: Two case studies of Tertiary carbonate buildup gas fields in Southeast Asia (Malampaya and E11). In Cenozoic Carbonate Systems of Australasia; Society for Sedimentary Geology: Broken Arrow, OK, USA, 2010; Volume 95, pp. 99–127. [Google Scholar]
- Mylroie, J.R.; Mylroie, J.E. Development of the carbonate island karst model. J. Cave Karst Stud. 2007, 69, 59–75. [Google Scholar]
- Larson, E.B.; Mylroie, J.E. Diffuse versus conduit flow in coastal karst aquifers: The consequences of island area and perimeter relationships. Geosciences 2018, 8, 268. [Google Scholar] [CrossRef] [Green Version]
- Teillet, T.; Fournier, F.; Borgomano, J.; Montaggioni, L. Seismic-based paleoenvironmental reconstructions of carbonate systems: Pitfalls, limitations and perspectives-Reply to the comments on “Development patterns of an isolated oligo-mesophotic carbonate buildup, early Miocene, Yadana field, offshore Myanmar”. Mar. Pet. Geol. 2020, 124, 104816. [Google Scholar] [CrossRef]
- Bashir, Y.; Faisal, M.A.; Biswas, A.; abbas Babasafari, A.; Ali, S.H.; Imran, Q.S.; Ehsan, M. Seismic expression of miocene carbonate platform and reservoir characterization through geophysical approach: Application in central Luconia, offshore Malaysia. J. Pet. Explor. Prod. 2021, 11, 1533–1544. [Google Scholar]
- Soto, G.J.; Beg, M.A.; Pöppelreiter, M.C.; Rahmatsyah, K. Multiple Point Statistics Carbonate Facies Modelling Workflow using Core Data and Spectral Decomposition Attributes: A Case Study from TX Field in Central Luconia Province, Malaysia. Pet. Coal 2020, 62, 1209–1224. [Google Scholar]
- Othman, A.A.; Fathy, M.; Maher, A. Use of spectral decomposition technique for delineation of channels at Solar gas discovery, offshore West Nile Delta, Egypt. Egypt. J. Pet. 2016, 25, 45–51. [Google Scholar] [CrossRef] [Green Version]
- Vahrenkamp, V.C.; Frank, D.; Peter, D.; Mark, N.; Paul, C. Growth architecture, faulting, and karstification of a middle Miocene carbonate platform, Luconia Province, offshore Sarawak, Malaysia. AAPG Mem. 2004, 81, 329–350. [Google Scholar]
- Pauget, F.; Lacaze, S.; Valding, T. A global approach in seismic interpretation based on cost function minimization. In SEG Technical Program Expanded Abstracts; Society of Exploration Geophysicists: Tulsa, OK, USA, 2009; pp. 2592–2596. [Google Scholar]
- Ellaithy, T.; Prexl, A.; Daynac, N. A review of “global” interpretation methods for automated 3D horizon picking. Semathic Sch. 2006, 30, 38–47. [Google Scholar]
- Shokrollahi, E.; Zargar, G.; Riahi, M.A. Using continuous wavelet transform and short time Fourier transform as spectral decomposition methods to detect of stratigraphic channel in one of the Iranian south-west oil fields. Int. J. Sci. Emerg. Technol. 2013, 5, 291–299. [Google Scholar]
- Melim, L.A.; Swart, P.K.; Eberli, G.P. Mixing-zone diagenesis in the subsurface of Florida and the Bahamas. J. Sediment. Res. 2004, 74, 904–913. [Google Scholar] [CrossRef]


| Materials | Description | Methodology |
|---|---|---|
| Drilling data | Final well reports of Jintan-1, Jintan-2, Jintan-3 and M1-1 wells. | Lost circulation depths recorded to preliminary identify the depth of possible karst in each platform. |
| Well logs | Gamma ray logs of Jintan-1, Jintan-2, Jintan-3 and M1-1 wells. | Seismic to well-tie analysis. |
| Thin Section | 32 units of Jintan-2 thin sections 38 units of Jintan-3 thin sections | Identification of pore type and cement related to dissolution diagenesis to understand karst morphology. |
| Core data | 84 m of Jintan-2 core and 207 m of Jintan-3 core described. | The depth of chalkified and rubble intervals recorded. |
| 3D Seismic | Jintan & M1 merged 3D cube seismic | Karst horizon interpretation. Spectral decomposition techniques application. |
| Methods | Karst % on Jintan | Karst % on M1 |
|---|---|---|
| STFT | 65 | 50 |
| CWT Morlet | 52 | 51 |
| CWT Ricker | 42 | 36 |
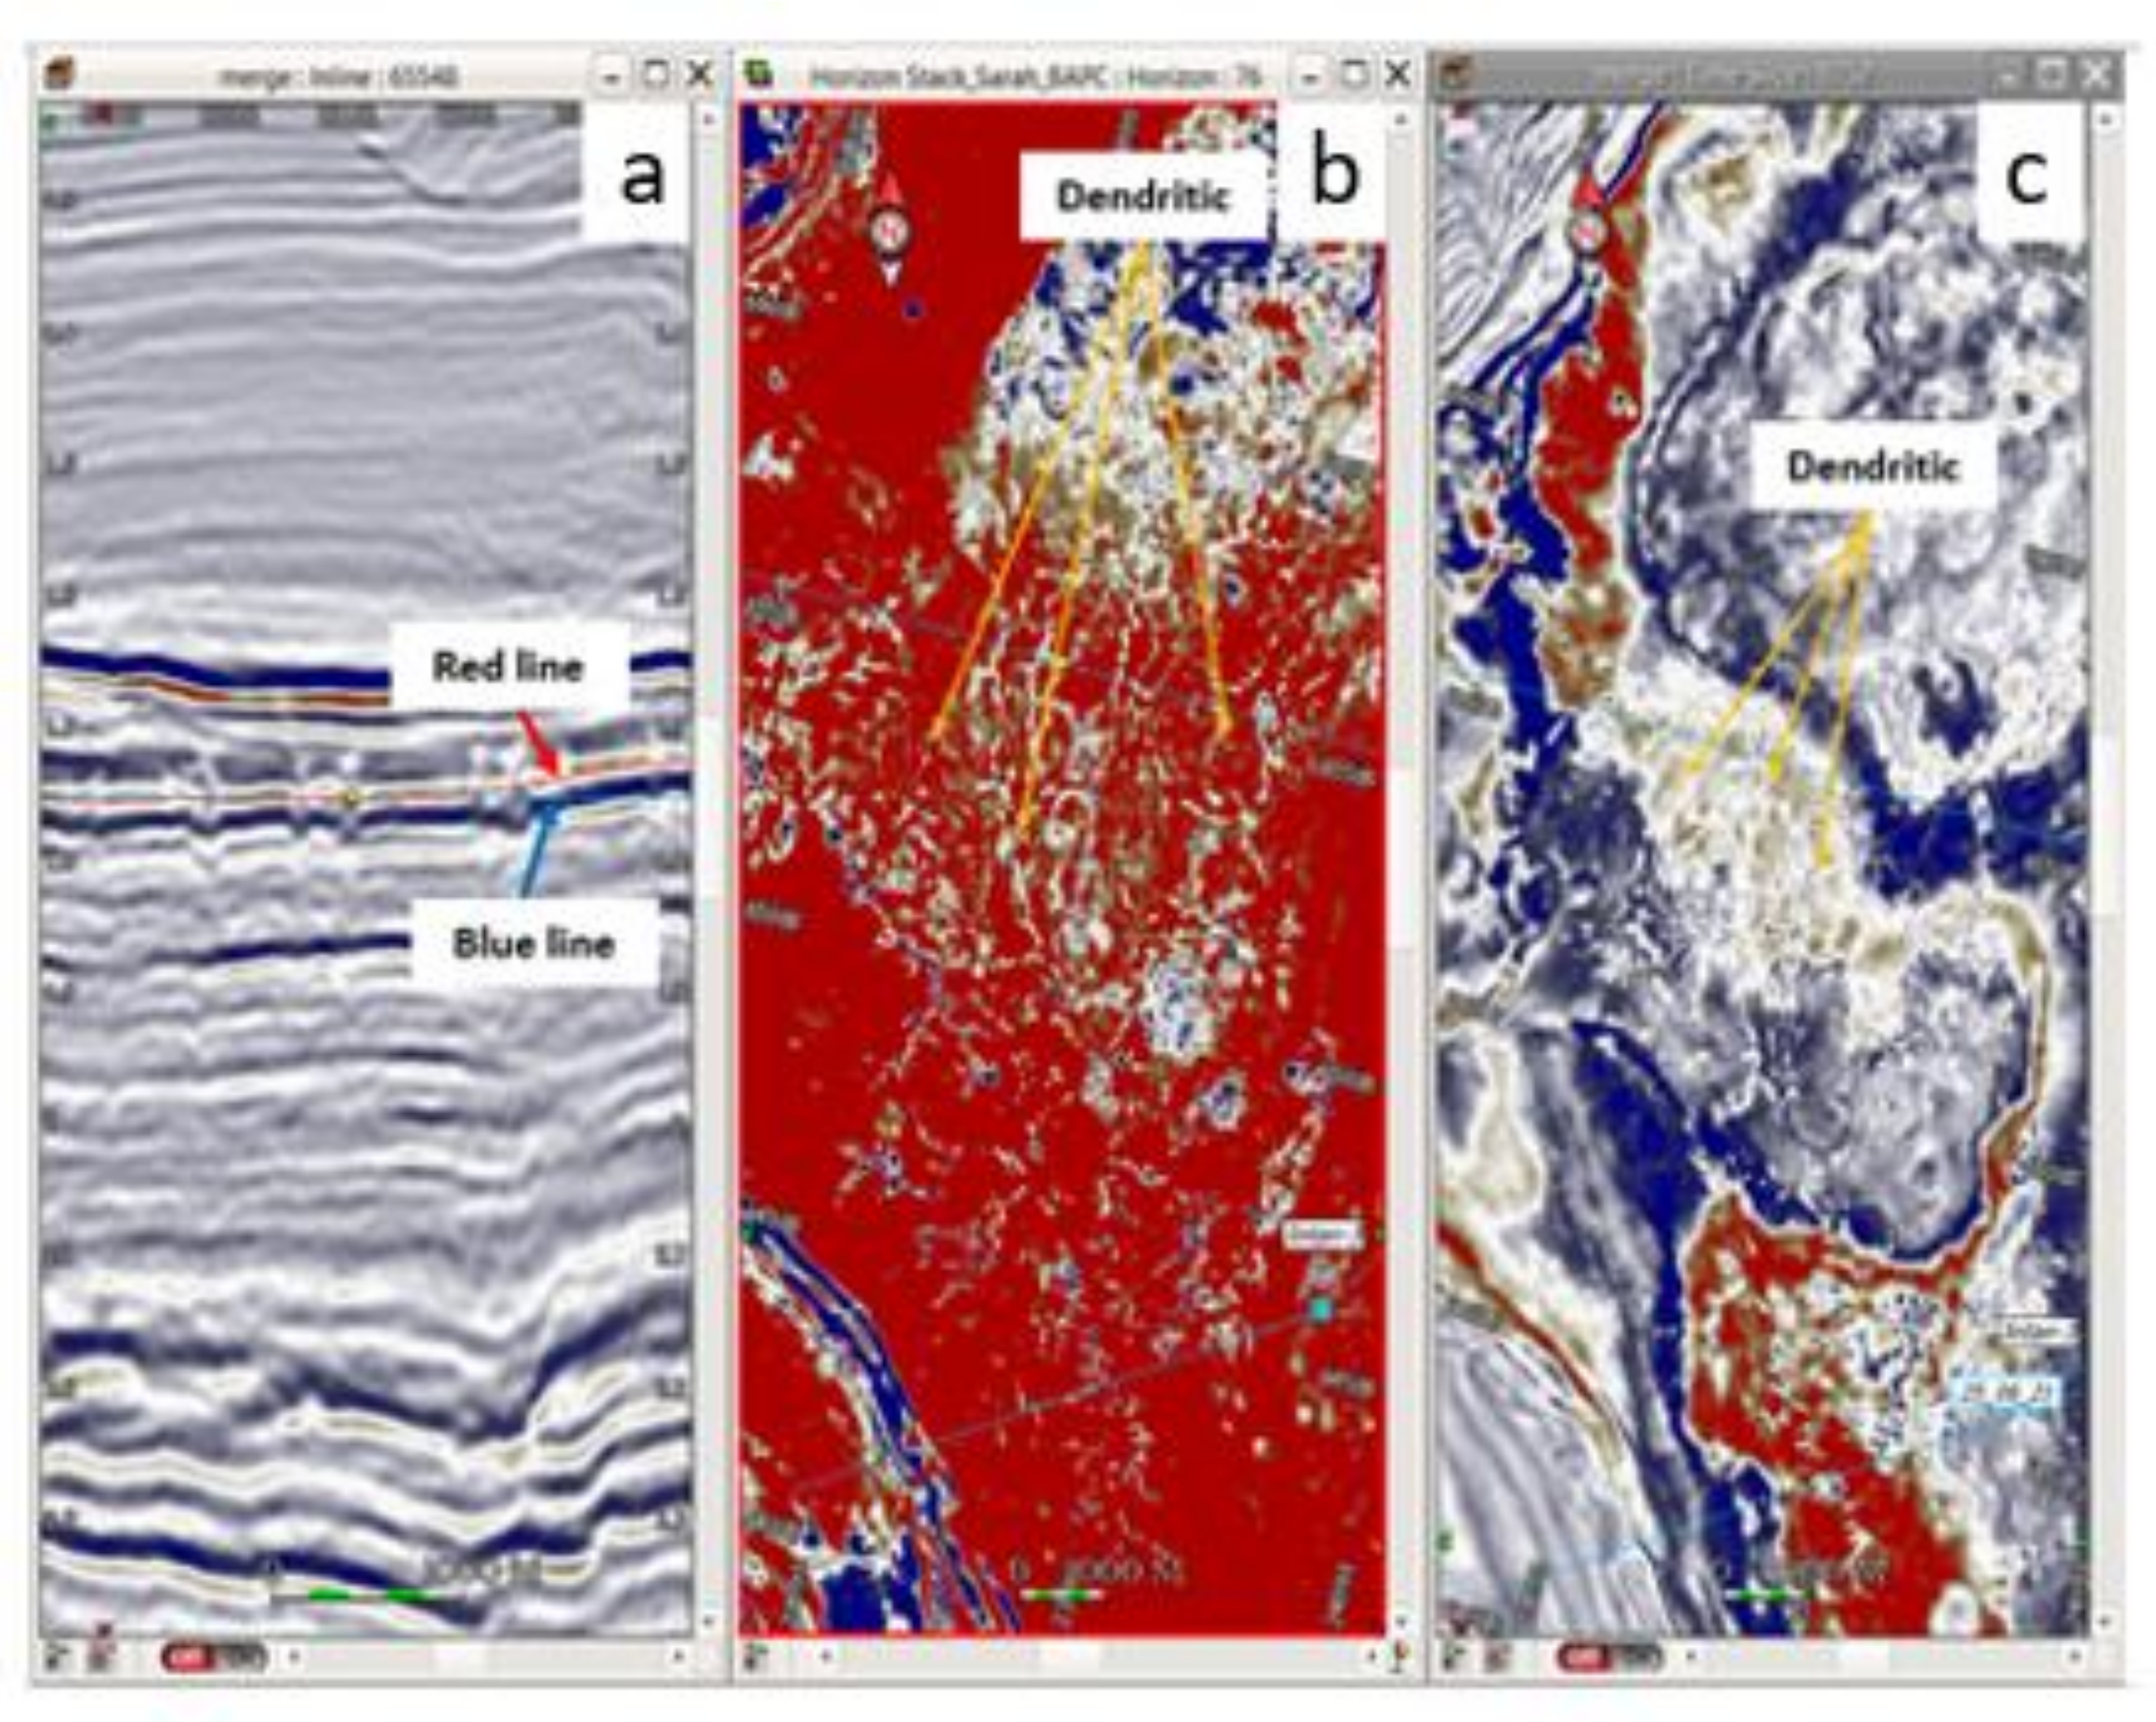
| Platform | Shape | Quantitative Interpretation | Most Concentrated Area |
|---|---|---|---|
| Jintan | Dendritic | ≥70–100 m deep 3–5 km long ≥500 m wide | Lagoon |
| Circular/sinkhole | ≤1 km in diameter | Lagoon | |
| M1 | Dendritic | 1–2 km long ≥500 m wide | Close to reef rim and lagoon |
| Data | Karst Features |
|---|---|
| Drilling parameters | Jintan-3 well reported lost circulation at depth of 1869 m at a rate of approximately 300 bbl/min. |
| Thin sections | 2–4 mm vugs and moldic pore size observed (leaching) with 25% and 29% of vuggy and moldic porosity in the Jintan wells. |
| Core | ≥0.5–1 cm vugs and moldic porosity observed. Rubbles and chalkified intervals described. |
| Seismic | Dendritic: ≥70–100 m deep, 1–5 km length and ≥500 m wide. Sinkhole/circular: ≤1 km in diameter. |
| Volumetric Calculations | Volume of the karst geobodies is 1.45 × 10⁷ m3 with a total area of 66.66 km2. |
Publisher’s Note: MDPI stays neutral with regard to jurisdictional claims in published maps and institutional affiliations. |
© 2021 by the authors. Licensee MDPI, Basel, Switzerland. This article is an open access article distributed under the terms and conditions of the Creative Commons Attribution (CC BY) license (https://creativecommons.org/licenses/by/4.0/).
Share and Cite
Ab Rahman, S.S.; Husen, M.H.; Soto, G.J.; Bing Bing, S.; Jamin, N.H.M.; Rosli, R.; Poppelreiter, M.C. Application of Spectral Decomposition Technique to Delineate the Evolution of Karst on Carbonate Platforms of Central Luconia, Offshore Sarawak, Malaysia. Appl. Sci. 2021, 11, 11627. https://doi.org/10.3390/app112411627
Ab Rahman SS, Husen MH, Soto GJ, Bing Bing S, Jamin NHM, Rosli R, Poppelreiter MC. Application of Spectral Decomposition Technique to Delineate the Evolution of Karst on Carbonate Platforms of Central Luconia, Offshore Sarawak, Malaysia. Applied Sciences. 2021; 11(24):11627. https://doi.org/10.3390/app112411627
Chicago/Turabian StyleAb Rahman, Siti Sarah, Maman Hermana Husen, Grisel Jimenez Soto, Saw Bing Bing, Nur Huda M Jamin, Redwan Rosli, and Michael C. Poppelreiter. 2021. "Application of Spectral Decomposition Technique to Delineate the Evolution of Karst on Carbonate Platforms of Central Luconia, Offshore Sarawak, Malaysia" Applied Sciences 11, no. 24: 11627. https://doi.org/10.3390/app112411627
APA StyleAb Rahman, S. S., Husen, M. H., Soto, G. J., Bing Bing, S., Jamin, N. H. M., Rosli, R., & Poppelreiter, M. C. (2021). Application of Spectral Decomposition Technique to Delineate the Evolution of Karst on Carbonate Platforms of Central Luconia, Offshore Sarawak, Malaysia. Applied Sciences, 11(24), 11627. https://doi.org/10.3390/app112411627