Article

Pose Estimation of Driver’s Head Panning Based on Interpolation and Motion Vectors under a Boosting Framework

by
Syed Farooq Ali
1,*,
Ahmed Sohail Aslam
1,
Mazhar Javed Awan
1,
Awais Yasin
2 and
Robertas Damaševičius
3,*
1
School of Systems and Technology, University of Management and Technology, Lahore 54000, Pakistan
2
Department of Computer Engineering, National University of Technology, Islamabad 44000, Pakistan
3
Faculty of Applied Mathematics, Silesian University of Technology, 44-100 Gliwice, Poland
*
Authors to whom correspondence should be addressed.
Appl. Sci. 2021, 11(24), 11600; https://doi.org/10.3390/app112411600
Submission received: 29 October 2021 / Revised: 17 November 2021 / Accepted: 25 November 2021 / Published: 7 December 2021
(This article belongs to the Special Issue Human-Computer Interaction and Advanced Driver-Assistance Systems)

Abstract

:
Over the last decade, a driver’s distraction has gained popularity due to its increased significance and high impact on road accidents. Various factors, such as mood disorder, anxiety, nervousness, illness, loud music, and driver’s head rotation, contribute significantly to causing a distraction. Many solutions have been proposed to address this problem; however, various aspects of it are still unresolved. The study proposes novel geometric and spatial scale-invariant features under a boosting framework for detecting a driver’s distraction due to the driver’s head panning. These features are calculated using facial landmark detection algorithms, including the Active Shape Model (ASM) and Boosted Regression with Markov Networks (BoRMaN). The proposed approach is compared with six existing state-of-the-art approaches using four benchmark datasets, including DrivFace dataset, Boston University (BU) dataset, FT-UMT dataset, and Pointing’04 dataset. The proposed approach outperforms the existing approaches achieving an accuracy of 94.43%, 92.08%, 96.63%, and 83.25% on standard datasets.

1. Introduction

Drowsiness and distraction are the two most significant reasons for fatal car accidents in the last two decades [1]. In 2017, the US Department of Transportation’s National Highway Traffic Safety Administration (NHTSA) reported that 795 causalities in vehicle crashes were the result of driver drowsiness, which was 2.3–2.5% of the total fatal crashes in the US. According to NHSTA reports, 2841 lives were claimed in the accidents due to distracted drivers in 2018, which was 6–9% of the total fatal crashes in the US [2]. At the time of a crash, 13% of distracted drivers were using their cell phones, indicating that cell phone usage was a major cause of these crashes [2]. Some signs that indicate the drowsiness of a driver include the inability to keep eyes open, frequent yawning, leaning the head forward, and face complexion change [3].
There are various metrics to determine the level of a driver’s drowsiness: physiological, vehicle-based, and behavioral measures [4,5]. In behavioral measures, information is based on the camera to detect slight changes in the driver’s facial expression. Facial expression analysis uses a combination of multiple facial features to predict various characteristics of the face, such as attractiveness [6] or disease [7]. It also can be used to evaluate driver drowsiness, such as extreme head poses and wrinkles in the forehead [8,9,10], and facial landmarks [11]. Eye blink rate and eye closure rate are other drowsiness detection measures [12,13,14], along with the physiological signal registered using wearable (on-body) sensors, such as electroencephalography (EEG) [15,16], respiratory signals [17], electrocardiogram/photoplethysmogram (ECG/PPG) signals [18,19], and heart rate variability (HRV) [20]. Finally, the sitting posture of the human body can be recognized and evaluated using motion sensors [21,22] or video recordings [23,24] as well as hand gestures [25].
Distraction is mainly a result of the driver’s in-attention that may be due to cell phone usage, eating, talking to other passengers, texting, or adjusting the radio or climate controls. In terms of the driver’s functionality, the NHTSA characterizes distraction as auditory, biomechanical, visual, or cognitive [26]. Various approaches for detecting driver distraction have been developed, which can be classified based on the parameters being measured as driving performance, subjective, physical, biological, and hybrid measures. Driving performance measurements, such as braking, steering, and other relevant driving behaviors, are among these that can be used to detect visual distraction [27]. Eye gaze is a useful distraction measuring tool, while subjective measures cannot be obtained in real-time in an uncontrolled driving environment. The drivers’ biological measures also affect the driving operation.
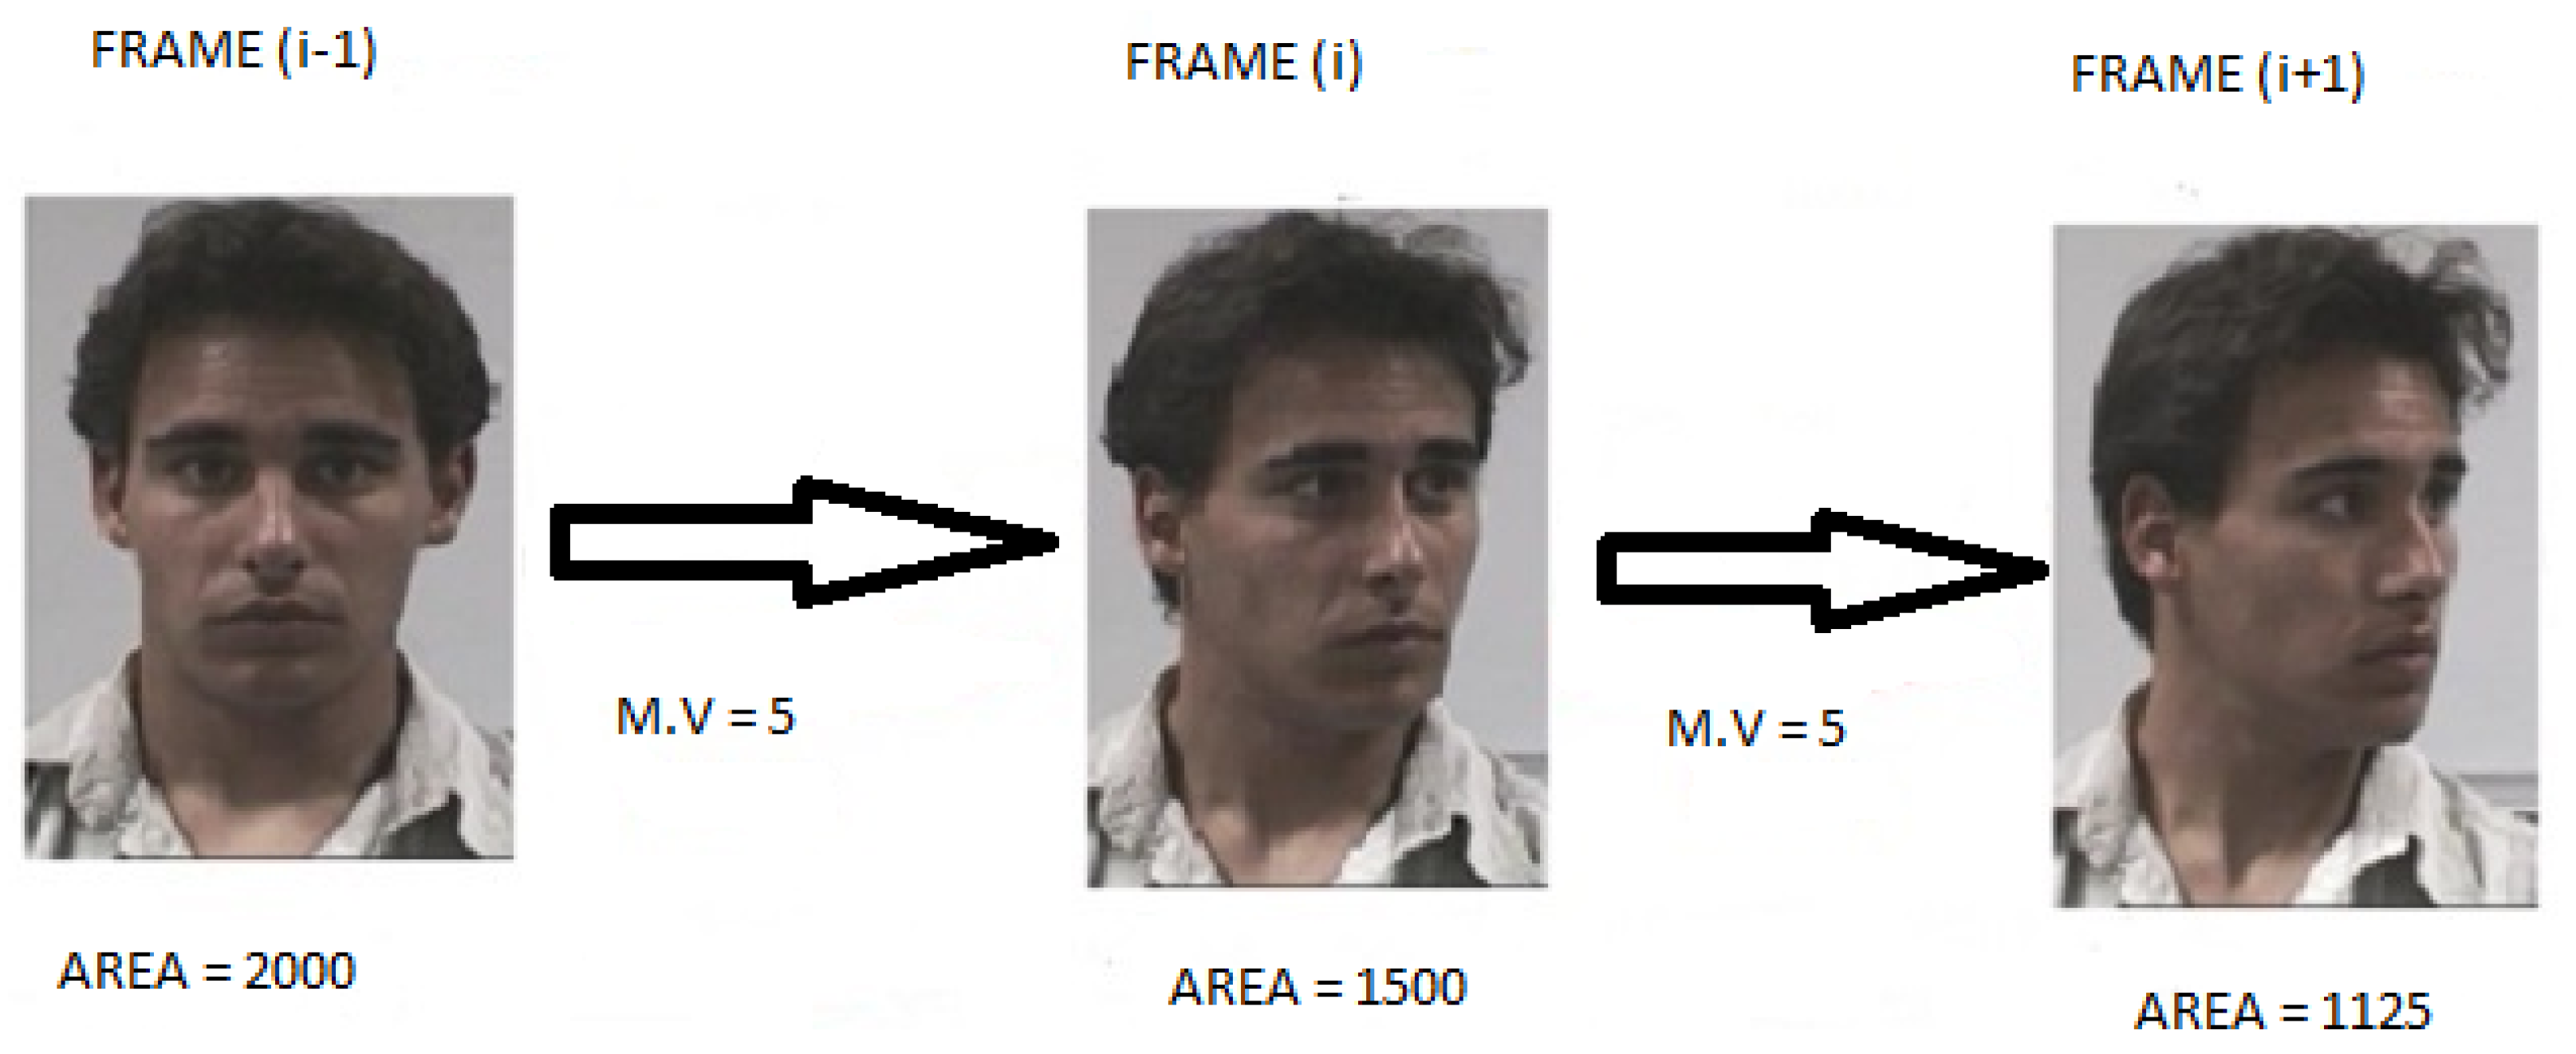
Human lives can be saved by using effective automatic distraction detection technologies. One way for detecting driver distraction is to detect the driver’s 3D head rotation, which can be classified into three types: changes in the yaw angle produce spinning (rotation in the horizontal plane), rotation caused due to the changes in pitch angle (rotation in the vertical plane), and rotation caused due to the changes in roll angle (back and forth rotation). The paper proposes a scale-invariant system under a boosting framework that can detect the driver’s head rotation due to a change in the yaw angle more accurately than the existing state-of-the-art methods. The work also proposes spatial and temporal variance-based features that estimate the geometric orientation of a driver’s head.
The structure of this paper is as follows. Section 2 discusses related work on the drivers’ distraction. Section 3 describes the proposed methodology for distraction detection due to drivers’ head panning, while the results and discussion are explained in Section 4. Section 5 presents the conclusion and discusses future work.

2. Related Work

Typically, head pose estimation is the first step in many driving safety applications. The head pose estimation methods can be categorized into visual methods, which monitor the position of face, its expression, and various movements of its parts, such as blinking or yawning. On the other hand, multimodal methods combine information from driver videos or images with additional data obtained from physiological or embedded car sensors.
An example of a visual method is the study of Nikolaidis et al., which calculated head yaw from the distortion of the isosceles triangle made by the mouth and the two eyes [28]. They make use of the facial feature point locations and head shape to estimate the head pose. Another work proposed geometric models that only used the location of the center of the face and face boundaries for head yaw estimation [29]. The geometric methods for head yaw estimation are invariant to facial expressions, support large head rotations, and work with or without glasses. Ji et al. proposed a similar approach for estimating and tracking the 3D pose of a face obtained from a single monocular camera [30]. The shape of the 3D face was estimated by the ellipse and its aspect ratio. The detected face ellipse was then tracked in subsequent frames, which allowed tracking the 3D face pose. The authors claimed that their approach was more robust than existing feature-based approaches based on synthetic and real datasets. Zhang et al. proposed a system for estimating a head pose based on multi-view face detectors using a Naive Bayesian classifier [31]. The temporal variation of the head pose was modeled by HMM that predicted the optimal head pose. Ohue et al. developed a driver’s facial pose recognition system that alarms if the face was distracted [32]. Wang utilized the mouth and eye corner points for vanishing point and head pose estimation [33]. The authors reported the mean error in head pose estimation of 2.56 , 1.67 , and 3.54 around the X-axis, Y-axis, and Z-axis, respectively, over eight video sequences. Balasubramanian et al. proposed a framework called Biased-Manifold Embedding for obtaining performance improvement in head pose estimation [34]. The experimental results obtained an average pose angle estimation error up to 2 on the FacePix dataset, which contained 5430 face images with pose variations at a granularity of 1 . Wang et al. developed an approach that combined non-linear techniques of dimensionality reduction with a learned distance metric transformation [35]. The experimental results showed that their method achieved accuracy in the range of 97% to 98% for facial images with varying poses and 96–97% accuracy on images with both pose and illumination variations. Fu et al. demonstrated that discriminating power can be sufficiently boosted by applying the local manner in sample space, feature space, and learning space via linear subspace learning [36]. Experiments demonstrated that the local approach had around a 20% estimation error in head pose and 30% error in pitch.
Morency et al. presented a probabilistic framework that integrated the three approaches: the user independence and relative precision of differential registration, the stability and automatic initialization of static head pose estimation, and bounded drift of frame tracking [37]. Ji et al. proposed a novel regression method for learning the regression between pose angles and image features and noise removal and outlier detection from the training data [38]. Experiments on real data with outliers demonstrated an MAR of 9.1 in yaw estimation and 12.6 in pitch estimation. Hu et al. proposed a method for improving the accuracy of head pose estimation [39]. The symmetry of the face image and the head pose resulted in the use of Gabor filters and Local Binary Pattern operators in one-dimension. The experiments on two different datasets resulted in a mean yaw estimation error of 7.33 .
Some visual methods used three-dimensional (3D) tracking. For example, Yan et al. proposed a novel manifold embedding algorithm supervised by both identity and pose information, called synchronized sub-manifold embedding (SSE), for precise 3D pose estimation [40]. The experiments on the 3D pose estimation dataset, CHIL data for CLEAR07 evaluation, showed 6.60 mean pan estimation error and 8.25 mean tilt estimation error. Murphy-Chutorian et al. presented a new method for static head pose estimation and a new algorithm for visual 3D tracking [41]. The system consisted of three interconnected modules that detected the driver’s head, provided initial estimates of the head pose, and continuously tracked its position and orientation with six degrees of freedom. Experimental results showed the mean estimation error of 3.62 in yaw, and 9.28 in pitch during the day driving. For night driving, the yaw estimation error of 5.18 and pitch estimation error of 7.74 was reported. Narayanan et al. proposed the head yaw angle estimation, with the advantages of real-time performance, ability to work with low-resolution images, and tolerable to partial occlusions [42]. The proposed model achieved an MAR of 6.65 in head yaw estimation. Tran et al. proposed a vision-based distraction detection system that used four deep network architectures [43]. Residual Network, VGG-16, AlexNet, and GoogleNet architectures resulted in a performance of frequency in the range of (8–14 Hz) and an accuracy in the range of (86–92%). The GoogleNet outpeformed the other network, yielding frequency of 11 Hz at an accuracy of 89%. Ruiz et al. presented a robust method to determine a head pose by using a multi-loss convolutional neural network to predict the intrinsic yaw angle, pitch angle, and roll angle directly from the image intensity through pose classification and regression [44]. The authors claimed promising results on common pose benchmark datasets. Eraqi et al. proposed a genetically weighted ensemble of convolutional neural networks on a publicly available dataset with a great variety of distraction postures, reporting an accuracy of 90% [45].
Minaee et al. surveyed the face detection techniques and summarized five important models, cascade-CNN-based models, R-CNN-based models, single-shot detector models, feature pyramid network-based models, and transformers-based models [46]. The authors reported an accuracy of 34.5% to 96.5% on the Wider-Face dataset. The authors discussed major challenges in face detection, such as robustness on tiny faces, face occlusion, accurate lightweight models, few-shot face detection, interpretable deep models, and face detection bias reduction. Alotaibi et al. proposed a posture recognition system for drivers’ distraction based on a deep recurrent neural network (RNN) that yielded an accuracy of 96.23% and 92.36% on the StateFarm and AUC datasets, respectively, [47]. Yang et al. proposed head pose estimation from a single image [48]. The authors proposed a fine-grained structure mapping for spatially grouping features before aggregation. The fine-grained structure provides part-based information and pooled values. The authors claimed to have results comparable to the most recent methods. Torres et al. explored the machine learning algorithms to detect driver distraction due to smartphone usage [49]. The authors reported that more than 95% accuracy can be obtained using CNN and gradient boosting methods. Ye et al. proposed a driver fatigue detection system based on the residual channel attention network and head pose estimation [50]. The authors reported 98.62% accuracy of detecting eye state and 98.56% of detecting mouth state. The authors also proposed the perspective-n-point method to estimate excessive deflection of head. Xing et al. proposed a driver activity recognition system based on deep convolutional neural networks and reported to achieve an accuracy of 81.6% using AlexNet, 78.6% using GoogleNet, and 74.90% using ResNet50 neural networks [51]. Chen et al. proposed a two-stream CNN model to estimate the spatial and temporal parameters of driver behavior [52]. The authors reported an increase in accuracy of 30% compared to the score-level fusion neural network model.
In multimodal head pose estimation, gaze tracking is often used to improve the head pose estimation result. For example, Valenti et al. proposed a hybrid scheme to combine eye location and head pose information to yield better gaze estimation [53]. The information obtained from the head pose was utilized for normalizing the eye regions, while the information generated by the eye location was used for correcting the pose estimation procedure. The experimental results indicated that the combined gaze estimation system was accurate with a mean error of 2–5 . Fu et al. studied a gaze tracking system that was important for monitoring driver’s attention, detecting fatigue, and providing better driver’s assistance systems, but it was difficult to deploy due to large head movements and highly variable illumination [54]. The authors proposed a calibration method for determining the head orientation of the driver that utilized the rear-view mirror, the side mirrors, and the instrument board as calibration points. The system categorized the head pose in twelve gaze zones based on facial features using a self-learning algorithm. Experimental results showed that the automatic calibration method achieved an MAR of 2.44 in yaw estimation and an MAR of 4.73 in pitch estimation during day and night driving. Vicente et al. described a vision-based system to detect Eyes Off the Road (EOR) distraction [55]. The system had three components: head pose and gaze estimation, robust facial feature tracking, and 3D geometric reasoning to detect EOR distraction. Experimental evaluation under a wide variety of illumination conditions, facial expressions, and individuals showed that the system achieved above 90% EOR accuracy for all tested scenarios. Hirayama et al. proposed a data mining approach for comparing the neutral driving state with the cognitive distracted state by monitoring the vehicle behavior and driver’s gaze variations [56]. The proposed method achieved a classification accuracy of 96.2% under the distracted condition and 76.6% under neutral condition. Fridman et al. investigated the question: How much better could the driver gaze be classified using both eye and head pose versus only head pose [57]? The experimental results showed that eye pose increased the average accuracy from 89.2% to 94.6%. Lee et al. proposed a method that relied on fuzzy-system for detecting a driver’s corneal and pupil specular reflection (SR) that could track the gaze in a vehicle environment [58]. Based on the fuzzy output, the proposed method excluded the eye region that had a high error rate. Experimental results on 20,654 images showed that the method achieved a mean pupil detection error of 4.06 pixels and a mean corneal SR detection error of 2.48 pixels across different gaze regions.
Additionally, information obtained from external car monitoring can be used. For example, Loce et al. emphasized that major advancements in driver distraction could be achieved by jointly analyzing and fusing the internal state of the vehicle and the external state of the vehicle [59]. The authors pointed out that in the CARSAFE mobile application, 83% precision and 75% recall rate for dangerous driving situations were achieved by combining both the internal video monitoring of vehicle and external video monitoring. Streiffer et al. proposed using deep learning-based classification (DarNet) on driver image data and inertial measurement unit data, attaining an accuracy of 87.02% [60]. Hssayeni et al. reported an accuracy of 85% with ResNet deep convolutional network on a dataset that incorporates drivers engaging in seven different distracting behaviors [61]. Peng et al. established a platform in which unexpected lane changing of cars was used as typical risky driving behavior [62]. The authors established a neural network identification model based on a Bayesian filter using data samples to identify risky driving behaviors. The experimental results indicated an identification accuracy of 83.6% with the neural network model only, but this could be increased to 92.46% if the Bayesian filter was also used.
The previous works, including the features and the methods used alongside their limitations, are summarized in Table 1. Note that none of the distraction detection measures are accurate enough for detecting distraction in all scenarios, so hybrid measures are used.

3. Materials and Methods

3.1. Proposed Distraction Detection System

The distraction caused by the movement of the driver’s head around the X-axis, Y-axis, and Z-axis corresponds to changes in pitch, yaw, and roll angles, respectively. The changes in pitch angle (forward to backward movement of the neck), yaw angle (right to left rotation of the head), and roll angle (right to left bending of the neck) are also named as head nodding, panning, and tilting, respectively. This study proposes a feature-based system to detect head panning of a driver under a boosting framework, as shown in Figure 1. The approach has been tested using the publicly available standard datasets including DrivFace [66], Boston University [67], and Pointing’04 [68].

3.1.1. Temporal and Spatial Variance for Driver’s Distraction Detection

The study aims to calculate the 3D rotation vector R corresponding to the panning of a driver’s head. If the 3D rotation vector R for the driver’s head panning reaches above 20 degrees in a clockwise or anticlockwise direction, then the frame contains Distraction (D); otherwise, it contains No Distraction (ND). It has been observed that the rotation vector R changes with the change in features of the frame. The geometric features for frontal faces are calculated using fiducial facial points. In the case of non-frontal faces, the geometric features are calculated using interpolation based on motion vectors.
The active appearance model (AAM) minimizes the residual error between the model appearance and the input image; hence, it often fails to accurately converge to the landmark points of the input image. To alleviate this problem, the active shape model (ASM), a fiducial facial point algorithm, is used, which gives 18 facial points, as shown in Figure 2b [69,70]. The features being used for detecting distractions are explained in Section 3.1.2, Section 3.1.3, Section 3.1.4, Section 3.1.5 and Section 3.1.6.

3.1.2. Variance of the Length-to-Width Ratio of Lips

The variance of the length-to-width ratio of lips is calculated to detect distraction as its value varies significantly with changes in head pose. The equations are given in Equations (1) and (2). By taking the ratio of length to width, this feature becomes scale-invariant.
σ r l w 2 = 1 i k = 1 i ( r l w ( i ) μ l w ) 2 ,
R a t i o ( r l w ) = L e n g t h L i p s W i d t h L i p s ,
where length and width are calculated by using the Euclidean distance formula. To find the length of lips in Figure 3b, the Euclidean distance between point 5 ( x 5 , y 5 ) and point 6 ( x 6 , y 6 ) . Similarly, to find the width of lips, the Euclidean distance is required to be calculated between the point 7 ( x 7 , y 7 ) and the point 8 ( x 8 , y 8 ) .

3.1.3. Variance of Length-to-Width Ratio of Eyes

The variance of the length-to-width ratio of left and right eye is calculated as shown in Equations (3) and (4), respectively.
σ r l e 2 = 1 i k = 1 i ( r l e ( i ) μ l e ) 2 ,
σ r r e 2 = 1 i k = 1 i ( r r e ( i ) μ r e ) 2 .
The ratio of length to width of left and right eyes is calculated as shown in Equations (5) and (6), respectively.
R a t i o ( r l e ) = L e n g t h L e f t E y e W i d t h L e f t E y e ,
R a t i o ( r r e ) = L e n g t h R i g h t E y e W i d t h R i g h t E y e ,
where right eye length and width and left eye length and width are calculated using the Euclidean distance formula.

3.1.4. Variance of Area of Triangles

The variance of area of triangles serves as a strong feature as its value changes significantly with head pose changes. The variance of area of three triangles 2 , 6 , 17 ; 2 , 6 , 21 ; and 18 , 20 , 17 are used, as shown in Figure 3c. The area of triangles is calculated using Hero’s formula, as shown in Equation (7) [71]:
A r e a o f t r i a n g l e = s ( s a ) ( s b ) ( s c ) ,
where s can be calculated using Equation (8).
s = ( a + b + c ) / 2

3.1.5. Variance of Ratio of Areas

The variance of ratio of areas is not only a strong feature but scale-invariant as well. The variance of ratio of triangles is shown in Equation (9):
σ r a t 2 = 1 i k = 1 i ( r a t ( i ) μ a t ) 2 ,
where the ratio of the area of two triangles is represented by r a t , and μ a t is the mean of the area of two triangles. The same three triangles as above are used to calculate the ratio of triangles, as shown in Figure 3c.

3.1.6. Variance of Angles

Driver’s distraction results in head pose changes that, in turn, significantly change the value of this feature, thus making it a strong feature. The variance of angles of a triangle can be calculated as shown in Equation (10).
σ θ 2 = 1 i k = 1 i ( θ ( i ) μ θ ) 2 .
The angles of a triangle can be calculated using the Fundamental Law of Cosines [72]. The following angles are used in this feature, where the points 2, 6, 17, 18, 20, and 21 are marked in Figure 3b,c:
2 , 6 , 17 , 2 , 6 , 21 , 2 , 6 , 22 , 17 , 20 , 22 , 6 , 2 , 17 , 6 , 2 , 21 , 6 , 2 , 22 , 17 , 18 , 22 .

3.1.7. Boosting, a Meta-Algorithm

Boosting tweaks the results of the J48 that is the base classifier [73,74]. J48, based on the ID3 algorithm, generates rules for the estimation of desired variables [75]. Boosting is usually sensitive to outliers and noisy data due to overfitting. Boosting may reduce the performance on unstable classifiers, while it improves the performance on J48, which is a stable classifier [69,76]. In the case of the boosting algorithm, the number of terms, K, are directly proportional to accuracy, i.e., with the increase in number of terms, the accuracy on a test dataset increases and finally attains an optimal value.
In each iteration of boosting, the incorrectly categorized samples are given more weight-age. The resulting classifier is a weighted mean of classifiers. If the training sample is { ( x 1 , y 1 ) , ( x 2 , y 2 ) , , ( x N , y N ) } , feature vector is x i , and the label corresponds to y i { 1 , 1 } , i = 1 , 2 , , N , the goal is to predict the label of a feature vector, x t , as shown in the Equations (11) and (12)
y ^ = sign { F ( x t ) } ,
F ( x t ) = k = 1 K k ϕ ( x t ; θ k ) ,
where y ^ is the estimated label, and ϕ ( x t ; θ k ) represents the base classifier that outputs a binary label. The parameter, θ k , represents the base classifier.
The J48 classifier works on the principle of the information gain ratio, which is based on entropy. The node in the classification tree with the maximum value of the information gain ratio is chosen. If the values of a feature, X, are A 1 , A 2 , , A m , then for each value, A j , j = 1 , 2 , . . m , the records are divided into two sets. The feature values up to and including A j correspond to the first set, while those greater than A j corresponds to the second set [77]. The G a i n R a t i o ( X ( j ) , T ) , where j = 1 , 2 , m , is calculated for each of these m partitions, and the partition corresponding to the maximum gain is selected. Equation (13) shows the G a i n R a t i o ( X , T ) .
G a i n R a t i o ( X , T ) = G a i n ( X , T ) S p l i t I n f o ( X , T ) .
Equation (14) shows the SplitInfo.
S p l i t I n f o ( X , T ) = i n | T i | | T | l o g 2 | T i | | T | .

3.1.8. Feature Computation

Due to the high rotation angle of a driver’s head, facial point identification algorithms, such as ASM and BoRMaN, failed to detect fiducial points of non-frontal faces. This makes calculating the feature values of those frames impossible. The missing values of features of those frames are calculated using the interpolation technique based on motion vectors to tackle this problem, as demonstrated in Figure 4.
If the feature value of the ( i th ) frame and the ( i 1 ) th ) frame have previously been determined, we may calculate the feature value of the ( i + 1 ) th ) frame. We assume that the size of motion vectors (MV) is proportional to the percentage change in the feature value. The MVs (mvx and mvy) are calculated using a block searching technique in which each frame is broken into small blocks of a fixed size. The driver’s nose is used as a reference point, and the MV between any two successive frames (i.e., ( i th ) and ( i 1 ) th frames) is calculated by subtracting the nose block coordinates of the ( i th ) and ( i 1 ) th frames.
The feature value change between the ( i ) th and ( i + 1 ) th frames is then utilized to determine the feature value of ( i + 1 ) th frame. Consider Figure 4, where the feature ‘area’ must be determined for the ( i + 1 ) th frame, despite the fact that the areas for the ( i 1 ) th frame and ( i th ) frame are 2000 and 1500, respectively. Furthermore, the computed magnitude of MVs between the ( i 1 ) th frame and the ( i th ) frame is 5, as is the calculated magnitude of MVs between ( i th ) frame and ( i + 1 ) th frame.
The area change between the ( i 1 ) th frame and the ( i th ) frame is calculated as 25%, as is the percentage change in the area between the ( i th ) frame and the ( i + 1 ) th frame. The area of the ( i + 1 ) th ) frame was calculated using the area of the ( i th ) frame and the value of the percentage change between the ( i th ) and ( i + 1 ) th ) frames, and it came out to be 1125. All features of non-frontal faces with a high rotation angle of the driver’s head are determined in this fashion, and the features are then supplied to the classifier for training and testing.

4. Results

4.1. Datasets

We performed experiments on four standard datasets namely DrivFace, Boston University (BU), FT-UMT, and Pointing’04 dataset.

4.1.1. DrivFace Dataset

The DrivFace dataset contains images and a video repository of driving scenarios under an uncontrolled environment. The dataset contains 606 samples of 640 × 480 pixels. It is generated using four drivers (two women and two men). The dataset includes various facial features, such as glasses and beards. The normalized version of this dataset (80 × 80 pixels) is also available as a MatLab file (drivFac.mat). The gaze direction of this dataset includes right, frontal, and left. Figure 5 shows key images of this dataset with different gaze directions.

4.1.2. Boston University Dataset

Boston University (BU) dataset contains 15k RGB images using five subjects with different head poses [67]. The dataset was recorded in a lab under uniform and varying lighting conditions. The dataset provides continuous translation and head orientation measurements.

4.1.3. FT-UMT Dataset

This dataset, generated and used in our previous publication [78], consists of four videos containing frames with No Distraction (ND) or Distraction (D). The total frames for first, second, third, and fourth videos are 418, 409, 390, and 397, respectively, while the frames containing distraction (D) are 191, 221, 215, and 209. Figure 6 shows frames containing various types of Distraction (D) and No Distraction (ND). The driver’s head rotation of greater than 20 degrees is classified as Distraction (D) and vice versa.

4.1.4. Pointing’04 Dataset

The Pointing’04 dataset is generated under a controlled environment with subjects that have variations in skin color, without glasses and with glasses. The pose variations are measured with values in the range of −90 to +90 . Figure 7 shows the various images of this dataset with different poses. The dataset consists of 15 sets of images, where each set contains two sequences of 93 images with varying poses of the same subject. These sequences of images have 93 discrete values for head pose variations.

4.2. Experimental Comparison with Existing Techniques

The boosting algorithm, ‘PA_B-J48’, is compared with EM-Stat [79], TA [80], AM-Mouth [81], Ali [78], Lee [58], and Frid [82]. The comparison is made in terms of accuracy (A), sensitivity (Se), Precision (P), F-Measure (F), TP-Rate, FP-Rate, ROC-Area, and time efficiency with 10-Fold cross validation using Distraction (D) and No-Distraction (ND). Sensitivity, Precision, and F-Measure are defined in Equations (15)–(17), respectively.
S e n s i t i v i t y = T P ( T P + F N ) ,
P r e c i s i o n = T P ( T P + F P ) ,
F M e a s u r e = 2 × P r e c i s i o n × R e c a l l P r e c i s i o n + R e c a l l
where ( T P ) is the true positive, ( F N ) is the false negative, ( T N ) is the true negative, and ( F P ) is the false positive.
The ‘PA_B-J48’ uses geometric and spatial features with J48 under a boosting framework. Facial fiducial points and motion vector-based interpolation for frontal and non-frontal faces are used to compute the geometric features. AdaBoost, which incorporates an ensemble learning approach, is used to combine various weak classifiers to form a strong classifier.

4.2.1. Experiments on the DrivFace Dataset

DrivFace is a challenging dataset because it contains images acquired in real driving scenarios with different head pose variations and various facial features, including glasses and beards.
Table 2 shows that our proposed approach outperforms the existing approaches in all the performance measures. One of the leading reasons is that the Boosting framework, which tweaks its weak learners due to its adaptive nature, ultimately results in performance improvement. Moreover, J48 gives better performance on datasets with missing values, such as the DrivFace dataset.

4.2.2. Experiments on the Boston University (BU) Dataset

Although the Boston University (BU) dataset contains images with uniform and varying lighting, our ‘PA_B-J48’ performs better than EM-Stat, TA, AM-Mouth, Ali, Lee, and Frid in terms of Se, P, F, TP-Rate, and ROC-Area, as can be seen in Table 3. The performance accuracy of existing approaches reduces significantly compared to the DrivFac dataset due to the varying lighting conditions of this dataset. However, the performance of ‘PA_B-J48’ remains stable in this dataset due to the adaptive nature of the Boosting framework.

4.2.3. Experiments on FT-UMT Dataset

On the FT-UMT dataset, the proposed approach, ‘PA_B-J48’, shows the best performance, as can be seen in Table 4. The reason is that geometric features of ‘PA_B-J48’ work well on a subject with the beard as in the FT-UMT dataset. The second-best percentage accuracy is shown by the approaches EM-Stat and Ali.

4.2.4. Experiments on the Pointing’04 Dataset

The best performance is indicated by EM-stat and the proposed approach ‘PA_B-J48’, as can be seen in Table 5. The technique (Ali) also exhibits the same results, but its performance degrades slightly in terms of FP-Rate and ROC-Area. This dataset becomes most challenging because of its high intra-class variations, including skin color changes, with and without glasses, and pose variations. Therefore, the performance of the proposed approach ‘PA_B-J48’ and existing approaches degrades in this dataset.

4.3. Variants of Proposed Approach

‘PA_B-J48’ is also compared with its variants, including Boosting with Naive Bayes (BNB), Adaptive Boosting (BAda), Boosting with Neural Network (BNN), and Boosting with Support Vector Machine (BSVM), respectively. The variants uses the same set of features but differ in classifiers. Table 6 shows that the PA_B-J48 outperforms its variants on the DrivFace, BU, FT-UMT, and Pointing’04 datasets. The features of the J48 classifier that result in better accuracy are its ability to handle missing values, continuous attribute value ranges, and derivation of rules.

4.4. Comparison with Deep Learning Models

‘PA_B-J48’ is also compared with six state-of-the-art deep learning models, including ResNet-50, ResNet-101, VGG-19 [83], Inception-V3, MobileNet, and Xception using the datasets, including DrivFace dataset(DF), Boston University dataset (BU), and FT-UMT dataset (FT-UMT), as shown in Table 7. It can be observed that our proposed approach outperforms the deep learning models. The deep learning models require a large dataset to achieve better results and hence could not perform well on DF, BU, and FT-UMT.

4.5. Relevance Analysis

Table 8 shows the accuracy after removing each feature (one by one) from the proposed approach. It can be observed that after removing the feature ‘variance of area of triangles’, the accuracy of the approach degrades significantly on the Boston University dataset, which shows high contribution of this feature. Similarly, the accuracy becomes lowest when ‘area of triangle’ is removed from the proposed approach using DrivFace and Pointing ’04 datasets.

4.6. Execution Time Comparison

Besides outperforming in terms of various performance measures, the proposed approach, PA_B-J48, also exhibits better time efficiency. PA_B-J48 is {1.2, 10.5, 0.5, and 0.6} times faster than EM-Stat, Ali, TA, and AM-Mouth, respectively, when experimented on the DrivFace dataset, as shown in Figure 8. One reason for its better time efficiency is that it uses simple and quicker-to-compute features, i.e., ratios and variances. For example, rather than taking length and width of eyes as features, it only takes their ratios. EM-Stat not only computes geometric features, including the height of eyes and the mouth, but it also calculates the relationship between them to predict distraction that results in reduced time efficiency. Ali uses a neural network classifier that results in lower time efficiency compared to the proposed approach. TA and AM-Mouth uses fewer features that are simple and quicker to compute.
In a few cases, it is also a trade-off between percentage accuracy and time efficiency. Lee and Frid show better time efficiency, but their performance degrades significantly in terms of percentage accuracy, sensitivity, precision, F-measure, TP-Rate, FP-Rate, and ROC-Area on the DrivFace, BU, FT-UMT, and Pointing’04 datasets. In the case of the DrivFace dataset, the percentage accuracy of Lee and Frid is 88.52% and 91.30%, respectively, while PA_B-J48 outperforms these techniques and exhibits an accuracy of 94.43%. A similar trend of time efficiency is shown in the other three datasets, including BU, FT-UMT, and Pointing’04. PA_B-J48 is 9.9, 1.3, 0.4, and 0.3 times faster than Ali, EM-Stat, TA, and AM-Mouth, respectively, in the BU dataset, while it is 8.5, 0.7, 0.2, and 0.3 times faster than the similar approaches in the case of the FT-UMT dataset. In the case of Pointing’04, PA_B-J48 is 8.6, 0.8, 0.25, and 0.45 times faster than Ali, EM-Stat, TA, and AM-Mouth, respectively.

5. Conclusions and Future Work

Distraction detection is an important feature in modern semi-assisted vehicles, but it is difficult to detect it accurately due to the large number of factors involved. Numerous research works attempted to detect the distraction of a driver while driving, but most of them failed to achieve all the objectives of accuracy, simplicity, cost-effectiveness, and timeliness.
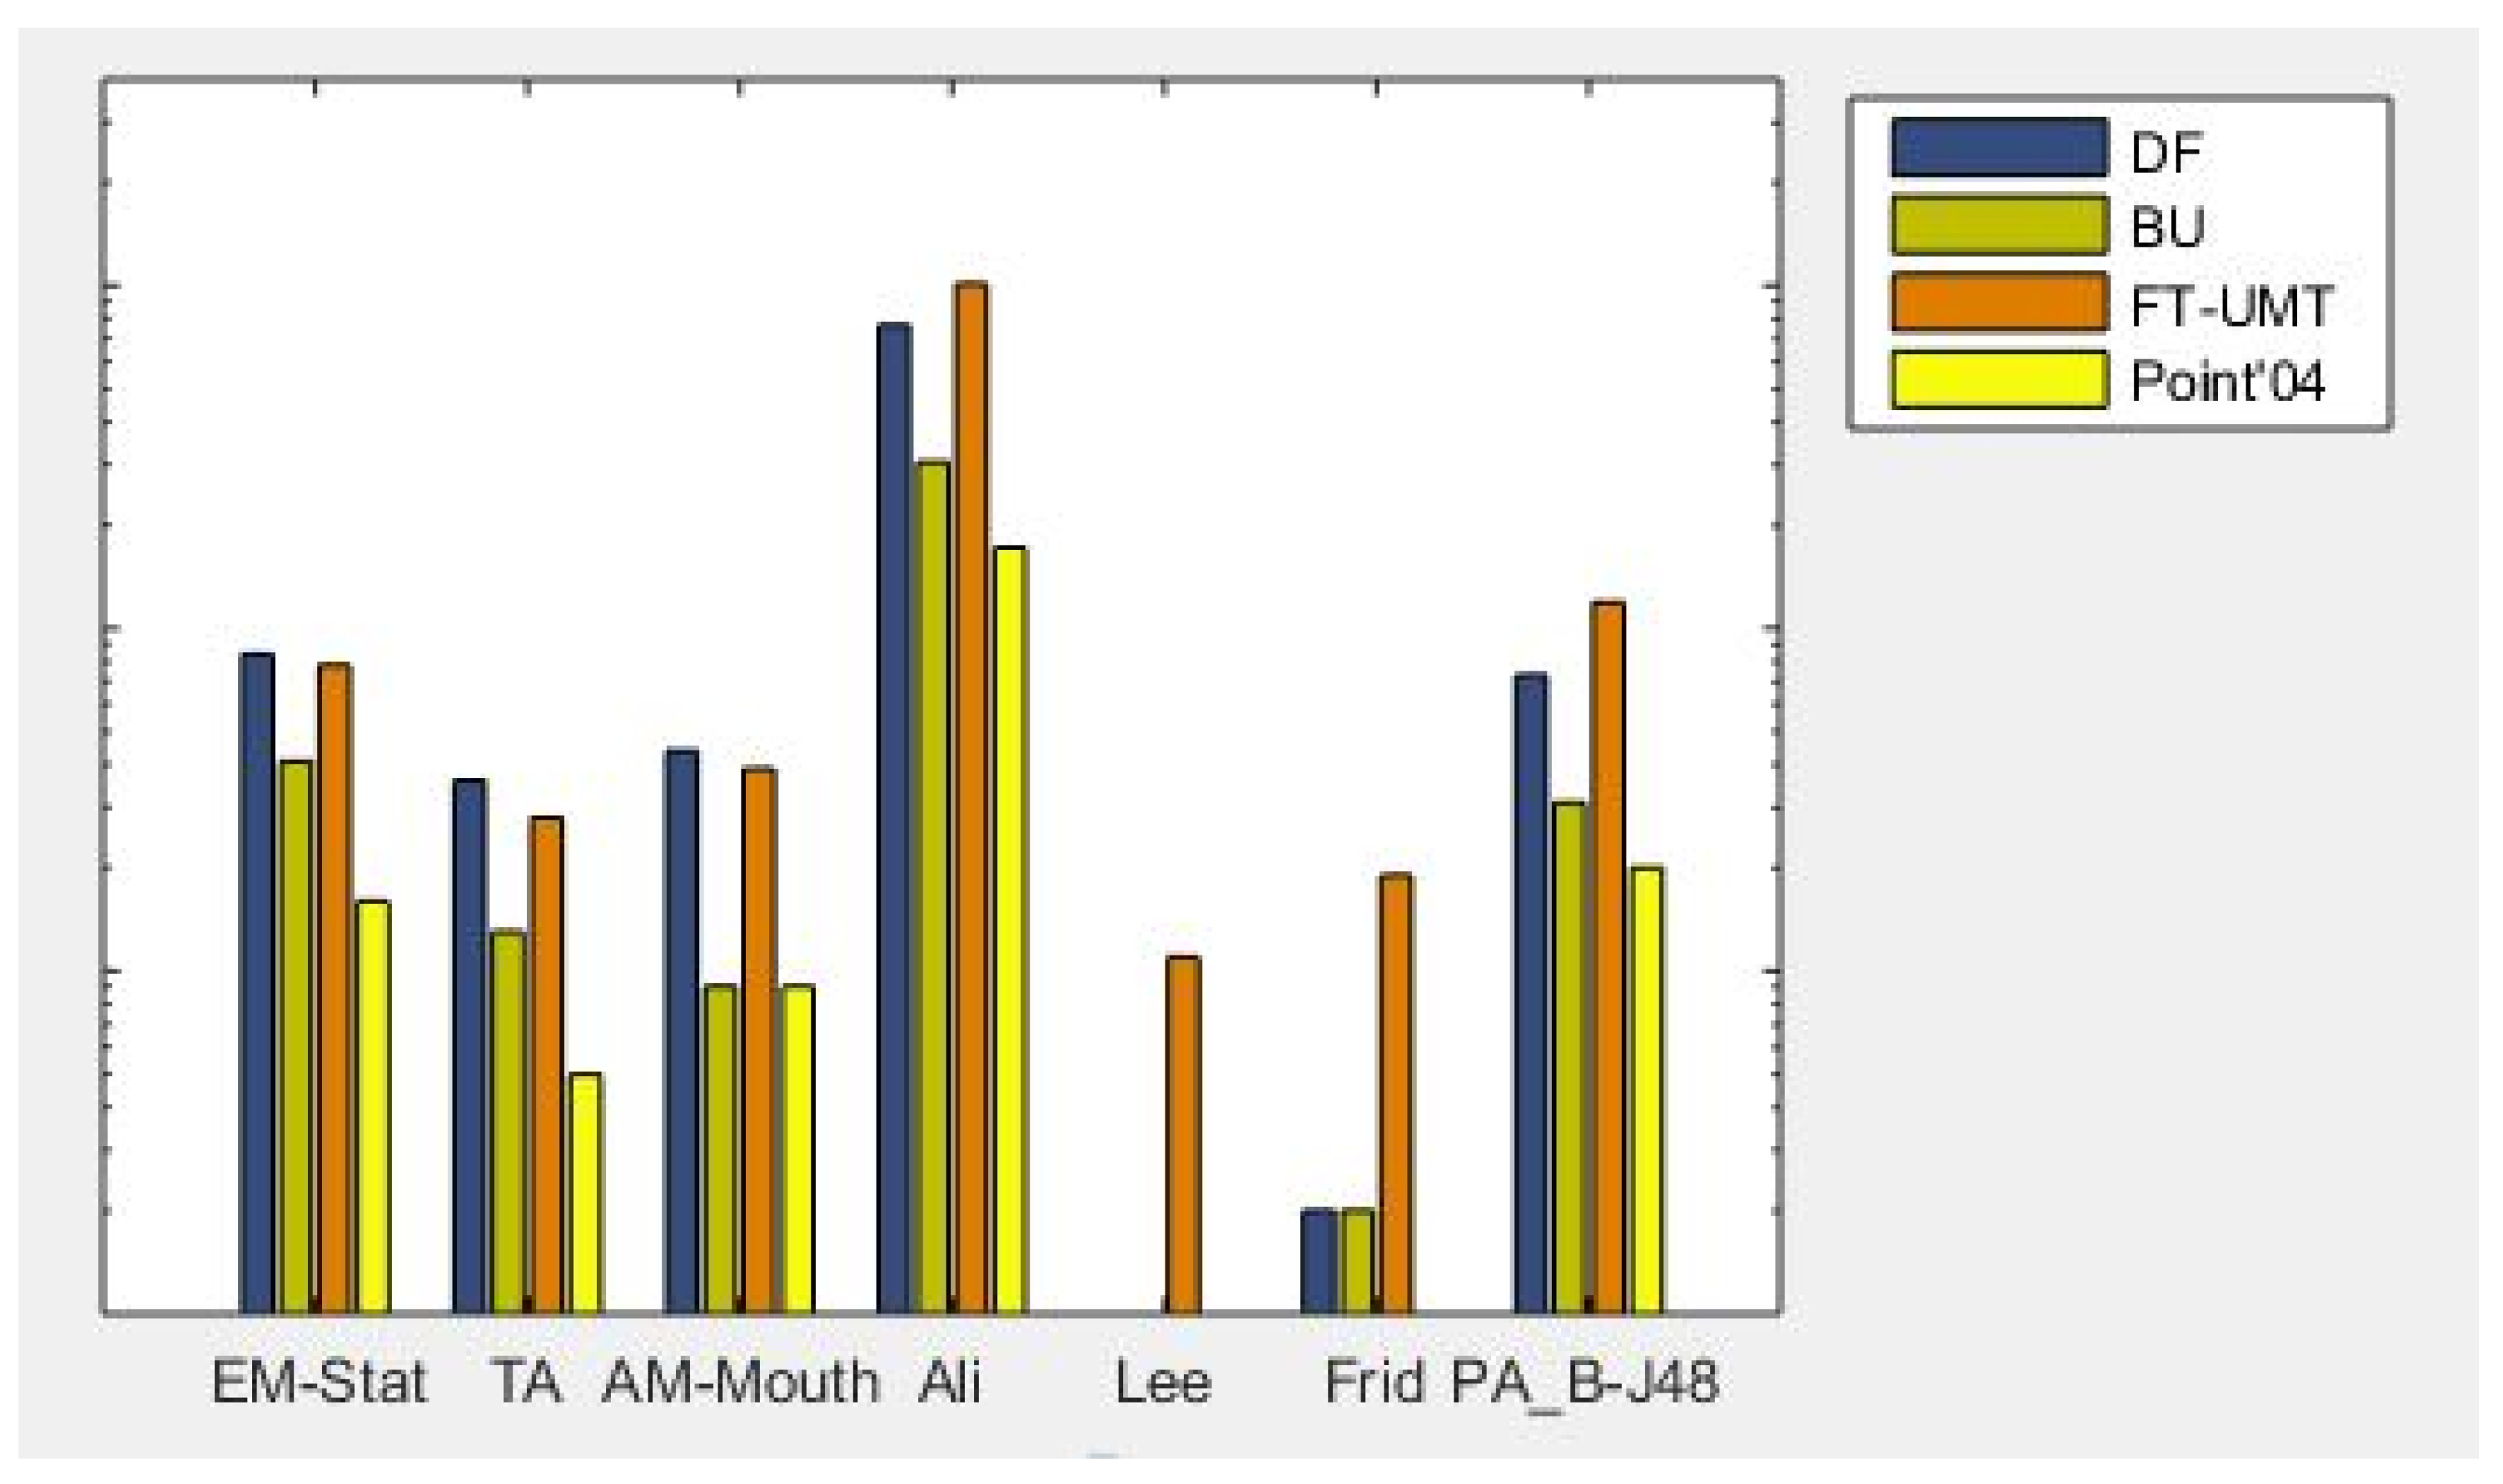
This paper proposes a feature-based approach that outperforms state-of-the-art methods, including EM-Stat, TA, AM-Mouth, Ali, Lee, and Frid on the DrivFace, Boston University, FT-UMT, and Pointing’04 datasets. The proposed approach also yields better percentage accuracy than the deep learning models, namely: ResNet-50, ResNet-101, VGG-19, Inception-V3, MobileNet, and Xception. The proposed approach is compared with its variants and gives better results. The deep learning models are end to end and provide better accuracy compared to the approach of hand-crafted features. However, deep learning approaches also come with a cost and require high processing power, large datasets for training, and long training time. On the contrary, the classical approach works better than deep networks on smaller datasets. Our proposed approach requires computationally cheaper hardware and fewer data. Our technique is simple, accurate, and fast enough to be implemented in the real world to detect a driver’s distraction from head panning.
As an extension of this work, the factors such as eye gaze movement, driver behavior while driving, driver’s facial expressions, driver actions, and vehicle movement can be considered. Distraction detection of a driver in night driving or dim light also needs to be investigated. A distraction detection system should be invariant to various factors, including camera distortion, projective geometry, multi-source non-Lambertian lighting, as well as the movement of facial muscles, biological appearance, facial expression, use of cell phone, hats, and glasses.

Author Contributions

Conceptualization, S.F.A. and A.S.A.; methodology, S.F.A.; software, S.F.A.; validation, S.F.A.; writing—original draft preparation, S.F.A. and A.S.A.; writing—review and editing, S.F.A., A.S.A., M.J.A., A.Y. and R.D.; supervision, M.J.A.; project administration, A.Y. and R.D.; funding acquisition, R.D. All authors have read and agreed to the published version of the manuscript.

Funding

This work was supported by the National ICT R&D under grant no. NICTDF/NGIRI/2013-14/Crops/2 and the University of Management & Technology, Lahore, Pakistan.

Institutional Review Board Statement

Not applicable.

Informed Consent Statement

Not applicable.

Data Availability Statement

DrivFace [66], Boston University [67], and Pointing’04 [68] datasets are available at the following links: http://adas.cvc.uab.es/site/index.php/datasets (accessed on 1 August 2021) ftp://csr.bu.edu/headtracking/ (accessed on 1 July 2021) http://www-prima.inrialpes.fr/Pointing04/data-face.html (accessed on 5 December 2020).

Acknowledgments

We would like to thank Khawaja Ubaid Ur Rehman, Wasiq Maqsood, Junaid Jabbar Faizi, Hassaam Zahid, and Muhammad Maaz Aslam, who volunteered for data generation for this work.

Conflicts of Interest

The authors declare no conflict of interest. The funders had no role in the design of the study; in the collection, analyses, or interpretation of data; in the writing of the manuscript; or in the decision to publish the results.

References

  1. National Highway Traffic Safety Administration. Traffic Safety Facts Crash Stats: Drowsy Driving 2015; NHTSA: Washington, DC, USA, 2017. [Google Scholar]
  2. National Highway Traffic Safety Administration. National Center for Statistics and Analysis: Distracted Driving in Fatal Crashes, 2017; NHTSA: Washington, DC, USA, 2019. [Google Scholar]
  3. Phan, A.C.; Nguyen, N.H.Q.; Trieu, T.N.; Phan, T.C. An Efficient Approach for Detecting Driver Drowsiness Based on Deep Learning. Appl. Sci. 2021, 11, 8441. [Google Scholar] [CrossRef]
  4. Sahayadhas, A.; Sundaraj, K.; Murugappan, M. Detecting Driver Drowsiness Based on Sensors: A Review. Sensors 2012, 12, 16937–16953. [Google Scholar] [CrossRef] [PubMed] [Green Version]
  5. Khan, M.Q.; Lee, S. A Comprehensive Survey of Driving Monitoring and Assistance Systems. Sensors 2019, 19, 2574. [Google Scholar] [CrossRef] [PubMed] [Green Version]
  6. Wei, W.; Ho, E.S.L.; McCay, K.D.; Damaševičius, R.; Maskeliūnas, R.; Esposito, A. Assessing Facial Symmetry and Attractiveness using Augmented Reality. Pattern Anal. Appl. 2021, 1–17. [Google Scholar] [CrossRef]
  7. Abayomi-alli, O.O.; Damaševicius, R.; Maskeliunas, R.; Misra, S. Few-shot learning with a novel voronoi tessellation-based image augmentation method for facial palsy detection. Electronics 2021, 10, 978. [Google Scholar] [CrossRef]
  8. Ngxande, M.; Tapamo, J.R.; Burke, M. Driver drowsiness detection using behavioral measures and machine learning techniques: A review of state-of-art techniques. In Proceedings of the IEEE Pattern Recognition Association of South Africa and Robotics and Mechatronics, Bloemfontein, South Africa, 30 November–1 December 2017; pp. 156–161. [Google Scholar]
  9. Deng, W.; Wu, R. Real-Time Driver-Drowsiness Detection System Using Facial Features. IEEE Access 2019, 7, 118727–118738. [Google Scholar] [CrossRef]
  10. Guo, J.; Markoni, H. Driver drowsiness detection using hybrid convolutional neural network and long short-term memory. Multimed. Tools Appl. 2019, 78, 29059–29087. [Google Scholar] [CrossRef]
  11. Zhao, L.; Wang, Z.; Zhang, G.; Gao, H. Driver drowsiness recognition via transferred deep 3D convolutional network and state probability vector. Multimed. Tools Appl. 2020, 79, 26683–26701. [Google Scholar] [CrossRef]
  12. Dasgupta, A.; Rahman, D.; Routray, A. A Smartphone-Based Drowsiness Detection and Warning System for Automotive Drivers. IEEE Trans. Intell. Transp. Syst. 2019, 20, 4045–4054. [Google Scholar] [CrossRef]
  13. Baccour, M.H.; Driewer, F.; Kasneci, E.; Rosenstiel, W. Camera-based eye blink detection algorithm for assessing driver drowsiness. In Proceedings of the IEEE Intelligent Vehicles Symposium, Paris, France, 9–12 June 2019; Volume 2019, pp. 987–993. [Google Scholar]
  14. Bamidele, A.A.; Kamardin, K.; Aziz, N.S.N.A.; Sam, S.M.; Ahmed, I.S.; Azizan, A.; Bani, N.A.; Kaidi, H.M. Non-intrusive driver drowsiness detection based on face and eye tracking. Int. J. Adv. Comput. Sci. Appl. 2019, 10, 549–569. [Google Scholar] [CrossRef]
  15. Gwak, J.; Hirao, A.; Shino, M. An investigation of early detection of driver drowsiness using ensemble machine learning based on hybrid sensing. Appl. Sci. 2020, 10, 2890. [Google Scholar] [CrossRef]
  16. Zhu, M.; Chen, J.; Li, H.; Liang, F.; Han, L.; Zhang, Z. Vehicle driver drowsiness detection method using wearable EEG based on convolution neural network. Neural Comput. Appl. 2021, 33, 13965–13980. [Google Scholar] [CrossRef] [PubMed]
  17. Guede-Fernández, F.; Fernández-Chimeno, M.; Ramos-Castro, J.; García-González, M.A. Driver Drowsiness Detection Based on Respiratory Signal Analysis. IEEE Access 2019, 7, 81826–81838. [Google Scholar] [CrossRef]
  18. Lee, H.; Lee, J.; Shin, M. Using wearable ECG/PPG sensors for driver drowsiness detection based on distinguishable pattern of recurrence plots. Electronics 2019, 8, 192. [Google Scholar] [CrossRef] [Green Version]
  19. Chui, K.T.; Gupta, B.B.; Liu, R.W.; Zhang, X.; Vasant, P.; Joshua Thomas, J. Extended-range prediction model using NSGA-III optimized RNN-GRU-LSTM for driver stress and drowsiness. Sensors 2021, 21, 6412. [Google Scholar] [CrossRef]
  20. Kim, J.; Shin, M. Utilizing HRV-derived respiration measures for driver drowsiness detection. Electronics 2019, 8, 669. [Google Scholar] [CrossRef] [Green Version]
  21. Wozniak, M.; Wieczorek, M.; Silka, J.; Polap, D. Body Pose Prediction Based on Motion Sensor Data and Recurrent Neural Network. IEEE Trans. Ind. Inform. 2021, 17, 2101–2111. [Google Scholar] [CrossRef]
  22. Li, M.; Jiang, Z.; Liu, Y.; Chen, S.; Wozniak, M.; Scherer, R.; Damasevicius, R.; Wei, W.; Li, Z.; Li, Z. Sitsen: Passive sitting posture sensing based on wireless devices. Int. J. Distrib. Sens. Netw. 2021, 17, 15501477211024846. [Google Scholar] [CrossRef]
  23. Kulikajevas, A.; Maskeliunas, R.; Damaševičius, R. Detection of sitting posture using hierarchical image composition and deep learning. PeerJ Comput. Sci. 2021, 7, 1–20. [Google Scholar] [CrossRef]
  24. Kulikajevas, A.; Maskeliunas, R.; Damasevicius, R.; Scherer, R. Humannet-a two-tiered deep neural network architecture for self-occluding humanoid pose reconstruction. Sensors 2021, 21, 3945. [Google Scholar] [CrossRef] [PubMed]
  25. Dua, M.; Singla, R.; Raj, S.; Jangra, A. Deep CNN models-based ensemble approach to driver drowsiness detection. Neural Comput. Appl. 2021, 33, 3155–3168. [Google Scholar] [CrossRef]
  26. Ranney, T.A.; Garrott, W.R.; Goodman, M.J. NHTSA Driver Distraction Research: Past, Present, and Future; NHTSA: Washington, DC, USA, 2001. [Google Scholar]
  27. Dong, Y.; Hu, Z.; Uchimura, K.; Murayama, N. Driver inattention monitoring system for intelligent vehicles: A review. IEEE Trans. Intell. Transp. Syst. 2010, 12, 596–614. [Google Scholar] [CrossRef]
  28. Nikolaidis, A.; Pitas, I. Facial feature extraction and pose determination. Pattern Recognit. 2000, 33, 1783–1791. [Google Scholar] [CrossRef]
  29. Hsu, R.L.; Abdel-Mottaleb, M.; Jain, A.K. Face detection in color images. IEEE Trans. Pattern Anal. Mach. Intell. 2002, 24, 696–706. [Google Scholar]
  30. Ji, Q. 3D face pose estimation and tracking from a monocular camera. Image Vis. Comput. 2002, 20, 499–511. [Google Scholar] [CrossRef]
  31. Zhang, Z.; Hu, Y.; Liu, M.; Huang, T. Head pose estimation in seminar room using multi view face detectors. In Proceedings of the International Evaluation Workshop on Classification of Events, Activities and Relationships, Southampton, UK, 6–7 April 2006; Springer: Berlin/Heidelberg, Germany, 2006; pp. 299–304. [Google Scholar]
  32. Ohue, K.; Yamada, Y.; Uozumi, S.; Tokoro, S.; Hattori, A.; Hayashi, T. Development of a New Pre-Crash Safety System; SAE Technical Paper; SAE: Warrendale, PA, USA, 2006. [Google Scholar]
  33. Wang, J.G.; Sung, E. EM enhancement of 3D head pose estimated by point at infinity. Image Vis. Comput. 2007, 25, 1864–1874. [Google Scholar] [CrossRef]
  34. Balasubramanian, V.N.; Krishna, S.; Panchanathan, S. Person-independent head pose estimationusing biased manifold embedding. EURASIP J. Adv. Signal Process. 2008, 2008, 63–78. [Google Scholar]
  35. Wang, X.; Huang, X.; Gao, J.; Yang, R. Illumination and person-insensitive head pose estimation using distance metric learning. In Proceedings of the European Conference on Computer Vision, Marseille, France, 12–18 October 2008; pp. 624–637. [Google Scholar]
  36. Fu, Y.; Li, Z.; Yuan, J.; Wu, Y.; Huang, T.S. Locality versus globality: Query-driven localized linear models for facial image computing. IEEE Trans. Circuits Syst. Video Technol. 2008, 18, 1741–1752. [Google Scholar]
  37. Morency, L.P.; Whitehill, J.; Movellan, J. Monocular head pose estimation using generalized adaptive view-based appearance model. Image Vis. Comput. 2010, 28, 754–761. [Google Scholar] [CrossRef]
  38. Ji, H.; Liu, R.; Su, F.; Su, Z.; Tian, Y. Robust head pose estimation via convex regularized sparse regression. In Proceedings of the 18th IEEE International Conference on Image Processing, Brussels, Belgium, 11–14 September 2011; pp. 3617–3620. [Google Scholar]
  39. Hu, W.; Ma, B.; Chai, X. Head pose estimation using simple local gabor binary pattern. In Proceedings of the Chinese Conference on Biometric Recognition, Beijing, China, 3–4 December 2011; pp. 74–81. [Google Scholar]
  40. Yan, S.; Wang, H.; Fu, Y.; Yan, J.; Tang, X.; Huang, T.S. Synchronized submanifold embedding for person-independent pose estimation and beyond. IEEE Trans. Image Process. 2008, 18, 202–210. [Google Scholar]
  41. Murphy-Chutorian, E.; Trivedi, M.M. Head pose estimation and augmented reality tracking: An integrated system and evaluation for monitoring driver awareness. IEEE Trans. Intell. Transp. Syst. 2010, 11, 300–311. [Google Scholar] [CrossRef]
  42. Narayanan, A.; Kaimal, R.M.; Bijlani, K. Estimation of driver head yaw angle using a generic geometric model. IEEE Trans. Intell. Transp. Syst. 2016, 17, 3446–3460. [Google Scholar] [CrossRef]
  43. Tran, D.; Do, H.M.; Sheng, W.; Bai, H.; Chowdhary, G. Real-time detection of distracted driving based on deep learning. IET Intell. Transp. Syst. 2018, 12, 1210–1219. [Google Scholar] [CrossRef]
  44. Ruiz, N.; Chong, E.; Rehg, J.M. Fine-Grained Head Pose Estimation Without Keypoints. In Proceedings of the IEEE/CVF Conference on Computer Vision and Pattern Recognition (CVPR), Salt Lake City, UT, USA, 18–22 June 2018; pp. 2074–2083. [Google Scholar]
  45. Eraqi, H.M.; Abouelnaga, Y.; Saad, M.H.; Moustafa, M.N. Driver distraction identification with an ensemble of convolutional neural networks. J. Adv. Transp. 2019, 2019, 4125865. [Google Scholar] [CrossRef]
  46. Minaee, S.; Luo, P.; Lin, Z.; Bowyer, K.W. Going Deeper Into Face Detection: A Survey. arXiv 2021, arXiv:2103.14983. [Google Scholar]
  47. Alotaibi, M.; Alotaibi, B. Distracted driver classification using deep learning. Signal Image Video Process. 2019, 14, 617–624. [Google Scholar] [CrossRef]
  48. Yang, T.Y.; Chen, Y.T.; Lin, Y.Y.; Chuang, Y.Y. FSA-Net: Learning Fine-Grained Structure Aggregation for Head Pose Estimation From a Single Image. In Proceedings of the IEEE/CVF Conference on Computer Vision and Pattern Recognition (CVPR), Long Beach, CA, USA, 16–20 June 2019; pp. 1087–1096. [Google Scholar]
  49. Torres, R.; Ohashi, O.; Pessin, G. A Machine-Learning Approach to Distinguish Passengers and Drivers Reading While Driving. Sensors 2019, 19, 3174. [Google Scholar] [CrossRef] [PubMed] [Green Version]
  50. Ye, M.; Zhang, W.; Cao, P.; Liu, K. Driver Fatigue Detection Based on Residual Channel Attention Network and Head Pose Estimation. Appl. Sci. 2021, 11, 9195. [Google Scholar] [CrossRef]
  51. Xing, Y.; Lv, C.; Wang, H.; Cao, D.; Velenis, E.; Wang, F.Y. Driver activity recognition for intelligent vehicles: A deep learning approach. IEEE Trans. Veh. Technol. 2019, 68, 5379–5390. [Google Scholar] [CrossRef] [Green Version]
  52. Chen, J.C.; Lee, C.Y.; Huang, P.Y.; Lin, C.R. Driver Behavior Analysis via Two-Stream Deep Convolutional Neural Network. Appl. Sci. 2020, 10, 1908. [Google Scholar] [CrossRef] [Green Version]
  53. Valenti, R.; Sebe, N.; Gevers, T. Combining head pose and eye location information for gaze estimation. IEEE Trans. Image Process. 2012, 21, 802–815. [Google Scholar] [CrossRef] [Green Version]
  54. Fu, X.; Guan, X.; Peli, E.; Liu, H.; Luo, G. Automatic calibration method for driver’s head orientation in natural driving environment. IEEE Trans. Intell. Transp. Syst. 2012, 14, 303–312. [Google Scholar] [CrossRef] [PubMed]
  55. Vicente, F.; Huang, Z.; Xiong, X.; De la Torre, F.; Zhang, W.; Levi, D. Driver gaze tracking and eyes off the road detection system. IEEE Trans. Intell. Transp. Syst. 2015, 16, 2014–2027. [Google Scholar] [CrossRef]
  56. Hirayama, T.; Mase, K.; Miyajima, C.; Takeda, K. Classification of driver’s neutral and cognitive distraction states based on peripheral vehicle behavior in driver’s gaze transition. IEEE Trans. Intell. Veh. 2016, 1, 148–157. [Google Scholar] [CrossRef]
  57. Fridman, L.; Lee, J.; Reimer, B.; Victor, T. ‘Owl’and ‘Lizard’: Patterns of head pose and eye pose in driver gaze classification. IET Comput. Vis. 2016, 10, 308–314. [Google Scholar] [CrossRef] [Green Version]
  58. Lee, D.; Yoon, H.; Hong, H.; Park, K. Fuzzy-System-Based Detection of Pupil Center and Corneal Specular Reflection for a Driver-Gaze Tracking System Based on the Symmetrical Characteristics of Face and Facial Feature Points. Symmetry 2017, 9, 267. [Google Scholar] [CrossRef] [Green Version]
  59. Loce, R.P.; Bernal, E.A.; Wu, W.; Bala, R. Computer vision in roadway transportation systems: A survey. J. Electron. Imaging 2013, 22, 041121. [Google Scholar] [CrossRef] [Green Version]
  60. Streiffer, C.; Raghavendra, R.; Benson, T.; Srivatsa, M. Darnet: A deep learning solution for distracted driving detection. In Proceedings of the 18th ACM/IFIP/USENIX Middleware Conference: Industrial Track, Las Vegas, NV, USA, 11–15 December 2017; pp. 22–28. [Google Scholar]
  61. Hssayeni, M.D.; Saxena, S.; Ptucha, R.; Savakis, A. Distracted driver detection: Deep learning vs handcrafted features. Electron. Imaging 2017, 2017, 20–26. [Google Scholar] [CrossRef]
  62. Peng, J.; Shao, Y. Intelligent method for identifying driving risk based on V2V multisource big data. Complexity 2018, 2018, 1801273. [Google Scholar] [CrossRef]
  63. Aksjonov, A.; Nedoma, P.; Vodovozov, V.; Petlenkov, E.; Herrmann, M. Detection and evaluation of driver distraction using machine learning and fuzzy logic. IEEE Trans. Intell. Transp. Syst. 2018, 20, 2048–2059. [Google Scholar] [CrossRef]
  64. Celaya-Padilla, J.M.; Galván-Tejada, C.E.; Lozano-Aguilar, J.S.A.; Zanella-Calzada, L.A.; Luna-García, H.; Galván-Tejada, J.I.; Gamboa-Rosales, N.K.; Velez Rodriguez, A.; Gamboa-Rosales, H. “Texting & Driving” detection using deep convolutional neural networks. Appl. Sci. 2019, 9, 2962. [Google Scholar]
  65. Sigari, M.H.; Fathy, M.; Soryani, M. A driver face monitoring system for fatigue and distraction detection. Int. J. Veh. Technol. 2013, 2013, 263983. [Google Scholar] [CrossRef] [Green Version]
  66. Diaz-Chito, K.; Hernández-Sabaté, A.; López, A.M. A reduced feature set for driver head pose estimation. Appl. Soft Comput. 2016, 45, 98–107. [Google Scholar] [CrossRef]
  67. La Casica, M.; Sclaroff, S.; Athitsos, V. Fast, Reliable Head Tracking under Varying Illumination: An Approach Based on Registration of Texture-Mapped 3D Model; Boston University Computer Science Department: Boston, MA, USA, 2011. [Google Scholar]
  68. Gourier, N.; Hall, D.; Crowley, J.L. Estimating face orientation from robust detection of salient facial features. In Proceedings of the ICPR International Workshop on Visual Observation of Deictic Gestures, Cambridge, UK, 22 August 2004; pp. 1–9. [Google Scholar]
  69. Anwar, I.; Nawaz, S.; Kibria, G.; Ali, S.F.; Hassan, M.T.; Kim, J.B. Feature based face recognition using slopes. In Proceedings of the International Conference on Control, Automation and Information Sciences, Gwangju, Korea, 2–5 December 2014; pp. 200–205. [Google Scholar]
  70. Cootes, T.; Baldock, E.; Graham, J. An Introduction to Active Shape Models; Oxford University Press: Oxford, UK, 2000; pp. 223–248. [Google Scholar]
  71. Weisstein, E.W. Heron’s Formula; Wolfram Research, Inc.: Champaign, IL, USA, 2003. [Google Scholar]
  72. Molokach, J. Law of cosines—A proof without words. Am. Math. Mon. 2014, 121, 722. [Google Scholar] [CrossRef]
  73. Mahmood, A. Structure-less object detection using adaboost algorithm. In Proceedings of the International Conference on Machine Vision, Isalambad, Pakistan, 28–29 December 2007; pp. 85–90. [Google Scholar]
  74. Mahmood, A.; Khan, S. Early terminating algorithms for Adaboost based detectors. In Proceedings of the 16th IEEE International Conference on Image Processing (ICIP), Cairo, Egypt, 7–10 November 2009; pp. 1209–1212. [Google Scholar]
  75. Kaur, G.; Chhabra, A. Improved J48 classification algorithm for the prediction of diabetes. Int. J. Comput. Appl. 2014, 98, 13–17. [Google Scholar] [CrossRef]
  76. Tanwani, A.K.; Afridi, J.; Shafiq, M.Z.; Farooq, M. Guidelines to select machine learning scheme for classification of biomedical datasets. In Proceedings of the European Conference on Evolutionary Computation, Machine Learning and Data Mining in Bioinformatics, Valencia, Spain, 11–13 April 2009; pp. 128–139. [Google Scholar]
  77. Freund, Y.; Schapire, R.; Abe, N. A short introduction to boosting. J. Jpn. Soc. Artif. Intell. 1999, 14, 771–780. [Google Scholar]
  78. Ali, S.F.; Hassan, M.T. Feature Based Techniques for a Driver’s Distraction Detection using Supervised Learning Algorithms based on Fixed Monocular Video Camera. KSII Trans. Internet Inf. Syst. 2018, 12, 3820–3841. [Google Scholar]
  79. Azman, A.; Meng, Q.; Edirisinghe, E.A.; Azman, H. Non-intrusive physiological measurement for driver cognitive distraction detection: Eye and mouth movements. Int. J. Adv. Comput. Sci. 2011, 1, 92–99. [Google Scholar]
  80. Bergasa, L.M.; Nuevo, J.; Sotelo, M.A.; Barea, R.; Lopez, M.E. Real-time system for monitoring driver vigilance. IEEE Trans. Intell. Transp. Syst. 2006, 7, 63–77. [Google Scholar] [CrossRef] [Green Version]
  81. Rongben, W.; Lie, G.; Bingliang, T.; Lisheng, J. Monitoring mouth movement for driver fatigue or distraction with one camera. In Proceedings of the IEEE 7th International Conference on Intelligent Transportation Systems, Washington, DC, USA, 3–6 October 2004; pp. 314–319. [Google Scholar]
  82. Fridman, L.; Langhans, P.; Lee, J.; Reimer, B. Driver gaze estimation without using eye movement. Pattern Recognit. 2016, 2, 49–56. [Google Scholar]
  83. Awan, M.J.; Masood, O.A.; Mohammed, M.A.; Yasin, A.; Zain, A.M.; Damaševičius, R.; Abdulkareem, K.H. Image-Based Malware Classification Using VGG19 Network and Spatial Convolutional Attention. Electronics 2021, 10, 2444. [Google Scholar] [CrossRef]
Figure 1. Showing Complete Architecture of the Proposed System.
Applsci 11 11600 g001
Figure 2. The output of Facial Fiducial Point Detection Algorithms, including ASM and BoRMaN: (a) Original, (b) ASM, and (c) BoRMaN.
Applsci 11 11600 g002
Figure 3. Computation of Geometric Features: (a) Original Image, (b) Ratios of length to width of eyes and lips, (c) Triangles and Angles.
Applsci 11 11600 g003
Figure 4. Calculation of features using Motion Vector and Interpolation Technique.
Applsci 11 11600 g004
Figure 5. Images of the DrivFace dataset showing head poses with different values of the yaw angle.
Applsci 11 11600 g005
Figure 6. Images of FT-UMT dataset showing head poses with different values of the yaw angle.
Applsci 11 11600 g006
Figure 7. Images of Pointing’04 dataset showing head poses with different values of the yaw angle.
Applsci 11 11600 g007
Figure 8. Comparison of execution times (seconds) of the variants (EM-Stat, TA, AM-Mouth, Ali, Lee, Frid) and the proposed approach (PA_B-J48) on the DrivFace (DF), Boston University (BU), FT-UMT (FT-UMT), and Pointing’04 (Point’04) datasets.
Applsci 11 11600 g008
Table 1. Comparison of some existing distraction detection methods. Ref = Reference, Acc = Accuracy.
RefApproachAccFeaturesLimitations
[45]genetically weighted CNNs90.0%face, hand imageshigh training time
[55]supervised descent method90.0%facial featureshigh complexity
[56]data-mining95.4%gaze transitionlarge cycle time
[57]gaze detection94.6%eye poselarge decision time
[62]CNN, bayesian filter92.5%lane departurehigh complexity
[63]regression-based ML, fuzzy logic80.0%speed deviationlow accuracy
[64]deep learning86.0%textinghigh training time
[49]gradient boosting95.0%hand and face imageshigh complexity
[65]face-matching-based fuzzy expert system78.0%eyelid distance, eye closure ratelow accuracy
Table 2. Comparison of the existing approaches, EM-Stat, TA, AM-Mouth, Ali, Lee, and Frid with the proposed approach, PA_B-J48, in terms of accuracy (A), sensitivity/recall (Se), Precision (P), F-Measure (F), TP Rate, FP Rate, ROC Area for DrivFace dataset.
EM-StatTAAM-MouthAliLeeFridPA_B-J48
A (%)90.7889.5689.7392.0088.5291.3094.43
Se (%)91.0089.0089.0092.0088.0091.0094.00
P (%)89.0080.00091.0082.0091.0094.00
F0.890.8400.910.840.910.94
TP0.910.890.900.920.880.910.94
FP0.610.890.890.380.860.410.32
ROC0.860.640.640.860.580.710.91
Table 3. Comparison of the existing approaches, EM-Stat, TA, AM-Mouth, Ali, Lee, and Frid with the proposed approach, PA_B-J48, for the Boston University dataset.
EM-StatTAAM-MouthAliLeeFridPA_B-J48
A (%)86.3371.5855.0389.2078.0582.3792.08
Se (%)86.0071.0055.0089.0078.0082.0092.00
P (%)86.0071.0053.0089.0078.0082.0092.00
F0.860.710.540.890.780.820.92
TP0.860.710.550.890.780.820.92
FP0.130.310.500.110.210.180.08
ROC0.920.740.590.920.810.810.96
Table 4. Comparison of the existing approaches, EM-Stat, TA, AM-Mouth, Ali, Lee, and Frid with the proposed approach, PA_B-J48, for the FT-UMT dataset.
EM-StatTAAM-MouthAliLeeFridPA_B-J48
A (%)95.2590.1092.6895.2594.3695.0596.63
Se (%)95.0090.0092.0095.0094.0095.0096.00
P (%)95.0091.0092.0095.0094.0095.0096.00
F0.950.880.920.950.940.950.96
TP0.950.900.920.950.940.950.96
FP0.160.500.330.130.220.140.08
ROC0.870.680.830.880.860.890.97
Table 5. Comparison of the existing approaches, EM-Stat, TA, AM-Mouth, Ali, Lee and Frid with PA_B-J48 using the Pointing’04 dataset.
EM-StatTAAM-MouthAliLeeFridPA_B-J48
A (%)82.8167.4072.2482.8181.4981.0582.81
Se (%)82.0067.0072.0082.0081.0081.0082.00
P (%)83.0071.0074.0083.0081.0082.0083.00
F0.830.670.720.830.810.810.83
TP0.820.670.720.820.810.810.82
FP0.160.280.250.170.230.170.16
ROC0.880.730.780.860.840.800.88
Table 6. Comparison of the proposed approach, PA_B-J48, with its variants, i.e., BNB, BAda, BNN and BSVM for the DrivFace, BU, FT-UMT, and Pointing’04 datasets in terms of percentage accuracy.
DatasetBNBBAdaBNNBSVMPA_B-J48
DrivFace81.5692.8692.1789.2194.43
BU69.4285.9792.0883.8192.08
FT-UMT94.0695.2595.6494.6596.63
Pointing’0480.6182.3795.0281.9383.25
Table 7. Comparison of PA_B-J48 with deep learning approaches including ResNet-50(R-50), ResNet-101(R-101), VGG-19(V-19), Inception-V3(I-V3), MobileNet(M), and Xception(XP).
R-50R-101V19MI-V3XpPA_B-J48
DrivFace87.6145.9039.3480.3385.2585.2594.43
BU87.4044.4447.0960.3286.2485.7192.08
FT-UMT82.5054.5048.5094.0092.0091.5096.63
Table 8. Accuracies obtained by subtracting features one by one from the proposed approach. VA = Variance of Angles, VAT = Variance of Area of Triangles, VER = Variance of Eyes Ratio, VTR = Variance of Triangle Area Ratio, VLR = Variance of Lips Ratio, BU = Boston University, DF = DrivFace, and P04 = Pointing04.
VAVATVERVTRVLRPA_B-J48
BU87.0586.9087.7687.4187.0592.08
DF90.9591.0792.8694.6092.5294.43
P0480.5480.9381.0281.9081.7082.81
Publisher’s Note: MDPI stays neutral with regard to jurisdictional claims in published maps and institutional affiliations.

