1. Introduction
Marine industry employs a wide range of internal combustion (IC) engines for various applications; while their role as the prime mover of a vessel is undoubtedly the most important, it is broadly accepted that IC engines have a fundamental role in ship operations in general, making their proper operation crucial; for example, a typical Ro-Ro vessel has four medium power 4-stroke engines installed onboard, which are required for the operation of the corresponding generator-sets [
1]; a possible failure even only at one of the installed IC engines will immediately result in a safety compromise, according to the corresponding safety regulations [
2], with severe consequences.
Mass Air Flow (MAF) sensors are measuring devices integrated to IC engines. Their role is to measure the air intake during the operation of the engine in order to consequently efficiently adjust the amount of fuel supplied during combustion. The majority of the MAF sensors currently employed are thermal flow microsensors, since, during the last two decades, microsystem technologies have greatly contributed to the reduction of the cost for this specific type of sensor [
3,
4]. Printed Circuit Board (PCB) technology is a new sensor fabrication technology that combines printed circuit and MEMS technology and addresses some drawbacks of the standard microelectronic fabrication process [
5]. Briefly, the sensing elements of a sensor developed with PCB technology are inherently connected to the macroworld, overcoming the necessity for performing wire bonding (a delicate process for the creation of the necessary electrical pathways between microscale sensing elements and the corresponding macroworld circuitry), with immediate benefits in device complexity, mechanical reliability, process time, and cost [
5,
6].
Airfoils find many applications in the industry, including, but not limited to, aeronautics, naval, and automotive engineering. An airfoil is a streamlined body, capable of generating significantly more lift than drag, which provides much smoother flow than non-streamlined bodies, keeping airflow attached to the surface rather than breaking free and causing turbulence. Numerous airfoils can be designed for different applications [
7]. The most renown are the NACA series developed by the National Advisory Committee for Aeronautics airfoils during the late 1920s and into the 1930s [
8,
9].
In this paper, we present a novel air intake sensor, which is based on additive manufacturing and PCB technology. In more detail, the sensor’s sensing element was fabricated, utilizing only standard PCB fabrication techniques and commercially available sensing components, while 3D printing technology was employed for fabricating an appropriate air flow, shaping housing. The housing’s geometry was derived through appropriate Computational Fluid Dynamic (CFD) simulations-in order to investigate the effect of the main design parameters, employing SimScale Online CAE Simulation Platform [
10]. The contribution of additive manufacturing is of paramount importance, as it significantly minimizes the design constrains during manufacturing [
11], allowing implementation of the derived topology as per the optimum deduced from CFD simulations.
As a general remark, the obtained optimal geometry efficiently addresses the measuring challenges present on the intake flow of an IC engine; it is originated in a flow-bypass topology studied in previous work [
12] combined with standard airfoil geometry; the airfoil geometry implementation drastically improves the bypass flow profile compared to a previous study [
12]. It is the authors’ belief that no research work is currently available focusing on the employment of standard airfoil geometries in sensor housing design through appropriate CFD simulations, nor on employing additive manufacturing for delivering the optimal housing; we should note that its final geometry is quite challenging but it results in a lightweight and robust housing that can be manufactured in a relevant short time, even on-site, employing a commercially available 3D printing device. This contributes to reduced manufacturing cost and space saving, especially onboard a vessel, while at the same time, promotes the general objective of minimizing the financial and environmental impact of transportation [
11,
13].
2. Materials and Methods
The required air flow during the operation of an Internal Combustion (IC) engine can vary depending on its operating conditions (i.e., the load applied); a typical air flow intake for a low power industrial engine is 0 to 615 kg/h [
14], which is equal to about 0 to 8806 SLPM (25 °C at 1 bar), a noticeably large range. In reference [
15], the authors successfully demonstrated a flow sensor based on PCB low-cost technology that was able to measure the air intake of a working IC engine up to 180 kg/h under the hot-wire principle of operation for constant current (CC) and constant resistance (CR) mode.
However, saturation in the sensor’s signal was noticed for flows above the specific value of air intake, limiting the measuring range of the device. Furthermore, during IC engine operation, the intake flow was not constant but pulsating, due to the engine’s principle of operation [
16]; this effect was not taken into consideration in the specific PCB-based sensing device.
In reference [
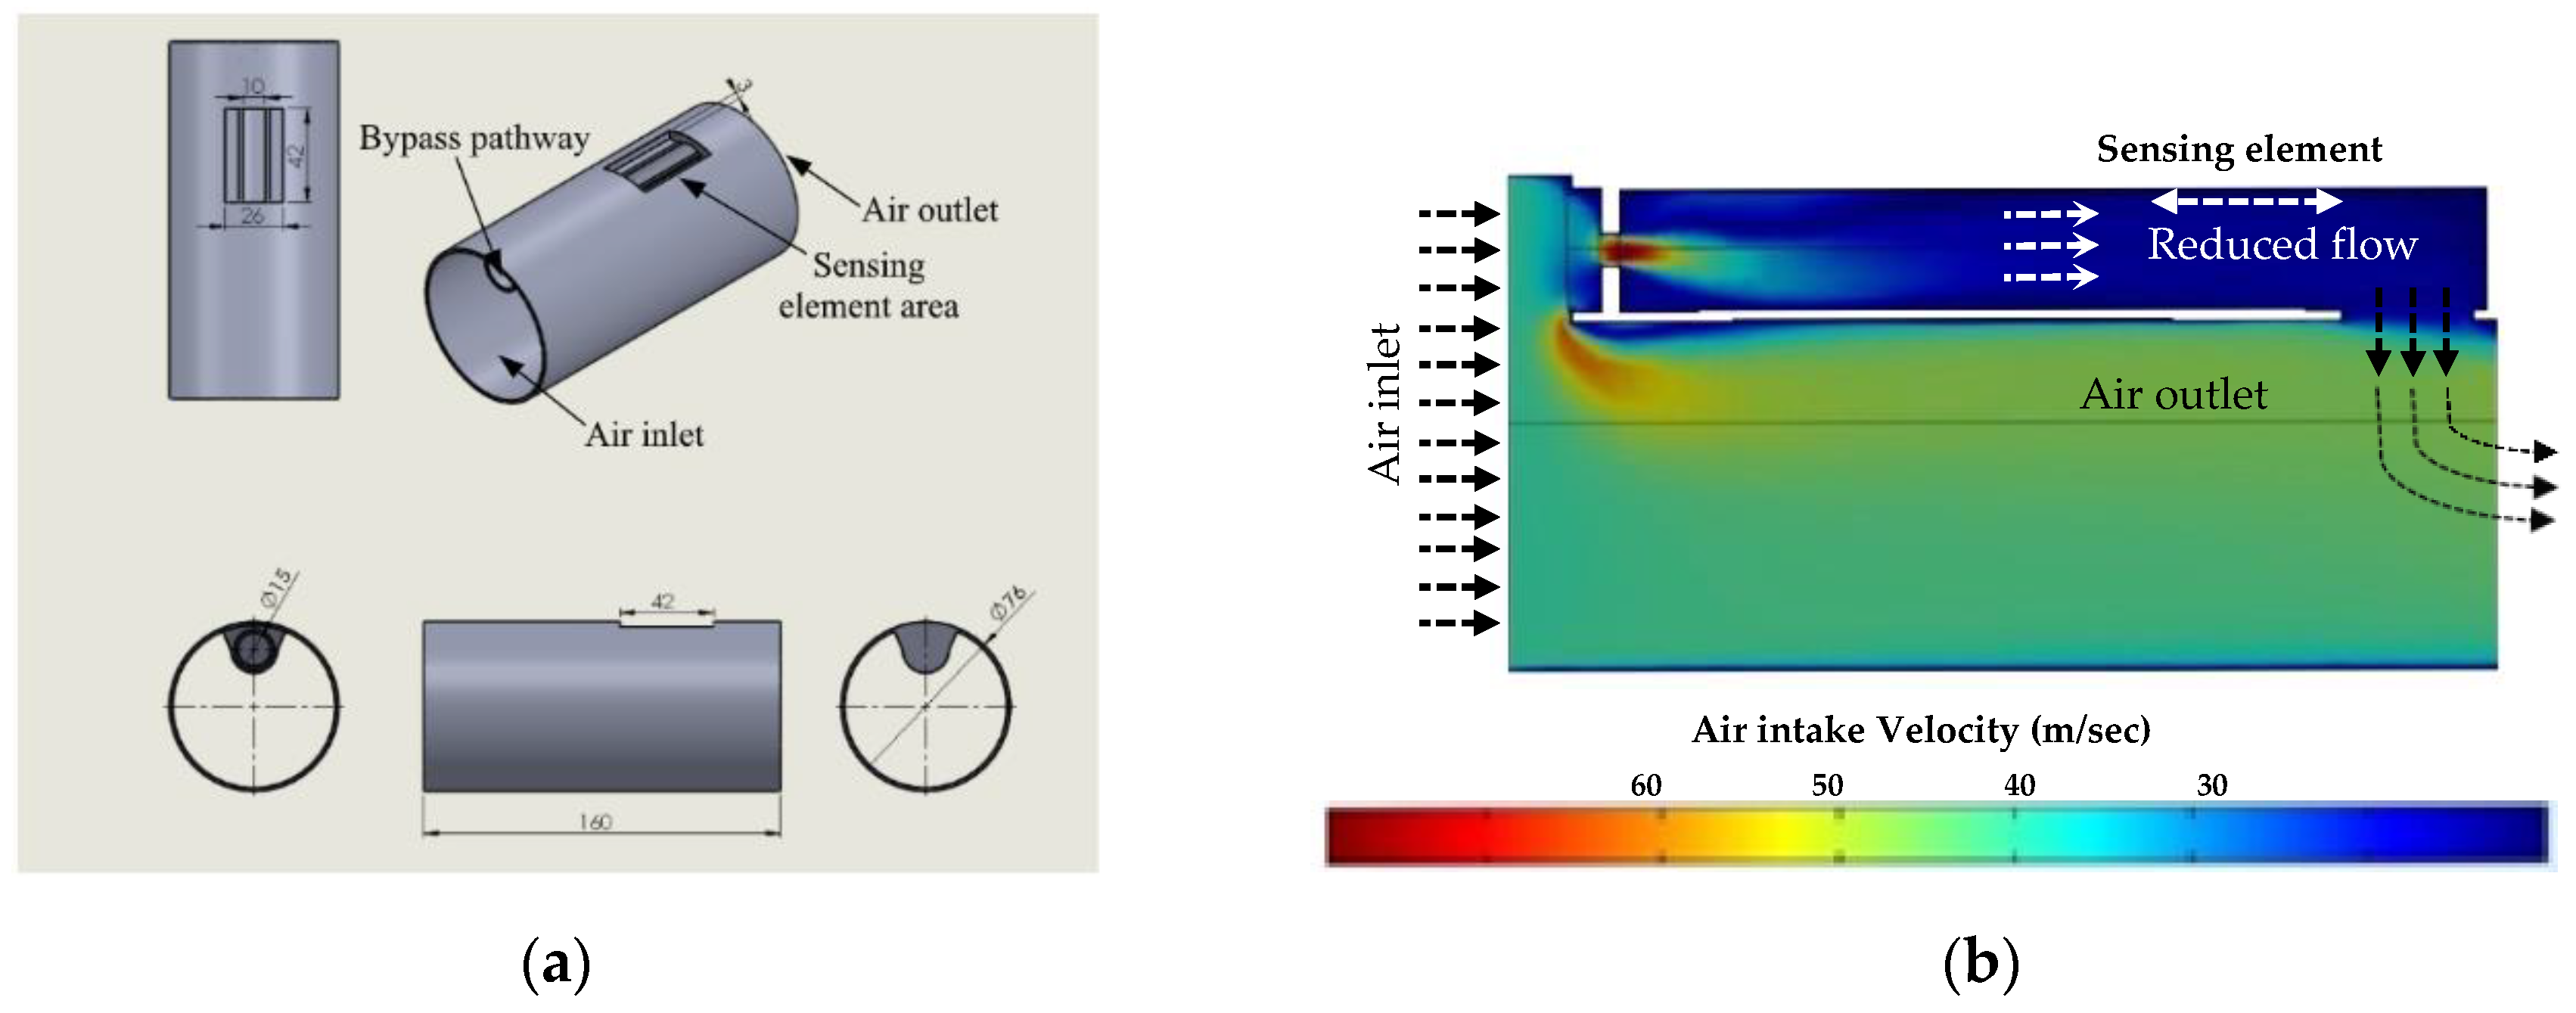
12], an engine air intake sensor based on PCB and 3D printing technology was presented by the authors. Briefly, the sensor’s sensing element was fabricated utilizing standard PCB fabrication techniques and commercially available components, while 3D printing technology was employed for fabricating an appropriate air flow shaping housing with an integrated flow-bypass pathway as a first attempt to address the measuring challenges present on the intake flow (
Figure 1). The functionality of the device has been well demonstrated for a range of 0 to 260 kg/h (0 to 3723 SLPM), which is increased by 44% compared to the increase initially obtained in [
15]. However, we should note that for flow rate values approximately above 260 kg/h (3723 SLPM), saturation in the sensor’s signal was still present. A series of appropriate CFD simulations concerning the developed flow profile inside the bypass pathway revealed a significant circulating flow at the end of the pathway, near the sensing element’s mounting location; furthermore, the sudden expansion at the inlet of the employed bypass design can lead to boundary layer separation with a reattachment point that can be situated near the sensing element area as the flow rate increases [
17]. As mentioned by the authors, both of these geometry-induced effects restricted the device’s measuring range.
The current work focuses on further optimizing the engine air intake sensor presented in [
12] and drastically increasing its measuring range. In more detail, an optimal bypass pathway design, employing inlet and outlet designs, which are based on airfoil geometries (i.e., National Advisory Committee for Aeronautics airfoils (NACA) [
18], Joukowski airfoils [
19]), was derived through suitable CFD simulations. As we present in the later sections, by appropriately shaping the flow profile at both inlet and outlet ports of the bypass, boundary layer separation and circulating flow were minimized significantly, expanding the sensor’s measuring range.
- A.
Initial Housing Design Concepts Investigated
The initial housing design (
Figure 2) was re-designed regarding both the inlet and outlet of the bypass section geometries, along with the necessary orifice for appropriately decreasing the bypass inflow and the outflow topology for constraining the back flow induced during IC engine operation. Three test design concepts (i.e., test designs 1, 2, and 3) were investigated through CFD simulations. In more detail, a series of simulations were performed, assuming a maximum engine air intake of 1000 kg/h (14,076 SLPM), which corresponds to an air velocity of 29.87 m/s at the main inflow pathway of the housing, taking into consideration its cross-section area, equal to 78.54 cm
2. For the specific value of air velocity entering the bypass’ inlet, with a much smaller cross-section area of 3.14 cm
2, the corresponding Reynolds number for the flow inside the Bypass pathway can be easily estimated at 38,248 pointing to turbulent flow.
Considering the above remark, the turbulence model k-omega (k−ω) SST [
20] was employed for all the simulations performed, since the developed flow profile inside the Bypass region should be determined as accurate as possible both in the near-wall region (where the sensing element is situated) and in the fully turbulent region, far from the wall. Each geometry and the corresponding characteristic simulation results are presented in
Figure 3,
Figure 4 and
Figure 5, while the main simulation results and the overall outcome for each test design are summarized in
Table 1. Note that a brief presentation follows for test designs 1 and 2, while a more thorough description is presented in the next section for the third test design.
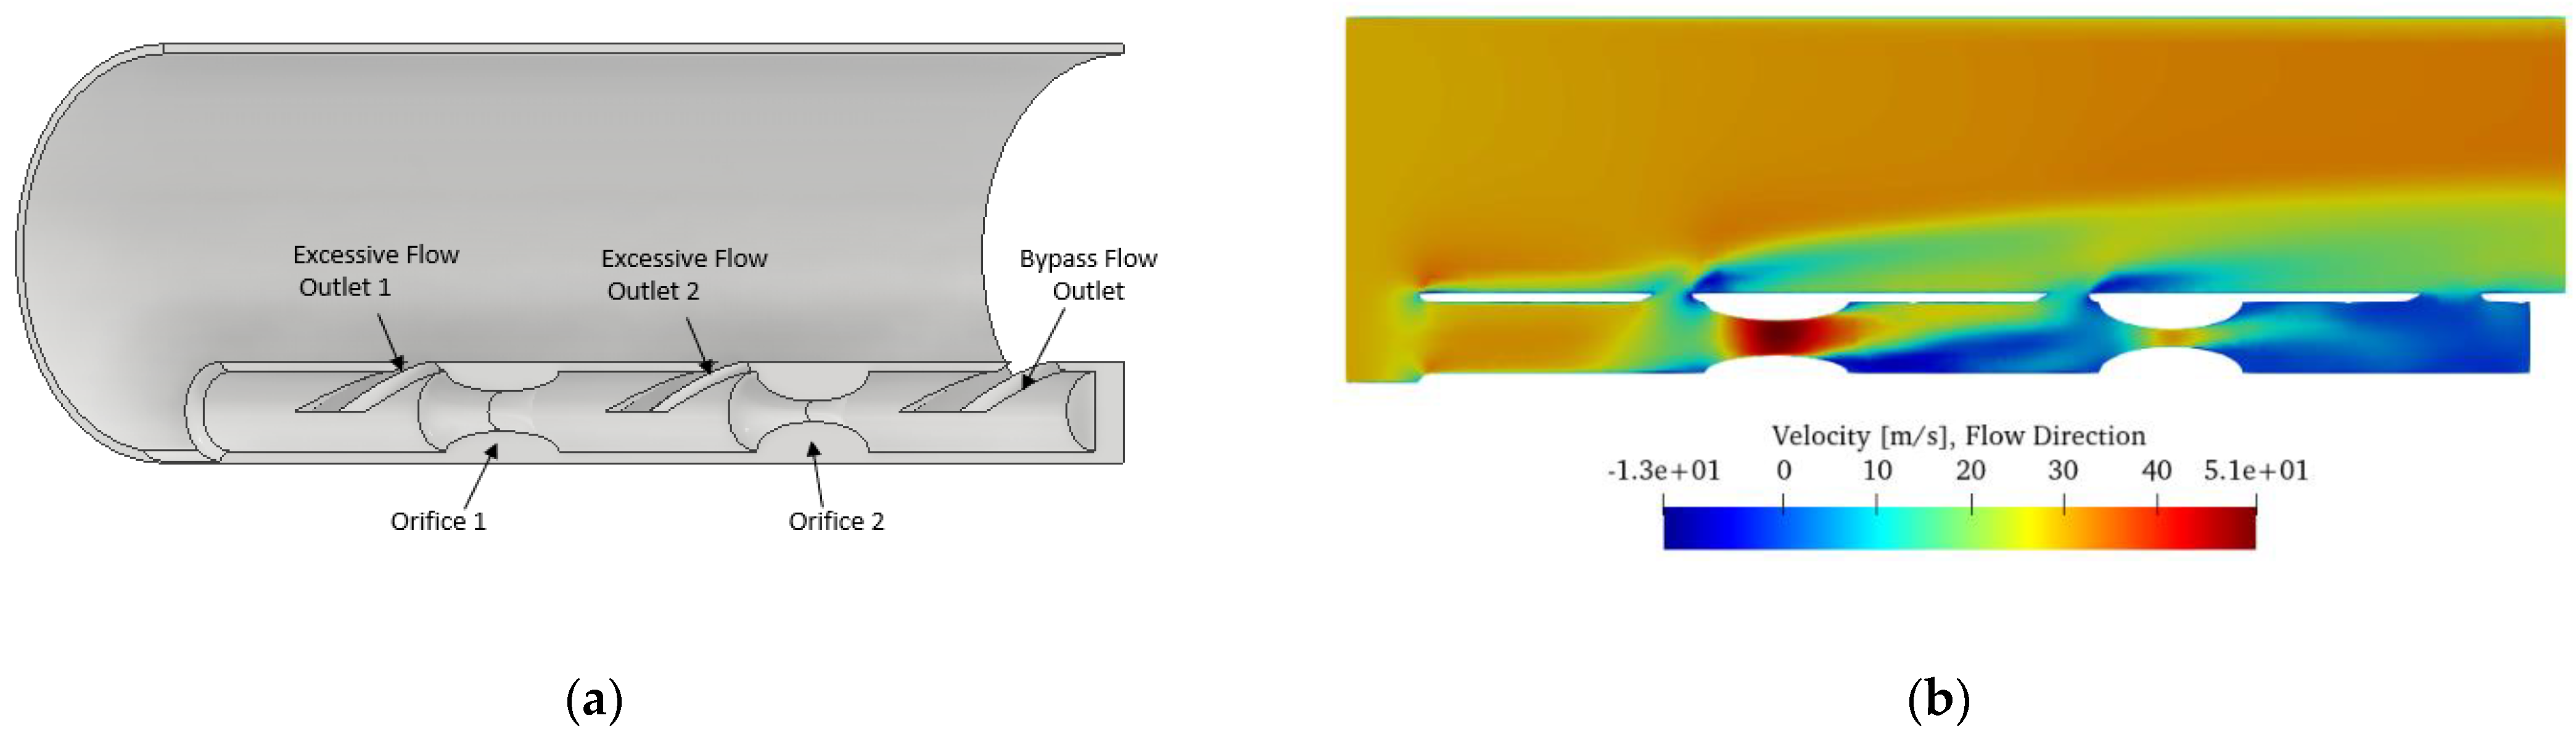
As we can see in
Figure 3, the first test design was based on a topology similar to the one employed at reference [
12]; the basic difference is that the reduction of the incoming bypass flow was performed in two consecutive steps instead of employing a single orifice with a drastically reduced diameter (compared to the bypass tube), which lead to a sudden increase of inflow velocity locally. In addition, in order to minimize flow circulation throughout the bypass, an outlet was added before each orifice for the diversion of excessive flow outside the bypass pathway. The topology of the second test design was similar (
Figure 4), decreasing the incoming flow in two steps; the main difference in this case was the orifice topology. In more detail, the concept of a “curved orifice” was introduced (imitating the pipe eccentric reducers design/shape [
21]) to allow the orifice diameter to be gradually reduced and then re-expanded, aiming for minimum flow circulation around the orifice area.
Summarizing the obtained CFD simulation results for test designs (1) and (2), we noticed that a high circulating flow was present (dark-blue areas at
Figure 3b and
Figure 4b), while the velocity varied significantly throughout the bypass pathway.
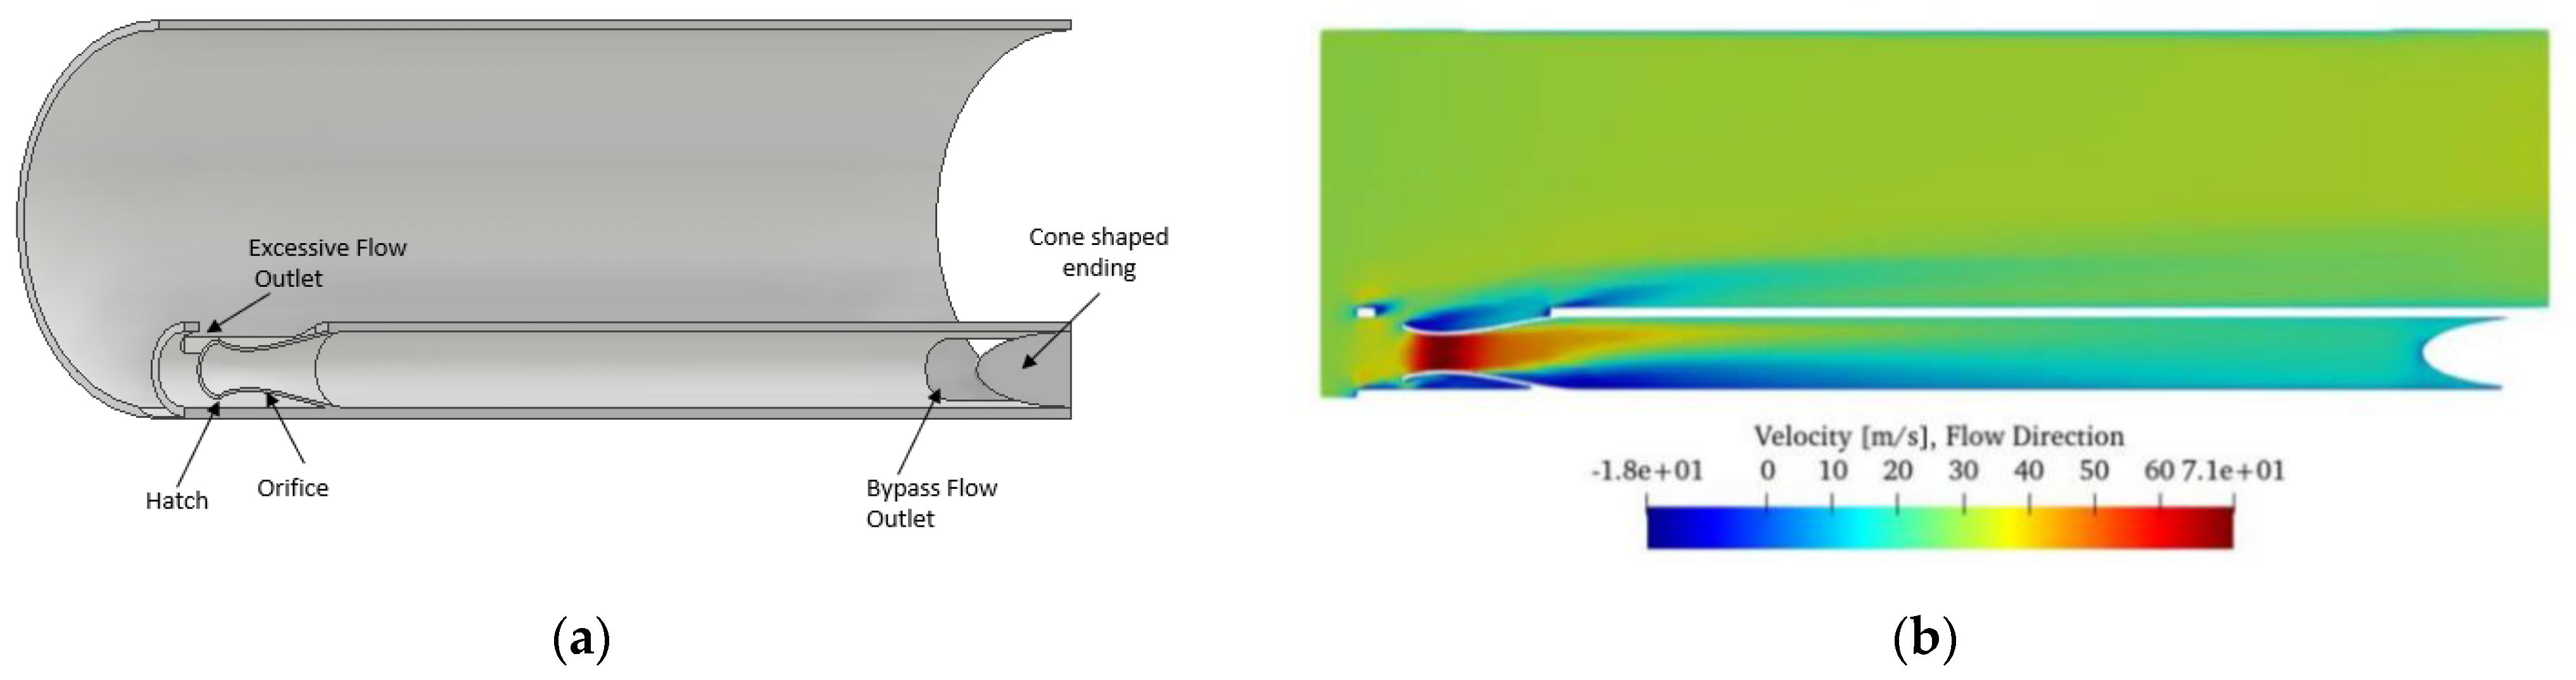
In the third test design (
Figure 5), considering their important contribution to the automobile industry [
22], airfoil geometries (NACA and Joukowski) were employed for the basis of the inlet orifice’s geometry to obtain a stable velocity profile near the sensing area with a significant reduction of speed. Thus, several standard airfoil types were tested through appropriate CFD simulations based on the literature [
22,
23,
24] and the subject geometry constrains.
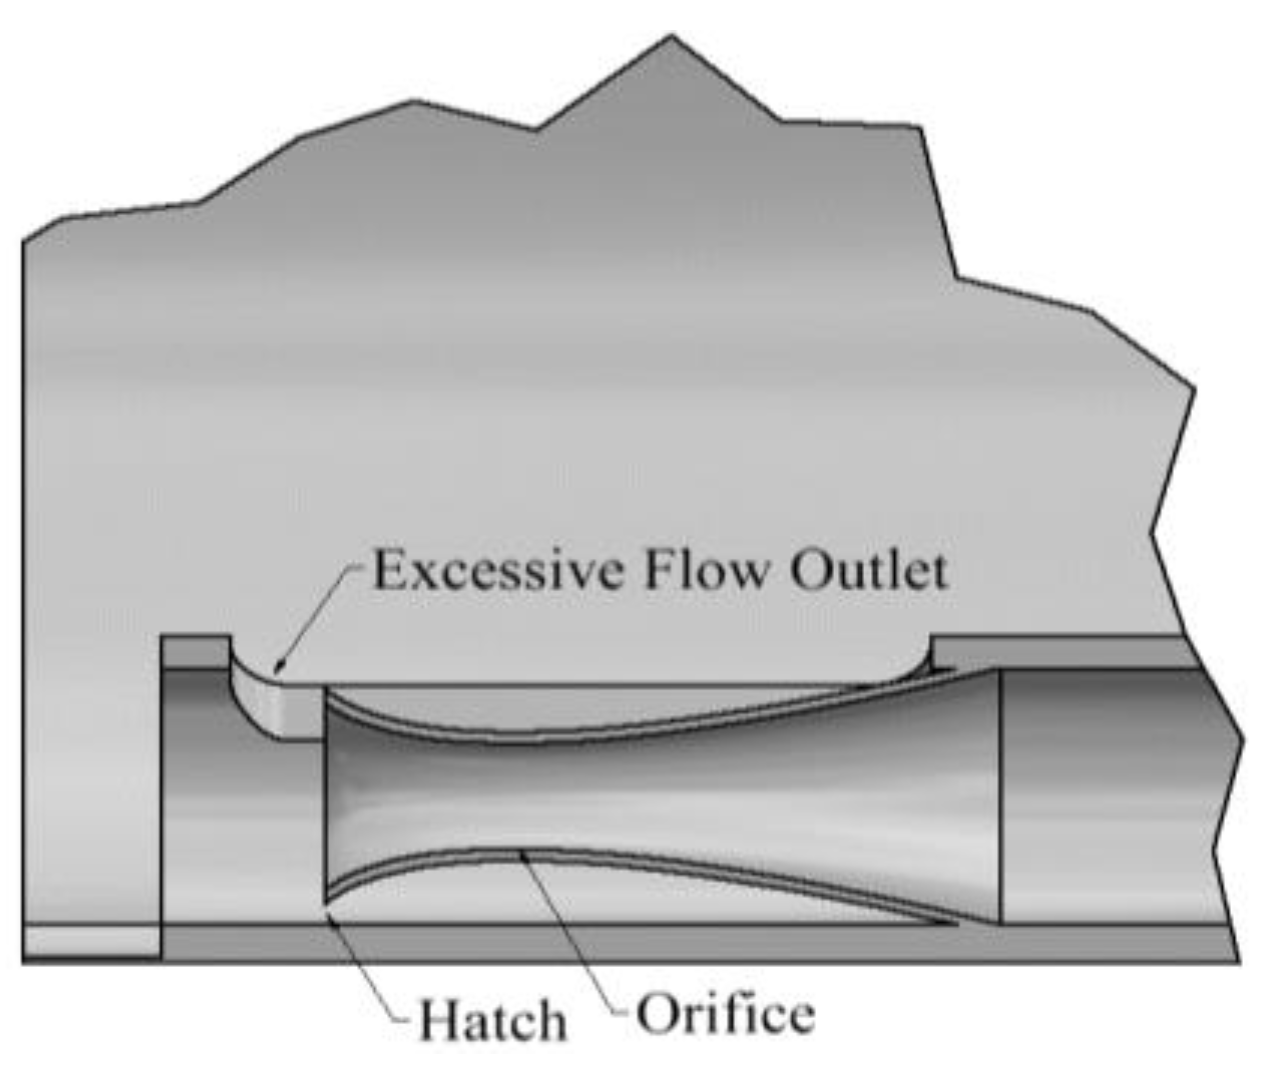
We should point out that, apart from employing an airfoil-based geometry for the inlet orifice, a “hatch-orifice pair” topology was introduced at the inflow, as presented in
Figure 6. In more detail, instead of adding an outlet prior to the orifice, as in the previous two test designs, a circumferential pathway was placed around the orifice for the diversion of the excessive flow. Furthermore, a cone-shaped ending was also employed at the rear-end of the bypass in order to subside the circulating flow near the outflow region; note that the flow outlet was perpendicular to the bypass pathway, as shown in
Figure 5a. The above alterations led to substantial minimization of flow circulation throughout the bypass, as shown in
Figure 5b.
- B.
Determining the Optimum Geometry of the Sensor’s Housing
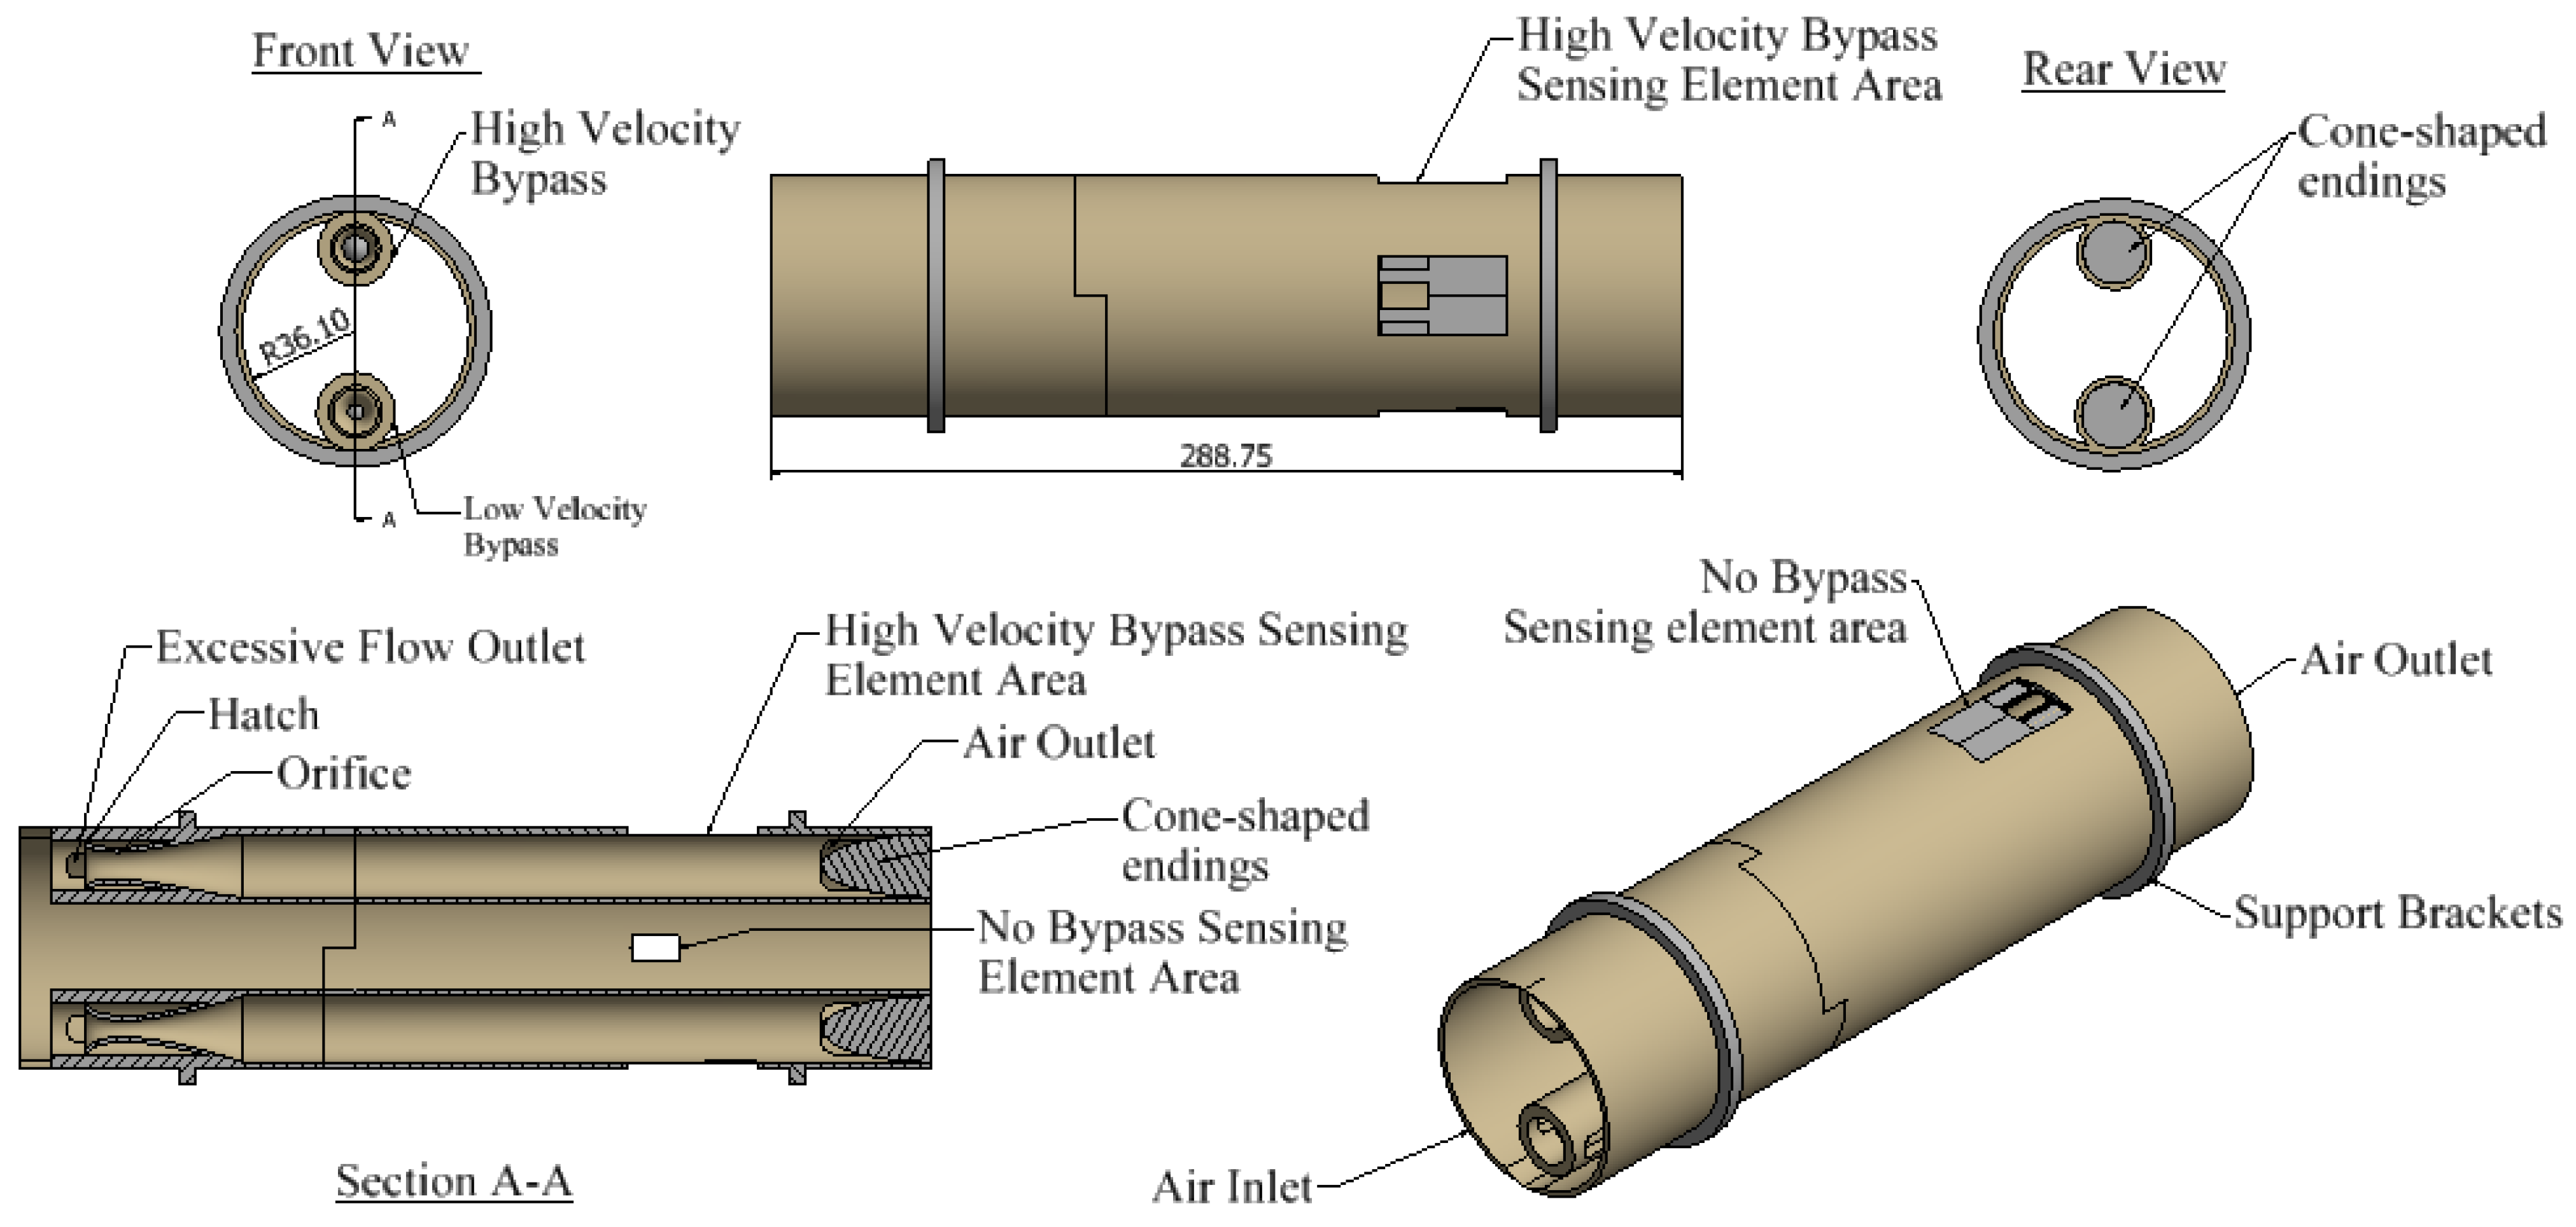
Having determined the most appropriate bypass topology, we proceeded with the necessary study for finalizing the sensor’s complete housing geometry. A maximum engine air intake of 1000 kg/h (14076 SLPM) was assumed, exceeding by over 50% the maximum air intake for a typical low power industrial IC engine [
14]. We should note that, in order to expand the measuring range of the final sensor as much as possible, the employed housing design featured two bypass sections, each with a separate sensing element. That is, one bypass (“High Velocity Bypass”) with an optimized geometry for a moderate incoming flow range (0–350 kg/h) and a second bypass (“Low Velocity Bypass”) for a considerably higher flow range (350–1000 kg/h); note that the names of each bypass refer to the magnitude of the developed velocity inside the pathway for the same incoming flow and not to the magnitude of the incoming flow itself. In addition, a third sensing element was mounted directly on the main inflow pathway of the housing for reference. The final topology is presented in
Figure 7.
As in the previous study steps, the exact geometry of the overall design (i.e., orifice diameters, bypass diameters, outlet areas, etc.) was obtained through a series of CFD simulations. For the maximum engine air intake (1000 kg/h or 14076 SLPM), an inflow velocity of 50.82 m/s was obtained, considering the main area at the housing’s inlet. For the specific velocity, present at each of the bypass inlets (with a much smaller cross-section area of 3.14 cm2), the corresponding Reynolds number was estimated at 65,064, pointing to turbulent flow for both bypass pathways.
Considering the above remark, the turbulence model k-omega (k−ω) SST was employed, as in the previous series of simulations performed. Characteristic simulation results (for fully developed flows, corresponding to intakes of 1000 kg/h and 500 kg/h) are presented at
Figure 8 for the deduced optimum geometry.
As we can see in the specific figure, a drastic drop of over 50% for the Low Velocity bypass and 80% for the High Velocity Bypass of the initial value for the air velocity entering the housing inlet was predicted, resulting in reduced air velocity at the sensing element, as presented in
Table 2; an approximately three-fold increase was noticed at the orifice areas, as expected.
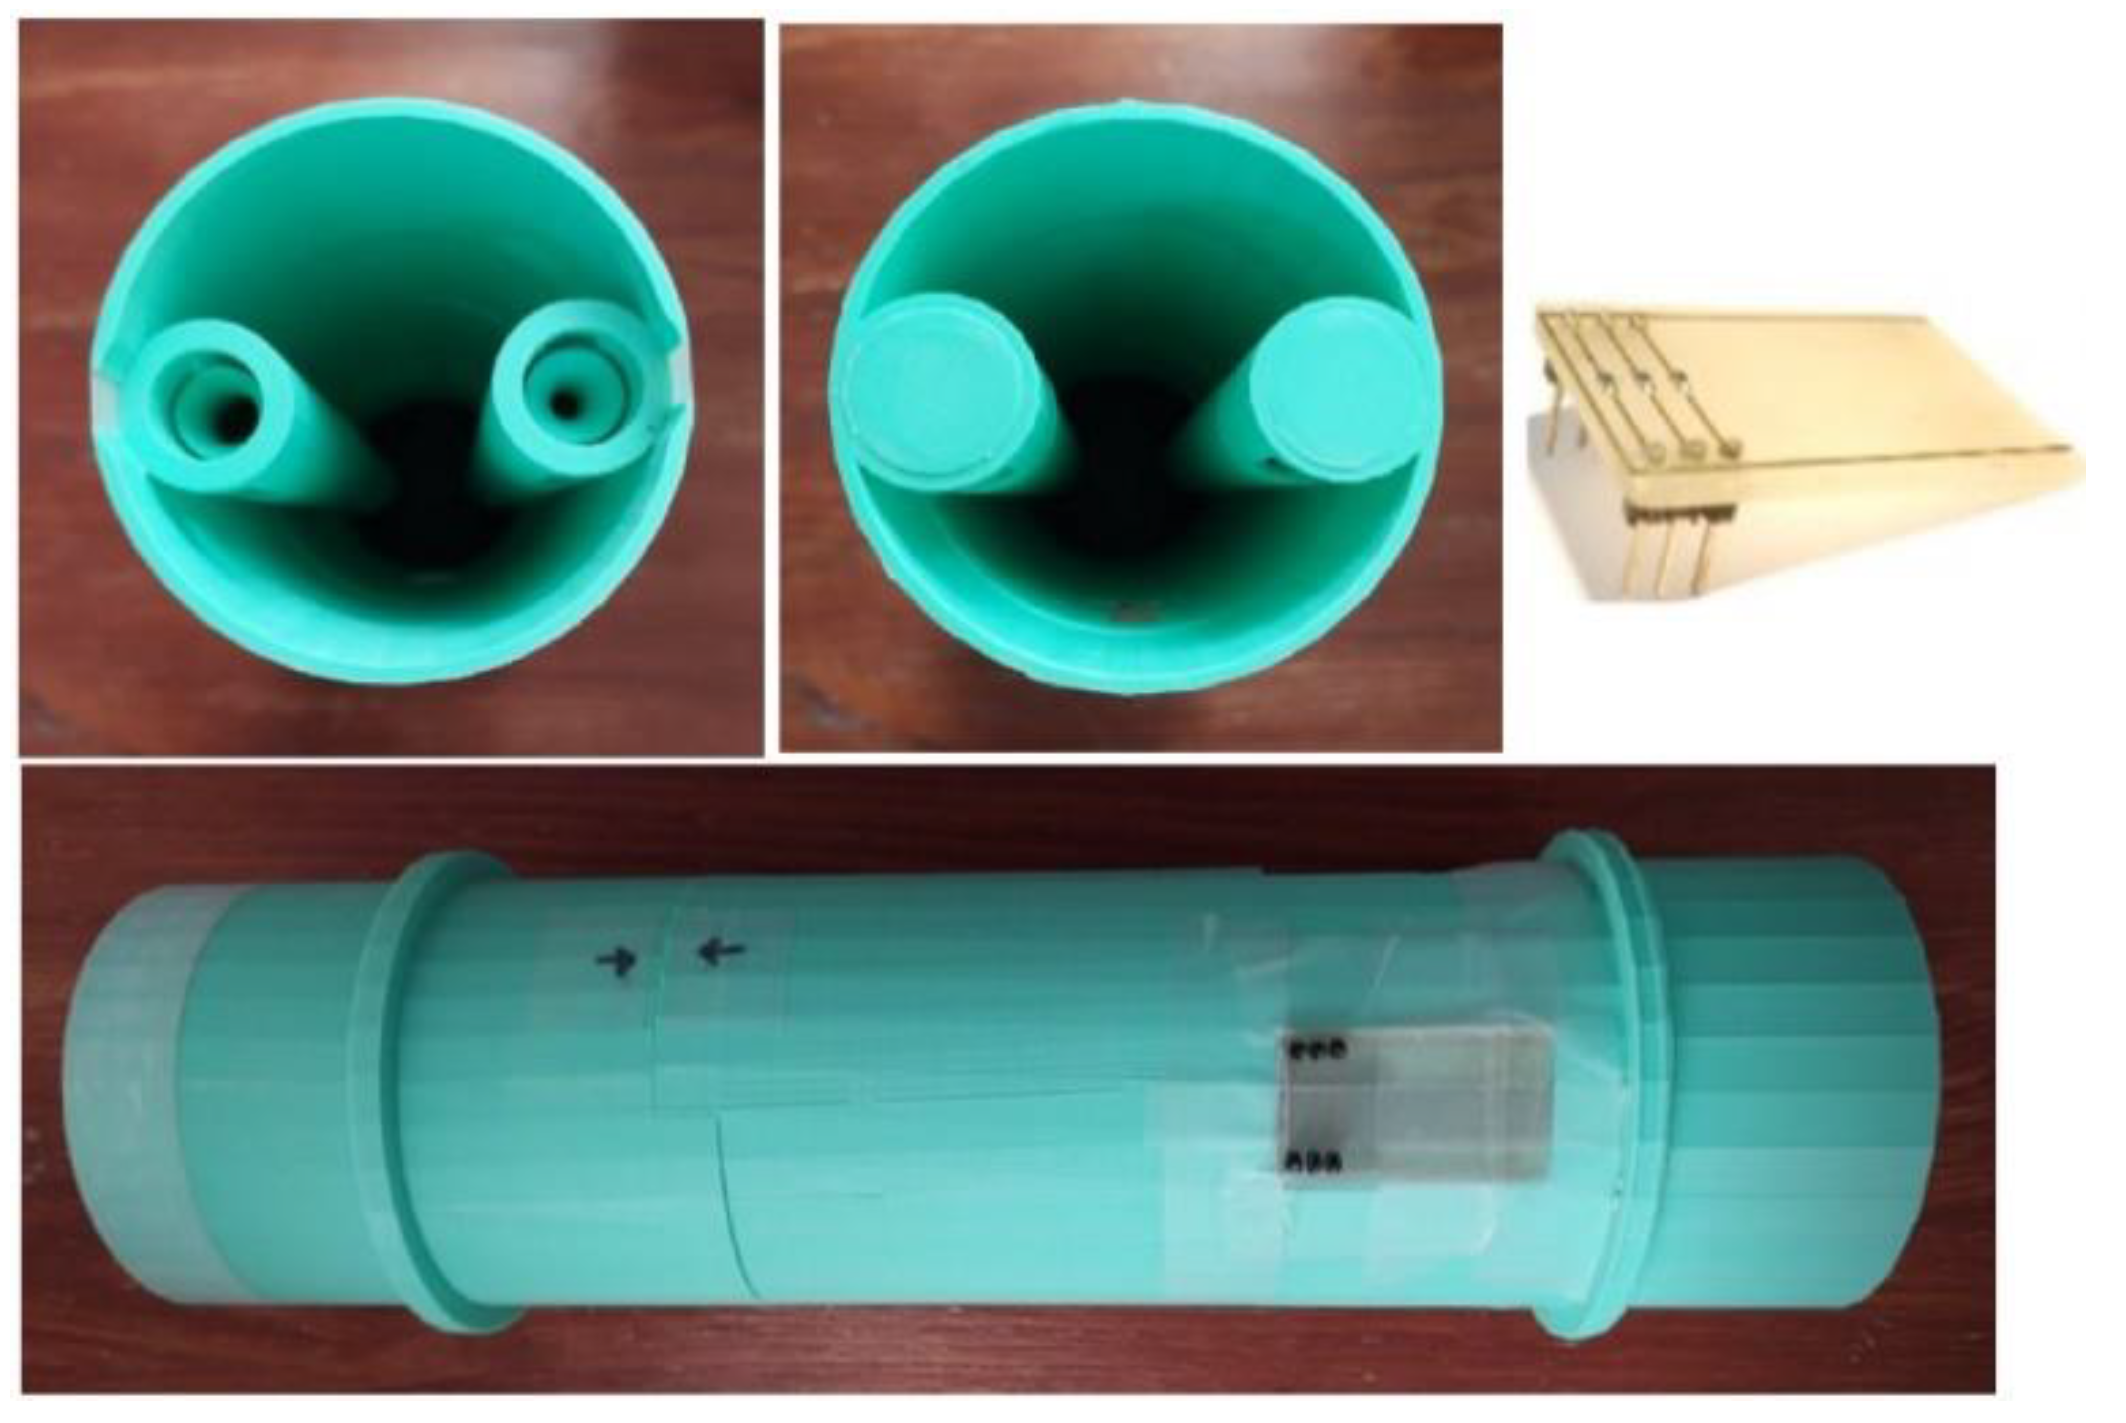
Having finalized the geometry details, an appropriate model was built, employing additive manufacturing (i.e., 3D printing technology). In more detail, Fused Deposition Modelling (FDM) [
25] was employed through a typical commercial 3D printer (Ultimaker S5), while the building material selected was standard PLA in combination with supportive material PVA; the constructed housing is presented at
Figure 9.
- C.
Sensing Element Employed
The sensing element of the device was fabricated, employing PCB technology (more details can be found in [
15]); the specific process combines limited process steps, low cost, and increased robustness. Laconically, three commercially available PT100 Resistance Temperature Detectors (RTDs) were mounted on a typical PCB substrate after the necessary copper patterning for forming the corresponding Cu tracks; as a next step, appropriate vias were formed in order to connect the RTDs to the contact pins at the backside of the PCB. The resulting sensing element is presented in
Figure 9 (upper right image).
- D.
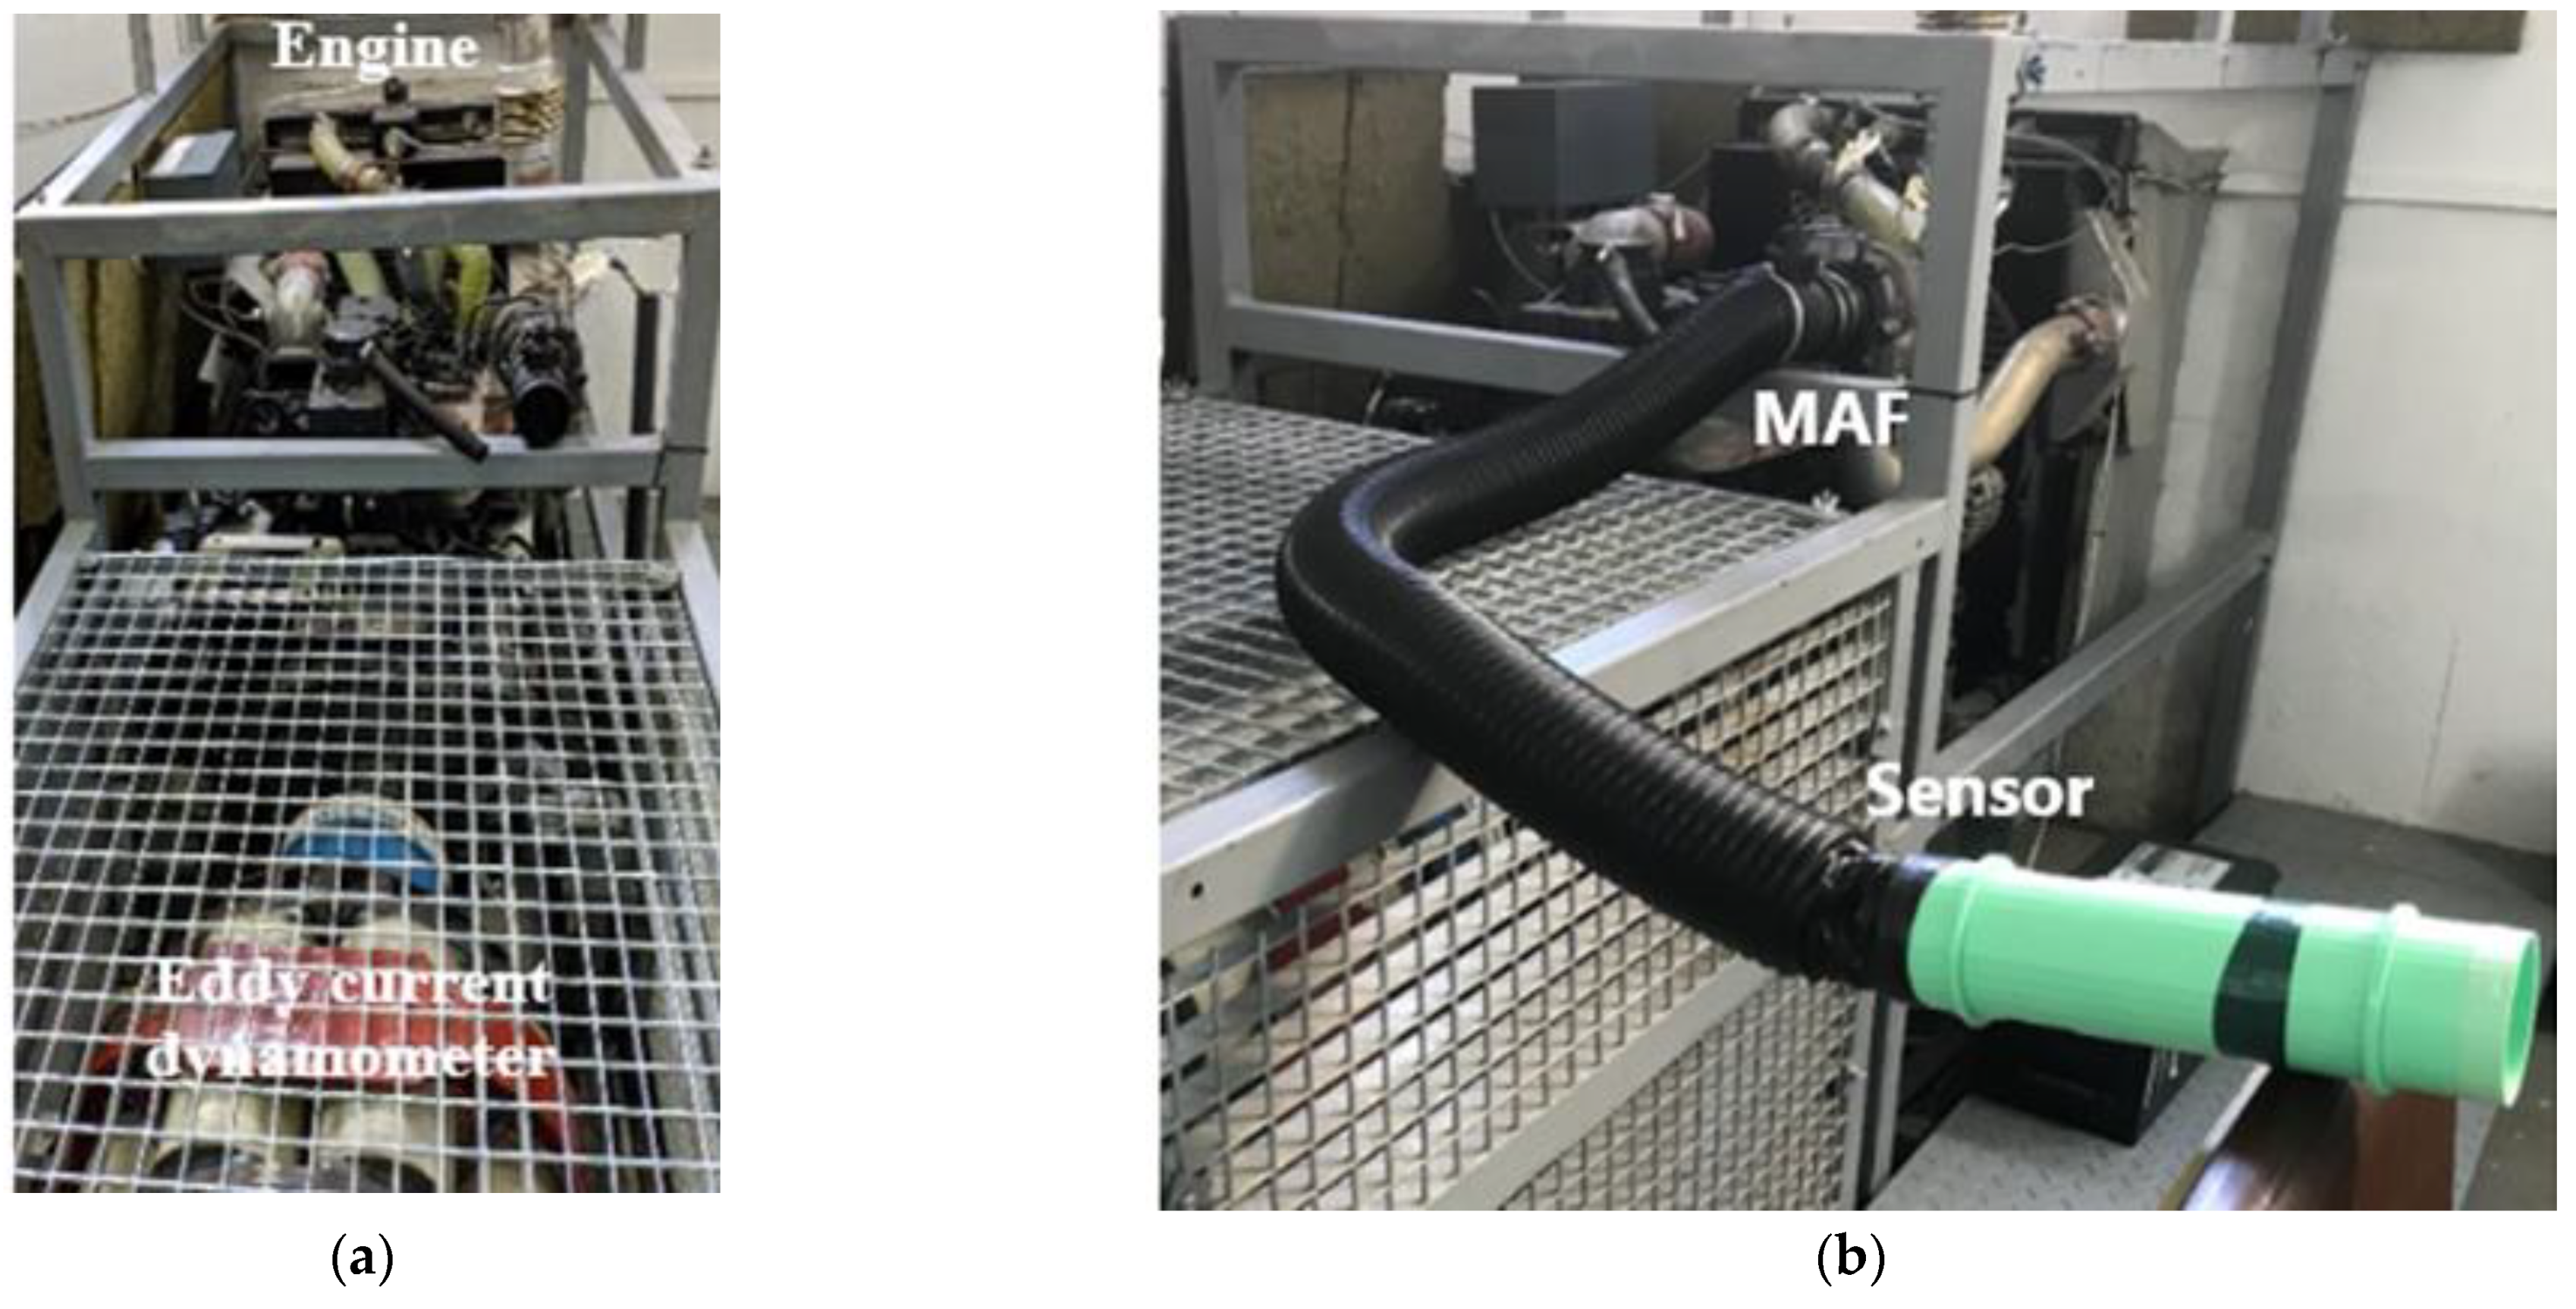
Experimental Setup for the Initial Characterization of the Developed Sensor
An initial characterization of the developed sensor was performed on a DIESEL engine testbed. In more detail, the sensor was integrated into a typical four-cylinder low-power industrial engine (IVECO
®, N45 MST series), with rated power of 125 HP at 2200 rpm, coupled with an Eddy Current dynamometer (DYNOmite
®), with maximum absorbed power 400 HP at 5000 rpm. As can be seen in
Figure 10, the device under characterization was mounted in a series with the integrated Mass Air Flow (MAF) reference sensor of the testbed (BOSCH
®, HFM5 series), which records the engine air intake. Both the engine speed and the mechanical load applied by the dynamometer were monitored continuously and controlled accordingly by the testbed’s control station.
3. Results
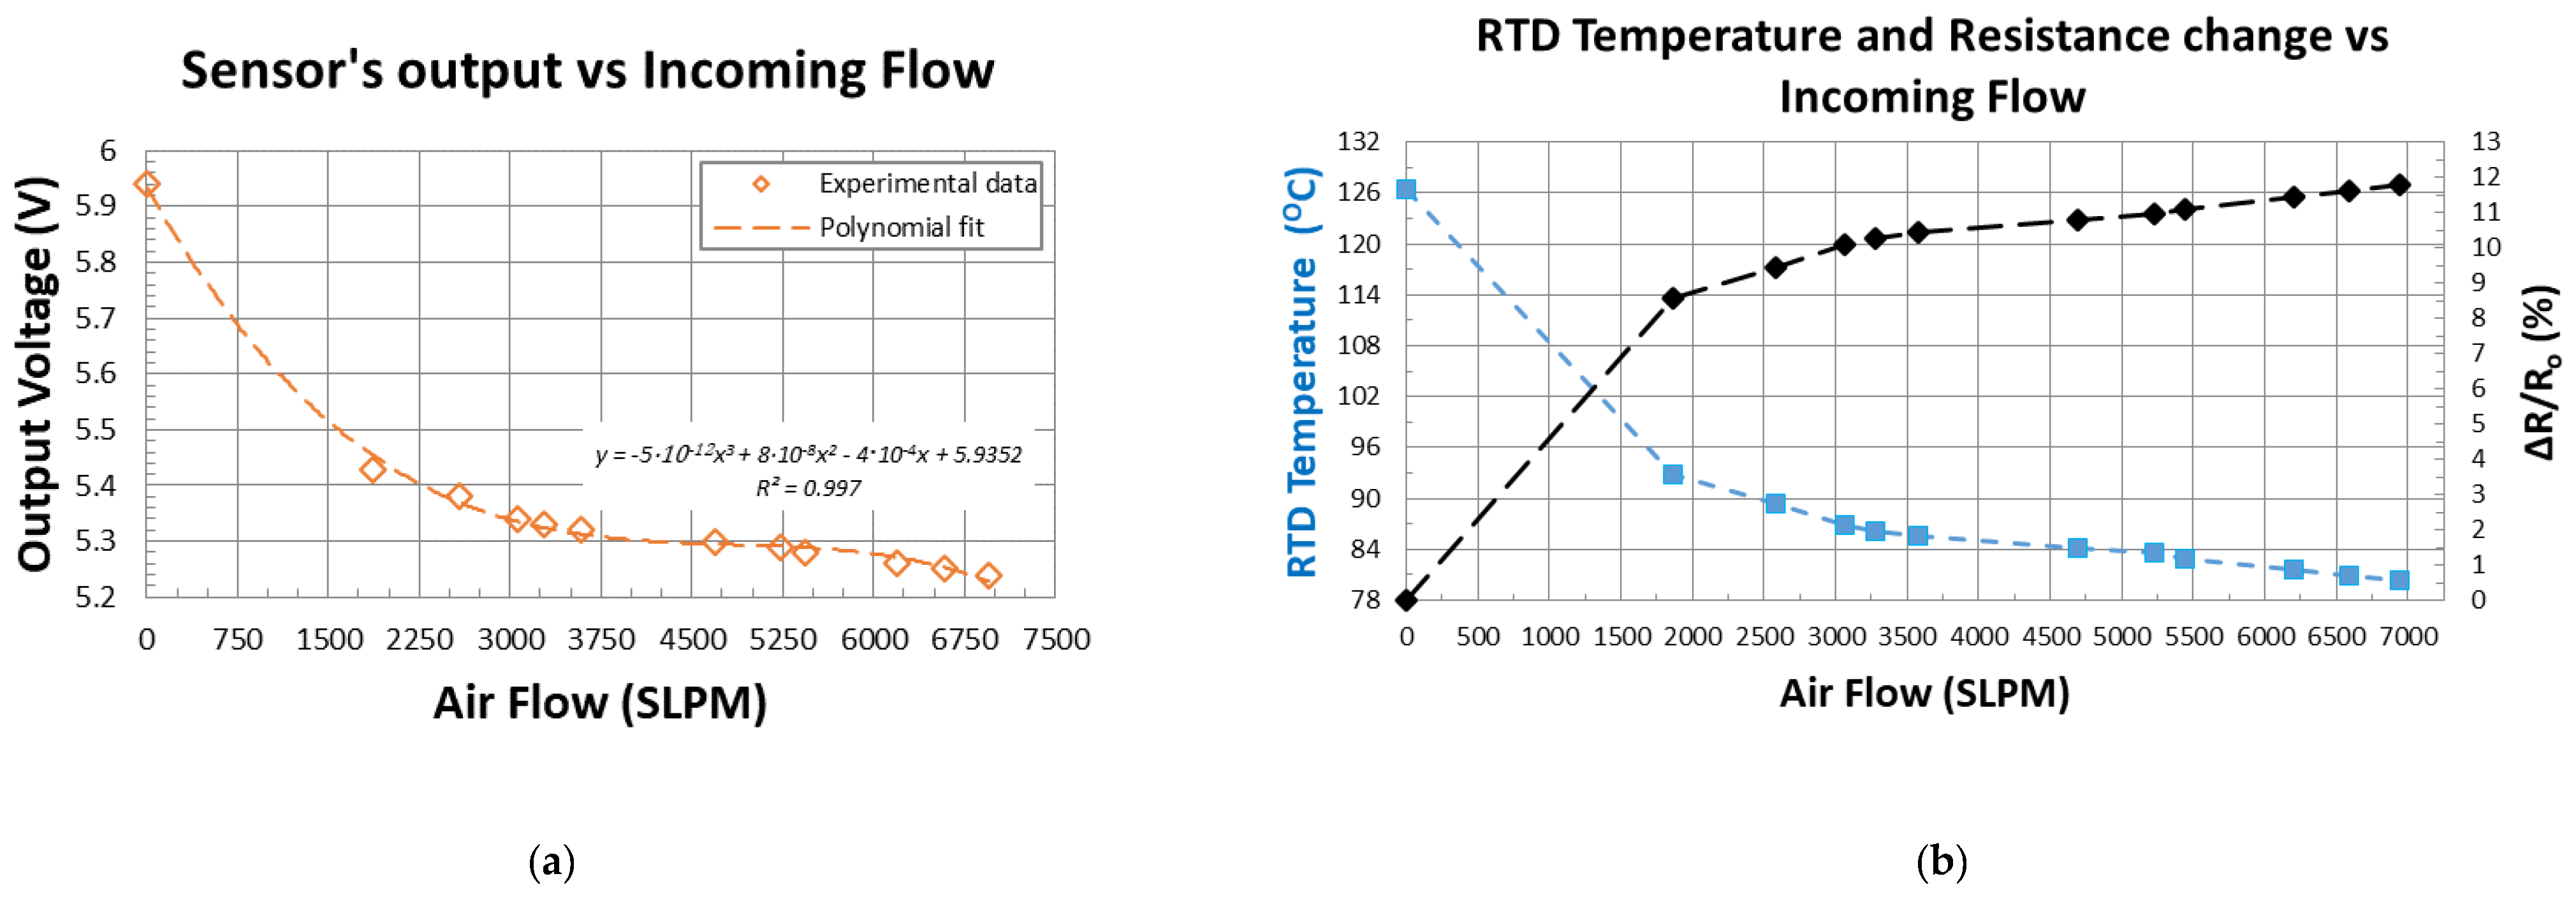
For the purposes of a preliminary electrical characterization of the developed sensor, hot-wire principle of operation on constant current (CC) mode was selected. In more detail, a constant current of 40 mA was supplied to one of the RTDs on the sensing element, while the corresponding voltage decrease was monitored for different operating points of the engine. The power supplied, taking into consideration the initial resistance of the RTD element, was 238 mW. The air intake varied from 0 to 485 kg/h (0 to 6944 SLPM) by running the engine at appropriate operating points of speed and mechanical load applied; the maximum tested inflow corresponded to a mechanical load of 78.8%, which was not further increased due to safety reasons related to the testbed.
We should note that the estimated pressure drop (ΔP) between the inlet and outlet of the housing, employing the optimum topology with two bypasses pathways, was approximately 1000 Pa, according to the performed CFD simulations for a maximum air intake of 615 kg/h, while the maximum allowed air intake restriction in the testbed’s IC engine is 6500 Pa [
14], significantly higher than the estimated pressure drop. Furthermore, during all the performed sequential runs of the engine, no alteration was noticed at any of the engine performance parameters monitored, which could be induced by the presence of the developed device under characterization. Thus, the presence of the bypasses on the airflow did not influence in any way the performance of the testbed’s IC engine.
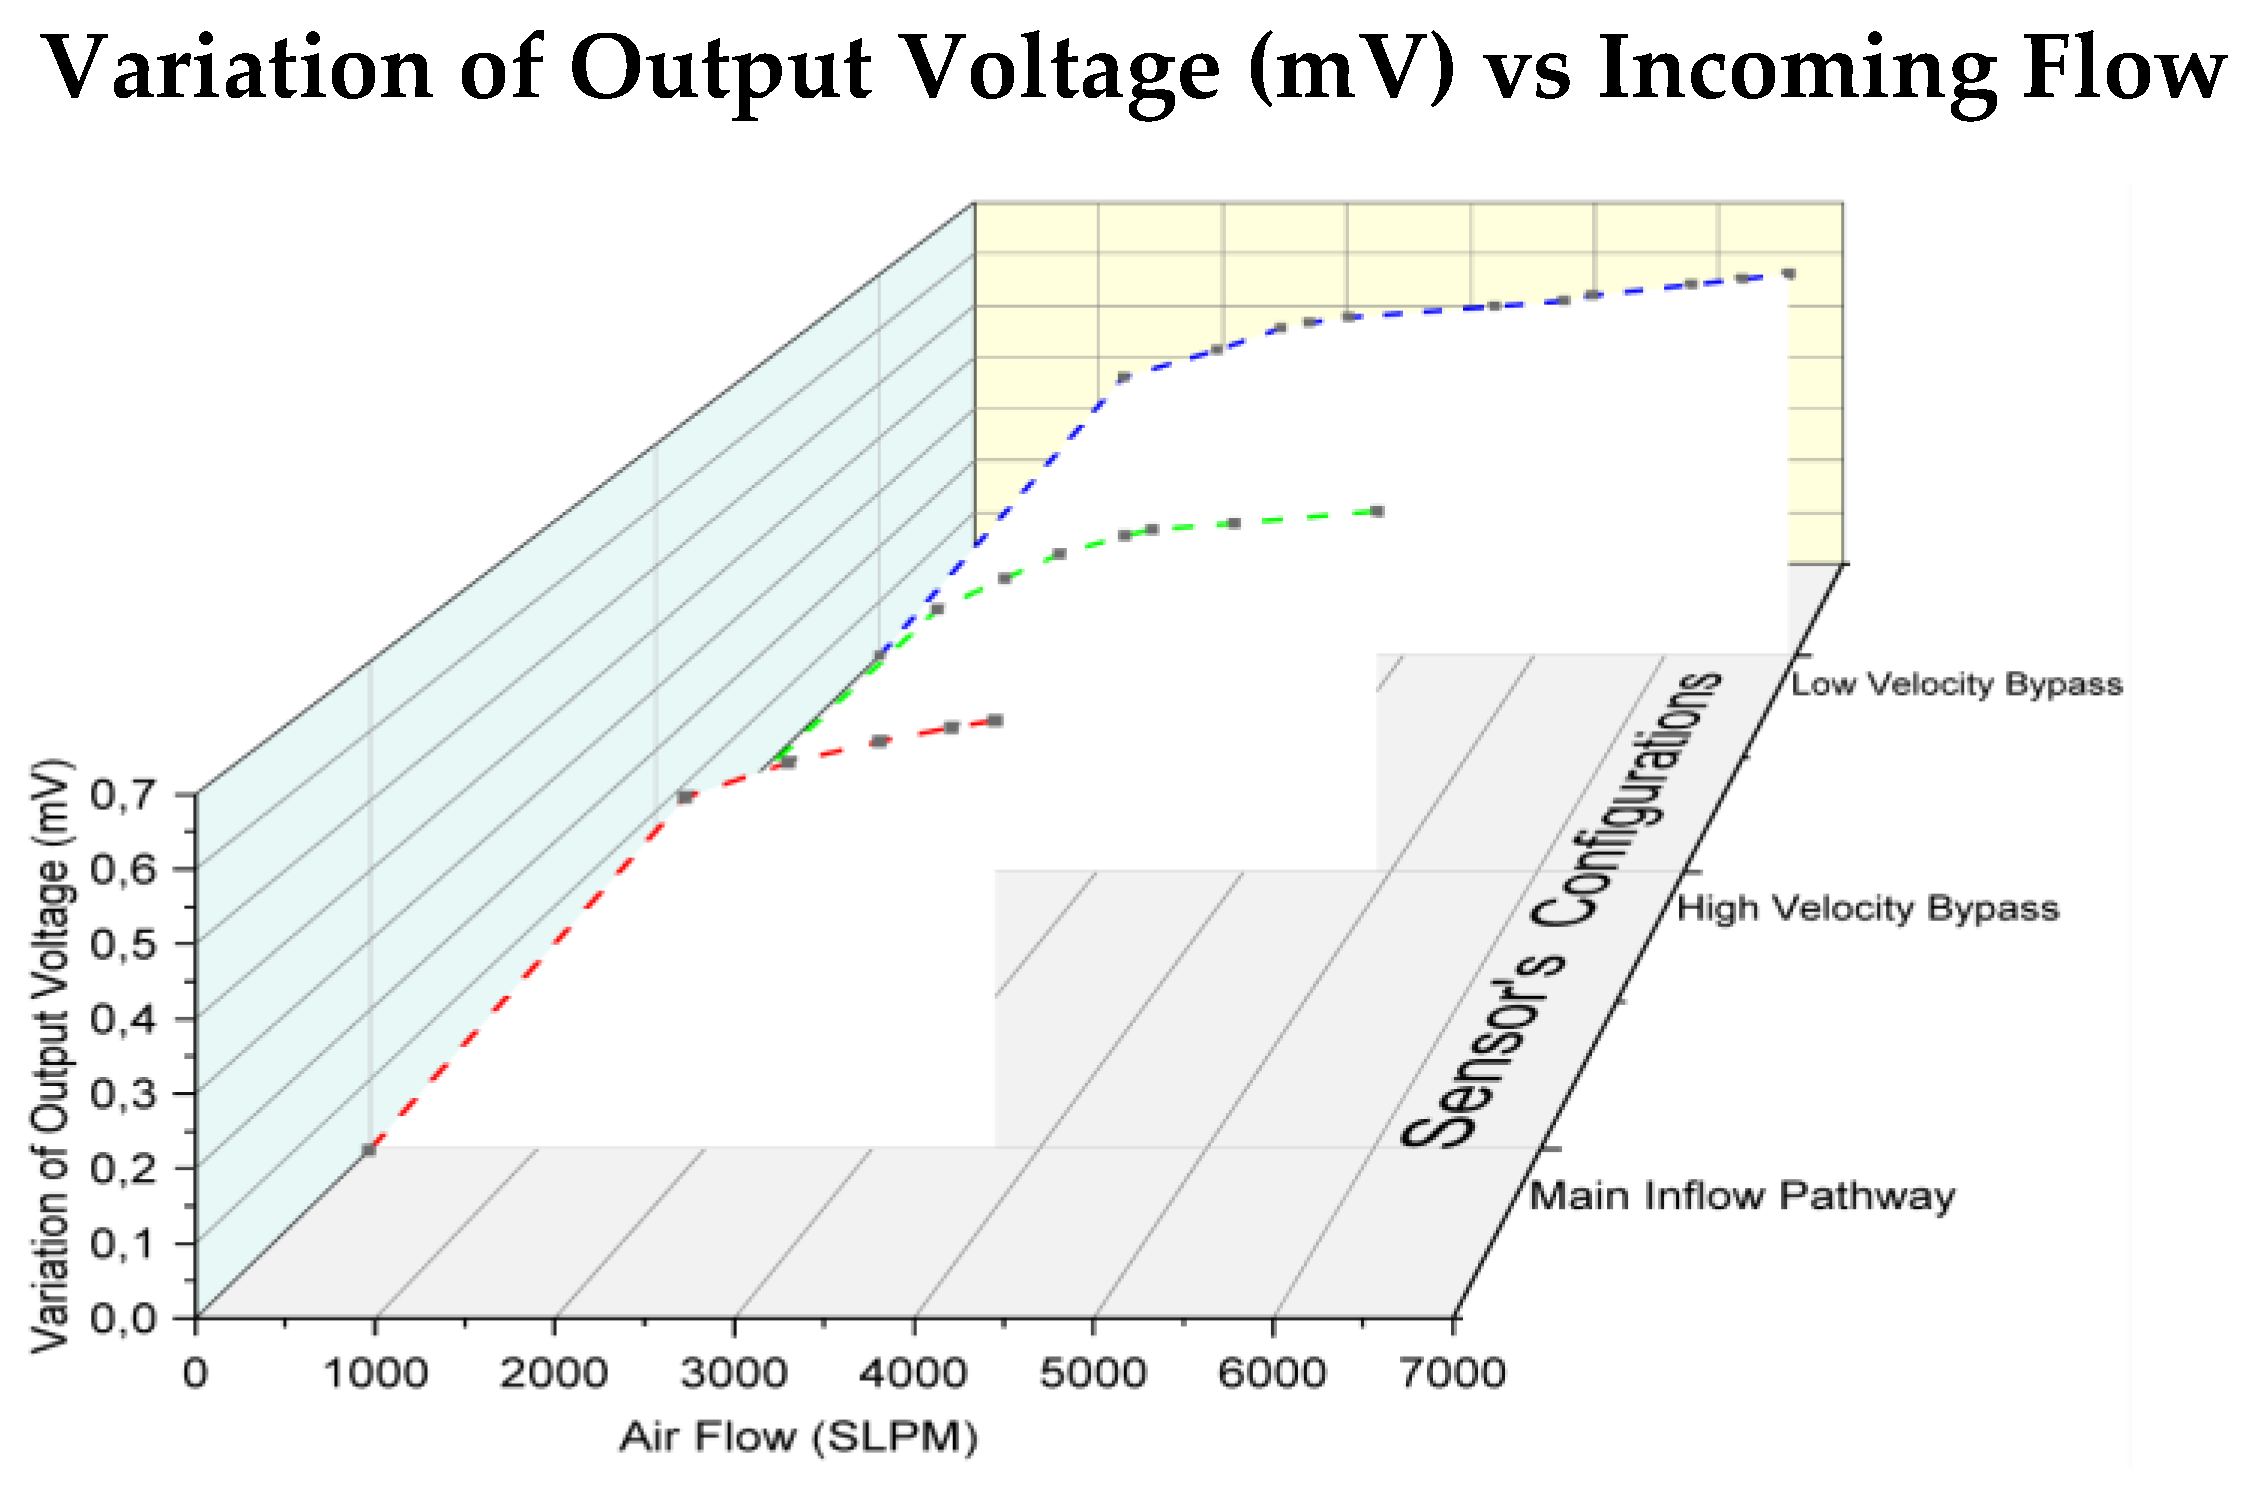
For each operating point, three sets of measurements were performed, with respect to the three different configurations available; that is, for the three locations on which the RTD element was mounted (main inflow pathway, High Velocity Bypass, and Low Velocity Bypass). The recorded sensor’s output is presented in
Figure 11a,
Figure 12a and
Figure 13a respectively; note that approximation curves were fitted in the specific experimental data, employing simple polynomial functions with a high accurate fit (R² = 0.997 or above). A comparative graph for the three sensor configurations is presented at
Figure 14. According to the IEC 60751:2008 standard (international standard for industrial PT resistance sensors), the sensing RTD’s resistance variation, with respect to temperature at a range of 0 to 155 °C, is given using the following equation [
26,
27]:
where:
R0 is the nominal resistance value at 0 °C
T is the operating temperature in °C
A is an appropriate coefficient according to IEC 60751 (A = 3.9083·10−3 °C−1)
B is an appropriate coefficient according to IEC 60751 (B = −5.775·10−7 °C−2)
Since the resistance value of the sensing element was recorded during characterization, we can easily calculate its temperature for each point of incoming flow, employing the above equation. The resulting RTD’s temperature decrease, together with the monitored resistance change, are presented at
Figure 11b,
Figure 12b and
Figure 13b.
As we can easily observe from the above figures, a significant variation in the sensor’s output signal was recorded in all three cases, with respect to the incoming flow, validating the functionality of the fabricated sensor. Furthermore, a drastic extension of the measuring range can be noticed when employing either bypass, compared to mounting the sensing element directly on the main inflow pathway, as expected.
In more detail, saturation in the sensor’s signal manifests itself for flow rate values above 3000 SLPM (210 kg/h) and 4000 SLPM (280 kg/h), approximately, when no bypass or when the High Velocity Bypass was employed, respectively (
Figure 11a and
Figure 12a), while no saturation was present in the case of the Low Velocity Bypass, even for the maximum engine air intake (
Figure 13a). Similarly, the sensing element’s temperature was drastically reduced by 40 °C, approximately, when no bypass or when the High Velocity Bypass was employed (
Figure 11b and
Figure 12b), while a 46 °C drop was present in the case of Low Velocity Bypass (
Figure 13b).
4. Discussion
As a general remark, based on the previously presented experimental findings, the adaptation of standard airfoil geometry to the housing design leads undoubtedly to an extensive increase in the measurement range of the final sensing device. Taking into consideration the findings of previous relative research work [
12], but also the simulations presented in this paper, this increase is attributed mainly to the drastic reduction of the circulating flow inside the bypass pathway, especially near the sensing area, by appropriately shaping the flow profile at both inlet and outlet ports of the bypass pathway.
Furthermore, we should note that the obtained experimental results are in agreement with those theoretically predicted by the performed simulations, since the recorded measurement range for both bypass topologies was significantly larger compared to the obtained range when the RTD element was placed directly on the housing ‘s main inlet. In more detail, an increase of 33.3% and over 130% was measured for the High Velocity Bypass and Low Velocity Bypass topologies, respectively. Regarding the numerically estimated reduction in velocity over the sensing element for each topology (see previous section,
Table 2), we should consider the following based on our findings.
The convective heat flux of air over a surface can be expressed by the following equation:
where:
q is the rate of heat flux perpendicular to a surface (W/m2)
hc_air is the convective heat transfer coefficient of air (W/m2·K)
ΔΤ is the temperature difference between the air and surface (K).
The convective heat transfer coefficient of air (
hc_air) can be estimated though by the following empirical equation [
28]:
where
v is the relative speed between the surface and air (m/s).
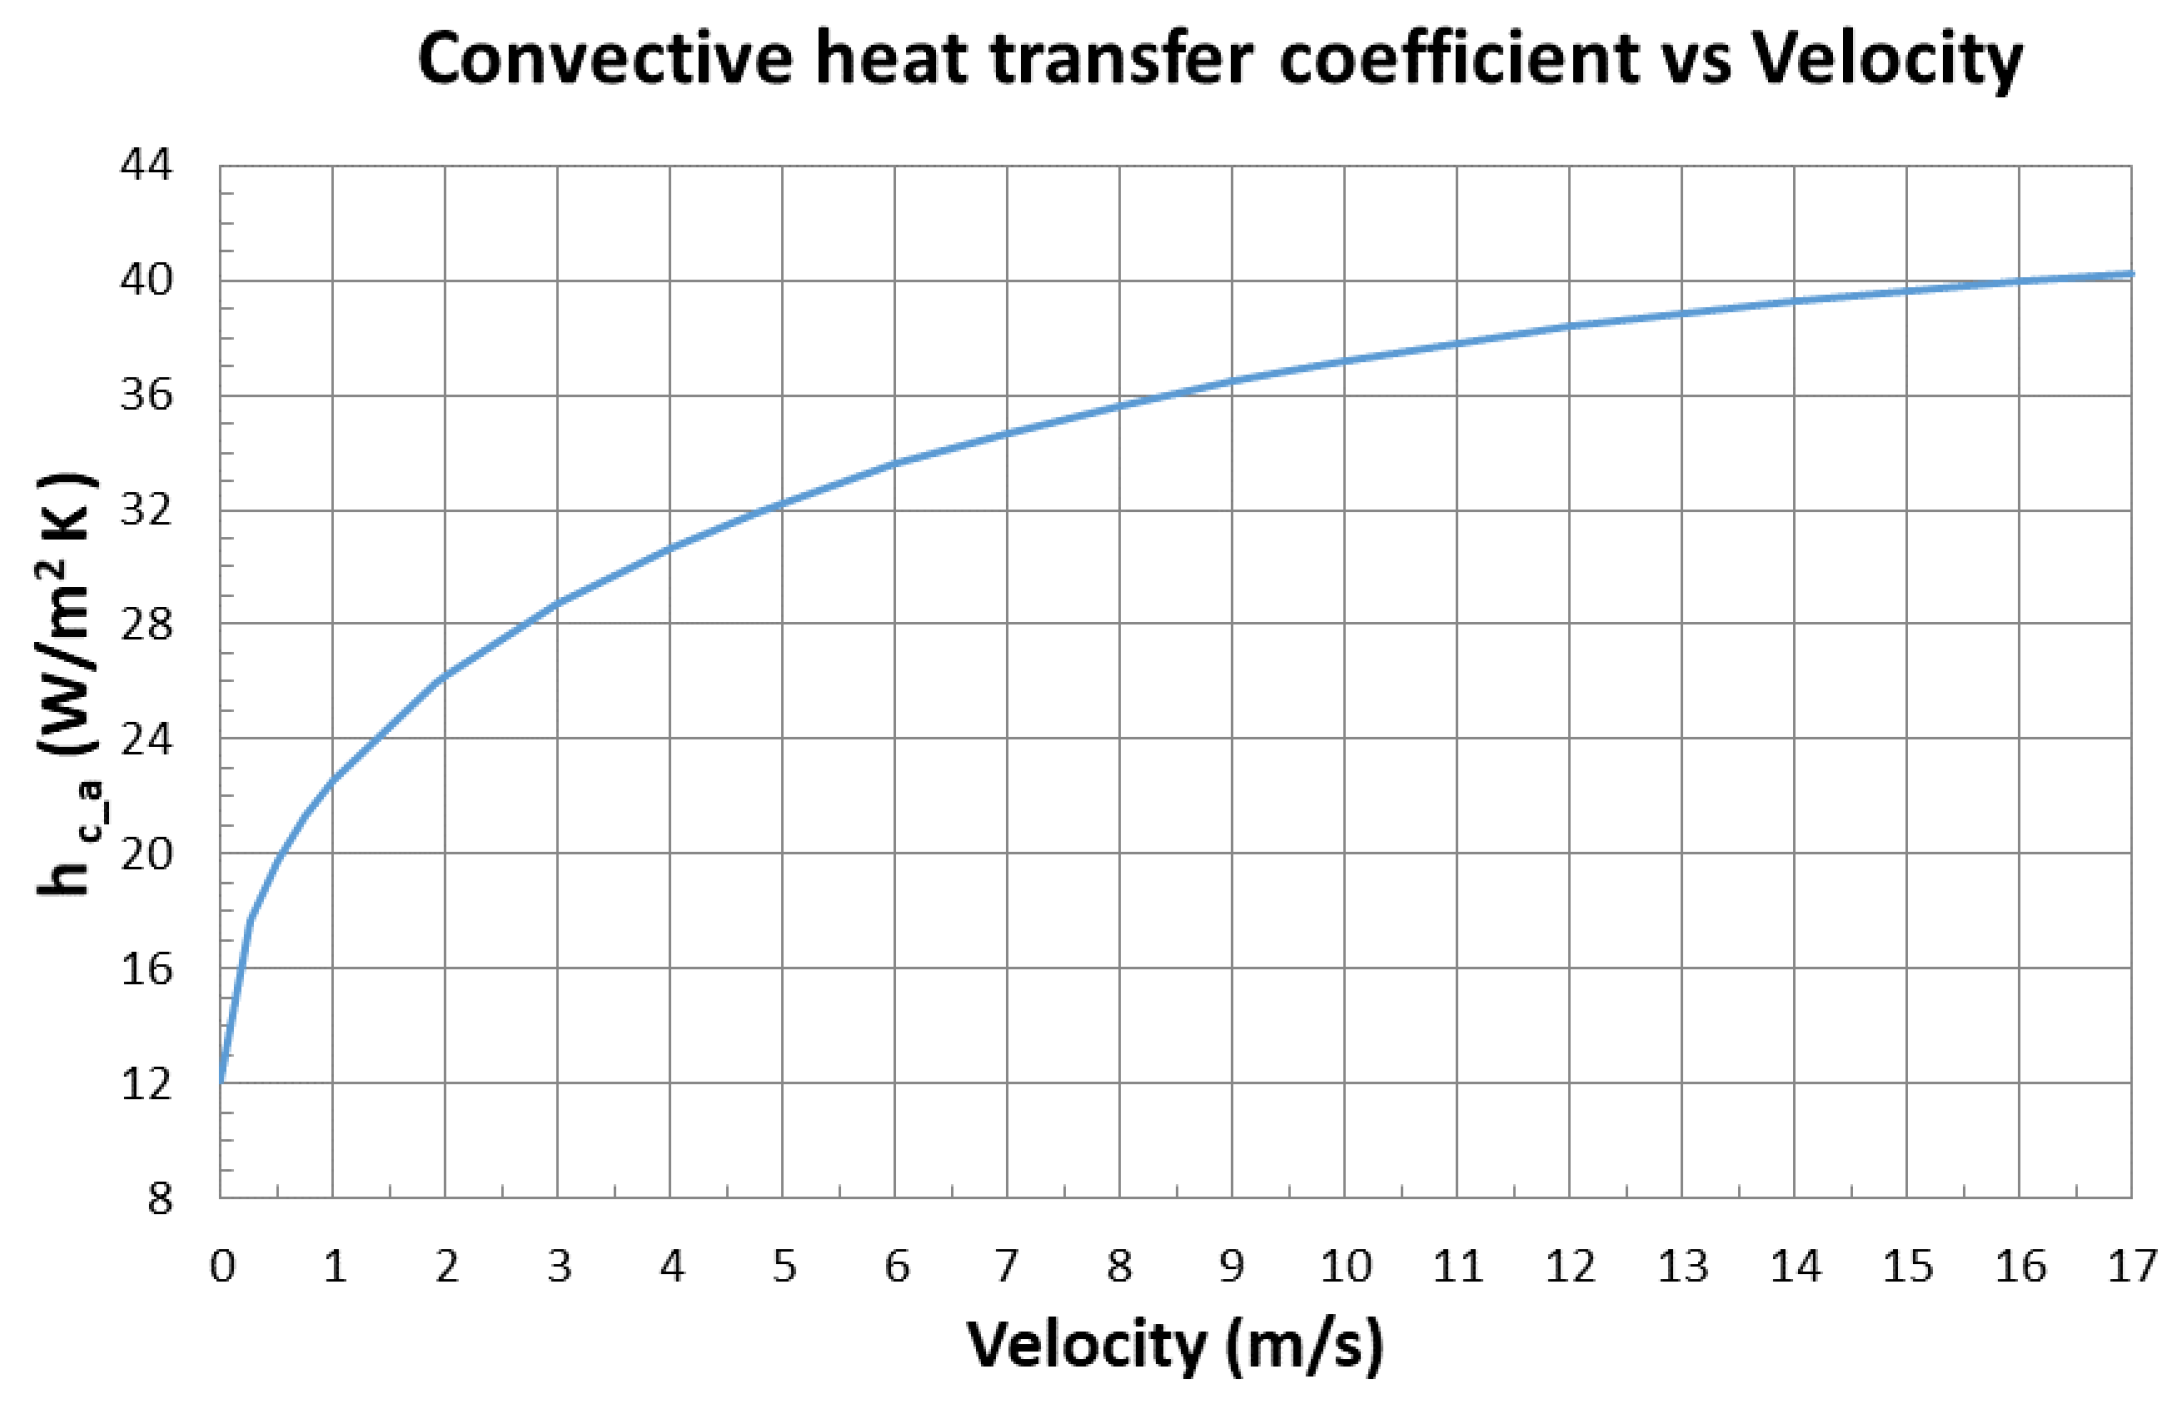
Equation (3) is graphically presented at
Figure 15 for velocity values from 0 to 17 m/s; we note that the value of the convective heat transfer coefficient (
hc_air) increases negligibly for velocities exceeding 16 m/s, while for velocities exceeding 14 m/s, the increase is less than 2% (i.e., from 39.3 to 40 W/m
2·K). Thus, regardless of the topology employed in the developed sensor, even if we consider the Constant Temperature (CT) mode of operation, where the temperature difference (ΔΤ) between the incoming air and the sensing element is maintained constant, saturation of the sensor’s signal should be expected at an air velocity of 14 m/s, approximately.
Additionally, when the sensor is operating at Constant Current (CC) mode, as in the performed characterization, the sensing element’s temperature declines considerably as the incoming flow (i.e., velocity) increases. Note that the maximum temperature decrease deduced from the experimental data presented was from 40 °C to 46 °C (
Figure 11b,
Figure 12b and
Figure 13b), which corresponds to a decrease of 31.6% to 36.5% of the initial temperature. Therefore, we can safely conclude that saturation of the sensor’s signal is expected at a significantly lower velocity of 14 m/s (which theoretically applies considering CT mode of operation) for all three topologies.
Considering the velocity decrease factor, which is deduced from the performed CFD simulations for each bypass topology (see
Table 2), we can estimate the air velocity over the sensing element for any of the specific inflow values tested. As already mentioned in the results section, saturation at the sensor’s output signal was recorded for a flow rate of 4000 SLPM (280 kg/h), approximately, for the High Velocity Bypass topology employed. The specific flow rate for this particular housing inlet area corresponds to an incoming velocity of 15.2 m/s; thus, the reduced velocity inside the bypass is estimated at 7.6 m/s (considering an approximate 0.5 decrease factor), which is significantly lower than 14 m/s and in accordance with the previously performed analysis, concerning the saturation of the sensor’s signal.
Similarly, in the case of the Low Velocity Bypass pathway for the maximum applied inflow of 6944 SLPM (485 kg/h), the estimated incoming velocity is 26.3 m/s, while the reduced velocity inside the bypass is estimated at 5 m/s, considering an approximate 0.19 decrease factor according to the CFD simulations performed. Therefore, no saturation at the sensor’s signal is expected for the specific bypass topology, even for the maximum air intake (615 kg/h), since the estimated value is substantially below 14 m/s; note that this is supported by the obtained experimental results. As a reference, in the case of the sensing element directly mounted on the main inflow pathway of the housing, saturation occurred at an incoming velocity of 11.4 m/s, which was closer to the value of 14 m/s in comparison to the other topologies, as expected.
We should note at this point that the exact values of air velocity above the sensing element cannot be directly compared for the three different topologies without incorporating a non-negligible error, since even a modest difference regarding the location of the element inside each bypass pathway, with respect to the one assumed for the simulated flow profile, can result in a reasonable difference between the velocity estimated and experimentally measured; apparently, presuming that two or three elements are situated concurrently at the exact same locations, with regard to the assumed positions at the corresponding simulations, can enhance this error. Furthermore, the obtained results from the simulation study, regarding the optimization of each topology, can potentially incorporate, to some extent, different modelling errors (different models/meshing topology, etc.).
Regarding the foremost measurement errors present in the specific study, we should take into consideration the errors introduced by the sensing element (RTD) employed and the reference MAF sensor integrated in the diesel engine testbed. In more detail, considering 126 °C as the maximum RTD temperature, the introduced error by the sensing element (IEC 60751:2008, Class F0.6) [
26,
27] was equal to ±1.86 °C, less than 4.6% of the measured temperature decrease for all three topologies; for constant current mode of operation with 40 mA supplied to the element, the above figure corresponds to a maximum variation of the sensor’s output of ±0.074 V. With respect to the integrated MAF sensor, the absolute value of the measurement deviation was less than or equal to 3% [
29]; thus, for the engine air intake range employed, a maximum error of ±14.55 kg/h concerning the reference MAF sensor should be considered.
At this point, we should mention that, in the context of the specific preliminary electrical characterization of the developed sensor, no reference temperature sensing element was available in order to compensate for the expected output variation, which was induced due to ambient temperature variation. Therefore, a reasonable fluctuation of intake air temperature is expected to lead to a drift at the device’s characteristic curve. However, in order to quantify the above statement, further electrical characterization of the sensor should be performed at the engine testbed at different air temperatures, a procedure that is practically not feasible for adequate temperature fluctuation and with no additive value for a preliminary investigation of the developed device’s functionality, employing the CI mode of operation. That being said, the above analysis, based on the experimental findings, strongly supports the CFD study results, concerning the optimum design geometry of the housing, while the adaptation of standard airfoil geometry to the housing design leads undoubtedly to a substantial increase in the measurement range of the final sensing device.
5. Conclusions
A thermal air flow sensor for use as a Mass Air Flow (MAF) measuring device for small to medium size IC engines was designed and fabricated successfully, employing additive manufacturing technology combined with PCB technology; the proper functionality of the developed prototype was validated by performing a preliminary electrical characterization.
The design of the sensor’s housing was derived from an appropriate Computational Fluid Dynamic (CFD) study; three basic design concepts, which employ different approaches for the design of an internal air flow bypass pathway, were investigated. As a result, the optimum design determined is based on a “Hatch and Orifice” topology for the bypass air inlet, while well-established airfoil geometries in the automobile industry (NACA and Joukowski) are the basis for the challenging air flow profile shaping over the sensing element, minimizing the developed circulating air flow. An appropriate set of simulations were additionally performed in order to further optimize the selected concept’s geometry, with regard to an assumed maximum engine air intake of 1000 kg/h (14076 SLPM), which exceeds by over 50% the maximum air intake for a typical low power Industrial IC engine [
14]. Subsequently, the final housing design features two bypass sections, each with a separate sensing element: one bypass (“High Velocity Bypass”) with an optimized geometry for a moderate incoming flow range (0–350 kg/h) and a second bypass (“Low Velocity Bypass”) for a considerably higher flow range (350–1000 kg/h).
Additive manufacturing was successfully employed for the fabrication of the challenging housing design by employing a commercially available desktop 3D printer and standard building materials (PLA/PVA), while PCB technology was selected for the sensing element for increased robustness and limited process steps.
The developed device was integrated into a typical four-cylinder low power engine on a DIESEL engine testbed, in series with the integrated Mass Air Flow (MAF) reference sensor. The air intake was varied from 0 to 485 kg/h (6944 SLPM) by running the testbed at appropriate operating points of speed and mechanical load applied, while the hot-wire principle of operation on constant current (CC) mode was selected.
A significant variation in the sensor’s output signal was recorded for both pathways, with respect to the incoming flow, validating the functionality of the fabricated sensor. Furthermore, a drastic extension of the measuring range was noticed when employing either bypass compared to mounting the sensing element directly on the main inflow pathway. Saturation in the sensor’s signal manifested itself for flow rate values above 280 kg/h (4000 SLPM), approximately, when High Velocity Bypass topology was employed, while no saturation was present in the case of the Low Velocity Bypass, even for the maximum engine air intake of 485 kg/h (6944 SLPM). The sensing element’s temperature was drastically reduced by 40 °C or 46 °C depending on the topology employed.
Based on the findings of previous relative research work [
12], but also on the current experimental findings, the adaptation of standard airfoil geometry to the housing design, in combination with the “Hatch and Orifice” topology for the bypass air inlet, lead undoubtedly to an extensive increase in the measurement range of the sensing device, mainly attributed to the drastic reduction of the circulating flow inside the bypass pathway. Furthermore, the experimental results strongly supported the CFD study performed with regard to the optimum design geometry of the housing.
Key features of the developed device are low-cost, fast on-site manufacturing, robustness, and simple fabrication procedure, suggesting numerous potential applications in marine engineering and in industrial applications in general. Future work includes the characterization of the sensor at increased air intake, employing a different experimental setup, together with appropriate characterization (including reproducibility evaluation), both on Constant Current (CC) and Constant Temperature (CT) modes of operation, under the hot-wire principle and calorimetric principle of operation.


