Article

Experimental Study on the Influence of Water and Cavitation on Propeller Load during Ice-Propeller Milling

College of Shipbuilding Engineering, Harbin Engineering University, Harbin 150001, China
*
Author to whom correspondence should be addressed.
Appl. Sci. 2021, 11(24), 11578; https://doi.org/10.3390/app112411578
Submission received: 10 November 2021 / Revised: 1 December 2021 / Accepted: 2 December 2021 / Published: 7 December 2021

Abstract

:
When the ice-class propeller sails in an icy sea, it is affected by external factors such as water, ice, and cavitation, and the process of mutual interference is extremely complicated. In order to study the influence of water and cavitation on propeller load during the ice-propeller milling process, a test platform for ice–water propeller milling action was constructed. The load and cavitation of the propeller and single blade were measured during ice-propeller milling in air and water (atmospheric pressure and decompression conditions). Simultaneously, the changes in the load and bearing force of the propeller and blade were studied at different working conditions. The results show that, in the process of ice–water propeller milling, the direction of the propeller thrust generated by the water is opposite to that of the axial force generated by ice; the combined action of the two causes propeller thrust loss, whereas the combined action of water and ice increases propeller torque. The presence of water increases the thrust, torque, and bearing force of the fluctuating amplitude of the blade. The occurrence of cavitation reduces the thrust and torque of the propeller and blade and increases thrust fluctuating amplitudes while decreasing the tangential force fluctuating amplitude of the blade.

1. Introduction

With the opening of the Arctic channel, especially the Arctic Northeast channel, and the development of Arctic resources, there has been increased global focus on icebreakers, ice-class ships, and other ice-going ships used to open the channel for polar navigation ships. The propulsion system of ice-going ships is their most important part and is, therefore, becoming increasingly researched. Compared with conventional regional navigation ships, the stern propeller of polar navigation ships is more prone to damage. The propeller is typically exposed on the outer side of the hull. When a ship sails in an icy area, it often causes broken ice to submerge and slide along the hull surface [1,2]. The proximity of the propeller to the ice causes ice-propeller contact, which generates a strong ice load on the propeller surface. In order to remove ice traps when the ice-going ship are operating astern in the ice-breaking mode, the propeller needs to continuously mill sea ice at a high speed, which induces a large pulsating load on the blade surface. Under extreme conditions, the edge area and tip of the blade are deformed or damaged; consequently, the propeller’s thrust is reduced and the maneuverability of the ship will be limited, which will pose a great threat to the normal navigation of ice-going ships. Therefore, research on the load and bearing force of the propeller in the ice-propeller milling process is of great significance.
In recent years, researchers have carried out a series of theoretical and experimental studies on the ice-propeller milling process. Walker et al. [3] and Bose [4] examined the complex ice–water–propeller coupling process; the total load on the propeller during ice-propeller milling in water is called a mixed load, which has three components: ice milling load, separable hydrodynamic load, and inseparable hydrodynamic load. Among them, the ice milling load refers to the ice load on the propeller when only ice and propeller participate in the milling action. The ice-propeller milling test is mainly carried out in air without considering the influence of water. The separable hydrodynamic loads refer to the open-water hydrodynamic loads of the propeller. The inseparable hydrodynamic loads are the loads at which ice blockage, proximity effect, and cavitation influence the hydrodynamic performance of the propeller.
The following are some examples of experimental research conducted in this field. Morin et al. [5] introduced a laser sensor on a full-scale ship to measure mixed loads at different positions of the blade. Moores et al. [6] and Searle et al. [7] conducted ice–water propeller milling experiments in an ice tank. The effects of variations in the milling depth, pitch distribution, and advance coefficient on the mixed loads of highly skewed propellers were measured, and the destruction phenomenon of the blade during the milling process was observed. The results showed a positive linear relationship between the mean value of the mixed load and milling depth; the former increases first and then decreases with an increase in the advanced coefficient. Wang et al. [8] carried out a milling experiment on an ice–water propeller in an ice tank and determined the variation law of the mixed load (time-domain curve, mean value, and extreme value) of the propeller and blade based on geometric parameters, advance coefficient, angle of attack, milling depth, and other important factors. Karulina et al. [9] performed a frozen ice-propeller milling experiment in air, analyzed the bearing force characteristics of the ice milling loads of the propeller, and compared it with the calculation of the theoretical model. The results showed that the estimated value of the periodic ice milling loads of the propeller could be used to analyze the fatigue strength of the propulsion system or to numerically estimate the vibration characteristics of ice-going ships. Under a certain ice condition and considering the effect of periodic ice milling loads of the propeller, hull vibration increased by 3–4 times. Brouwer et al. [10] conducted an impact test between smaller chunks of ice and propeller, and measured the mixed load on the blades in an ice–water mixed environment by installing a six-degrees-of-freedom mechanical sensor at the connection between the hub and blade root. The test results showed that the highly dynamic forces during an impact can change rapidly in amplitude as well as direction. Khan et al. [11] measured the changes in the ice milling load and mixed load during the milling process of an ice propeller in an ice tank; however, the test results mainly provided support for numerical calculations, and the difference in the influence of the ice milling load and mixed load was not discussed. Huang et al. [12] performed an ice–water propeller milling test in an ice tank under the typical navigation mode and discussed the change in the propeller mixed load when the propeller was milling with a columnar layer and granular layer of ice. Wu et al. [13] carried out a collision test between smaller chunks of ice and propeller by using multiple high-speed video acquisition devices and propeller hydrodynamic performance measuring devices. The results showed that there are different impact modes in ice-propeller collision such as single and multiple times, which have strong randomness and uncertainty and different effects on the hydrodynamic performance of a propeller.
Unfrozen model ice is widely used in the ice–water–propeller coupling process owing to its stable mechanical properties, sturdiness, good repetition, etc. Atlar et al. [14] and Sampson et al. [15,16] developed an ice–water propeller milling test using Styrofoam in a cavitation tunnel. The time domain and mean value curves of the mixed load on the propeller were presented. The results showed that propeller thrust decreased whereas torque increased during the ice-propeller milling process, which is the result of cavitation and ice-blade milling. Cavitation caused severe vibration, noise, and fatigue problems in the propeller and related equipment. Huisman et al. [17] conducted an ice-propeller contact test using model ice made of expanded polystyrene and paraffin; they measured the ice milling load of a propeller in air and verified the feasibility of the model ice to carry out an ice-propeller milling test. Guo et al. [18] used phenolic foam panels as non-frozen model ice to measure the ice milling load and mixed load on the propeller under different propeller rotational speeds, ice pushing speeds, ice milling depths, and inflow velocities in water and air; however, they did not analyze the relationship between the ice milling load and mixed load.
Next, we discuss some examples of theoretical research on ice-propeller milling. Wang et al. [19] and Khan et al. [11] predicted the mixed load acting on the propeller by using the panel method program PROPELLA in combination with the semi-empirical estimation formula for the ice force, which was verified experimentally. Wang et al. [20] proposed a cohesive element method by using elastoplastic softening constitutive model based on the LS-DYNA software and predicted the ice milling load during the ice-propeller milling process. At the same time, the numerical simulation of the collision between smaller chunks of ice and blade was also carried out. The results showed that the ice loads were significantly affected by the five factors. Ice loads tended to increase by decreasing the rotational speed, increasing the initial ice speed and the contact area, and changing the rotational direction from clockwise to counterclockwise. Ye et al. [21,22] and Wang et al. [23] established a numerical model of ice-propeller milling based on the peridynamic method and continuous contact detection theory and predicted the ice milling load, the shielding effect, and blade pressure distribution of the propeller. Yang and Ji [24] established a sea ice-propeller milling model by coupling the discrete element method and finite element method and analyzed ice milling load, pressure, stress, and deformation of the propeller. However, the above three numerical prediction methods do not consider the influence of the water and mainly focused on the variation in ice milling loads.
In conclusion, the existing research on ice-class propeller load mainly involved the analysis of the variation in propeller mixed loads in the ice–water propeller milling process or ice milling load in ice-propeller milling process with the related parameters; the comparison of the propeller loads under different test environments is lacking, and the relationship among propeller mixed load, ice milling load, and hydrodynamic load has not been thoroughly discussed. The interaction mechanism among water, ice, cavitation, and propeller has not been revealed. In order to address this gap, an ice–water propeller milling test platform was constructed in a large circulating water channel. The ice-propeller milling test in air and ice–water propeller milling test under atmospheric pressure and decompression conditions were carried out successively. The effects of water and cavitation on the load and bearing forces of the propeller and single blade were analyzed. The test results revealed a variation law of different load components in an ice–water propeller milling process.

2. Test Model

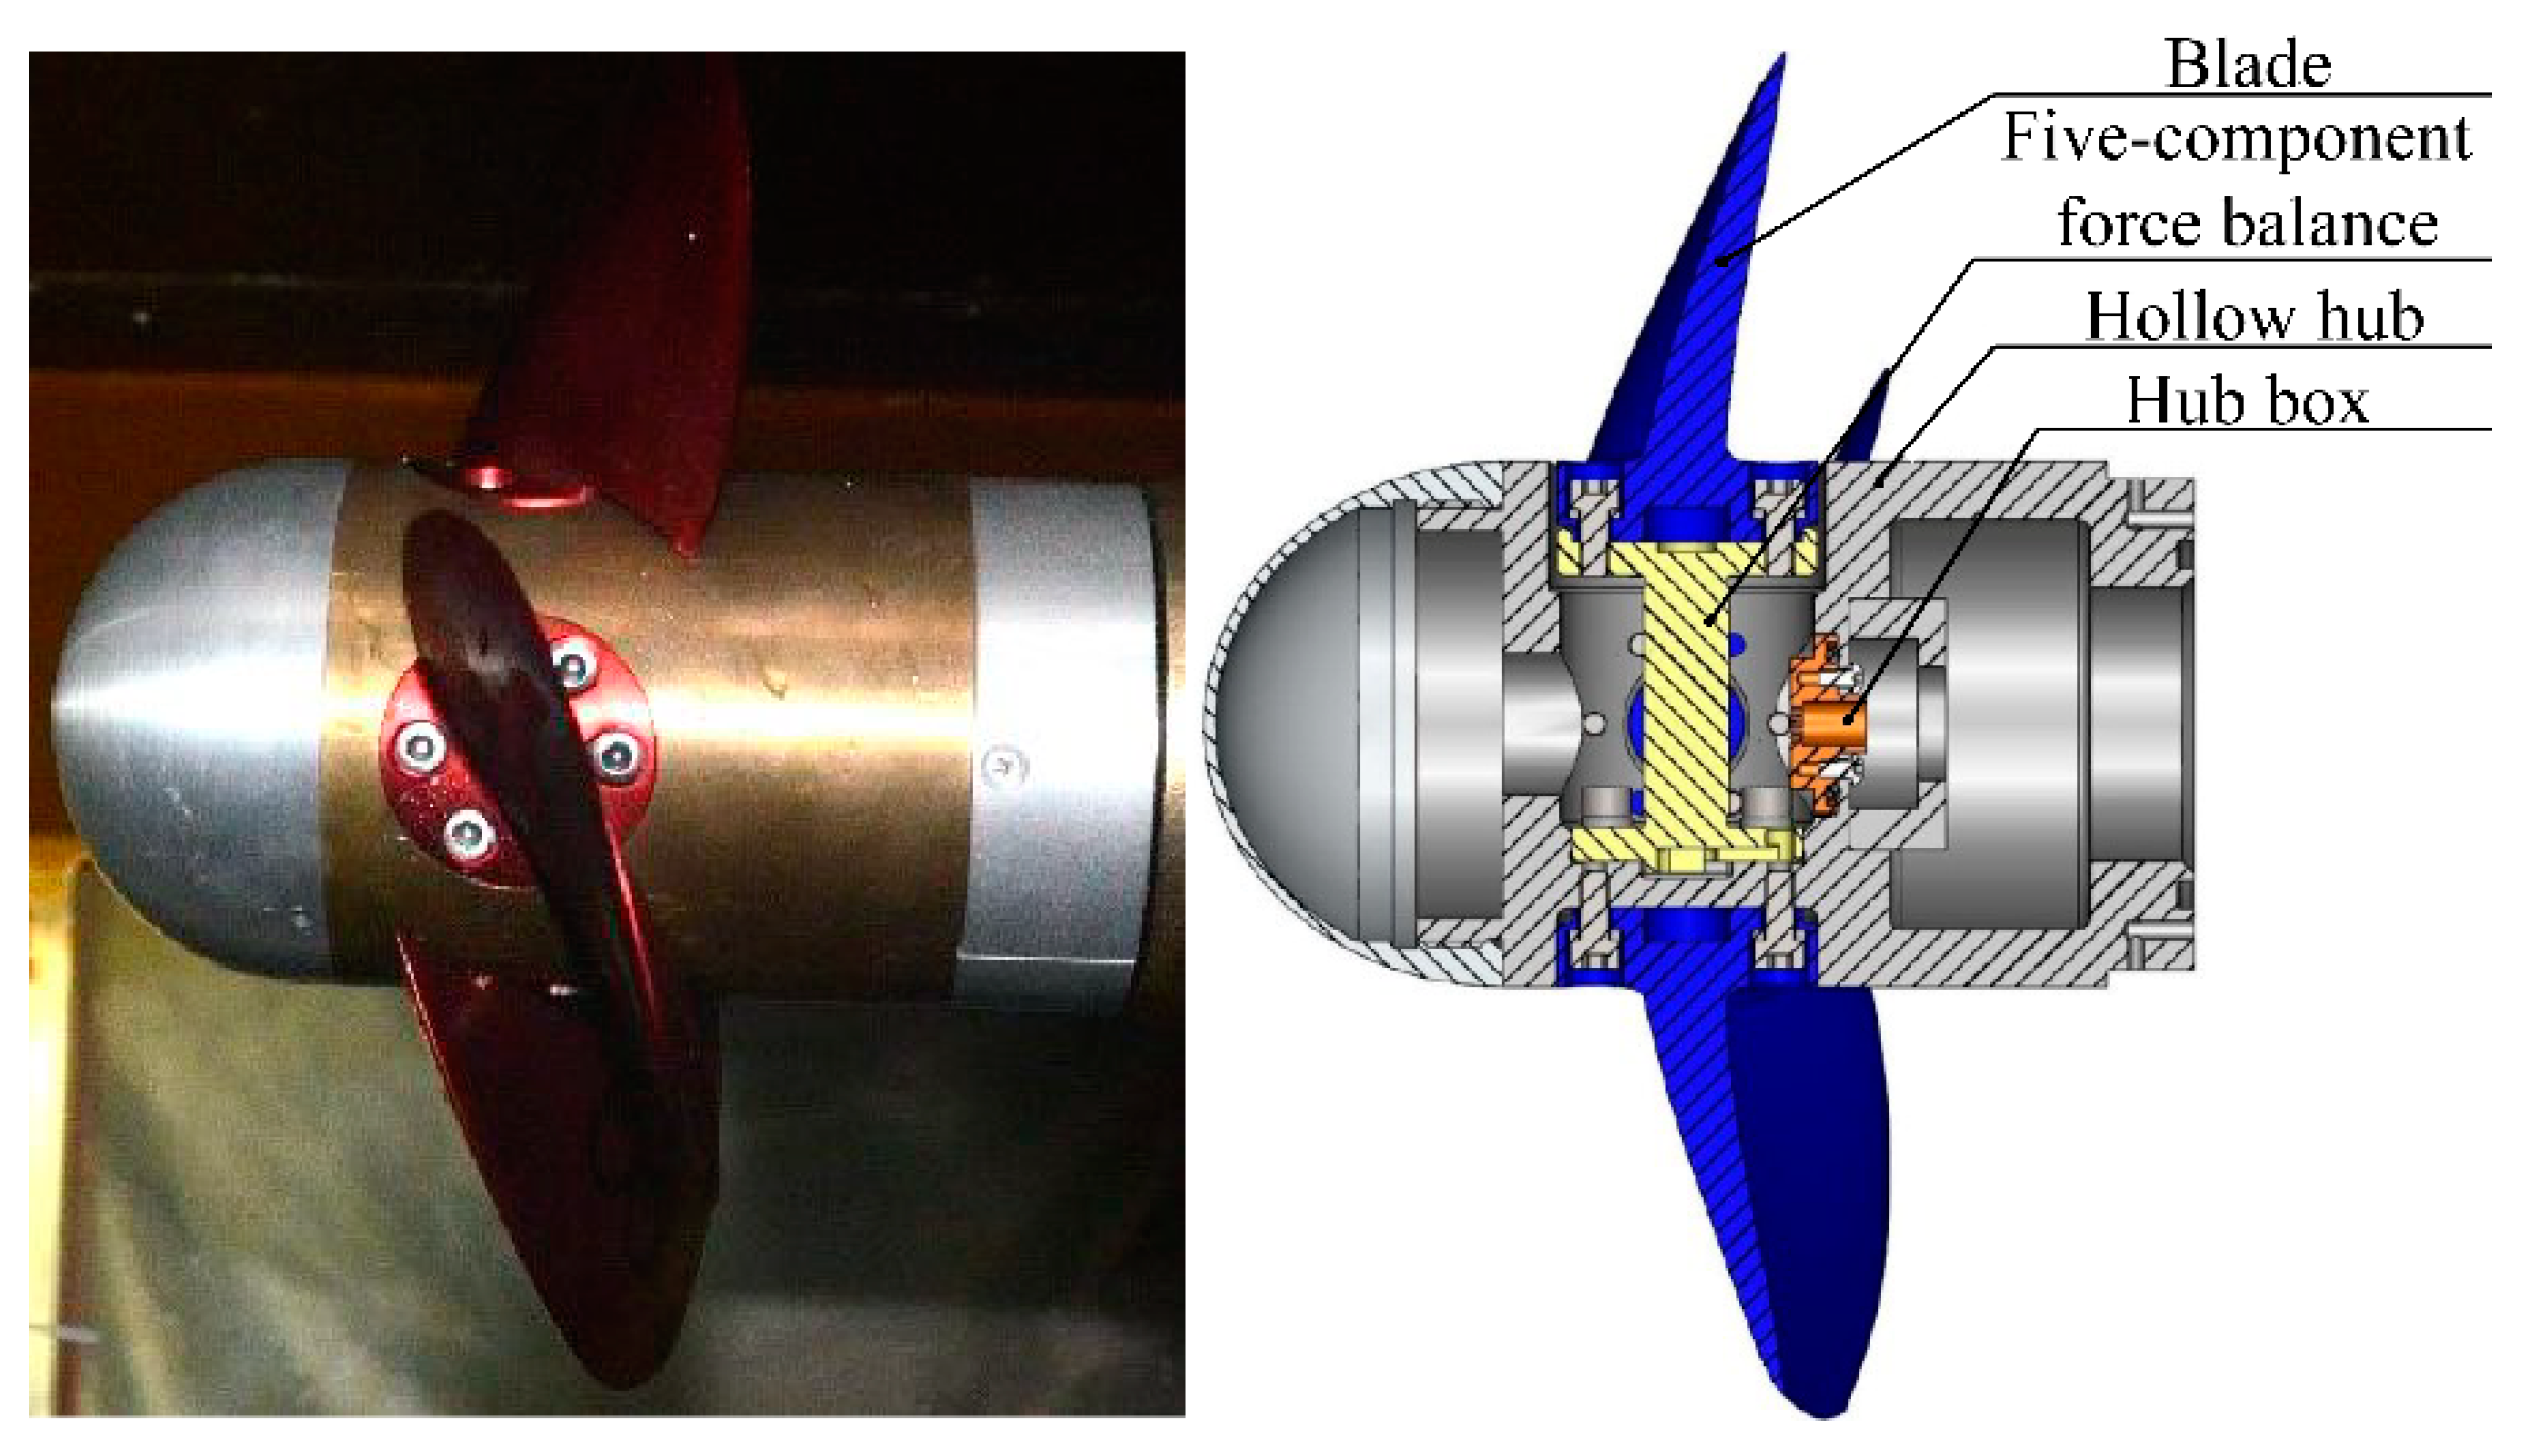
2.1. Propeller Model

The prototype of the propeller used in this study was the ice-class propeller of the Canadian Coast Guard R-class icebreaker [14]. The diameter of the prototype propeller was 4.115 m, and the propeller model was based on the scale of 1:16.46 with local corrections. The main dimensions of the propeller model are listed in Table 1. As the single-blade load test was conducted during the experiment, the blades and hub of the propeller model were designed and manufactured separately. The hub was hollow and equipped with a multicomponent force balance. The key blade and the five-component force balance were fixed and interconnected, and the other blade roots were equipped with a counterweight structure to ensure an overall dynamic balance of the hub. The propeller model after blade installation is shown in Figure 1.

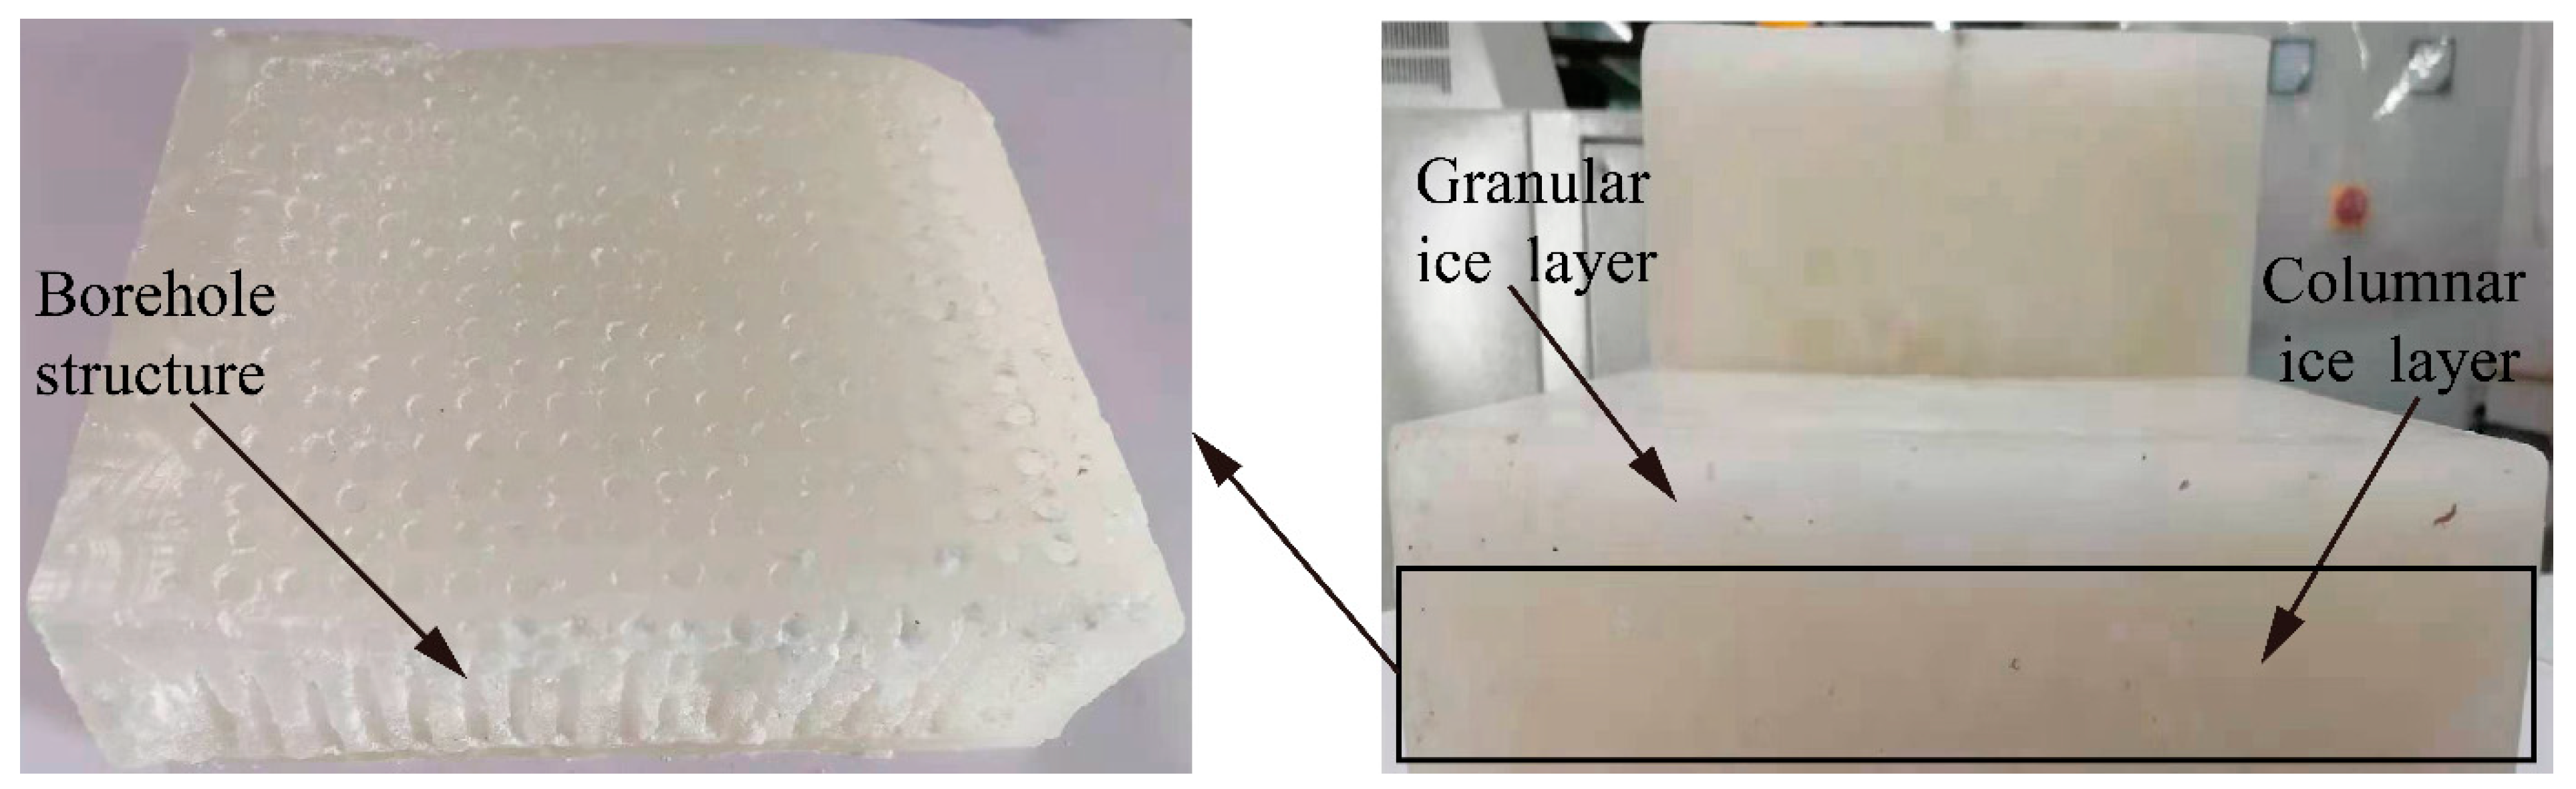
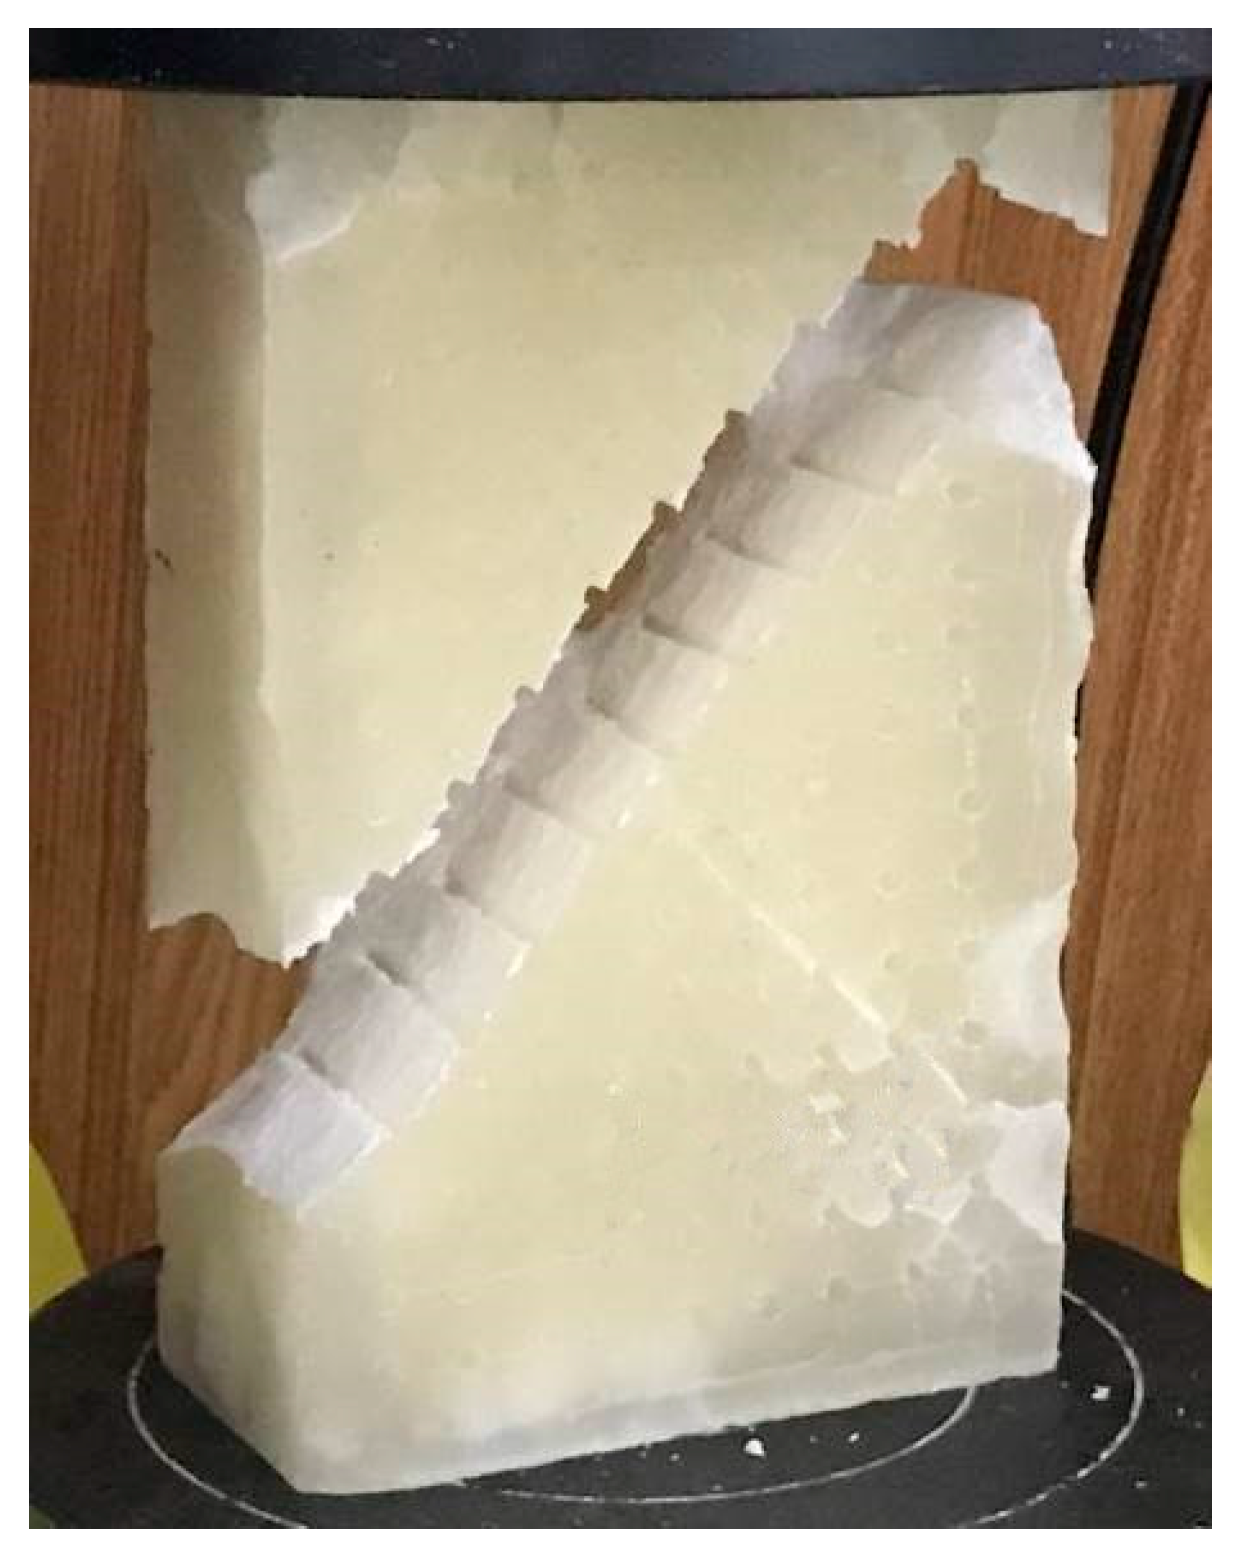
2.2. Mixed Paraffin Model Ice

Paraffin has been widely used in model tests of ice-going ships because of its similar density to ice, low melting point, simple and easy control of the crystallization process, insolubility in water, and pollution-free usage [25]. However, owing to the drawbacks of high strength and low brittleness of pure paraffin model ice, its crack propagation and failure modes when simulating the paraffin model ice-propeller milling action are different from those of sea ice. In order to meet the conditions of geometric similarity and Cauchy similarity, this paper follows the development process of mixed paraffin model ice proposed by Tian and Huang [26]. We used liquid paraffin as the solvent and added a certain proportion of quartz powder and silicon powder to improve the brittleness of the mixed base material so as to bring the damage mode of the model ice closer to that of sea ice. However, the strengths of quartz powder and silica powder are higher than that of the paraffin, which increases the strength of the model ice. This problem can be solved by controlling the crystallization of the mixed solution, drilling defects, and bubble defects and by using layered structure simulation. The mixed paraffin model ice after development is shown in Figure 2. From the cross section of the model ice, the non-frozen model ice has a structure similar to that of natural sea ice. In other words, it has a compact and dense paraffin caprock, a vesicular loose structure guided by bubbles, and an orderly arrangement of the borehole structure inside, which can effectively reduce the high toughness of paraffin and meet test requirements.
The mixed paraffin model ice was subjected to a uniaxial compression test with a high loading rate (strain rate greater than 10−2/s). The strength and failure mode of the model ice were consistent with those corresponding to the height of the low-temperature frozen ice [27], as shown in Figure 3. The figure shows the result of the uniaxial compression test of the mixed paraffin model ice. It can be observed that the model ice fractured along the 45° direction, accompanied by local spalling. Compared with the pure paraffin model ice, crack propagation and failure modes reached a level similar to that of natural sea ice. The ice force–displacement curve is shown in Figure 4. The curve shows the characteristics of fast loading and unloading, but it is different from that of natural sea ice. During the loading process, that is, during the rapidly rising phase of the curve, the curve descends for a short time and rises rapidly again, which corresponds to local spalling in the compression process. The curve decreases rapidly after rising to the top, and then full failure occurs. Figure 4 shows that the compressive strength of the mixed paraffin model ice is approximately σ = 157 kPa. The compressive strength of ice is in the same order of magnitude as that of non-frozen model ice used by other scholars to study ice-propeller milling, such as the following: Styrofoam at 170 kPa [14,15,16], expanded polystyrene and paraffin at 186 kPa [17], and phenolic foam panel at 175 kPa [18]. The elastic modulus of the mixed paraffin model ice, obtained with the three-point bending method, was E = 505 MPa. Meanwhile, according to the mass and volume of the mixed paraffin model ice, its density was approximately ρ = 839 kg/m3. The length, width, and thickness of the model ice during the test were 250 mm × 200 mm × 90 mm.

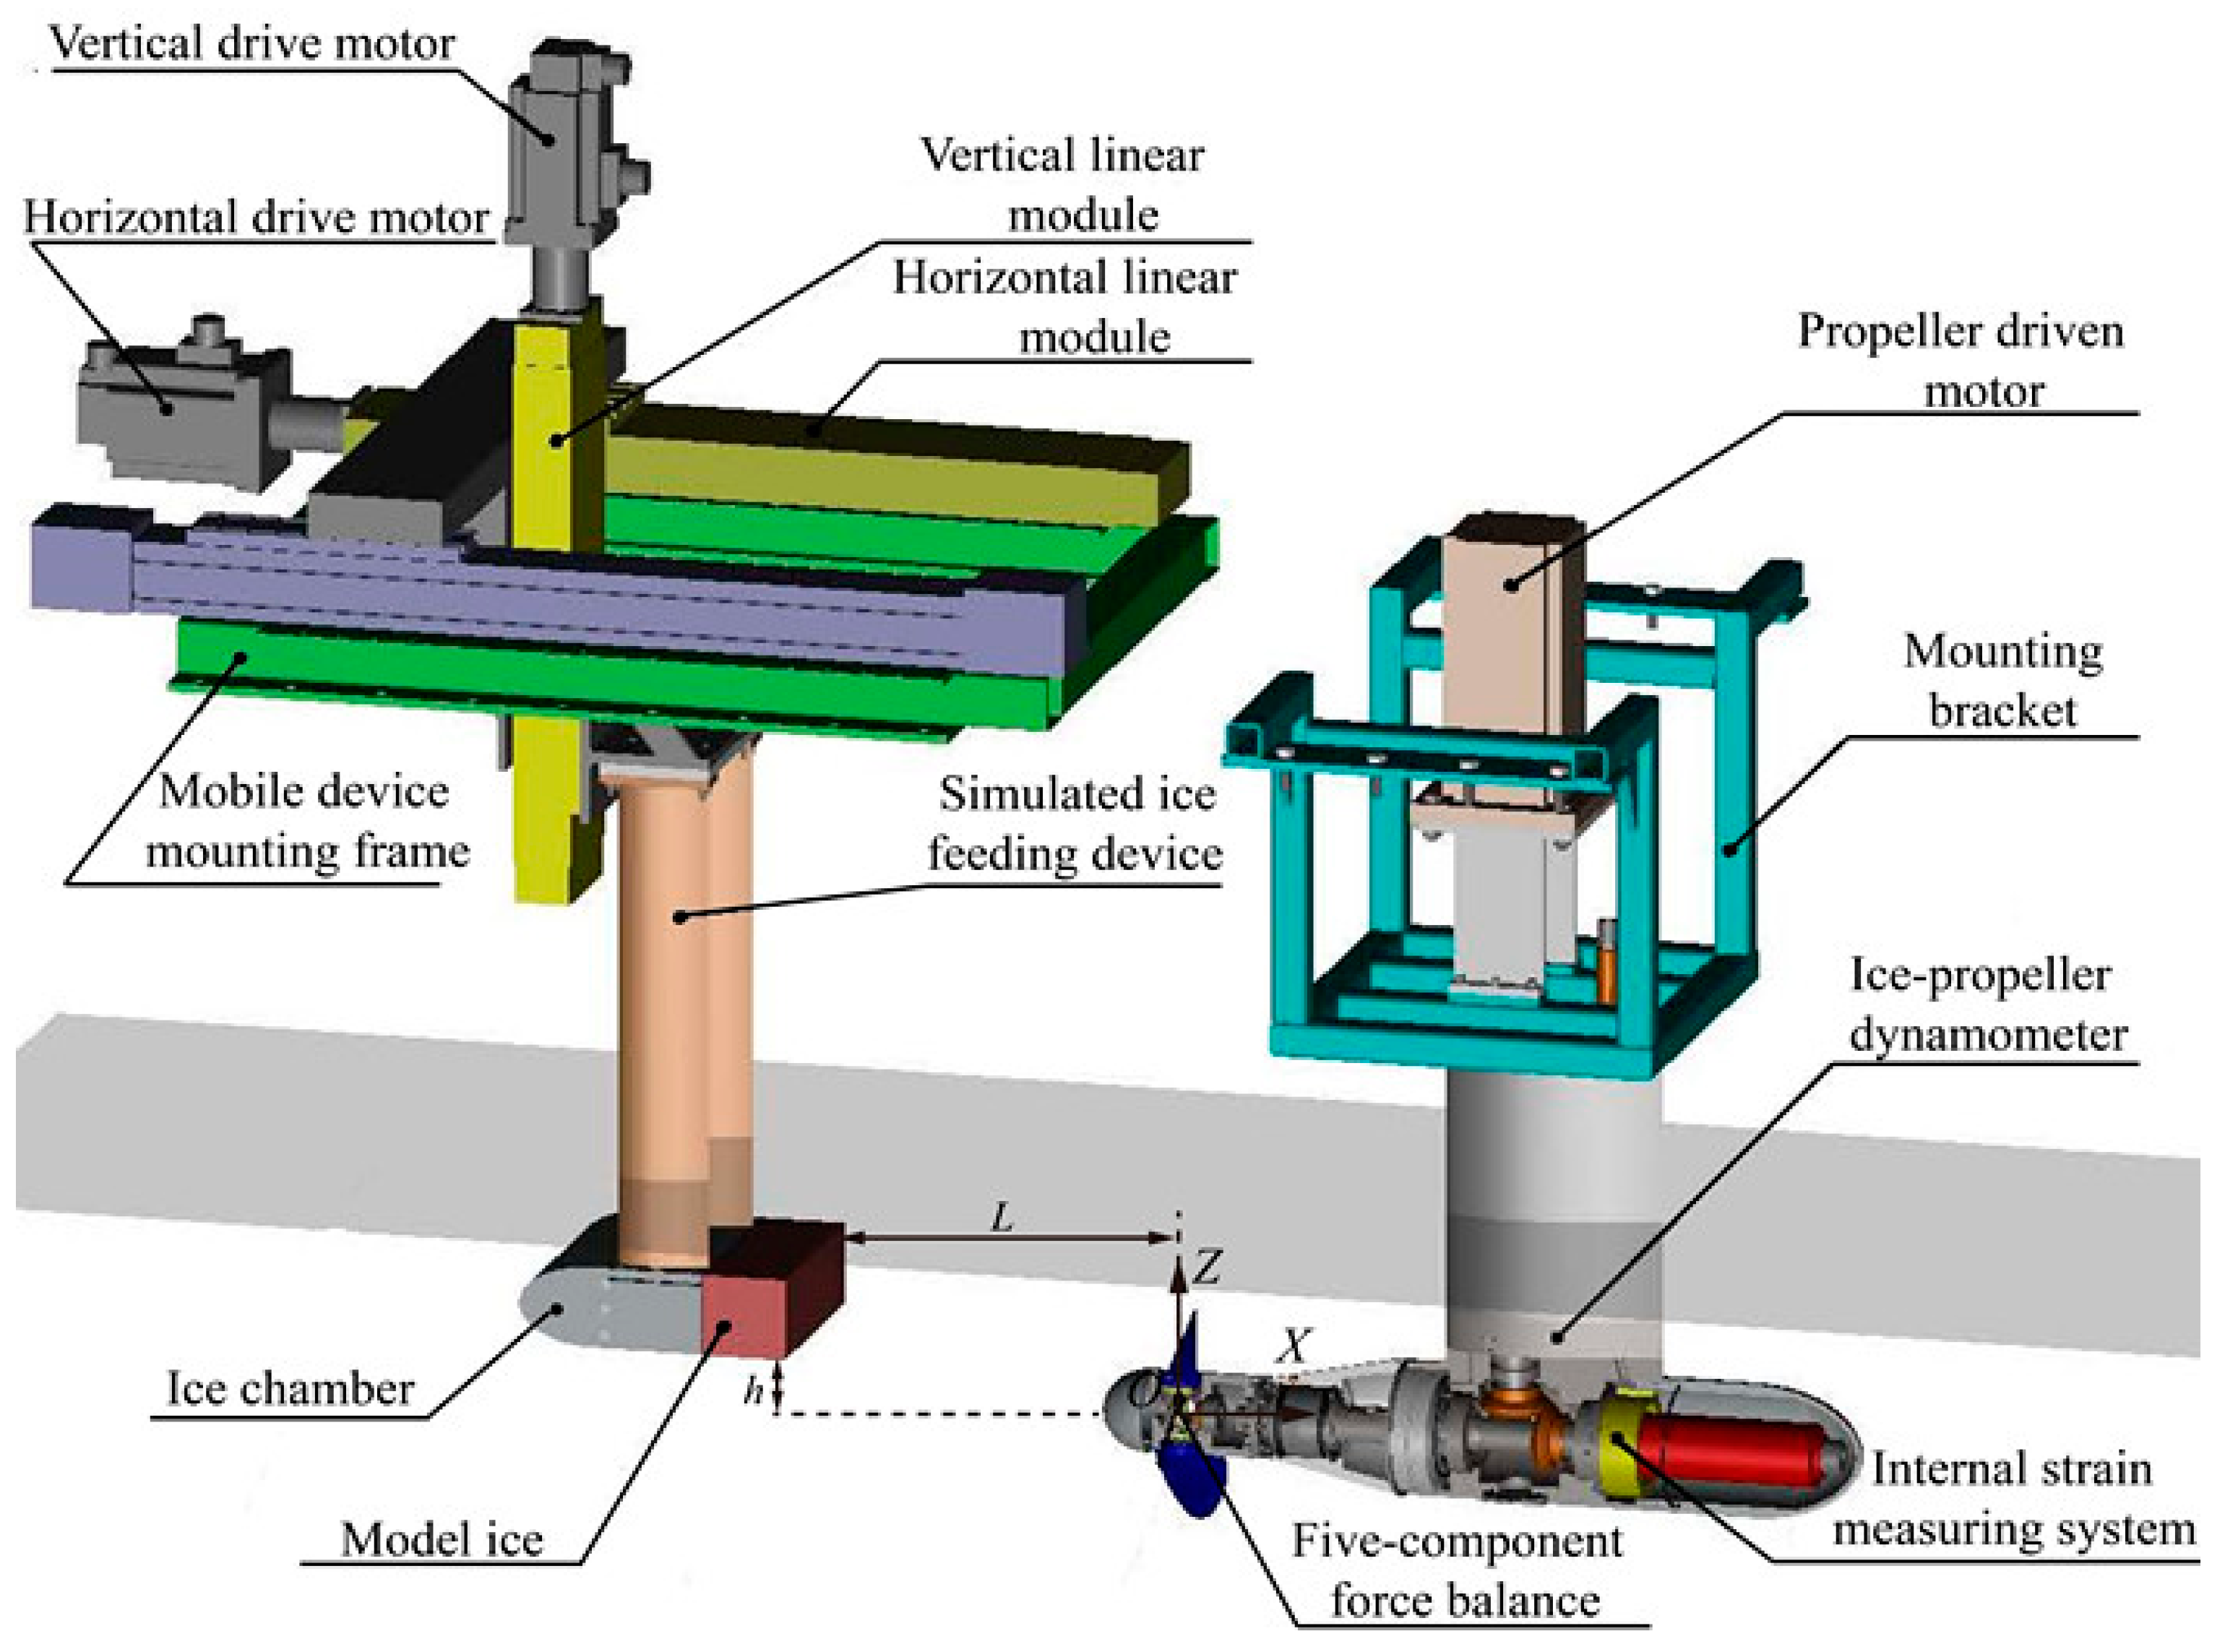
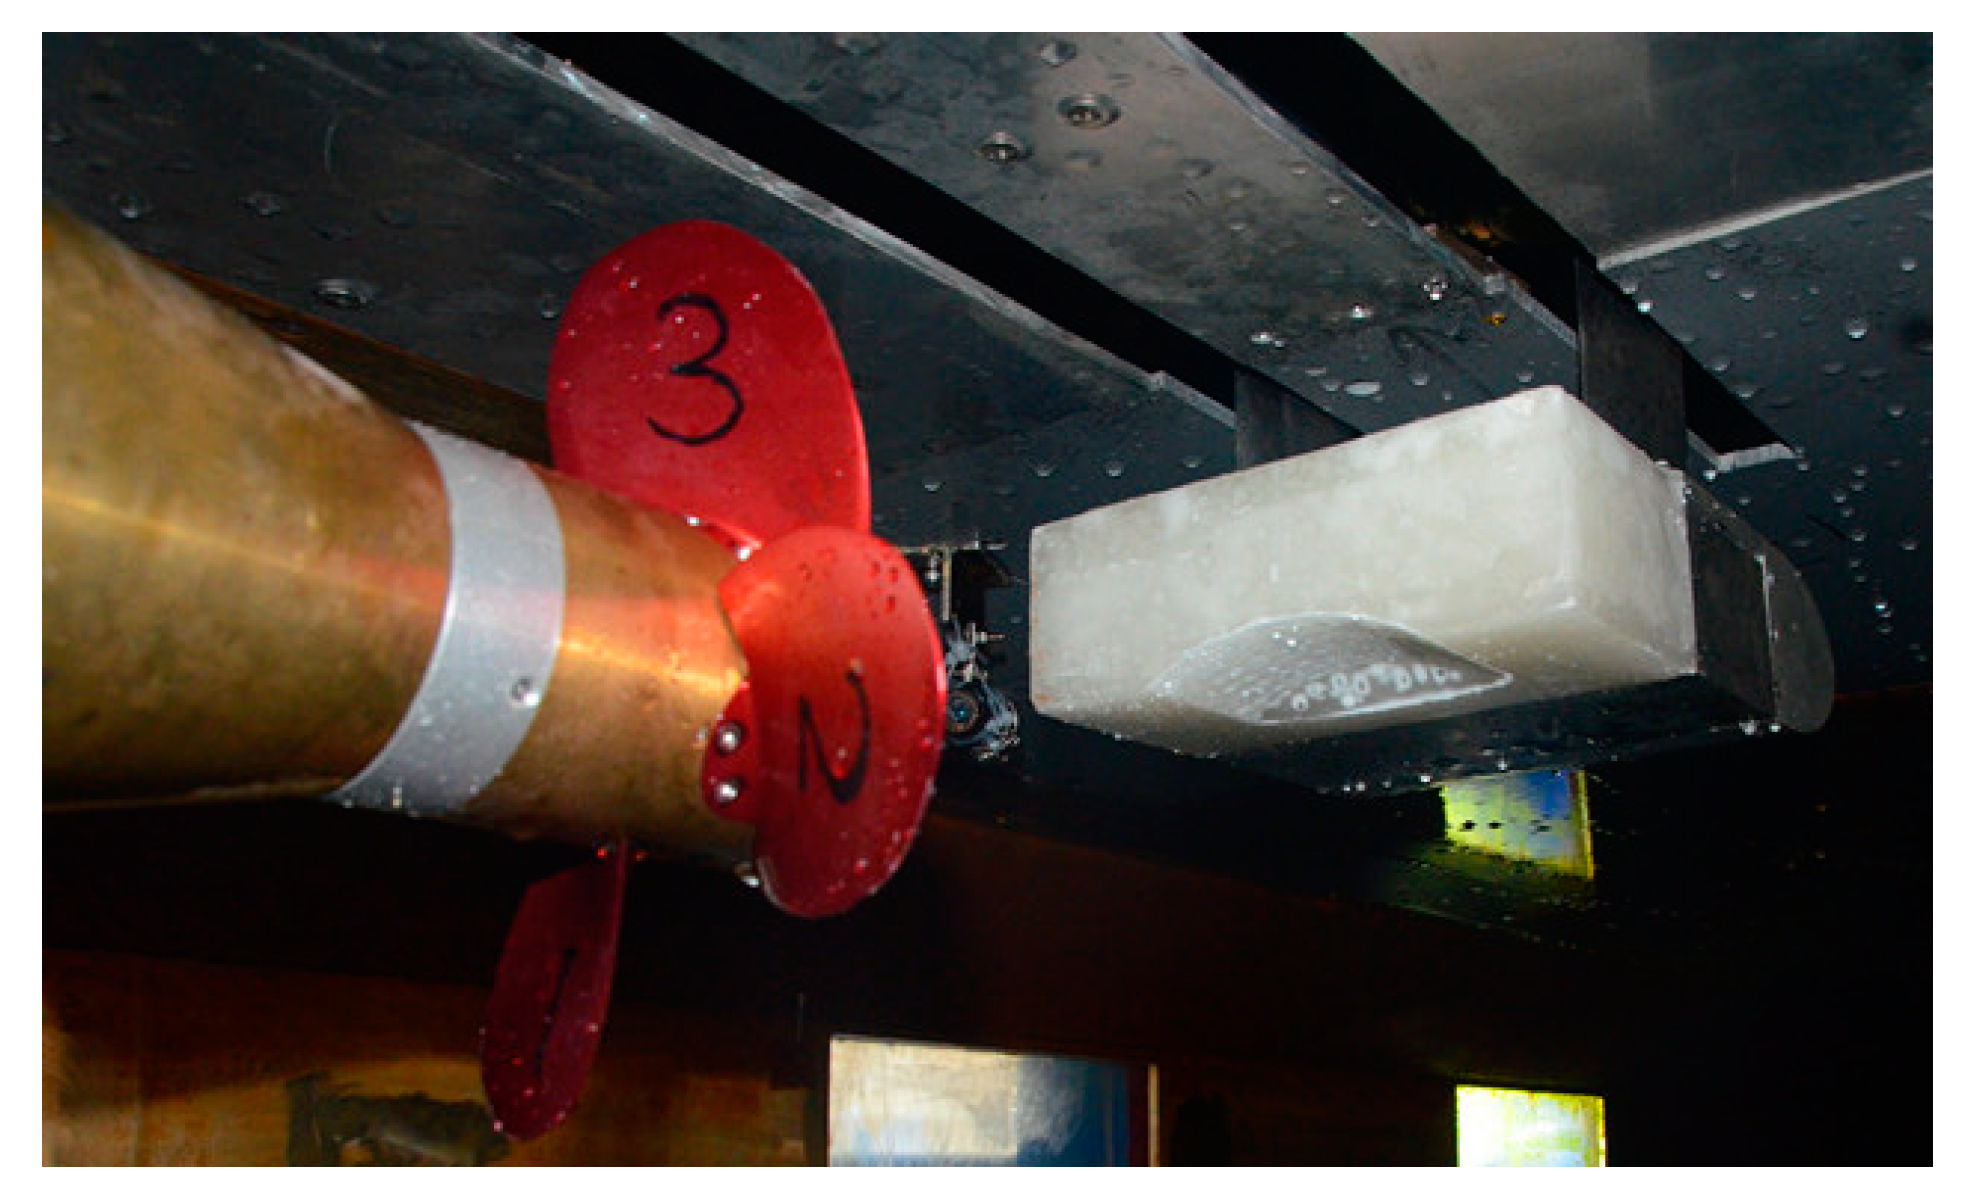
2.3. Experimental Setup
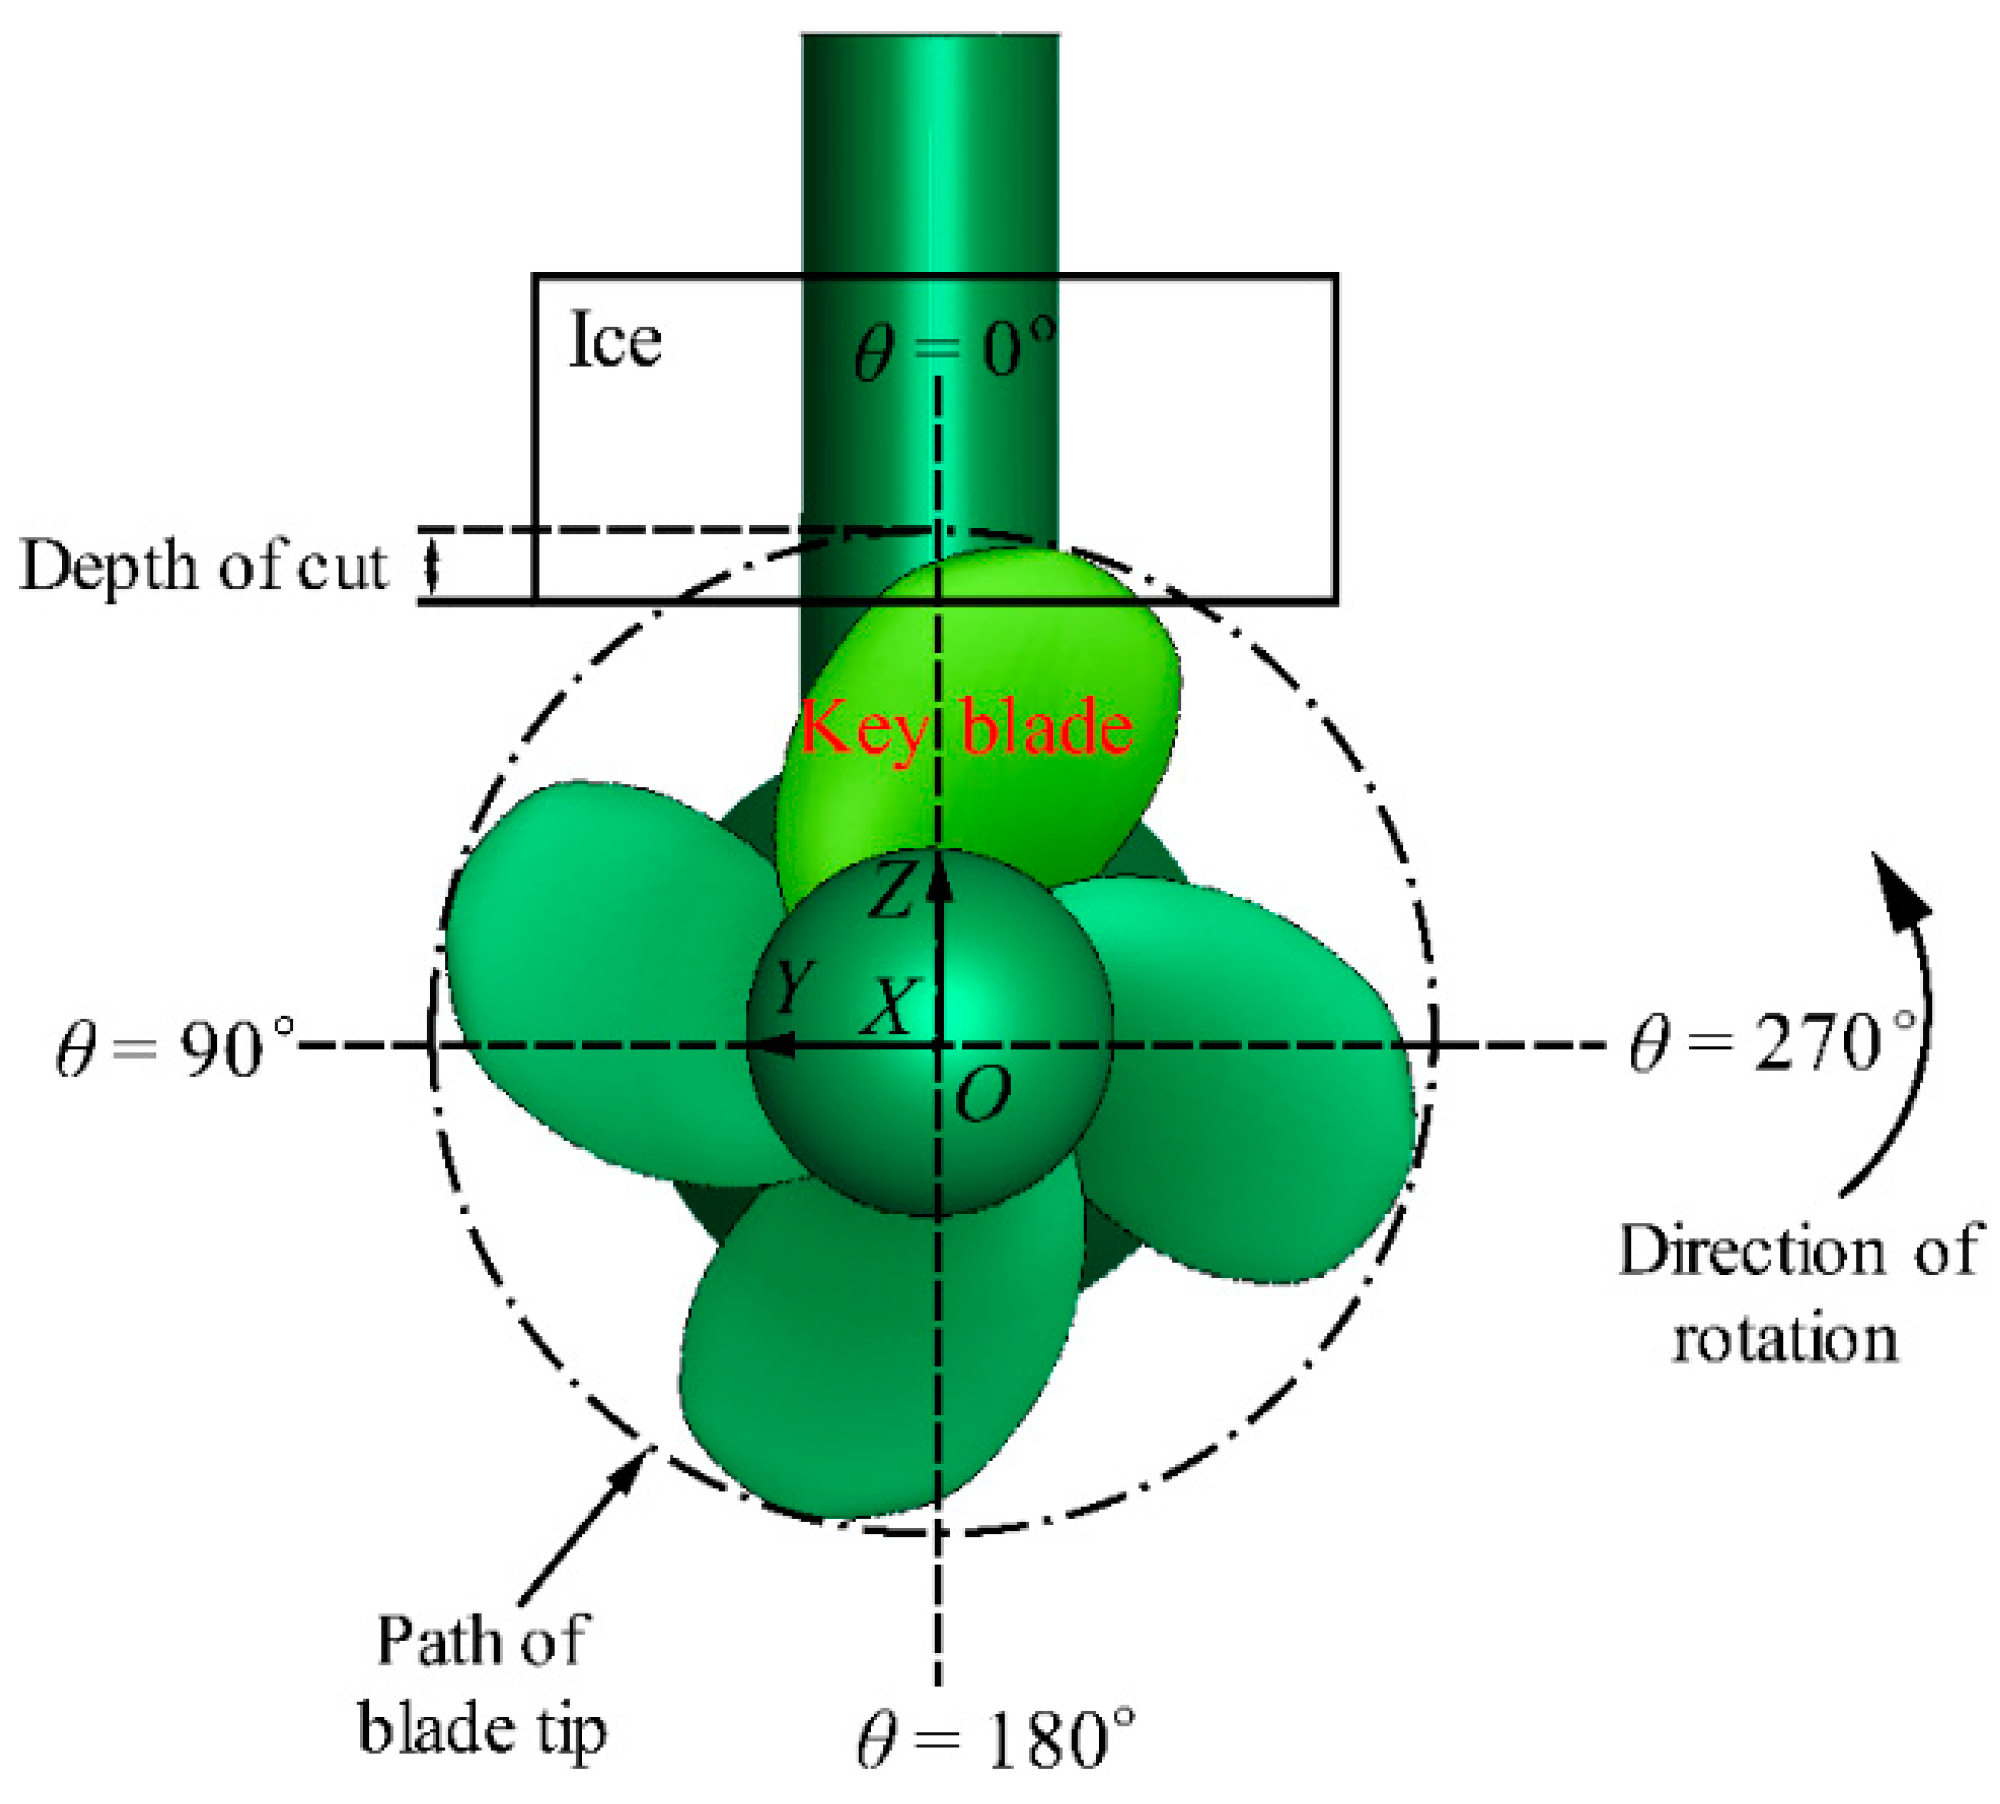
The ice-propeller milling test was carried out in a large circulating water channel at the China Ship Science Research Center. The circulating tank is the largest large-scale cavitation experimental facility in China, which supports experiments conducted with the cavitation number of a full-scale ship, but the conventional cavitation tunnel and circulating water channel are difficult to meet. The length, width, and height of the working section of the large circulating water channel were 10.5 m × 2.2 m × 2.0 m, the pressure was 10–400 kPa, the water velocity was 1.0–15.0 m/s, the velocity non-uniformity was less than 1.0%, and the minimum cavitation number was 0.07 (the water velocity was 15 m/s, and the top pressure was 10 kPa).
A schematic diagram of the model ice-feeding device and dynamometer is shown in Figure 5. The model ice-feeding device consisted of an ice chamber, drive motor, linear module, and mounting frame. The vertical motion range and axial motion range of the model ice were h = 0–70 mm and L = 0–400 mm, respectively. The dynamometer could measure the load of the propeller and single blade, and the thrust and torque of the entire propeller force-balance device were 0–1500 N and 0–50 N∙m, respectively. The ranges of the single-blade five-component force balance were 0–800 N, 0–800 N, 0–30 N∙m, 0–30 N∙m, and 0–10 N∙m. In addition, in Figure 5, the centerlines of the propeller shaft and propeller disk were used as vertical and axial reference positions, respectively. The distances between the bottom face of the model ice and center of the propeller shaft and the ice surface near the side of the propeller and propeller disk were defined as the vertical and axial relative positions of the ice-propeller, respectively.

3. Test Method

3.1. Similarity Criteria

From the point of view of the model test, the simulation of ice–water–propeller interaction must meet the similarity criteria. This model test considers the similarity relationship based on the geometric similarity, motion similarity, viscous force similarity, cavitation similarity, and similarity with the mechanical properties of ice.
(1)
Geometric similarity
The propeller model, constructed according to the scale ratio of 1:16.46, ensures geometric similarity between the full-scale propeller and the model.
(2)
Motion similarity
The dimensionless advance coefficient J is the same for the model and full-scale propeller, which ensures that the motion of the model is similar to that of the full-scale propeller. The dimensionless coefficients of the thrust and torque of the propeller and a single blade are defined as follows:
J = V n D
K T = T ρ n 2 D 4
K Q = Q ρ n 2 D 5
K T A _ B L A D E = T A ρ n 2 D 4
K T T _ B L A D E = T T ρ n 2 D 4
K Q X _ B L A D E = Q X ρ n 2 D 5
K Q Y _ B L A D E = Q Y ρ n 2 D 5
K Q Z _ B L A D E = Q Z ρ n 2 D 5
where V is the inflow velocity, n is the propeller rotational speed, D is the propeller diameter, ρ is the density of water, and T and KT are the propeller thrust and thrust coefficient, respectively; Q and KQ are the propeller torque and torque coefficient, respectively; TX and KTX_BLADE are the thrust and thrust coefficient of a single blade in the X direction, respectively; TT and KTT_BLADE are the tangential force and tangential force coefficient of a single blade, respectively; QX, QY, QZ, and KQX_BLADE, KQY_BLADE, and KQZ_BLADE are the torque and torque coefficients, respectively, of a single blade in three directions.
(3)
Viscous force similarity
Due to the fact that the condition of equality of the Reynolds number cannot be satisfied in the model test, the Reynolds number Re(0.75R) of the chord length of the blade section at 0.75R is required to exceed the critical Reynolds number:
R e ( 0.75 R ) = L 0.75 R V 2 + ( 0.75 π n D ) 2 ν > 3.0 × 10 5
where L0.75R is the chord length of the blade section at 0.75R, and ν is the coefficient of kinematic viscosity of water.
(4)
Cavitation similarity
The cavitation number of the rotational speed of the flow passing through the propeller disk at a radius of 0.8R directly above the propeller axis is equal to that of the full-scale ship:
Full - scale :   σ n s ( 0.8 R ) = p a + ρ s g ( h s - 0.4 D s ) - p v 0.5 ρ s ( 0.8 π n s D s ) 2
Model :   σ n m ( 0.8 R ) = p 0 ( 0.8 R ) - p v 0.5 ρ m ( 0.8 π n m D m ) 2
σ n s ( 0.8 R ) = σ n m ( 0.8 R )
where σ is the cavitation number, Pa is the atmospheric pressure, Pv is the vaporization pressure of water, hs is the center depth of the full-scale propeller shaft, and P0(0.8R) is the static pressure of the 0.8R radial blade section at the 12 o’clock position; the subscripts s and m represent the full-scale propeller and model, respectively.
(5)
Similarity with the mechanical properties of ice
The milling test of the ice propeller follows the Cauchy number similarity criterion, which for maintaining the elastic force similarity between the model ice and sea ice:
ρ s ( n s D s ) 2 E s = ρ m ( n m D m ) 2 E m
where Es is the elastic modulus of sea ice, and Em is the elastic modulus of model ice. Other definitions are shown above.

3.2. Operating Conditions

Two sets of full-scale ship operating conditions of the experimental ice-class propeller model were selected [28,29], as shown in Table 2. The test model and test conditions were selected according to an equal proportion of full-scale ships.
The pressure of the circulating water channel was adjusted according to the defined cavitation number of the rotational speed, and the test water speed was adjusted according to the advance coefficient and rotational speed. The ice-propeller milling tests were conducted in air and water. The ice–water propeller milling tests included the atmospheric pressure and decompression test conditions. The specific operating conditions are presented in Table 3.
In addition, in order to comprehensively analyze the load variation of a single blade during rotation, Figure 6 shows the different rotation positions of the key blade and the coordinate system. The origin of the coordinate system was located at the center of the propeller disk, and the positive direction of the X-axis extended from the propeller to the pod, the positive direction of the Z-axis extended vertically upward, and the positive direction of the Y-axis was determined according to the right-hand rule.

4. Analysis of Experimental Results

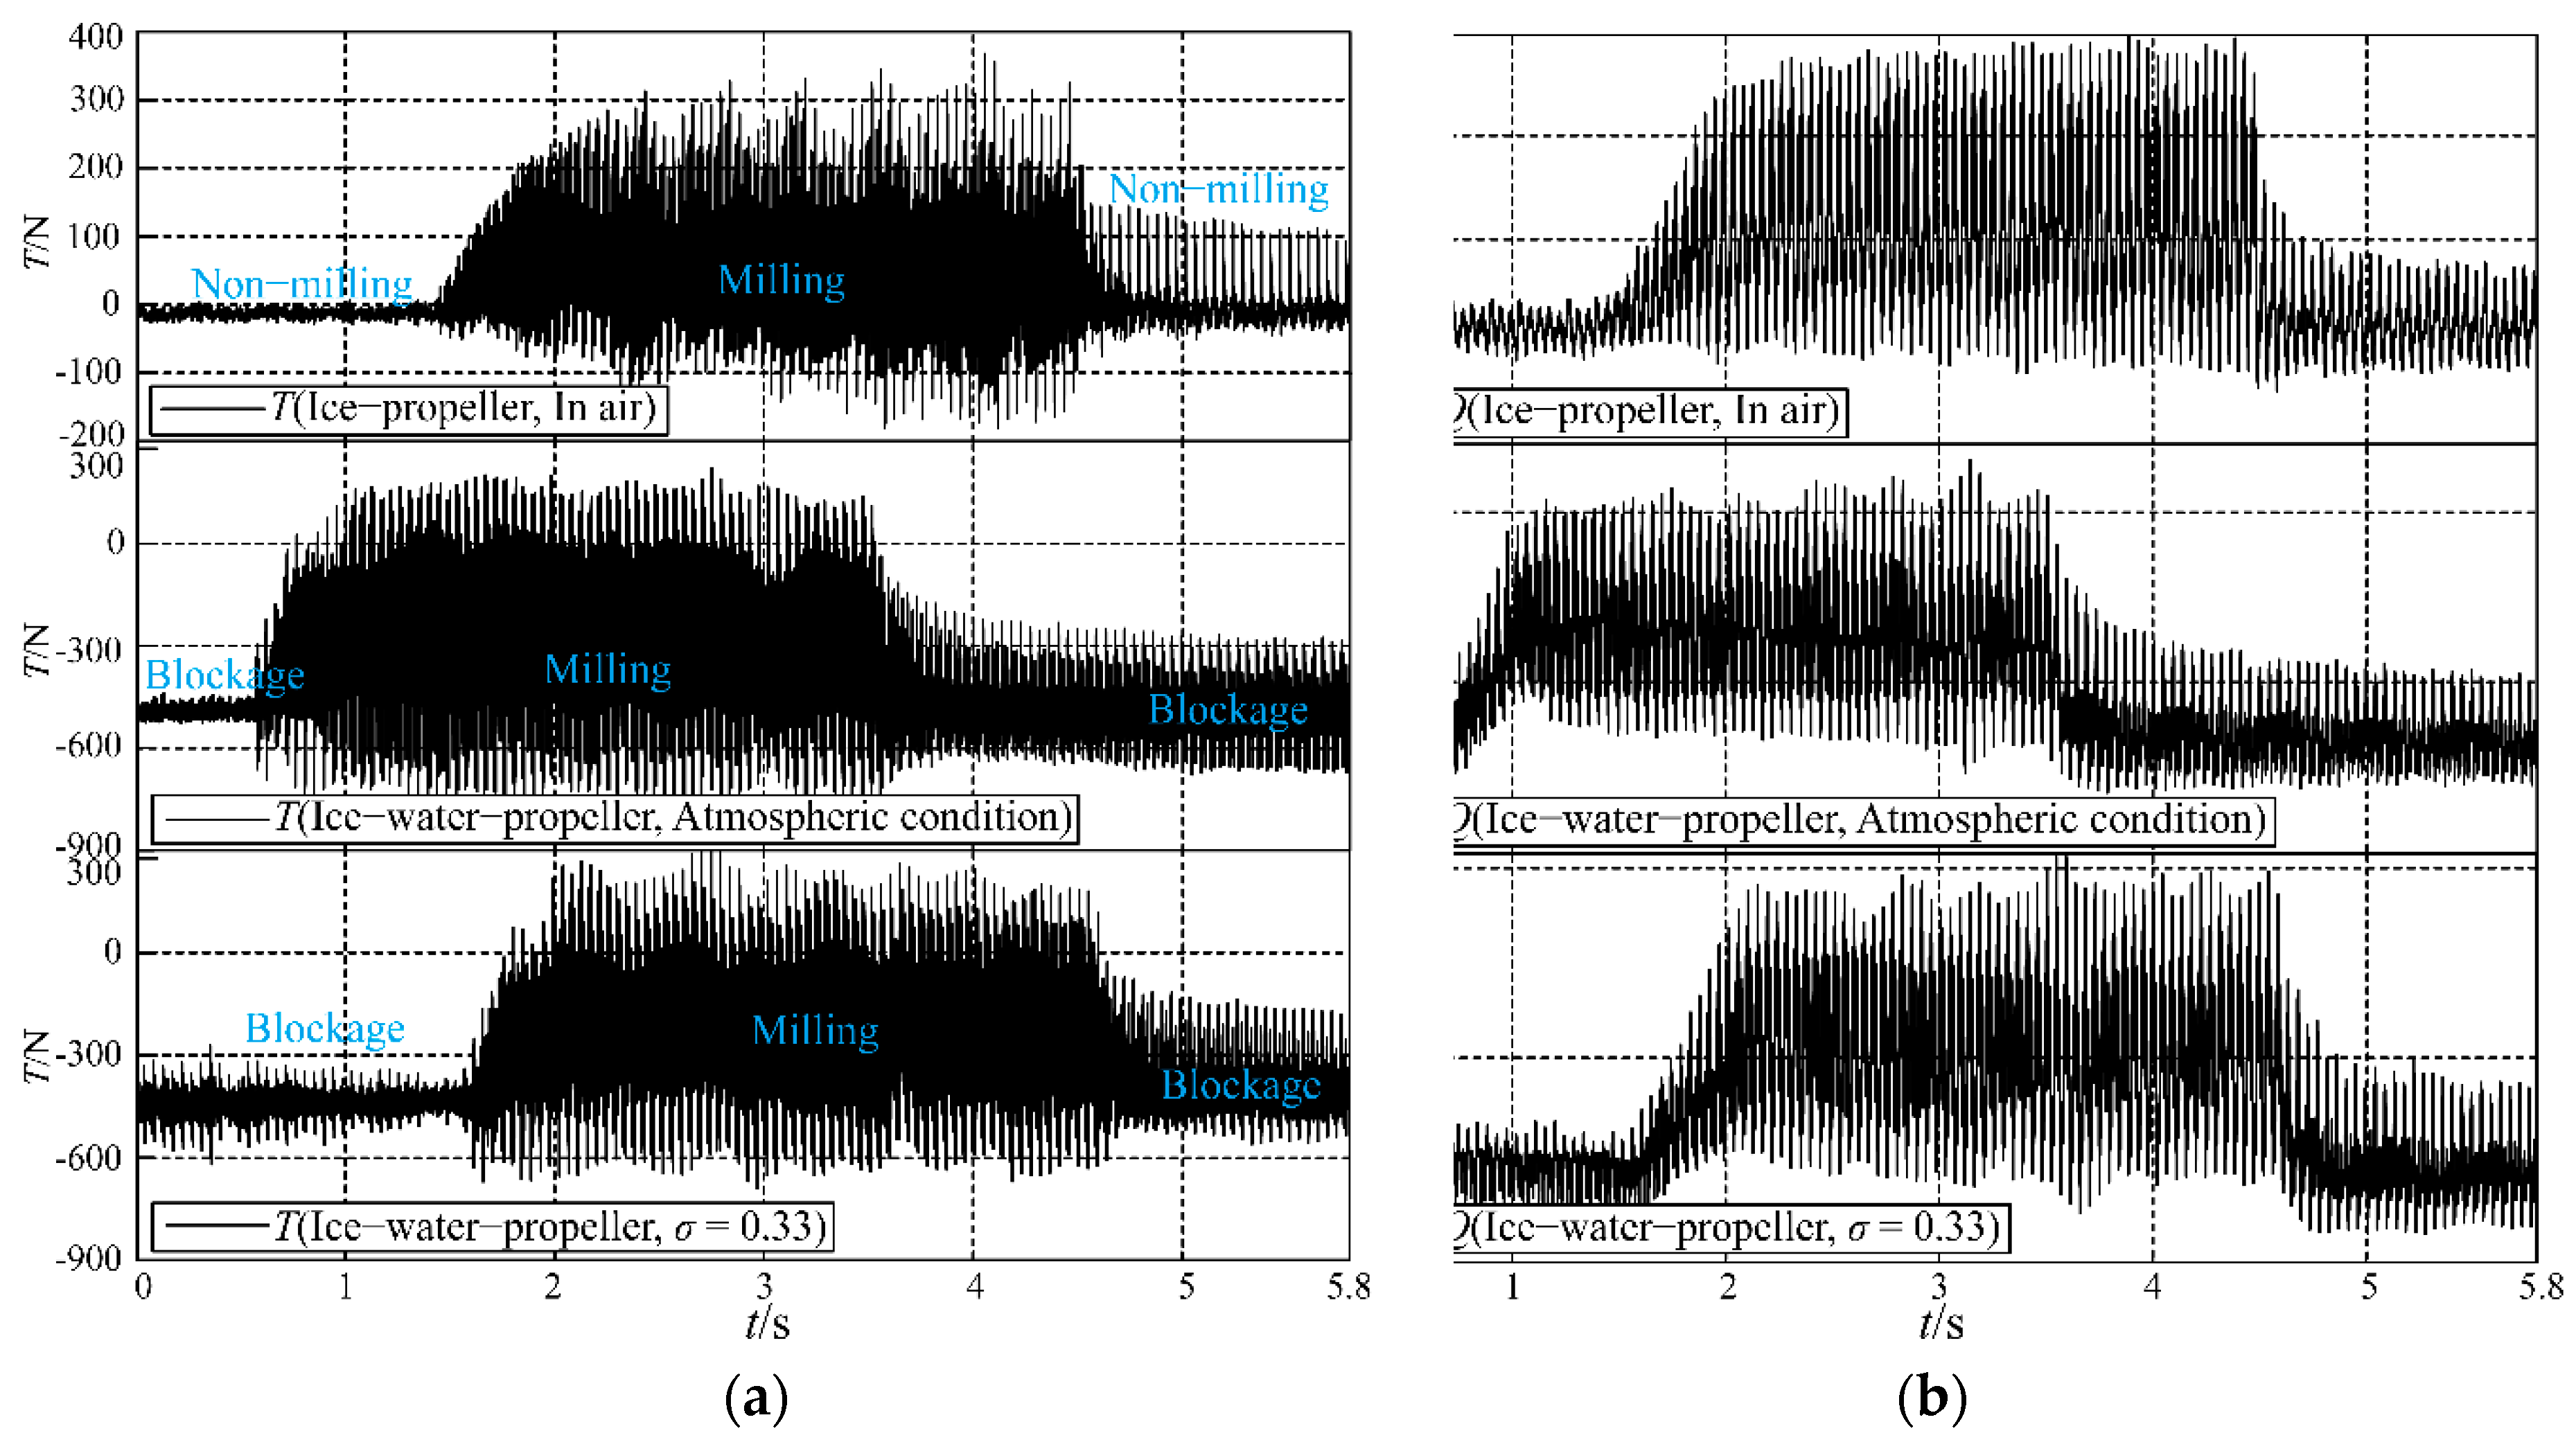
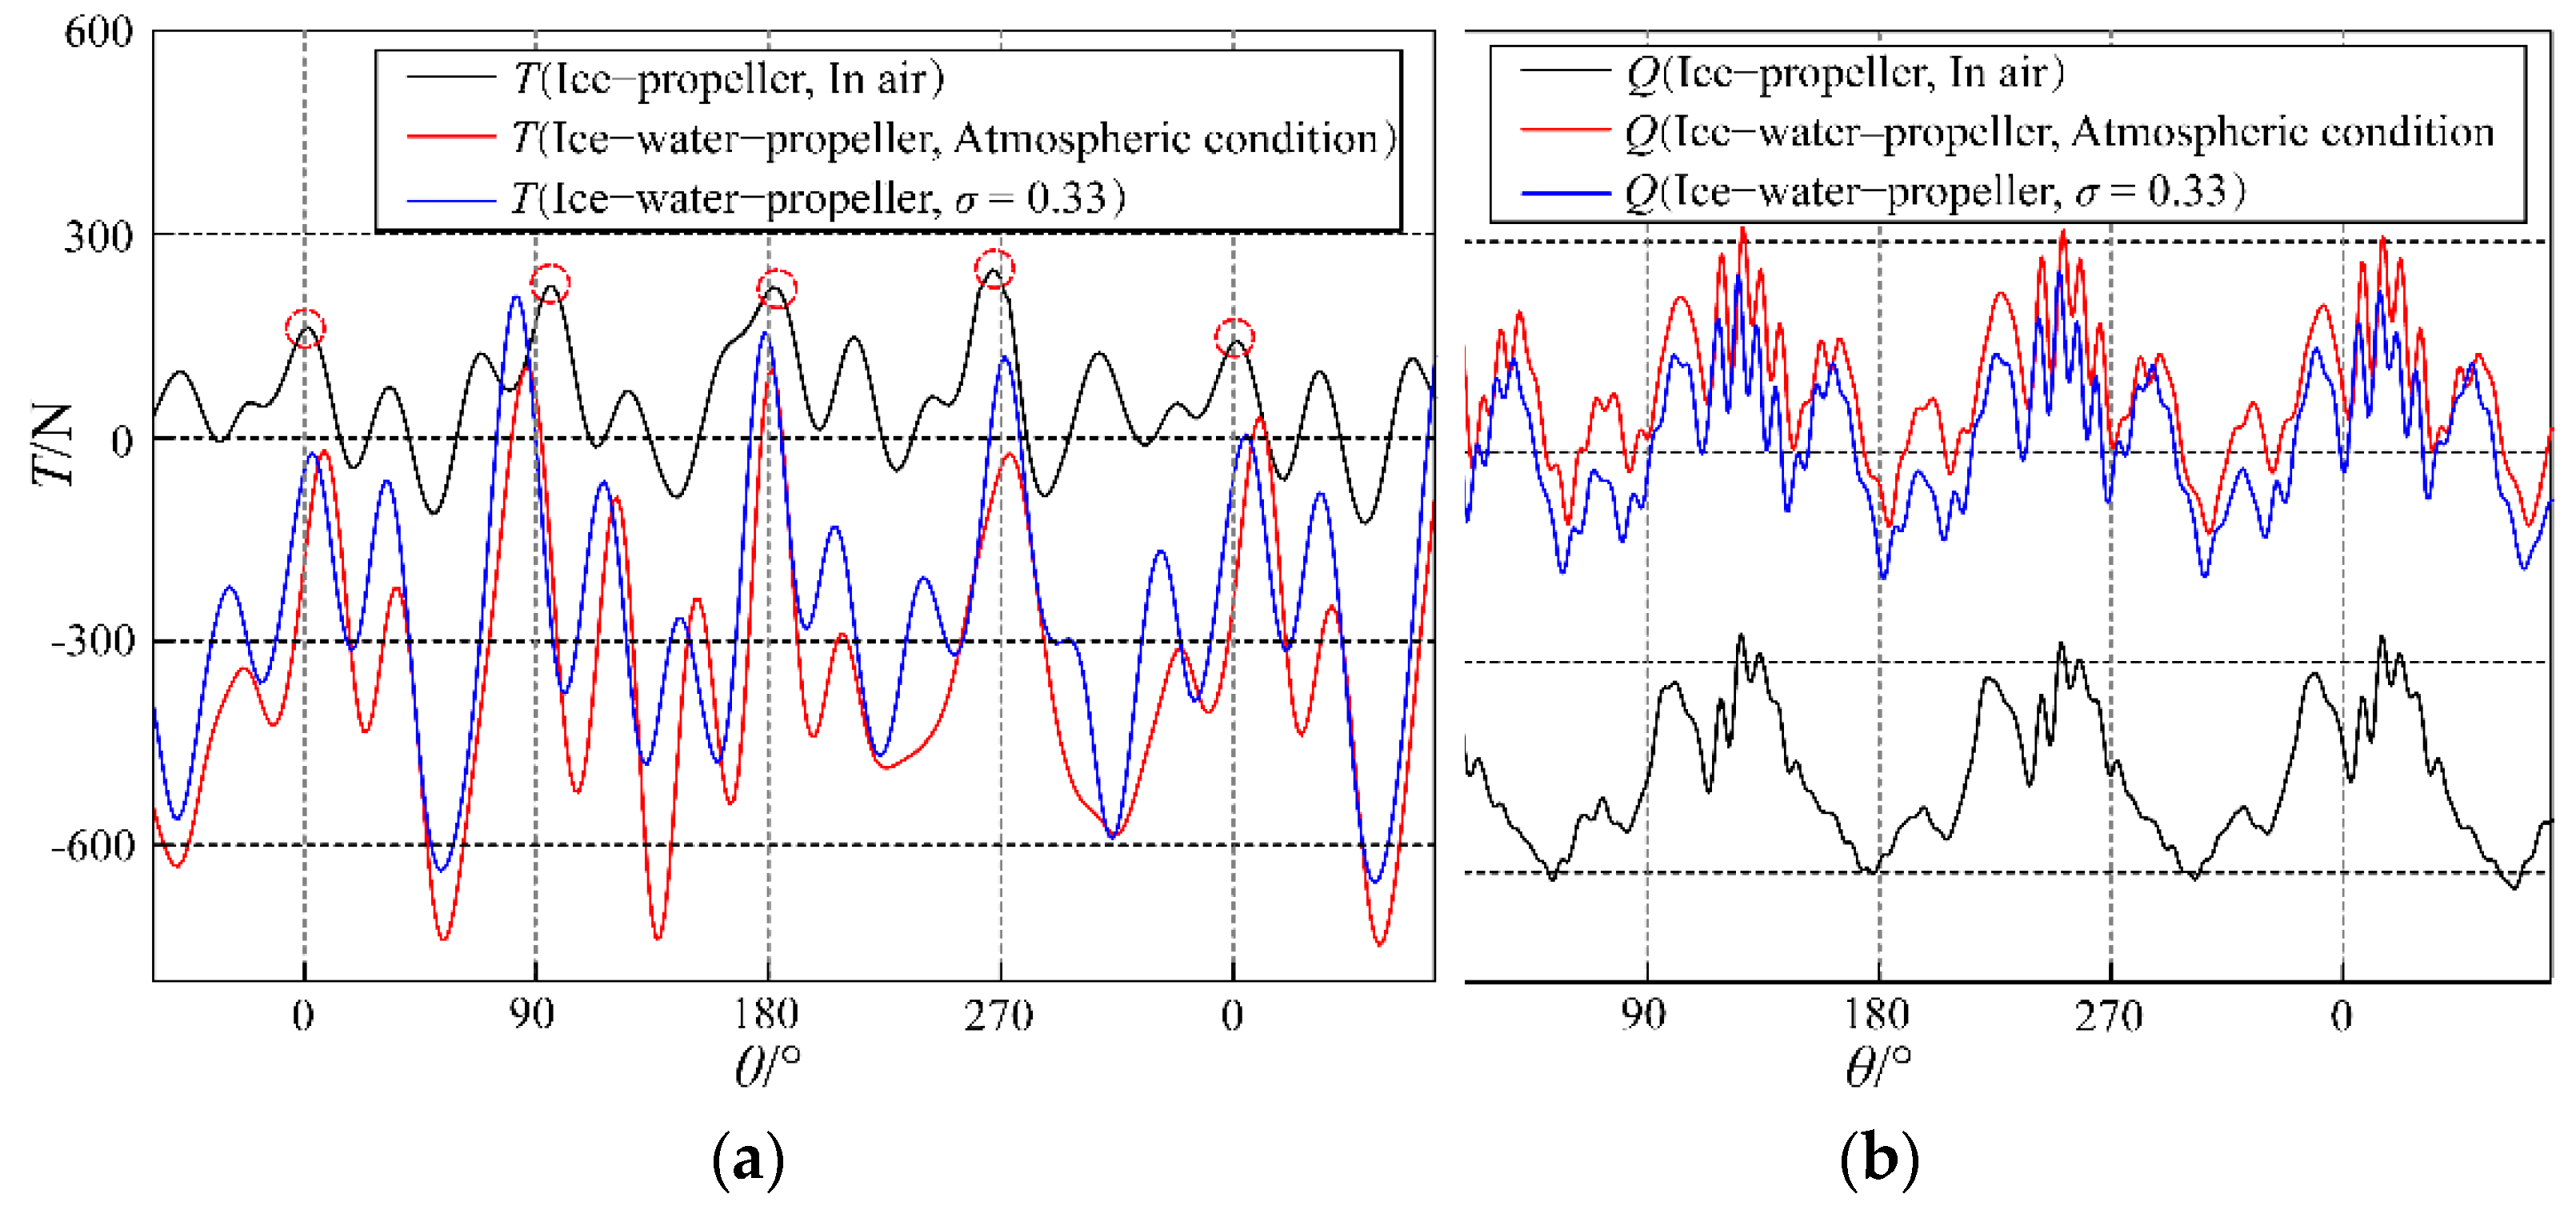
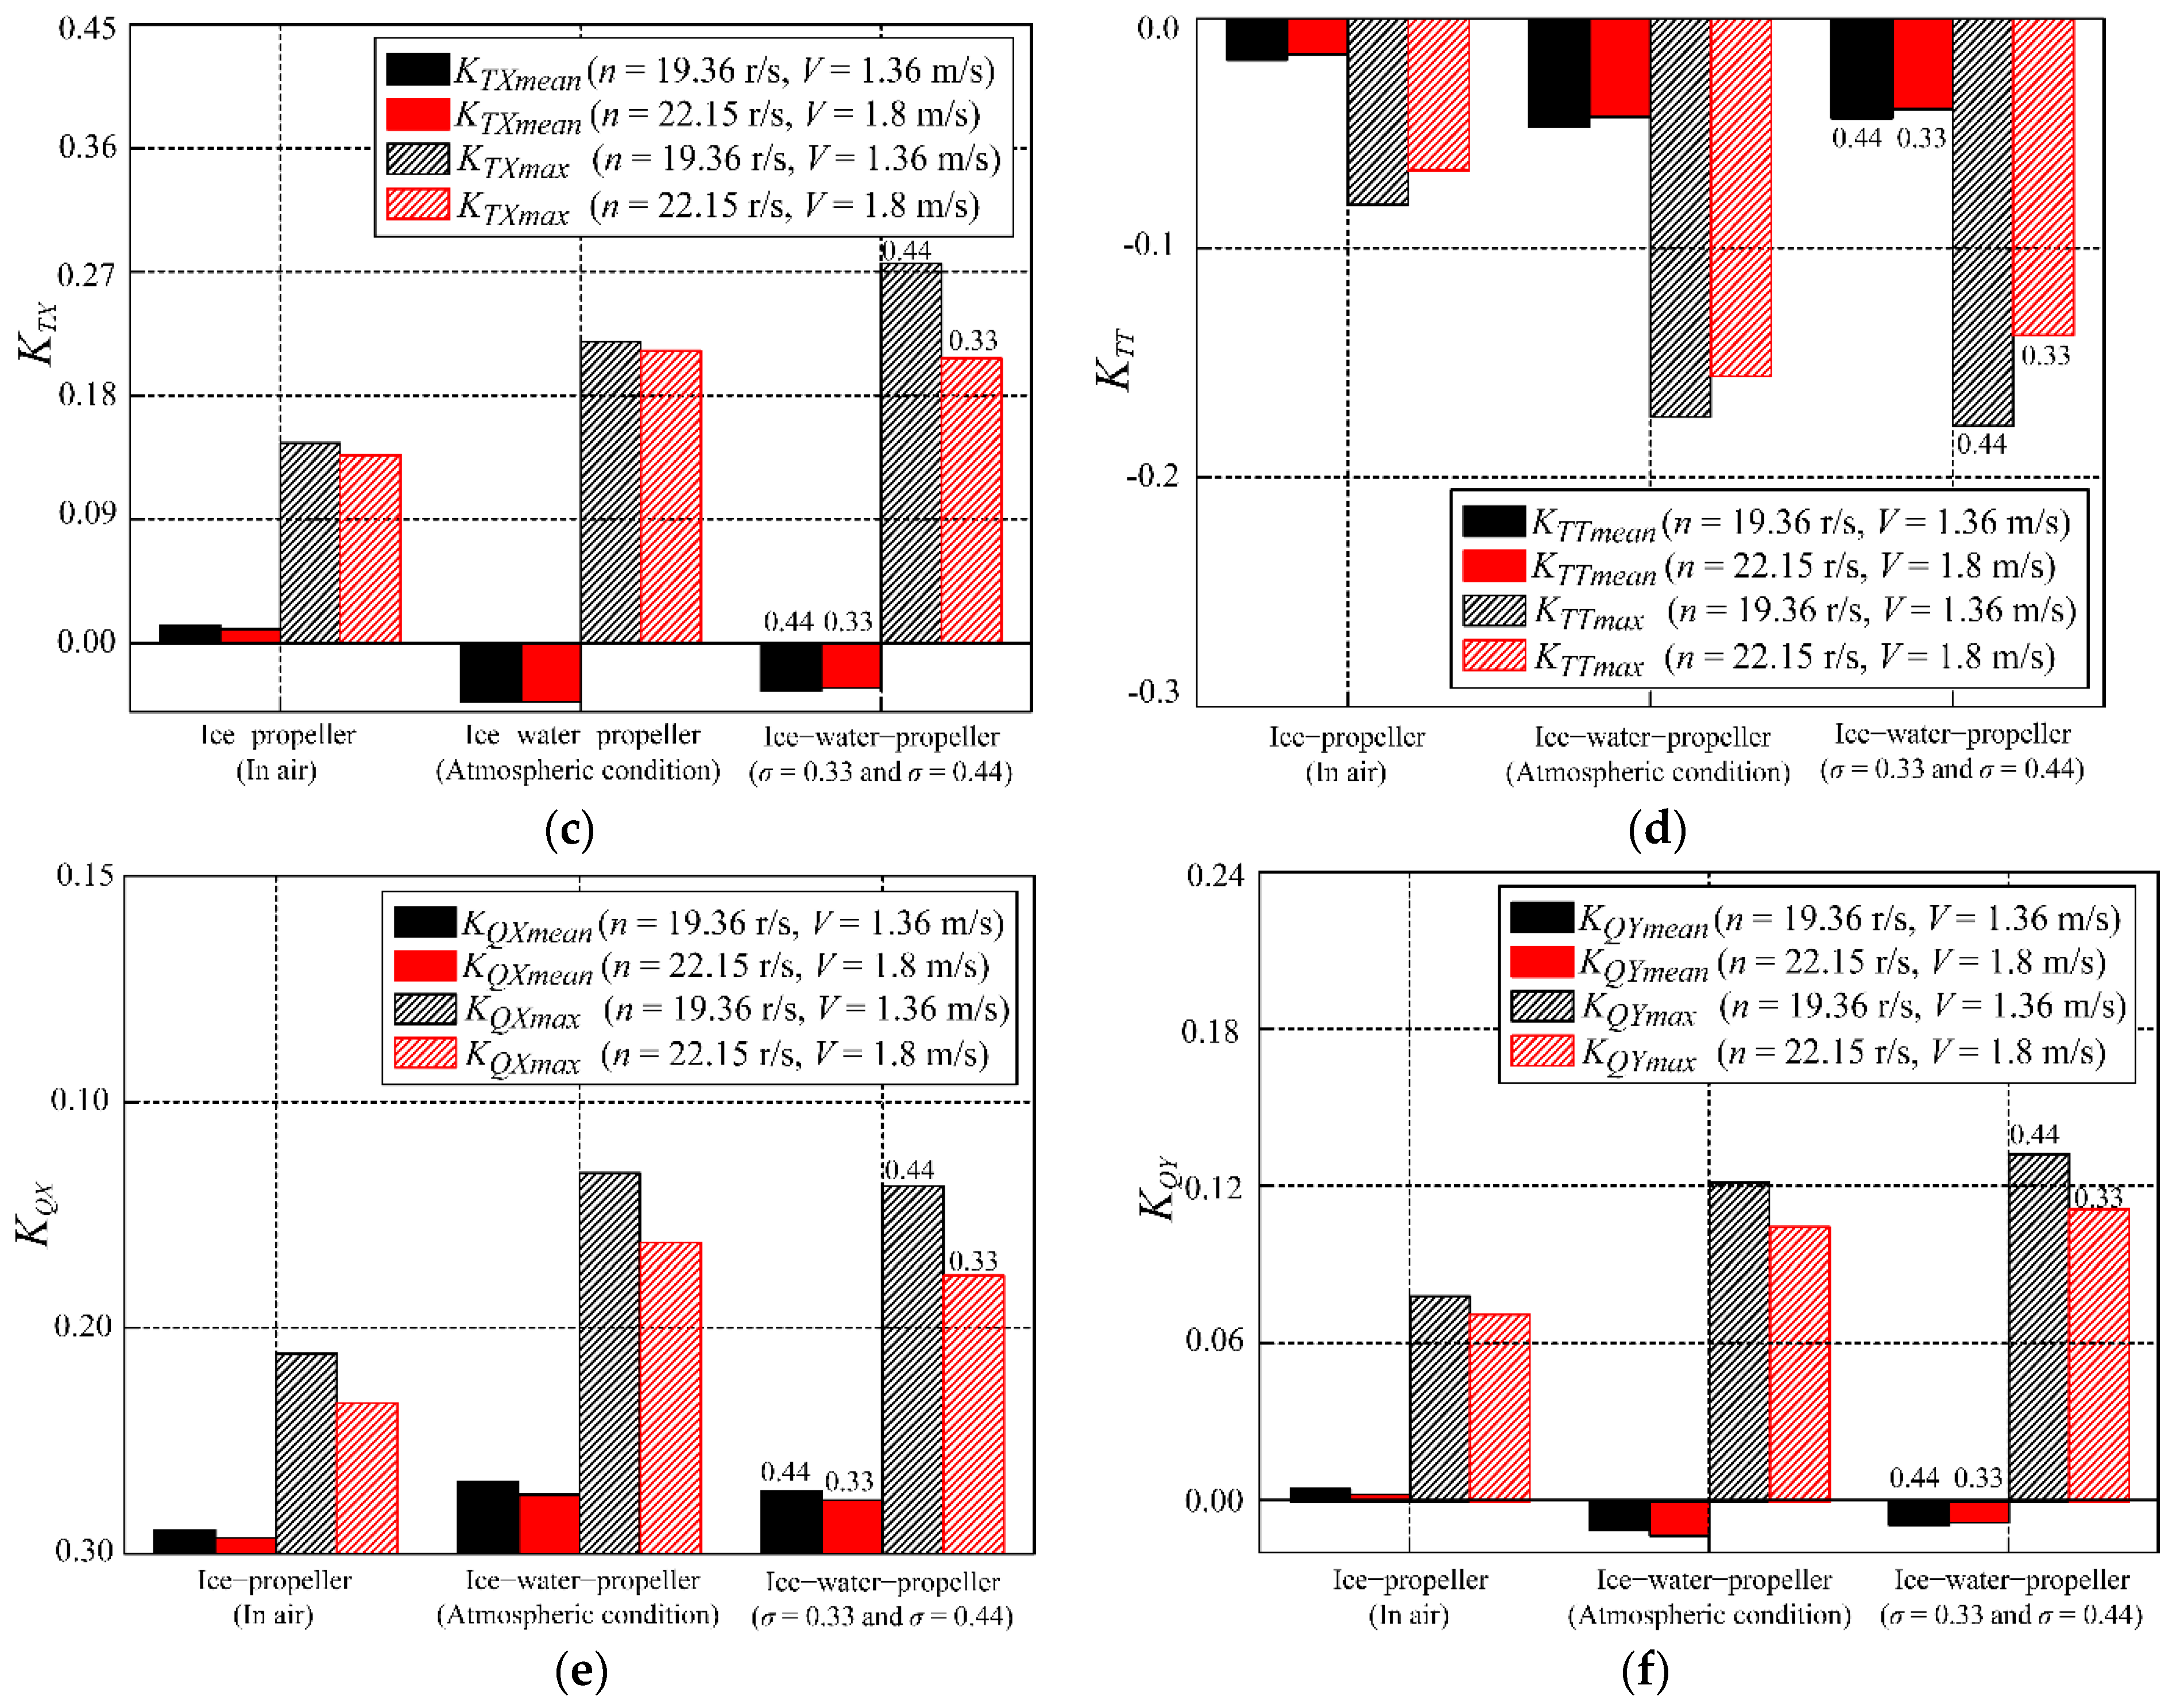
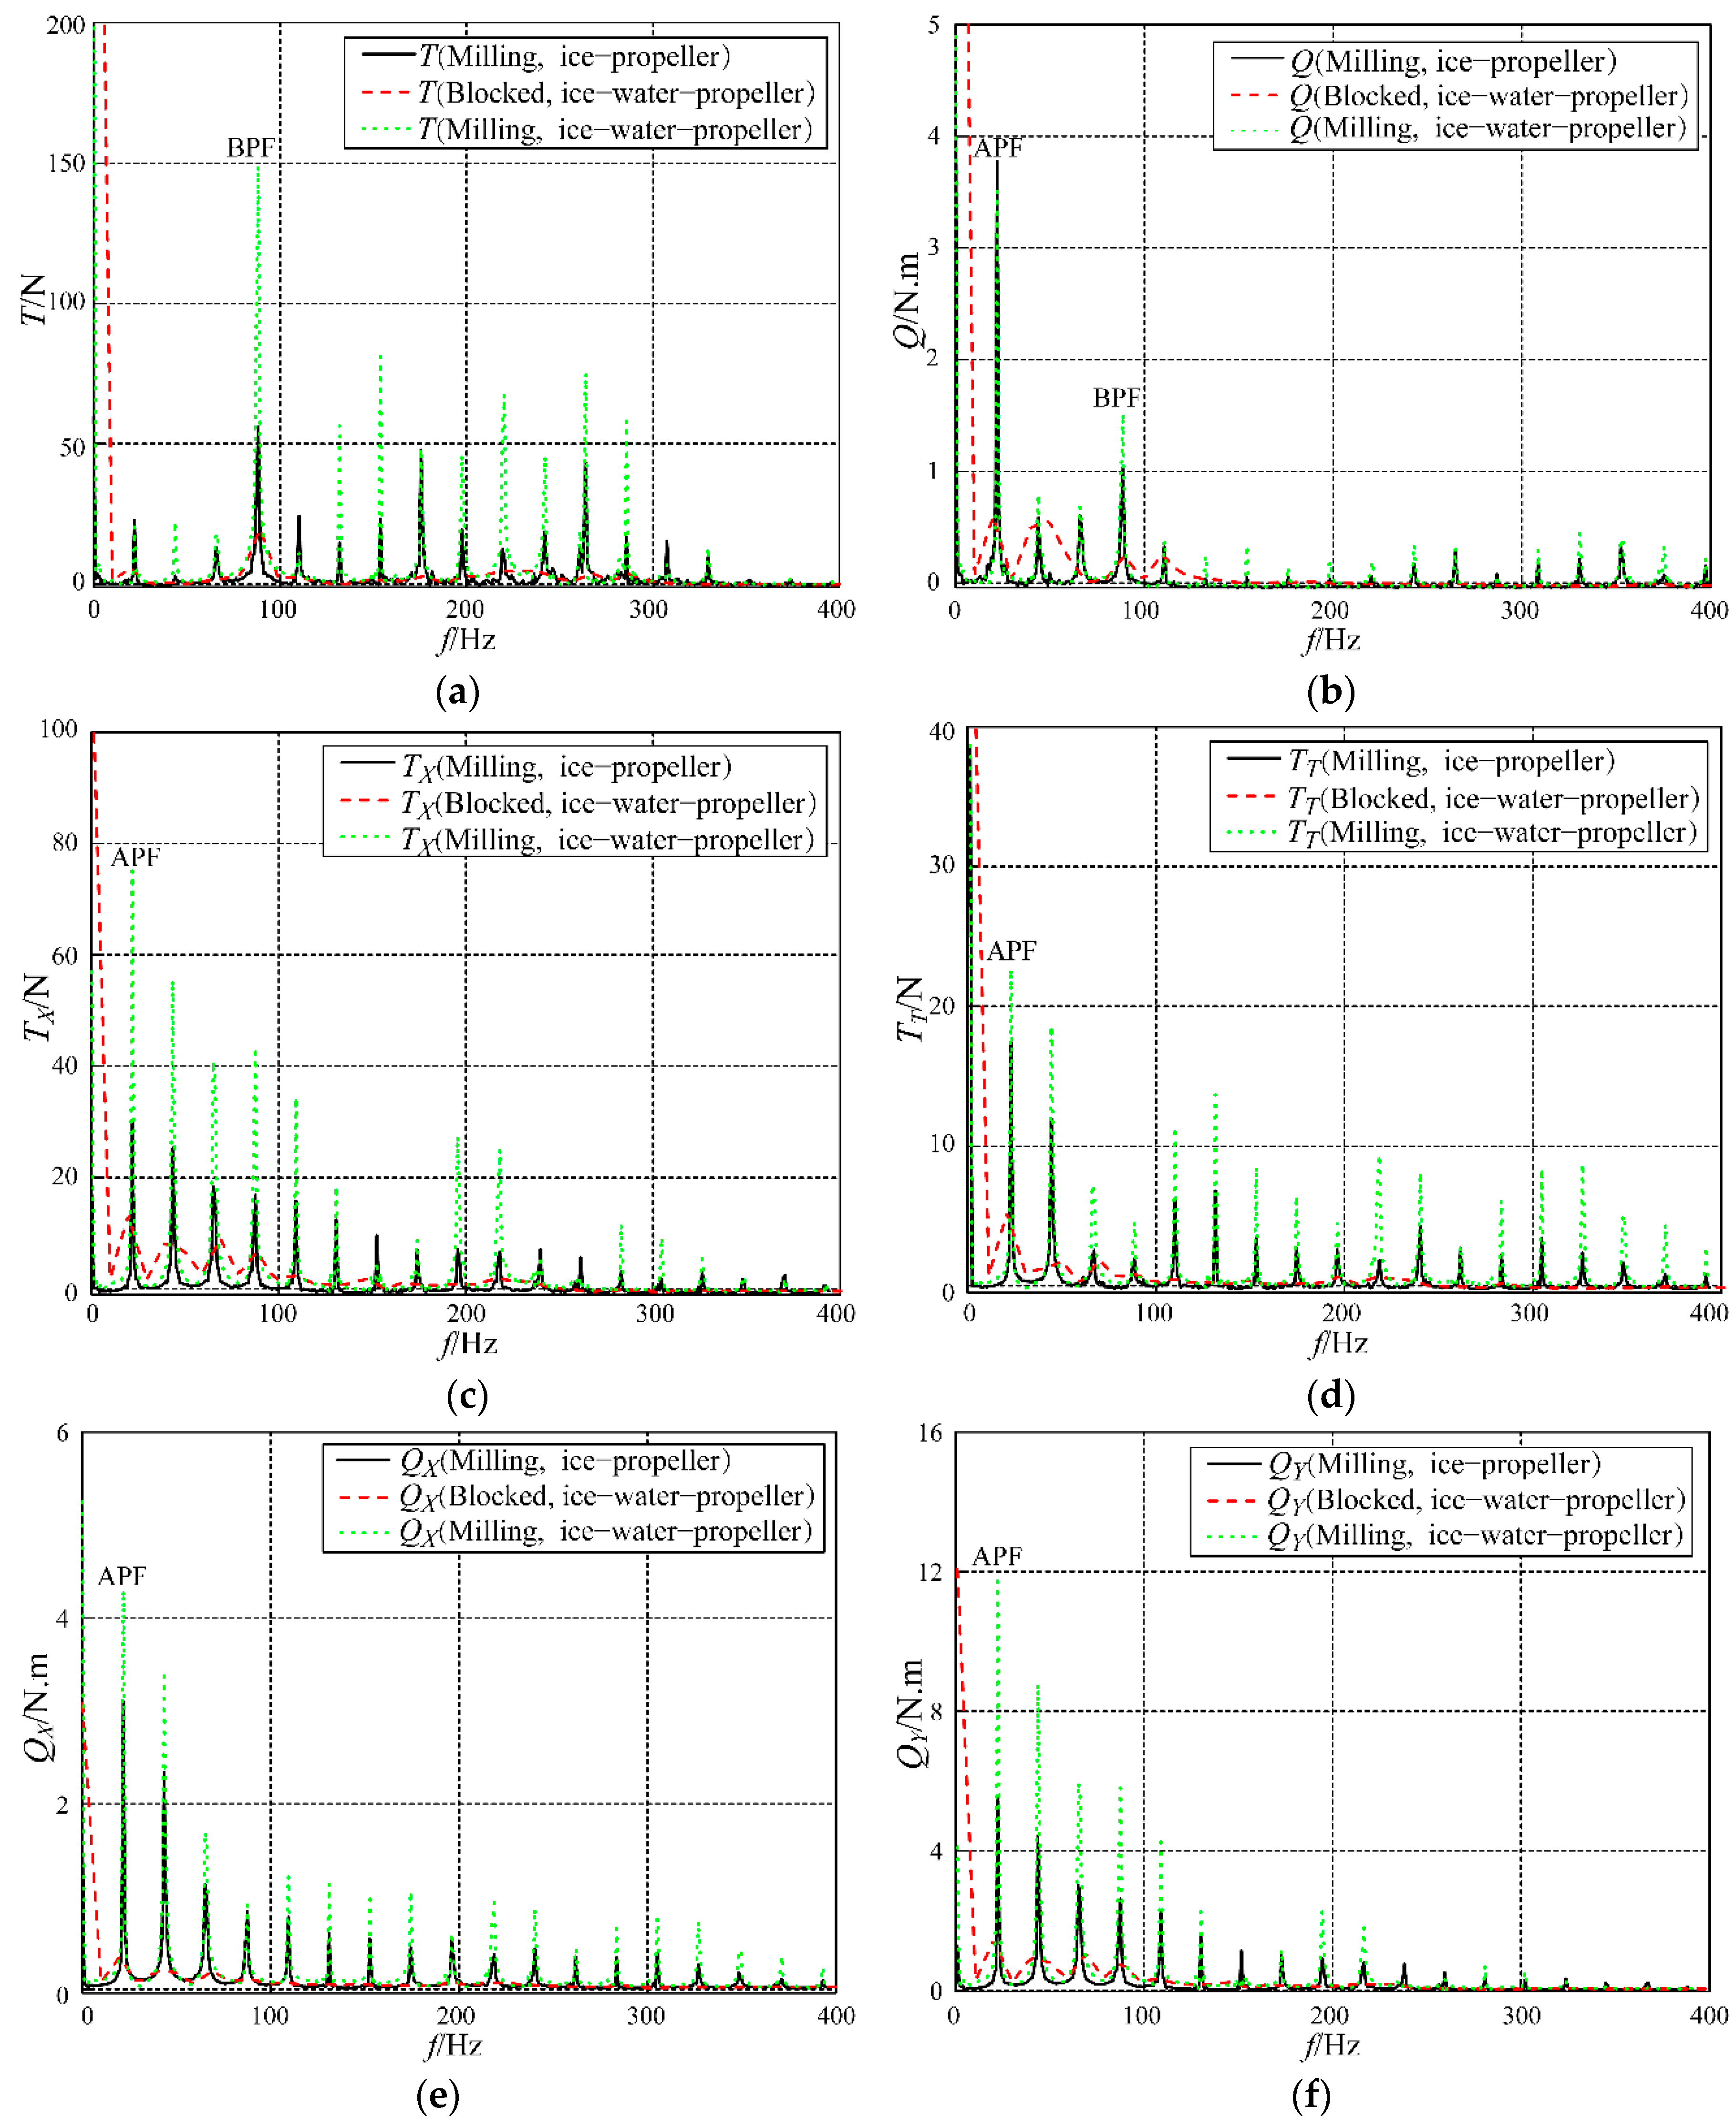
4.1. Load Characteristic Analysis

The ice-propeller milling experiments were conducted in air and water. Ice–water–propeller interaction experiments included atmospheric pressure and decompression test conditions. Therefore, considering the operating conditions four to six in Table 3 as examples, the time-domain variation curve of the propeller load and the ice-propeller milling process under ice-propeller interaction in three different environments are shown in Figure 7 and Figure 8. In Figure 7, ice-propeller milling was conducted in air, and the load on the propeller at this time is the ice milling load. Ice–water propeller denotes the blockage and milling test of ice and propeller in water, and the test environment corresponds to atmospheric pressure and decompression conditions, respectively. In Figure 8, the following three processes are depicted: milling near the ice block, leading edge milling, and full-contact milling.
During ice-propeller milling in air, shown in Figure 7 and Figure 8a, the propeller has no milling action during t = 0–1.45 s. At this time, the ice milling load of the propeller changes at approximately 0 N and 0 N∙m, with the relative movement of the ice block, axial force, and torque of the propeller increasing gradually at t = 1.45–2.25 s. From Figure 8a, it can be concluded that during this period, the ice and leading edge of the blade came in contact. With the movement of the ice and rotation of the propeller, the depth of cut and contact area of the blade gradually increased. Due to the fact that the contact area is proportional to the ice milling load [6,30], the ice milling load of the propeller gradually increases. Moreover, it was observed that the ice milling load of the propeller was positive. In t = 2.25–4.52 s, the ice milling load of the propeller had a stable periodic change, which indicated that the ice-propeller milling process had stabilized, as shown in Figure 8a. However, the axial force of the propeller appeared as alternately positive and negative, and the load in the positive direction was greater than that in the negative direction, which was mainly due to the combined action of the axial and tangential forces of the blade, whereas the propeller torque was almost entirely positive.
Regarding ice–water–propeller interaction at atmospheric pressure, Figure 7 and Figure 8b depict that there was no ice-propeller milling action during t = 0–0.52 s. However, owing to the combined influence of propeller rotation in water and the blockage effect and proximity effect of ice, the thrust and torque of the propeller changed to approximately –500 N and 15 N∙m, respectively. During gradual ice-propeller milling (t = 0.52–1.08 s), with an increase in time, propeller thrust exhibited a gradually decreasing trend, which was different from the change trend of propeller axial force in air. The main reason was that the directions of the hydrodynamic load and ice milling load on the propeller were different. During ice-propeller milling in air, the back of the blade was compressed by the ice, which produced a positive axial force, as shown in Figure 7. During ice-propeller milling in water, a negative thrust was generated owing to the pressure difference between the face and back of the blade [31], as shown in Figure 7, and the direction of the propeller thrust during the blockage stage. The distributions of the axial force of the ice milling load and thrust of the hydrodynamic load in the propeller blade section are shown in Figure 9. Propeller thrust loss was caused by the combined action of two loads. However, with the passage of time, the propeller torque presented a gradually increasing trend, which indicates that the effects of water and ice on the propeller torque are the same, that is; the presence of water increases the torque of the propeller mixed load. In t = 1.08–3.51 s, the mixed load on the propeller has a stable periodic change, but the propeller thrust is alternatively positive and negative; the negative thrust is the main component, whereas propeller torque is all positive.
Regarding ice–water–propeller interaction under the decompression condition (σ = 0.33), shown in Figure 7, it can be concluded that during the entire blockage and milling stage, the variation trend of the mixed load on the propeller with time is similar to that under atmospheric pressure, with the difference that the range of fluctuation of the hydrodynamic load on the propeller is larger in the blockage stage. In the milling stage, the range of fluctuation of the propeller thrust increased in the positive direction and decreased in the negative direction, which indicated that the occurrence of cavitation on the blade surface decreased the thrust of the hydrodynamic load on the propeller [15]. Moreover, the peak value of the propeller torque decreased. The main reason for this decrease was that the back of the blade was covered by cavitation and the drag–lift ratio of the blade increased, which deteriorated hydrodynamic performances of the blade section and consequently that of the propeller.
In addition, Figure 8c clearly shows the change in the cavitation shape on the blade surface during ice–water–propeller interaction under the decompression condition. An investigation based on Figure 8c reveals that when there is no milling action between the ice and propeller, the tip vortices near the wake of the propeller in the blocked area do not show spiral characteristics but are disturbed. The tip vortex is sucked onto the previous blade when it enters the blocked area. This is because this area has a significantly lower pressure [22,32,33], which results in a sharp explosion of the tip vortices. The sheet cavitation on the blade surface is evident when the blade exits from the blocked region; the sheet cavitation collapses rapidly with the rotation of the blade, and the tip vortex cavitation can only be observed near the tip of the blade. It is verified that the conditions for the formation of sheet cavitation are more severe than those for the tip vortex cavitation, and it is evident that the blockage effect of ice on the blade results in the formation of sheet cavitation. When the leading edge of the blade contacts ice, the ice debris after milling begins to enter the wake region of the propeller. At this time, the tip vortex becomes more unstable, forming tip vortex cavitation, sheet cavitation, and a mixture of ice debris. When the blade is subjected to full-contact milling with ice, the area of sheet cavitation on the blade surface that exits from the blocked region increases significantly, and the area of sheet cavitation increases as the blade approaches the blocked area. In Figure 8c, with an increase in axial depth of ice-propeller milling, the larger the area of sheet cavitation on the surface of the non-milling blade and the closer the blade to the blocked area, the more evident the increase in the area of sheet cavitation on the blade surface. In addition, it is observed that with an increase in axial milling depth, the filaments of the blade tip vortex become thicker. By comparing Figure 8b,c, it can be observed that the cavitation level of the propeller increases sharply owing to the decompression environment, and the most evident effect is that the tip vortex size of the propeller wake increases significantly. The propeller and mixed paraffin model ice after the test are shown in Figure 10.
In order to explore the load variation law of the ice-propeller milling condition in the above three environments, the time-domain change curves of the ice milling load and mixed load of the propeller and single blade were extracted, as shown in Figure 11 and Figure 12. A rotation cycle was selected from the load curve during the stable ice-propeller milling process.
Figure 11 shows the time-domain variation curves of the ice milling load and mixed load of the propeller under different ice-propeller milling conditions. From Figure 11a, the periodic distribution of the ice milling load of the propeller is evident when ice-propeller milling occurs in air. There are four peaks of the ice milling load in a cycle that correspond to the milling action between four blades and the ice. However, owing to the shielding effect between the blades in the ice-propeller milling process, the peak values of the axial forces of the four blades are different [8,30]. When ice-propeller milling occurs in water, the time-domain curve of the propeller thrust has several peaks, and each peak of the wave is consistent with the axial force of the ice milling load on the propeller but is opposite to the direction of the hydrodynamic load; that is, the ice milling load causes loss of propeller thrust. A comparison of the propeller thrust under atmospheric pressure and that under decompression shows that the former is greater than the latter, and the difference between the peak value of thrust under the decompression condition and peak value of the axial force of the ice milling load is smaller, which indicates severe hydrodynamic load loss at the non-contact part of the blade in the ice-blade milling process; that is, there is a serious cavitation effect, which is consistent with Figure 8c. Figure 11b shows that the presence of water significantly increases the torque of the mixed load, but the occurrence of cavitation in the decompression condition decreases the torque of the mixed load.
Figure 12 shows the load variation of a single blade over a rotation period for the ice-propeller milling condition in three environments. As observed from Figure 12a, in terms of the blade thrust, when the blade is milling ice (approximately θ = 0°), the presence of water has a significant effect on the thrust of a single blade. Generally, the variation in thrust of a single blade in water is significantly higher than that in air. The main reason is the existence of a non-continuous flow at the contact between the blade and ice, as well as turbulence and separation flow at non-contact. The crushed ice blocks and small ice pieces along with the cavitation bubbles formed a cloud behind the propeller, which further modified loading. The distributions of the blade axial force and hydrodynamic load thrust in the blade profile are shown in Figure 13. When the blade exits the ice-propeller contact area, the thrust of the blade shows a significant reverse peak due to the influence of water. This shows that the axial force produced by ice-propeller milling is opposite to the hydrodynamic direction of the blade. During ice-propeller milling, with the rotation of the blade, the axial force changes at approximately 0 N. In ice–water–propeller interaction, with the rotation of the blade, the thrust gradually decreases, and the farther the distance from the ice blocked area, the smaller the thrust of the blade. When the blade contacts with the ice again, the load increases and enters the next cycle. In Figure 12b, the presence of water causes a significant increase in the tangential force of a single blade. This is mainly because the resistances generated by the blade and water are in the same direction as that generated by ice milling, resulting in a superposition of the tangential forces. The thrust and tangential force of the blade are less than those of the atmospheric pressure owing to the influence of sheet cavitation and tip vortex cavitation in the decompression condition.
Figure 12c–e show the time-domain variation curve of the torque in three directions of a single blade. It can be observed from the figures that the torque in the Y-direction is the largest, and the torque in the Z-direction is the smallest. This is mainly because the arms of the force in the Z-direction and the force in the X-direction are the largest; therefore, the torque in the Y-direction is the largest. From the perspective of the overall change law of the curve, the presence of water causes an overall increase in the torque of a single blade. In particular, when the blade exits the ice block, the presence of water causes a significant increase in the torque of a single blade, because the force between the blade and water is in the same direction as that between the blade and ice. From the increase in the curve in the figure, the force and torque in the three directions of the blade in the decompression condition are less than those under atmospheric pressure, which is due to the influence of the cavitation on the blade surface.
In order to compare the variation law of the load on the propeller and single blade under different propeller rotational speeds, inflow velocities, and cavitation numbers, the mean value and peak value of the ice milling load and mixed load during ice-propeller milling in three different environments were extracted and compared, as shown in Figure 14.
Figure 14a,b compare the mean and peak values of the propeller thrust and torque with variable parameters in ice-propeller milling. It is evident from the figures that under the same propeller rotational speed and inflow velocity, the mean and peak values of the propeller thrust and torque are the largest when ice–water propeller milling occurs at atmospheric pressure, followed by that under the decompression condition, whereas the ice milling load of the propeller in air is the smallest. When ice-propeller milling occurs in air, the smaller the rotational speed of the propeller, the larger the mean and peak values of the propeller axial force and torque coefficients. This is mainly because the smaller the propeller rotational speed, the larger the angle of advance and contact area between the blade and ice, and the longer the axial contact length between the blade and ice. When ice-propeller milling occurs in water under atmospheric pressure, the larger the propeller rotational speed and the inflow velocity, the larger the advance coefficient, and the smaller the mean and peak values of the propeller thrust and torque coefficients, which is consistent with the actual situation. When ice-propeller milling occurs in water under the decompression condition, the smaller the number of cavitation, and the smaller the mean and peak values of the propeller thrust and torque coefficients.
Figure 14c–f compare the mean and peak values of the thrust and torque of a single blade with variable parameters in ice-propeller milling conditions. At the same propeller rotational speed and inflow velocity, the mean values of thrust, tangential force, X-direction torque, and Y-direction torque of a single blade are the largest under atmospheric pressure, and the peak values are different. When n = 19.36 r/s and V = 1.36 m/s, the peak values of the thrust, tangential force, and Y-direction torque of a single blade are the largest under the decompression condition, followed by that under atmospheric pressure, and it is the smallest in air. This is mainly because when σ = 0.44, cavitation begins to appear at the local position of the back of the blade, but it is in the first stage of development, and the lift coefficient continues to increase [34]. The peak value of the torque in the X-direction is the largest under atmospheric pressure, followed by that under the decompression condition, and the smallest value is in air. When n = 22.15 r/s and V = 1.8 m/s, the peak values of the thrust, tangential force, and X-direction torque of a single blade are the largest under atmospheric pressure, followed by that under the decompression condition, and the smallest value is in air. The peak value of the torque in the Y-direction is the largest under the decompression condition, followed by that under atmospheric pressure, and the smallest value is in air. It is concluded that the peak load of a single blade is closely related to the milling environment. Compared with the ice milling load in air, the mean and peak values of the axial force, tangential force, X-direction torque, and Y-direction torque decrease with an increase in the rotational speed of the propeller. With a decrease in the cavitation number, the mean and peak values of the thrust, tangential force, X-direction torque, and Y-direction torque decrease.

4.2. Bearing Force Analysis

In the ice-propeller contact state, owing to the particularity of the conditions, it is easy to produce a large ice load and axial excitation force, which results in problems such as propeller tail vibration, noise, erosion, and structural damage [35,36]. Therefore, the analysis of the axial excitation force of the propeller is of great significance to the design of the propulsion system (including the propeller, shaft, and main engine) of an ice-class ship. Accordingly, for operating conditions four and five in Table 3, the time-domain curves of the ice milling load in air, as well as the hydrodynamic load and mixed load in ice–water–propeller interaction under atmospheric pressure, were transformed into frequency-domain curves by fast Fourier transform (FFT). Then, the effects of the ice milling load and hydrodynamic load (separable hydrodynamic load + inseparable hydrodynamic load) on the fluctuating amplitude of the mixed load were compared and analyzed, as shown in Figure 15.
Figure 15 shows the frequency-domain variation curves of the ice milling load, hydrodynamic load, and mixed load of the propeller and single blade. Figure 15a,b illustrate that the axial force of the ice milling load and thrust of the mixed load show different amplitudes at the integral multiple of the first-order shaft frequency (rotational speed n = 22.15 r/s, 22.15 Hz), and the amplitude at the blade passage frequency (four-blade propeller, 88.6 Hz) is the most evident, which then gradually attenuates. The main fluctuating frequency of thrust in the hydrodynamic load of the propeller is the blade passing frequency (BPF), and the subsequent higher-order fluctuating amplitude can be ignored. By comparing the BPF amplitudes of the three types of thrust, it can be observed that the BPF amplitude of the thrust in the mixed load is the largest, followed by the axial force of the ice milling load, and the BPF amplitude of the thrust in the hydrodynamic load is the smallest. The results show that the axial force of the ice milling load is the main component of the increase in thrust pulsation of the mixed load on the propeller; it also shows that the presence of water intensifies thrust oscillation in the mixed load during the ice-propeller milling process.
In the frequency domain curve of the propeller torque, the main fluctuating frequencies of the torque of the ice milling load and torque of the mixed load of the propeller are the axial passing frequency (APF) and BPF, and the fluctuating amplitude of the APF is the largest. The main fluctuating frequencies of the torque of the hydrodynamic load are APF and 2APF, and the fluctuating amplitude of APF is the largest. By comparing the APF amplitudes of the three types of torques, it can be observed that the APF amplitude of the torque in the ice milling load is the largest, followed by that of the torque of the mixed load, and the APF amplitude of the torque in the hydrodynamic load is the smallest. The results show that the influence of water on the torque pulsation of the mixed load is not evident and only increases the value of the propeller torque (as shown in Figure 7 and Figure 10). Figure 15c–f show the frequency-domain variation curves of a single blade. It can be observed from the figures that the ice milling load, hydrodynamic load, and mixed load show different amplitudes at the integral multiple of the APF, and the fluctuating amplitude of the APF is the largest. By comparing the fluctuating amplitudes of the three types of loads of a single blade, it can be observed that the fluctuating amplitude of the mixed load is significantly greater than that of the ice milling load, and the fluctuating amplitude of the ice milling load is significantly greater than that of the hydrodynamic load. The results show that the fluctuating amplitude of the single-blade mixed load increases significantly in the presence of water.
According to the main fluctuating frequency determined in Figure 15, the fluctuating amplitude of the ice milling load and mixed load of the propeller and single blade under different inflow velocities, propeller rotational speeds, and cavitation numbers were extracted, and a column chart was drawn, as shown in Figure 16.
Figure 16a,b show the main fluctuating amplitudes of the propeller thrust and torque during ice-propeller milling in air, as well as those in water under atmospheric pressure and decompression conditions. The fluctuating amplitudes of the BPF and APF were selected to analyze propeller thrust and torque, respectively. It can be observed from the figures that at the same propeller rotational speed and inflow velocity, the BPF fluctuating amplitude of the propeller thrust is the largest under atmospheric pressure, followed by that under the decompression condition, and the BPF fluctuating amplitude of the propeller axial force in air is the smallest. However, there are differences in the APF fluctuating amplitude of the propeller torque, and the difference in the torque fluctuating amplitude between the three states is small at low rotational speed and low inflow velocity. With the increase in rotational speed and inflow velocity, the difference in torque fluctuating amplitude is evident. During ice-propeller milling in air, the APF fluctuating amplitude of the propeller torque is the largest, followed by that in the decompression condition, and the BPF fluctuating amplitude of the propeller torque is the smallest under atmospheric pressure. Therefore, the axial excitation force of the propeller can be effectively reduced when the ice-going ship is sailing at low speeds with low rotational speed of the propeller in the ice zone. During ice-propeller milling in air, the higher the propeller rotational speed, the smaller the peak values of the axial force and torque (Figure 12), and the larger the BPF fluctuating amplitude of the axial force and the APF fluctuating amplitude of the torque. During ice-propeller milling in water under atmospheric pressure, with an increase in propeller rotational speed and inflow velocity, the advance coefficient increases and the BPF fluctuating amplitude of the propeller thrust increases, but the peak values of propeller thrust and torque (Figure 12) as well as the APF fluctuating amplitude of the torque decrease. During ice-propeller milling in water under the decompression condition, the smaller the number of cavitation, the smaller are the peak values of the propeller thrust and torque (Figure 12), but the largerthe BPF fluctuating amplitude of the propeller thrust and the APF fluctuating amplitude of the torque.
Figure 16c–f show the main fluctuating amplitudes of the single blade thrust and torque under three milling conditions. It can be observed from the figures that at the same propeller rotational speed and inflow velocity, the APF fluctuating amplitudes of the thrust and Y-direction torque of the single blade are the largest under the decompression condition, followed by that under atmospheric pressure, and the fluctuating amplitude is the smallest in air. This shows that the occurrence of cavitation on the blade surface increases the APF fluctuating amplitudes of the thrust and torque in the Y-direction. The APF fluctuating amplitudes of the tangential force and X-direction torque of the single blade are the largest under atmospheric pressure, followed by the decompression condition, and the fluctuating amplitudes in air are the smallest. During ice-propeller milling in air, the higher the propeller rotational speed, the smaller the peak values of the single blade axial force and torque (Figure 12), but the larger the APF fluctuating amplitudes of the single blade axial force and torque. During ice-propeller milling in water under atmospheric pressure, the larger the propeller rotational speed and inflow velocity, the greater the advance coefficient, the smaller the peak values of the single blade thrust and torque (Figure 12), and the greater the APF fluctuating amplitudes of the single blade thrust and torque. During ice-propeller milling in water under the decompression condition, the smaller the number of cavitation, the smaller the peak values of the single blade thrust and torque (Figure 12), and the larger the APF fluctuating amplitudes of the single blade thrust and torque.

5. Conclusions

In this study, a test platform for ice–water propeller milling was constructed in a large circulation water channel, and an ice-propeller milling test in air and ice–water propeller milling test under atmospheric pressure and decompression conditions were conducted. The influence of water and cavitation on the load and bearing force of the propeller and single blade was analyzed. The main conclusions of this test are as follows:
(1)
In the ice–water propeller milling process, the presence of water causes propeller thrust and axial force generated by ice to act in opposite directions, and their combined action results in loss of propeller thrust. The water and ice have the same direction of influence on the propeller torque, and the combined action of the two causes the propeller torque to increase. The thrust and torque of the single-blade mixed load increased significantly in the presence of water. The occurrence of cavitation reduces the thrust and torque of the propeller and single-blade mixed load.
(2)
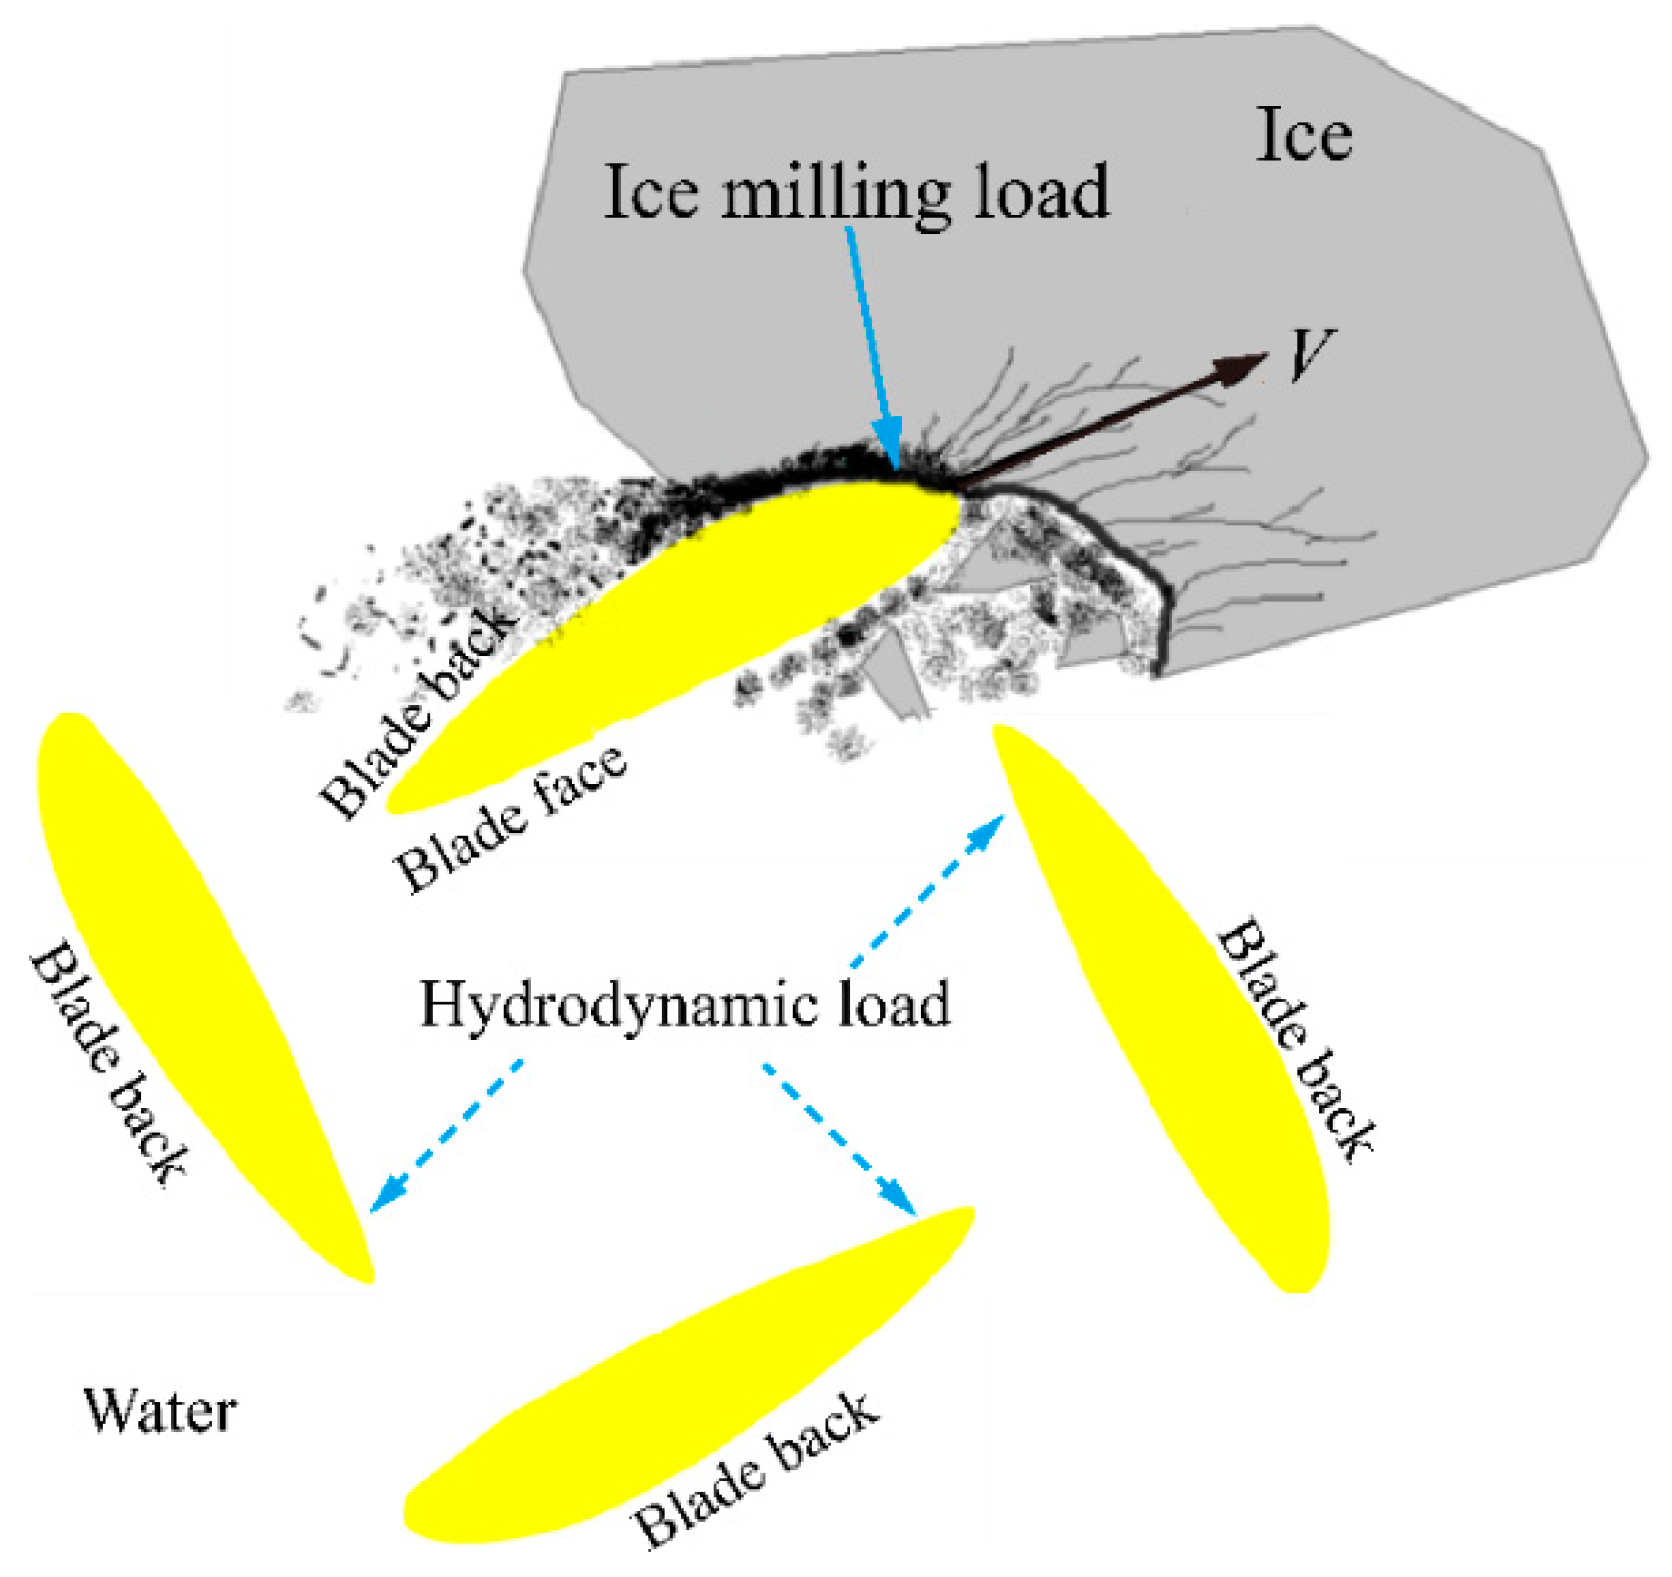
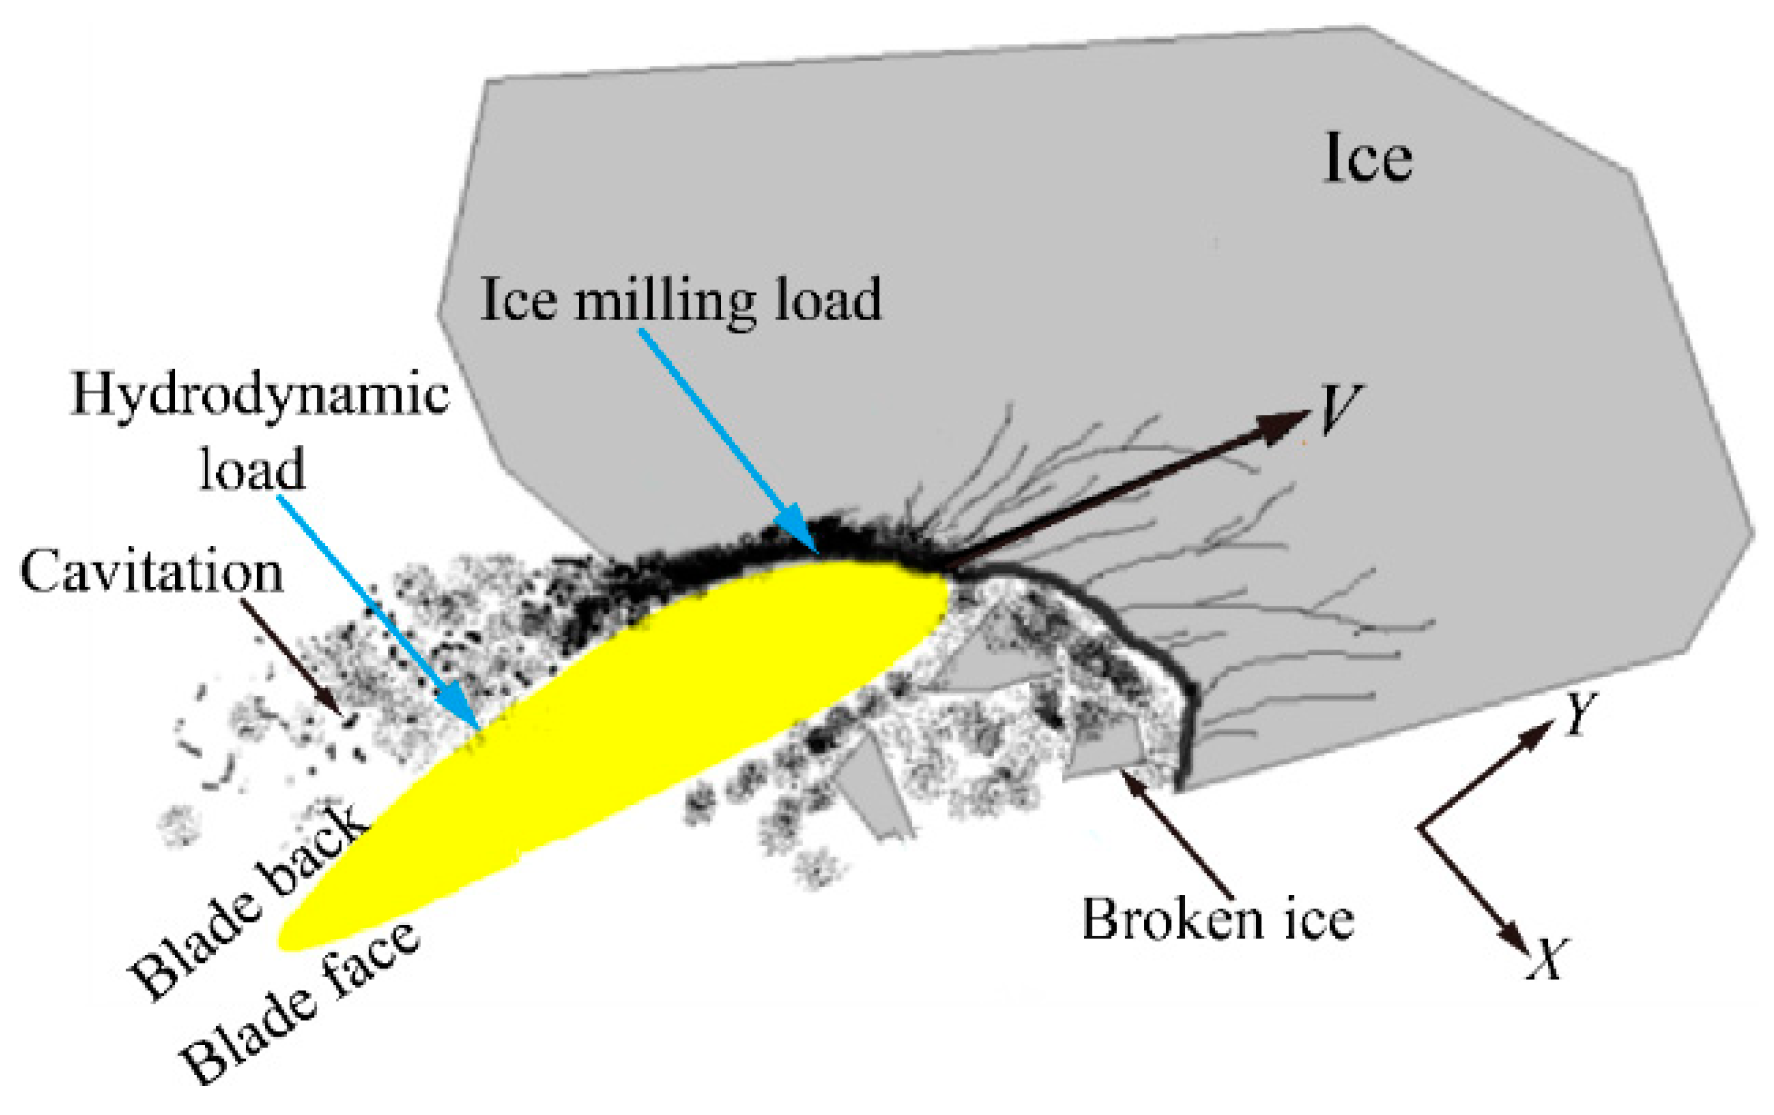
When ice, water, and propeller interact under the decompression condition, the blockage effect of the ice block generates blade sheet cavitation. The larger the axial milling depth of the ice-propeller, the larger the area of sheet cavitation on the surface of the non-milling blade, and the thicker the tip vortex filament; moreover, the closer the blade is to the blocked area, the more evident the increase in the area of sheet cavitation on the blade surface. Compared with atmospheric pressure, the decompression environment causes the blade tip vortex to collapse in the blocked area, and the tip vortex size of the propeller wake in the blocked area evidently increased.
(3)
In the analysis of the bearing forces of the propeller and blade, the presence of water causes the fluctuating amplitudes of propeller thrust and blade bearing force to increase significantly, but it has no evident effect on the fluctuating amplitude of the torque under mixed load of the propeller. Cavitation results in an increase in thrust fluctuating amplitude and a decrease in tangential force fluctuating amplitude of the single blade.
(4)
During the ice-propeller milling in air, the higher the propeller rotational speed, the smaller the peak values of the axial force and torque of the propeller and single blade, but the greater the fluctuating amplitudes of the axial force and torque of the propeller and single blade. At atmospheric pressure, with an increase in the advance coefficient, the peak values of the thrust and torque of the propeller and single blade as well as the fluctuating amplitude of the propeller torque decrease, whereas the fluctuating amplitudes of the propeller thrust and the single-blade thrust and torque increase. Under decompression conditions, the smaller the cavitation number, the smaller the peak values of the thrust and torque of the propeller and single blade, but the larger the fluctuating amplitudes of the thrust and torque of the propeller and single blade.
The results of this study provide experimental guidance and technical support for improving comprehensive designs considering propeller efficiency and ice load-carrying capacity and improving the safety and speed of ice-going ships. In this experiment, the ice asymptotic motion was constrained, and the degree of freedom of the ice was not released. In the future, an experimental study on the load and cavitation of the propeller will be performed when the ice in free motion is close to the propeller owing to the suction of the propeller.

Author Contributions

Conducted all experiments, P.X. and C.W.; designed the experiments and wrote the manuscript, P.X.; data curation, L.Y. All authors discussed continuously and contributed to the writing of the manuscript. All authors have read and agreed to the published version of the manuscript.

Funding

This research was funded by the National Natural Science Foundation of China (Grant Numbers 51809055 and 51909043) and China Postdoctoral Science Foundation (Grant No. 2020M681082).

Institutional Review Board Statement

Not applicable.

Informed Consent Statement

Not applicable.

Data Availability Statement

The data presented in this study are available upon request from the corresponding author.

Conflicts of Interest

The authors declare no conflict of interest.

References

  1. Kinnunen, A.; Tikanmäki, M.; Heinonen, J.; Koskinen, P. Dynamic ice contact load model for azimuthing thrusters. Ships Offshore Struct. 2019, 14, 890–898. [Google Scholar] [CrossRef]
  2. Matsui, S.; Uto, S.; Yamada, Y.; Watanabe, S. Numerical study on the structural response of energy-saving device of ice-class vessel due to impact of ice block. Int. J. Nav. Architect. Ocean Eng. 2018, 10, 367–375. [Google Scholar] [CrossRef]
  3. Walker, D.; Bose, N.; Yamaguchi, H. Influence of Cavitation on Canadian R-Class Propellers. J. Offshore Mech. Arct. 1995, 116, 185–189. [Google Scholar] [CrossRef]
  4. Bose, N. Ice Blocked Propeller Performance Prediction Using a Panel Method. Trans. RINA 1996, 138, 213–226. [Google Scholar]
  5. Morin, A.; Caron, S.; Neste, R.V.; Edgecombe, M.H. Field monitoring of the ice load of an icebreaker propeller blade using fiber optic strain gauges. In Symposium on Smart Structures and Materials; International Society for Optics and Photonics: San Diego, CA, USA, 1996; pp. 427–438. [Google Scholar]
  6. Moores, C.; Veitch, B.; Bose, N.; Jones, S.J.; Carlton, J. Multi-component blade load measurements on a propeller in ice. Soc. Nav. Archit. Mar. Eng. Trans. 2002, 110, 169–188. [Google Scholar]
  7. Searle, S.; Veitch, B.; Bose, N. Experimental investigation of a highly skewed propeller in ice. Offshore Mech. Arct. Eng. 2001, 123, 191–197. [Google Scholar] [CrossRef]
  8. Wang, J.Y.; Akinturk, A.; Bose, N.; Jones, S.J.; Song, Y.Y.; Chun, H.H.; Kim, M.C. Experimental study on a model azimuthing podded propulsor in ice. J. Mar. Sci. Technol. 2008, 13, 244–255. [Google Scholar] [CrossRef]
  9. Karulina, M.M.; Karulin, E.B.; Belyashov, V.A.; Belov, I.M. Assessment of Periodical Ice Loads Acting on Screw Propeller during its Interaction with Ice. In Proceedings of the International Conference and Exhibition on Performance of Ships and Structures in Ice, Banff, AB, Canada, 20–23 July 2008; pp. 1–7. [Google Scholar]
  10. Brouwer, J.; Hagesteijn, G.; Bosman, R. Propeller-ice impacts measurements with a six-component blade load sensor. In Proceedings of the Third International Symposium on Marine Propulsorssmp, Tasmania, Australia, 5–8 May 2013; pp. 47–54. [Google Scholar]
  11. Khan, A.G.; Hisette, Q.; Streckwall, H.; Liu, P.F. Numerical investigation of propeller-ice interaction effects. Ocean Eng. 2020, 216, 107716. [Google Scholar] [CrossRef]
  12. Huang, Y.; Wang, D.S.; Sun, J.Q. Model test of propeller-ice milling process under typical navigation mode of polar ships. J. Exp. Mech. 2020, 35, 1003–1013. (In Chinese) [Google Scholar]
  13. Wu, S.; Song, M.T.; Rui, W. Application of high-speed photography and hydrodynamic synchronous measurement in model tests of ice-propeller collision. J. Vib. Shock 2021, 40, 161–166. (In Chinese) [Google Scholar]
  14. Atlar, M.; Prasetyawan, I.; Aryawan, W.D.; Wang, D.Z.; Sasaki, N. Cavitation in Ice-Milling with a Podded Propulsor. In Proceedings of the 4th Asme/jsme Joint Fluids Summer Engineering Conference, Honolulu, HI, USA, 6–10 July 2003; pp. 269–278. [Google Scholar]
  15. Sampson, R.; Atlar, M.; Sasaki, N. Propeller Ice Interaction-Effect of Blockage Proximity. In Proceedings of the First International Symposium on Marine Propulsors smp’09, Trondheim, Norway, 22–24 June 2009. [Google Scholar]
  16. Sampson, R.; Atlar, M.; St John, J.W.; Sasaki, N. Podded propeller ice interaction in a cavitation tunnel. In Proceedings of the Third International Symposium on Marine Propulsors SMP, Launceston, TAS, Australia, 5–8 May 2013; pp. 34–46. [Google Scholar]
  17. Huisman, T.J.; Bose, R.W.; Brouwer, J.; Hagesteijn, G.; de Koning Gans, H.J. Interaction between Warm Model Ice and a Propeller. In Proceedings of the ASME 2014 33rd International Conference on Ocean, Offshore and Arctic Engineering, San Francisco, CA, USA, 8–13 June 2014; pp. 8–19. [Google Scholar]
  18. Guo, C.Y.; Xu, P.; Zhao, D.G.; Luo, W.Z.; Song, M.Y. Test of contact loads during propeller-ice milling process. J. Harbin Eng. Univ. 2018, 39, 1172–1178. (In Chinese) [Google Scholar]
  19. Wang, J.; Akinturk, A.; Bose, N. Numerical Prediction of Propeller Performance during Propeller-Ice Interaction. Mar. Technol. 2009, 46, 123–139. [Google Scholar] [CrossRef]
  20. Wang, F.; Zou, Z.J.; Zhou, L.; Wang, Y.; Yu, H.; Zhang, H.H. Numerical simulation of ice milling loads on propeller blade with cohesive element method. Brodogradnja 2019, 70, 109–128. [Google Scholar] [CrossRef]
  21. Ye, L.Y.; Wang, C.; Chang, X.; Zhang, H.Y. Propeller-ice Contact Modeling with Peridynamics. Ocean Eng. 2017, 139, 54–64. [Google Scholar] [CrossRef]
  22. Ye, L.Y.; Guo, C.Y.; Wang, C.; Wang, C.H. Prediction of the dynamic pressure distribution on a propeller blade under ice milling. Ocean Eng. 2019, 188, 106284. [Google Scholar] [CrossRef]
  23. Wang, C.; Xiong, W.P.; Chang, X.; Ye, L.Y.; Li, X. Analysis of variable working conditions for propeller-ice interaction. Ocean Eng. 2018, 156, 277–293. [Google Scholar] [CrossRef]
  24. Yang, D.B.; Ji, S.Y. Analysis of sea ice milling with propeller based on coupled DEM-FEM model. Ocean Eng. 2021, 39, 134–143. (In Chinese) [Google Scholar]
  25. Wang, C.; Hu, X.H.; Tian, T.P.; Guo, C.Y.; Wang, C.H. Numerical simulation of ice loads on a ship in broken ice fields using an elastic ice model. Int. J. Nav. Archit. Ocean Eng. 2020, 12, 414–427. [Google Scholar] [CrossRef]
  26. Tian, Y.F.; Huang, Y. Non Frozen Model Ice Preparation Method with Columnar Texture Features: China. CN110779250B. 25 September 2020. Available online: https://t.cnki.net/kcms/detail?v=kxaUMs6x74I2jr5WTdXti3zQ9F92xu0rndOfNvsE3i8yuDfLlQZcrV5SKNhOn05gPqicRgPRmJZw8tvYrI9oIX4eJphCsV8&uniplatform=NZKPT (accessed on 1 December 2021).
  27. Timco, G.W.; Weeks, W.F. A review of the engineering properties of sea ice. Cold Reg. Sci. Technol. 2010, 60, 107–129. [Google Scholar] [CrossRef]
  28. Waal, R.D.; Bekker, A.; Heyns, P.S. Indirect load case estimation for propeller-ice moments from shaft line torque measurements. Cold Reg. Sci. Technol. 2018, 151, 237–248. [Google Scholar] [CrossRef] [Green Version]
  29. Williams, F.M.; Spencer, D.; Mathews, S.T.; Bayly, I. Full Scale trials in Level Ice with Canadian R-Class Icebreaker. Soc. Nav. Archit. Mar. Eng. Trans. 1992, 100, 293–313. [Google Scholar]
  30. Xiong, W.P.; Wang, C.; Wang, C.H.; Ma, Q.W.; Xu, P. Analysis of shadowing effect of propeller-ice milling conditions with peridynamics. Ocean Eng. 2020, 195, 106591. [Google Scholar] [CrossRef]
  31. Wang, C.; Sun, S.X.; Chang, X.; Ye, L.Y. Numerical simulation of hydrodynamic performance of ice class propeller in blocked flow–using overlapping grids method. Ocean Eng. 2017, 141, 418–426. [Google Scholar]
  32. Guo, C.Y.; Xu, P.; Wang, C.; Wang, L.Z.; Zhang, C.S. Influence of Ice Size Parameter Variation on Hydrodynamic Performance of Podded Propulsor. China Ocean Eng. 2020, 34, 30–45. [Google Scholar] [CrossRef]
  33. Wu, S.; Rui, W.; Zeng, Z.B. Investigation on the characteristics of cavitation excited force of propeller in ice block condition. Ship Sci. Technol. 2019, 41, 21–26. [Google Scholar]
  34. Sheng, Z.B.; Liu, Y.Z. Cavitation phenomenon on leaf cut surface and its effect on performance. In Ship Principle; Shanghai Jiaotong University Press: Shanghai, China, 2013; pp. 68–70. (In Chinese) [Google Scholar]
  35. Polić, D.; Ehlers, S.; Æsøy, V. Propeller torque load and propeller shaft torque response correlation during ice-propeller interaction. J. Mar. Sci. Appl. 2017, 16, 1–9. [Google Scholar] [CrossRef]
  36. There’s Something Wrong with the Second Boat! A Major Breakthrough in Russia’s Arctic Energy Strategy. Available online: http://www.eworldship.com/html/2021/ship_inside_and_outside_0124/167393.html (accessed on 24 January 2021).
Figure 1. Propeller model.
Applsci 11 11578 g001
Figure 2. Mixed paraffin model ice.
Applsci 11 11578 g002
Figure 3. Fracture process of mixed paraffin model ice.
Applsci 11 11578 g003
Figure 4. Ice force–displacement curve of mixed paraffin model ice.
Applsci 11 11578 g004
Figure 5. General layout of test platform for ice-propeller milling.
Applsci 11 11578 g005
Figure 6. Different rotation positions of the key blade and the coordinate system.
Applsci 11 11578 g006
Figure 7. Time-domain curves of propeller load under ice-propeller interaction in different environments: (a) T; (b) Q.
Applsci 11 11578 g007
Figure 8. Milling process of ice and propeller in air and water: (a) Ice-propeller milling test (in air); (b) Ice–water–propeller milling test (atmospheric pressure); (c) Ice–water–propeller milling test (σ = 0.33).
Applsci 11 11578 g008
Figure 9. Load distribution diagram for the four blade sections of the propeller.
Applsci 11 11578 g009
Figure 10. Propeller and mixed paraffin model ice after the test.
Applsci 11 11578 g010
Figure 11. Time-domain variation curves of the propeller load in different milling environments: (a) T; (b) Q.
Applsci 11 11578 g011
Figure 12. Time-domain variation curves of single-blade load in different milling environments: (a) TX; (b) TT; (c) QX; (d) QY; (e) QZ.
Applsci 11 11578 g012aApplsci 11 11578 g012b
Figure 13. Schematic diagram of load distribution when blade profile is milling ice.
Applsci 11 11578 g013
Figure 14. Mean and peak values of propeller and single blade loads with different parameters: (a) KT; (b) KQ; (c) KTX; (d) KTT; (e) KQX; (f) KQY.
Applsci 11 11578 g014aApplsci 11 11578 g014b
Figure 15. Frequency domain curves of propeller and blade bearing force: (a) T curve in frequency domain; (b) Q curve in frequency domain; (c) TX curve in frequency domain; (d) TT curve in frequency domain; (e) QX curve in frequency domain; (f) QY curve in frequency domain.
Applsci 11 11578 g015
Figure 16. Fluctuating amplitudes of propeller and single-blade bearing force with different parameters: (a) fluctuating amplitude of T; (b) fluctuating amplitude of Q; (c) fluctuating amplitude of TX; (d) fluctuating amplitude of TT; (e) fluctuating amplitude of QX; (f) fluctuating amplitude of QY.
Applsci 11 11578 g016aApplsci 11 11578 g016b
Table 1. Principal dimensions of propeller model.
Diameter/m0.25λ1:16.46Number of Blades4
Rake/°10Hub ratio0.368Pitch ratio (0.7R)0.775
Blade area ratio0.699MaterialAluminumDirection of rotationRight
Table 2. Operating conditions of full-scale ship.
Cavitation Number of Rotational Speed at 0.8RAdvance Coefficient JFull-Scale Propeller Rotational Speed ns (r/s)Full-Scale Ship Speed Vs (m/s)
σ = 0.330.3251623.61
σ = 0.440.2811412.72
Table 3. Test operating conditions.
Test ConditionsDepth of Cut h/DCavitation Number of Rotational Speed at 0.8RIce Moving Speed V (mm/s)Advance Coefficient JRotational Speed nm (r/s)Inflow Speed
Vm (m/s)
Case 11/16Air30019.360
Case 21/16Atmospheric pressure300.28119.361.36
Case 31/16σ = 0.44300.28119.361.36
Case 41/16Air30022.150
Case 51/16Atmospheric pressure300.32522.151.8
Case 61/16σ = 0.33300.32522.151.8
Publisher’s Note: MDPI stays neutral with regard to jurisdictional claims in published maps and institutional affiliations.

