1. Introduction
The impact of social networks in educational environments has been the subject of extensive research in recent years. For example, in [
1], a theoretical framework was suggested for a better connection between students’ life inside and outside school. They proposed the use of new technologies to help teach science concepts in the classroom. In this paper, we adapt this concept by incorporating online social networks, student’s communication tool of choice, into the classroom.
The use of new technologies in the classroom is supported by teachers’ improved perceptions of the use of ICTs (Information and Communication Technologies) in class [
2]. The first cohort of STEM (Science, Technology, Engineering and Mathematics) teachers described ICTs as distractive and ineffective technologies for teaching and learning. However, the second cohort (6 years after the first cohort) indicated that teachers did not see ICT as threatening, but perceived it as an instrument for progressive education.
Indisputably, most students use online social networks. For example, a study conducted by [
3] already showed that 88% of students used online social networks. A total of 282 K–12 students aged 12 to 18 years participated in that study. Moreover, the study was conducted in rural high schools, where the use of new technologies is less widespread than in urban areas [
4]. These authors highlight the slow diffusion of advanced technologies to rural areas. However, the high use rate found in rural areas in the study demonstrates the pervasiveness of this type of technologies.
Among the many benefits of using social networks, Clark et al. [
5] highlight the fact that promoting connection may benefit users by helping them meet needs for acceptance and belonging. Moreover, promoting connection among users helps to create strong relationships which are related to the improvement of self-esteem. In [
6], the authors provide some insights on how individuals co-produce their response through social interactions with others. This is especially useful in educational settings, and this approach could be used to examine coalition building, which may play an indirect role in shaping the social networks that influence the collective response. As stated in [
7], social networks and relationships are crucial, because they provide a sense of belongingness, recognition, motivate collective action, and are all a result of cognitive functions.
Tess, in his review of the role of social media in higher education classes [
8], finds that it is currently the educators themselves and not the institutions that decide to integrate social media in instruction. K–12 education is, however, a different scenario. There are many high schools which do not allow access to popular social media sites such as Twitter, Facebook, etc., on school networks. Nevertheless, access is permitted to some social networking sites oriented to education, as in the case of Edmodo, Schoology, etc. These last platforms are oriented to the content and academic life of the students, with calendars, assignments, grades, online material, etc. Therefore, they are closer to learning content management systems (LCMS) than to SNSs (social network sites). In [
8], the authors also find that more evidence needs to be gathered on integrating social media into the curriculum. Because there is no authoritative yes or no, its focus is to analyze social media use to promote active learning, thus working with the content (again, as happens with LCMSs). Consequently, the question to be answered is: “Is social media an efficient and effective software solution for higher education classrooms?” The authors state that “The essential characteristic of effective studies is that they focus on a school-based intervention such as the use of social media in the classroom”. The research study presented in this paper aims to provide a positive response to that question.
A PRSN is indeed an SNS. A widely accepted definition of a social network site (SNS) is the following: “Platform which allows users to share content, interact and create communities of similar interests” [
9]. A positive reinforcement social network (PRSN) is defined in [
3] as a social network which allows users to interact with each other and their environment, receiving a reward based on the type and number of actions performed/tracked through/by the system.
Positive reinforcement has been proven helpful in educational settings [
10], but the integration in social networks and the effects on teenage students have hardly ever been analyzed. The main objective of this study is to analyze online social interactions on PRSNs in order to find out if it has a positive impact on classroom participation and students’ self-perceptions of their own social skills. To this end, we have implemented BeingExample as a new educational tool based on PRSN concepts [
3], that has been assessed in a real educational setting.
The purpose of the study described in this article can be summarized in the following research questions:
So far, most research in this field has been conducted with university students. Few studies have been conducted with high school students. However, there are studies on social media used by high school students, such as [
11,
12] or [
13], which highlight the extensive use of these platforms among teenagers. As will be shown in the next section, new technologies may have a positive impact on educational environments, but again, most of these studies are limited to university students. University study is a choice, and students believe it enhances their future opportunities. However, some high school students study as an obligation (usually due to education laws or because of parental pressure). Therefore, improving high school students’ personal attitudes is a challenge that we aim to tackle by applying PRSN in a real classroom, especially concerning the improvement of students’ participation and perception of their own skills.
The rest of the paper is organized in the following sections:
Section 2 presents the impact of social networks in the classroom.
Section 3 presents the PRSN developed. In
Section 4, we describe the empirical study carried out to prove the benefits of the proposal.
Section 5 shows the results of the evaluation and the implications of the research study. Finally,
Section 6 presents some conclusions and final remarks.
2. The Impact of New Technologies in Education
Before starting a review of the related literature, there are a number of factors that are key to understanding the impact of new technologies on education. Academic outcomes are a key element when measuring the impact on educational environments. Measuring every element that may be considered an academic outcome is not an easy task.
An important factor in education is classroom participation. A possible definition of student engagement helps to understand this concept. Student engagement may be seen as the willingness to participate in routine school activities and follow teachers’ directions in class. As is the case with student motivation, classroom participation also overlaps with student engagement.
The structure of this Section is as follows: Firstly, we present works related to how new technologies are used to enhance, engage and improve educational environments. Secondly, we outline the research works related to online social interactions in education, that have helped us to set up or guide the choice and implementation of the PRSN used to accomplish the purpose of this study.
2.1. Impact of ICT in Education
Most of the goals of the works presented below are related to enhancing, engaging and improving education through new technologies.
In [
14], the authors describe a semester-long experimental study to determine whether Twitter can have a positive impact on college student grades and engagement. A sample of 125 students was considered for analysis: 70 of them took part in the experimental group, and 55 in the control group. Participants in the experimental group used Twitter for academic and co-curricular discussions. An interesting piece of data is that none of the students in the control group reported using Twitter during the study period. The percentage of students sending tweets and the number of tweets sent using the Twitter Application Programming Interface (API) were analyzed. An average of 48.20 messages were sent per student during the study. Following the data analysis, the experimental group had better grades and a greater increase in engagement than the control group. Therefore, using Twitter as an educational tool can have a positive impact on educational environments and help engage students, and motivate teachers into a more participating role.
Another work on social networks is presented in [
15], which focuses on how the use of Facebook is related to academic performance. The sample group was comprised of 1839 college students. The relationship between multiple measures of frequency of use, participation in Facebook activities, time spent preparing for class and the actual GPAs were the factors taken into account during the research. It is worth noting that using Facebook for collecting and sharing information was a positive predictor of the outcomes, but using it for socializing was a negative predictor. The most interesting finding was that time spent on Facebook was strongly and negatively related to GPA, while weakly related to the time spent preparing the class.
In [
16], the authors aimed to use ICT at a flexible learning center to engage students whose academic failure had placed them outside the mainstream educational system. They used new technologies to enhance students’ engagement with the subject of science. As a result, young disengaged people showed a revitalized interest in the subject.
Regarding STEM subjects, there are many works analyzing the impact of new technologies. Two examples are the works by Lamb and Perdian.
In the first case, in [
17], the authors use online chemistry simulations in a chemistry high school class in order to provide discussion of the factors that may affect students’ academic outcomes. As main findings, there are statistically significant effects between control and experimental groups, highlighting that online simulations promote increased understanding.
On the other hand, in [
18], the authors use an online homework system to identify student performance. They are able to identify two clear groups: under-performing students who are good candidates for tutoring programs, and over-performing students who should be targeted in a different way.
Technology was used to improve students’ perceptions of the subject of electricity [
19]. The use of interactive activities, visual experiments and animations was effective in overcoming students’ initial negative perceptions about the subject.
Ways to engage students within the field of engineering are explored in [
20]. The study indicates that using technology helps students to better understand aspects of engineering design that are more qualitative than quantitative.
In [
21], the authors use technology to stimulate students’ interest in STEM careers. They integrate two technologies—geographic information systems and information assurance—to stimulate students’ interest in STEM careers. After the experiment, students showed a 9% increase in dispositions about STEM careers. Those who participated in an internship experience presented an additional growth of 10%.
The objective of [
22] was to enhance students’ environmental awareness and activism. Students constructed multimedia items and shared them through the use of an online social network. Results showed that awareness and perceived need for activism increased significantly throughout the experiment. Awareness and perceived need for activism were measured using different data: blog posts, online conversations, video projects, and the six Americas survey.
iPads were used as data collectors, references and engagement tools in [
23]. Their purpose was to stimulate engagement by using new technologies. It was found that students who used the mobile technology to explore nature stayed engaged throughout the experience.
2.2. Online Social Interactions in Education
In this subsection, we present the research works that have helped in one way or another to focus this research. Some of them have helped to set up platform features, meanwhile others have helped to support the decision of using PRSNs, in order to improve and analyze students’ online social interactions.
The relationship between online participation and e-learning performance is analyzed in [
24]. Learning style is one of the predictors taken into account when analyzing learning performance. A model is proposed and tested for the relationship between learning style and e-learning performance, and the moderating effects of prior knowledge. Data about online participation were extracted from students’ records (a function offered by the e-learning platform used). Evaluation was grounded in several indicators, such as: number of discussion board posts, number of file views, session duration, and total number of pages read. This participation was categorized into two classes: active participation and passive participation. It is worth highlighting that the results show learning style predicts performance through online participation, although other types of learning styles with online participation do not affect the performance.
In [
25], the authors present a data mining approach for improving the prediction of a student’s final academic performance. They use participation indicators, including quantitative, qualitative, and social items for this prediction. The three different types of analytic data based on forum activity are: (1) quantitative information, statistical information; (2) qualitative information, evaluation or scores for content given by the teacher; (3) social network information, relationships between students. The research finds that two quantitative measures are the best predictors of students’ final results. These two items are: the number of messages (posts or replies) sent, and the number of words written. In addition, the two social network measures were the most important for predicting final student performance.
The intention of the study conducted by [
26] was to obtain a general view of student’s expectations and experiences while using e-learning platforms. In 60% of the subjects, the students interviewed claimed to use e-learning platforms occasionally or frequently. ‘What aspects of e-learning do students consider important for their learning achievements and course satisfaction?’ Expectations and students’ achievement goals were positive predictors of success. The instructor’s expertise and involvement was the best predictor of subject satisfaction and learning achievement. This research highlights the key characteristics of an e-learning course and learning behavior for performance, achievement, and satisfaction. According to students, the instructor played a vital role, and counseling and support was especially important in order to facilitate the construction of knowledge, media competence and satisfaction.
Based on a 36-question questionnaire about motivation in e-learning, the authors in [
27] tried to identify the successful aspects within e-learning. Two of the most important barriers found during e-learning are the progressive discouragement process and the lack of real commitment to the educational process. The most interesting findings of this research are that the way content is presented improves grades and levels of satisfaction and that integrating a motivational system (equalitarian) increases engagement and retention. Accessibility was also found to be a key point.
Using digital textbook learning analytics as a starting point, some similarities or relations may be established when relating it to PRSN use in educational environments. In [
28], the authors find that textbook engagement is related to better course outcomes. This is relevant to our study, since PRSN use is related to students’ outcomes. In addition, format is not important [
29], ‘getting students to read is of utmost importance’ may be considered, as: getting students to participate in the platform may be a key to improving their outcomes in class.
In [
30], the authors highlight that promoting strategies/interactions and guiding them in distance learning settings may be necessary to improve learning outcomes. After reviewing the impact of new technologies on education, it may be concluded that monitoring this impact may help to keep it positive and eliminate the negative effects. Moreover, the latest developments in education have led to the use of academic analytics to predict and measure students success [
31]. Therefore, this impact should be tracked by collecting students’ data and interactions with ICT platforms. PRSNs monitor students’ online social interactions, which may help measure the impact on classroom participation and students’ self-perceived social skills.
3. The Being Example Platform
BeingExample is a PRSN developed to accomplish the main goals of this research. PRSNs have a number of additional features to the existing social networks, such as controlling the actions and their respective awards. Positive reinforcement is specified in a virtual currency (which may be supported by real currency) and virtual points (these points do not need financial support). Virtual points may be accumulated by users and eventually exchanged for real benefits. An action is described as good, if the system gives a reward when users participate in the action. This study uses positive reinforcement through points, which can be exchanged, or which can be used to gain advantages.
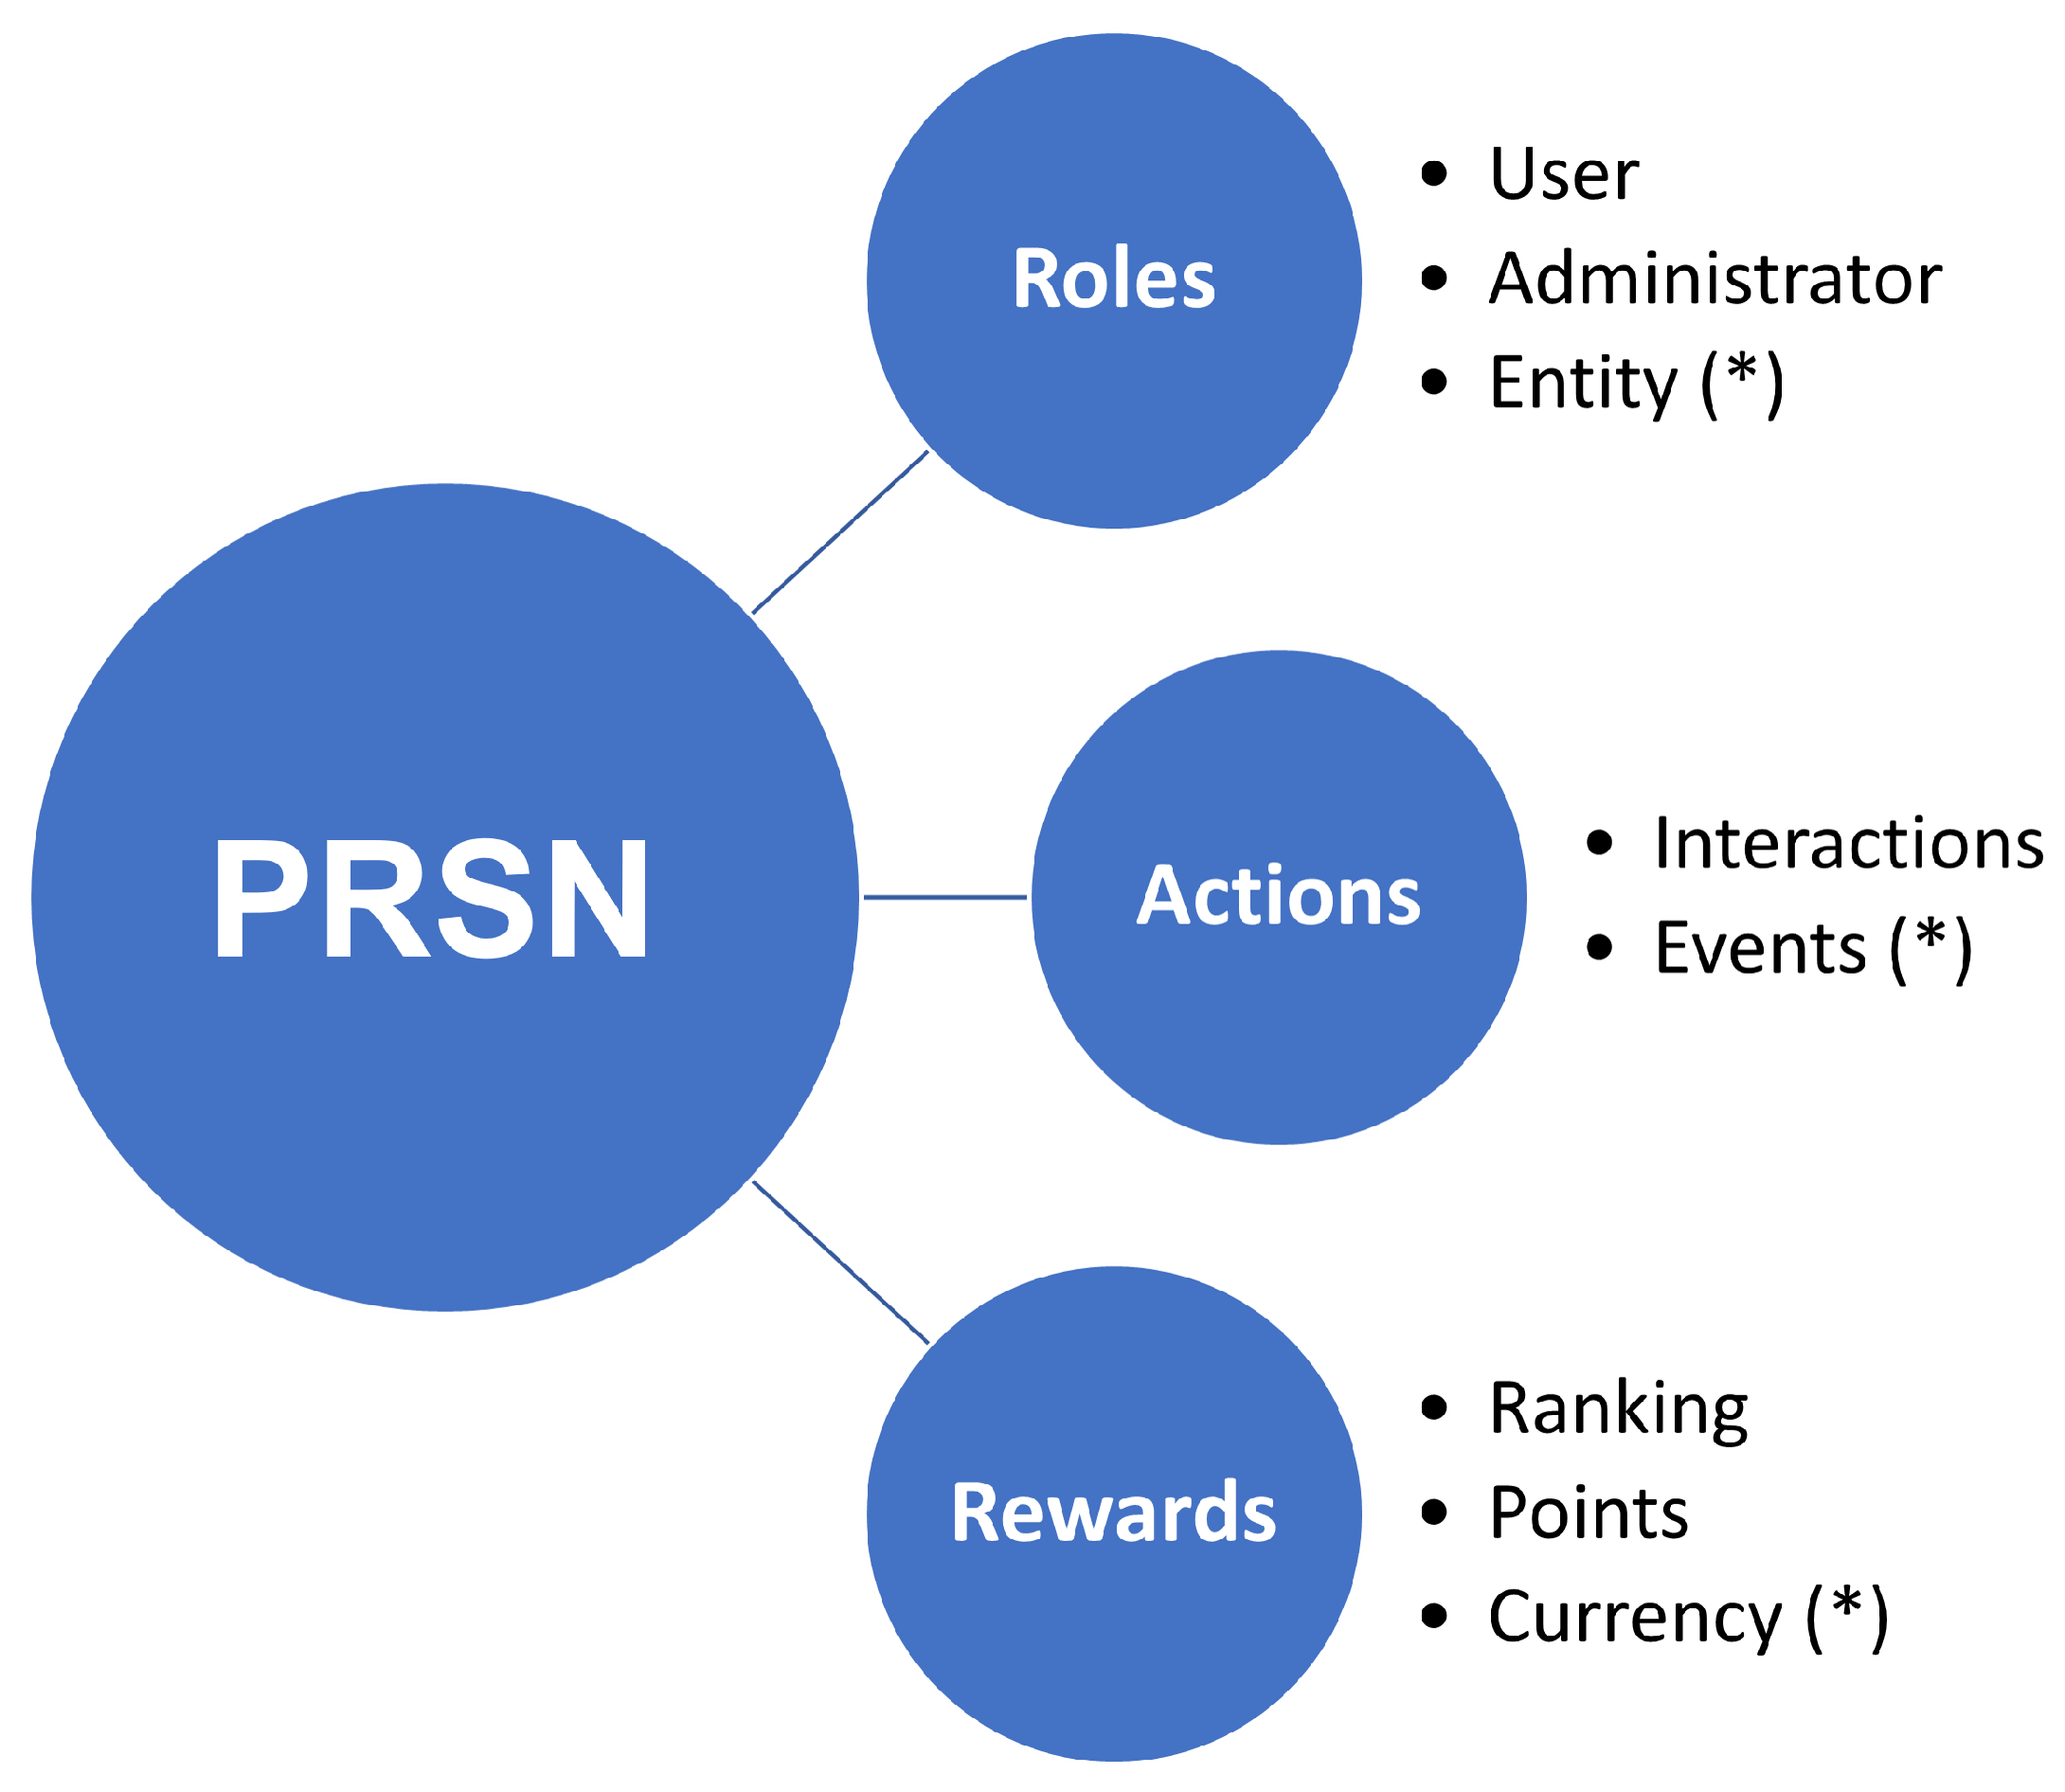
Figure 1 shows a visual model of a generic PRSN, where the main elements involved are roles, actions, and rewards. Elements marked with an asterisk (*) in
Figure 1 may be implemented or not, or used in instances of PRSN. Users (roles) perform actions to gain the associated reward. Actions can be seen online (interactions) or are real world actions (events). Regarding roles, there are users, administrators, and entities. The latter have more features available than simple users, but fewer than administrators. Finally, we have rewards, where points are gained by actions performed by users. If these actions are funded by an entity, users get currency, but this is not a compulsory part of PRSNs. Furthermore, ranking is considered a reward, and is calculated depending on the rewards gained (usually points), but may vary in instances of PRSNs. In the implementation presented in this paper, the points are called BEcoins (BeingExample coins). In the case of BeingExample, no entities were involved, and there was no currency associated with rewards. The role of the user was taken by students, while the role of administrator was taken by the teacher. The main interactions considered were creating examples and creating groups, both aiming to facilitate participation, as without content, participation is impossible. These two interactions have associated rewards, as will be explained later.
Adding rewards may be seen as gamification [
32], commonly utilized to increase user engagement in web-based platforms. Gamification may increase initial motivation and improve scores in practical assignments, although it may have a negative effect on written assessments. However, in this case, only rewards have been used, but not the rest of gamification concepts or elements.
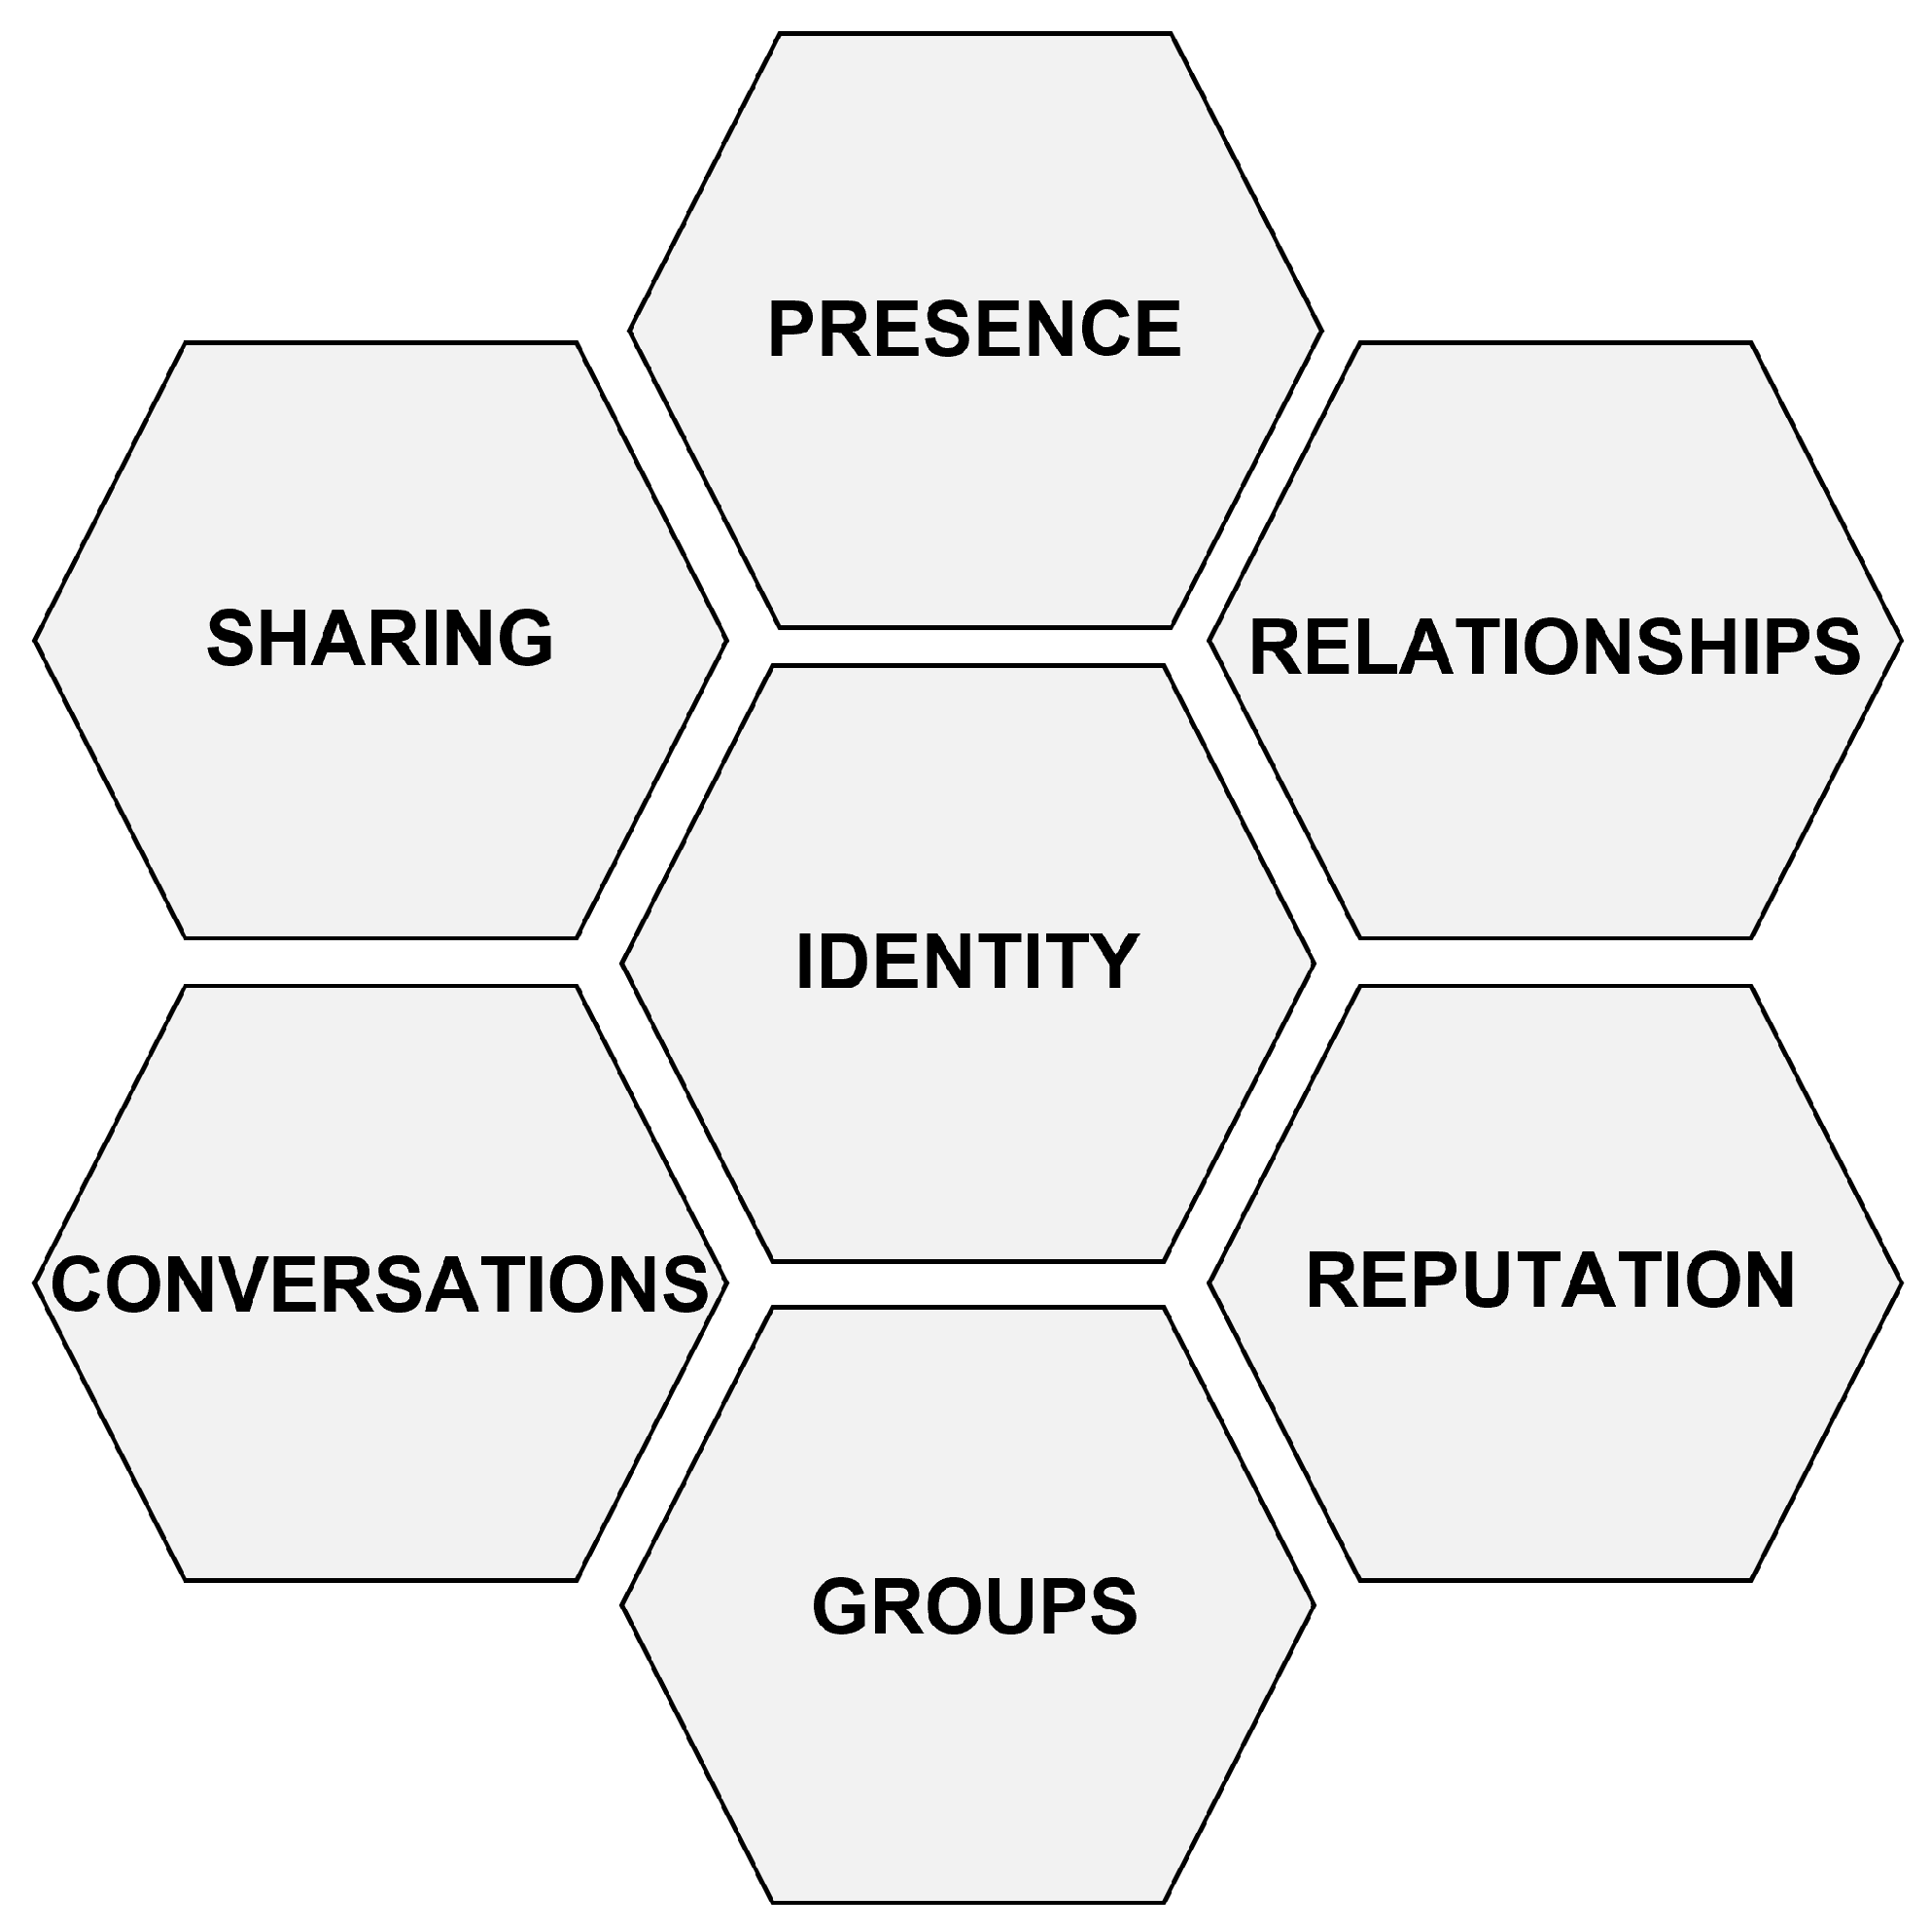
The model presented in
Figure 2 is based on the research work presented in [
33]. The authors present a framework that defines social media by using seven blocks: sharing, presence, relationships, reputation, groups, conversations, and identity. The degree of shading of the blocks indicates their relative importance in the platform being analyzed by this method. In the case of the platform created for this experiment, the focus is on sharing, followed by: conversations, groups, identity, and reputation.
In [
23], the authors adapted a participation model from the original work of [
34]. The original model shows that a person’s attention is divided into several domains. The social domain focuses on interpersonal interactions, and the technological domain on technological devices. It is worth noting that in [
34], it is suggested that the different domains available within the process can either facilitate or hinder multiple types of participation.
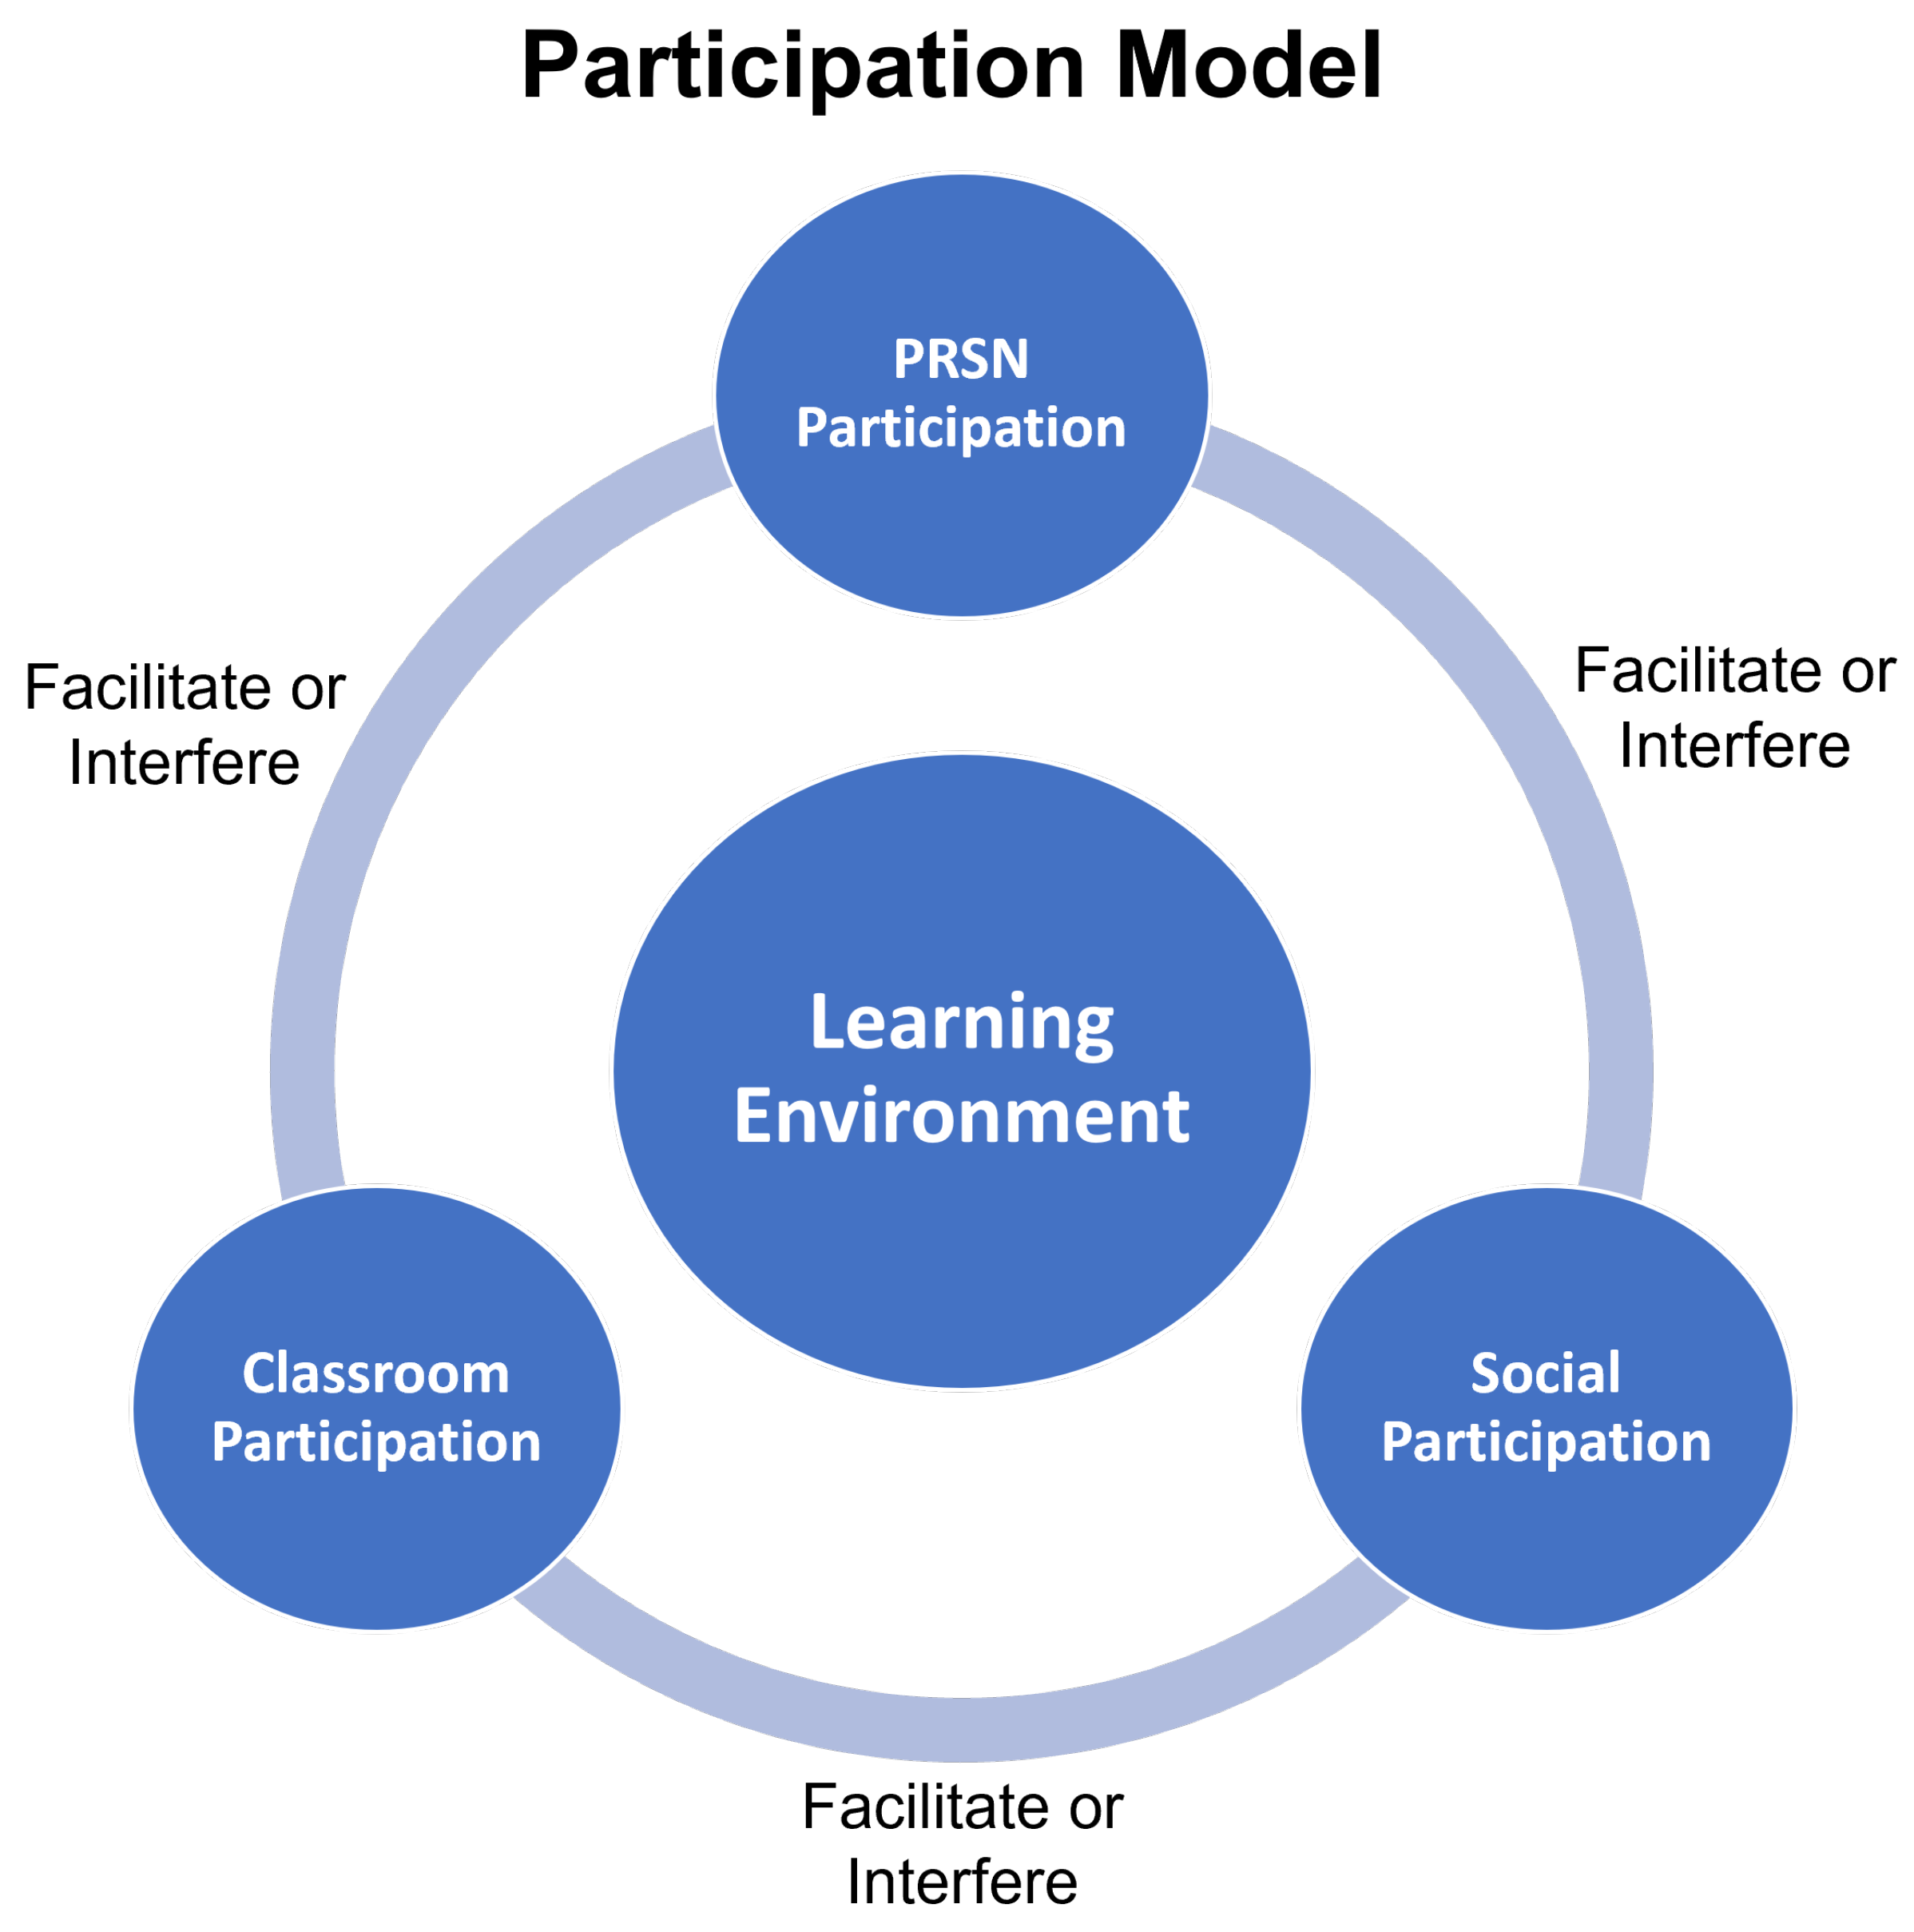
The model presented by [
23] is the main reference for creating the BeingExample participation model shown in
Figure 3. In the original model designed for an environmental science program, there was a technological domain (PRSN participation), a social domain (remains), and finally, the interaction with nature domain. The last one has been replaced by the classroom participation domain.
The participation model is shown in
Figure 3. We have drawn on the model proposed by [
34], who outlined the possibility of a negative or a positive impact.
The platform structure is not optimized for classroom content management. This platform is not an LCMS, however it will be measured and analyzed in a similar way to learning analytics in this type of systems. It can be considered a type of academic analytics [
31], and is closer to, but not the same as, social learning analytics [
35].
Communication, initiative and participation have been chosen as measures following an analysis of the social skills officially required by the European Commission in their recommendations on key competences for lifelong learning [
36]. In the United States, there is also an unofficial and accepted trend in social skills called 21st century skills (21st century skills 2016). As well as the three measures chosen, we also have skills more closely related to social media interactions.
Regarding online data, the system tracks elements such as: (1) (V) Number of votes (positive, negative or neutral); (2) (C) Number of comments made; (3) (GIn) Number of groups where the user is a participant; (4) (L) Number of logins; (5) (I) Number of shared items; (6) (E) Number of examples created; (7) (G) Number of groups created; (8) (Q) Number of questions created; (9) (Cn) Connections created with other users. Online data may be collected by groups and/or by individuals (student/teacher).
As depicted in
Table 1, each one of the interactions tracked by the system has been classified into communication, participation and initiative. Besides, this figure shows that BeingExample interactions are compared with Twitter and Facebook interactions. It also shows the corresponding reward associated with each of the elements tracked by the system.
Table 1 shows that these rewards are oriented to information sharing and group work, as the BEcoins are awarded when performing this type of interactions. Finally, all these interactions are tracked for analysis.
In the following paragraphs, we outline the relevant data from the tables above and compare the features of Facebook, Twitter, Edmodo, Tweacher [
37] and BeingExample, as shown in
Table 2. Regarding connections in Facebook, users have friends and may follow or like other users and/or pages. In Twitter there are followers. Tweacher and Edmodo do not facilitate connections between students, but Edmodo does enable connections between educators. However, in BeingExample, connections are created automatically through participation, but cannot be requested.
Monitoring options are a key tool for teachers. Facebook, Twitter and Tweacher have no special monitoring features for teachers. Edmodo and BeingExample have monitoring features that can help teachers to take decisions through their teaching process.
BeingExample does not implement private messages, ranking options and leadership measures. This deliberate approach does not appear in the other platforms analyzed. Private messages are not enabled so as to avoid the negative impact described in [
38]. Regarding ranking, there are platforms such as Twitter and a number of others, which use their data to show different kind of rankings. They implement a trending topic system to show the most relevant topics. In contrast, the ranking focus of BeingExample is the users.
4. Experimental Study
The research questions presented concern the main objective: first, if BeingExample has a positive impact on classroom participation (research question 1), then if students are aware of their own social skills (research question 2).
4.1. Sample
An experimental study was conducted during the spring semester using a K–12 mathematics subject, Geometry, in the Texas education system (USA). A group of 72 students and their Mathematics teacher participated. There were two homogeneous groups: the experimental group N = 48, and the control group N = 24. The age range of the Students was 14 to 18 years. The mean age in the experimental group was 15.6, and 15.8 in the control group. The experimental group was split into two sub-groups: group one with 26 students and group two with 22. The control group consisted of 24 students. The reason for this organization was due to the fact that the students in the different groups had Math class in different periods, but with the same classroom, resources and teacher.
Table 3 shows a summary of the most relevant data.
Before starting the experimental research, the same activities and academic tools were presented to all students. The only main difference between the control group and the experimental group was that the experimental group used BeingExample during the experimental research period, and the control group did not. Anonymous initial surveys were conducted with the exp erimental and the control group, which confirmed the similar nature of the two groups.
It should be taken into account that the educational setting where the experiment was conducted features students with the following special situations:
Some subjects, such as Algebra I, Geometry, and Algebra II etc., can be taken earlier if a student’s performance in Mathematics permits. This results in groups with a wide age range, from 14 to 18. However, both groups had a similar mean age; 15.6 in the experimental group and 15.8 in the control group.
Many students are from Mexico, and some have serious language difficulties. This does not greatly affect performance in Mathematics, but some of them are placed in a grade below their corresponding age. These students are called English Language Learners (ELL) and 60% of the students in the experimental group were ELLs, while 63% of the control group were ELL. This system allows them to improve their English through content that they should already understand. It also affects the age range within the groups.
At the high school where the experiment took place, students may have started “Early College”. This is for students that have already taken or passed college tests for mathematics and English, and who may take dual credit classes (credit that counts for the high school and for some colleges). These exams are part of the Texas Success Initiative TSI (TSI 2016). These students take college classes at the same time as their mainstream classes. This results in mixed groups of students taking and not taking college classes. In our case, the data for both groups was again similar; in the control group, 17% were early college ready, and in the experimental group, this was 15%.
4.2. Procedure
The experimental research was conducted over a period of four months, corresponding to the spring term. The three main stages of the experimental research on the BeingExample platform were pre-use, during-use and post-use:
Pre-use stage, from the second week of January until the second week of March. During this stage, academic offline data were collected.
During-use stage, from the third week of March until the last week of April. BeingExample was used by the experimental group, and its online data interactions were collected. Academic data were collected as well.
Post-use stage, from the first week of May until the last week of May. During this stage, academic offline data was collected.
During the first stage (pre-use), classroom participation data were collected for analysis, and to decide which sections would be included in the experimental or in the control group.
The second stage (during-use) comprised a period of 8 weeks using BeingExample. The first and last weeks, called week 0 and week 7, have been used for specific purposes, and have not been taken into account for the online data results. The period of study was from 16 March (week 0) to 10 May (week 7). Week 0 was used for an initial survey (all students) and training, while week 7 was used for final surveys (experimental group) and exams. The final survey was only completed by the experimental group, as it was similar to the initial one and its purpose was to measure changes produced through BeingExample use. Weeks 1 to 6 were the core of the experiment (when online data was collected). Each week, students in the experimental group were asked to work with BeingExample, with a new main activity for each week; for example, week 4 was devoted to college orientation, and the activity in week 5 was on creativity. The system tracked students’ online social interaction data and presented the data as BEcoins won by the student, but not in terms of communication, participation or initiative. A roadmap document was given to the students with the six main goals of the use of BeingExample, one per week. They were asked to make a note of the highlights of their activity on the platform. The control group did not use the platform. Both groups had regular Mathematics classes, with no difference in the activities completed. BEcoins were exchanged for extra points by students (in the class where they used the platform). The control group was asked to bring the teacher digital material regarding the class or academic life to get extra points. In order to have similar possibilities, one group used BeingExample, and the other did not. These extra points were not taken into account for academic outcome data.
Lastly, classroom data were collected after the period of use of BeingExample (post-use). Online data and offline data from daily procedures in class were collected methodically. Offline data, such as test results and classroom participation, were collected by the teacher.
4.3. Instruments and Measures
There were two important data collection sources. The first one was the teaching-learning process carried out in class, which may be considered as “offline data” or “real world data”. The second one was the data collected using the monitoring tools provided by the BeingExample platform, mostly information about the students’ interactions with the platform, and among them.
Measures were taken to avoid the Hawthorne effect [
39]. Students were not informed that an experiment was taking place, although the teacher was informed, as he had to track extra student data, such us classroom participation and academic performance, based on multiple-choice tests to avoid subjectivity. In order to prevent them from thinking or knowing about the study, the teacher told all the groups that the project would first be done by two groups, and then at a later date by the other group, due to the website workload.
The most important offline data collected in order to be analyzed were: extra points for participation, student attendance and late arrivals, seating chart for each group, and surveys. Consequently, the data analyzed in this study are closer to social learning analytics [
35]. Exam grades ranged from 0 to 100. Furthermore, all grades taken into account for the study were based on multiple-choice tests in order to avoid subjectivity while grading the exams.
Surveys were used as instruments. Initial surveys were completed during week 0, just before the training, to compare the experimental with the control group, in order to check how homogeneous they were. Both the experimental and control groups completed the surveys. The final survey (week 7) was completed only by the experimental group to collect data on the use of BeingExample, and to see whether any of the questions answered during the initial survey had changed due to the use of the platform. Some of the initial questions were eliminated. A number of new questions were also added.
Online data tracked by the platform were reduced to three important parameters or indicators: initiative, participation, and communication, as mentioned in the previous section. However, there are numerous possibilities for the nine basic measures taken from BeingExample.
The data collected during the experiment in some cases did not provide sufficient information to evaluate growth or output differences. Therefore, to validate some of the results obtained, ANOVA (nested) was used for the classroom participation data, in order to answer research question 1.
5. Results
In this section, we firstly present the online interaction data. Secondly, classroom participation data and their statistical analysis are described. This is followed by the students’ perceptions of their online social skills. Finally, the implications and limitations of this study are presented.
5.1. Online Interaction Data
Most of the students from the experimental group demonstrated a positive attitude during and after the experiment. As shown in
Table 4, the weeks in which exams were conducted (week 2 and week 5) and there were no regular classes, showed the worst online participation results. Online data before and after the six weeks of use of the BeingExample platform was not taken into account. Finally, we would like to highlight the increase of data received in the last week, due to the fact that the project was finishing, and students wanted to get it completed and get a good grade on it.
While initiative and participation have similar values, communication is lower. This confirms the importance of communication between individuals in the same group in order to improve performance. As classroom communication between students was not measured (due to its practical impossibility), it could arguably be replaced by online communication.
Table 5 shows the data for initiative, participation, and communication. The final mean for each student is also included.
As an extensive review of the data generated in the platform is impractical and beyond the scope of this work, some examples of the content shared by the students were selected. This was in order to illustrate the use of BeingExample platform by the students participating in the experiment:
A positive example created by Fernanda: Human DNA is 50% identical to banana DNA, with hashtag #curiousfact; it scored 87.5% positive votes, 12.5% neutral, and 0 negative votes. Comments were made by six other students.
With regard to group data, Daniela attained one of the highest numbers of interactions (from other students) within her groups and examples, with a total of 11 comments, 29 votes, and 19 documents. Daniela created 31 examples, 4 groups, and participated in another 11 groups. Her groups were about school clubs, hobbies, drawings, and life.
One of the most important groups was for Information on Stephen F. Austin State University. It was created by Sarai in order to share information about the university. It had 80 votes, 8 documents, 3 questions, and 26 participants. In this case, there were no comments, because the student deactivated them for this group.
5.2. Classroom Participation Data
During the following paragraphs, we present data related to research question 1: “What effect does the use of PRSN have on classroom participation?”. ANOVA (nested) analyses were conducted for each one of the rows shown in
Table 6. Results from these analyses are shown below, separated into the different stages of the procedure. The difference between the experimental and control group was the use (experimental) or not (control) of BeingExample.
Classroom Participation (see
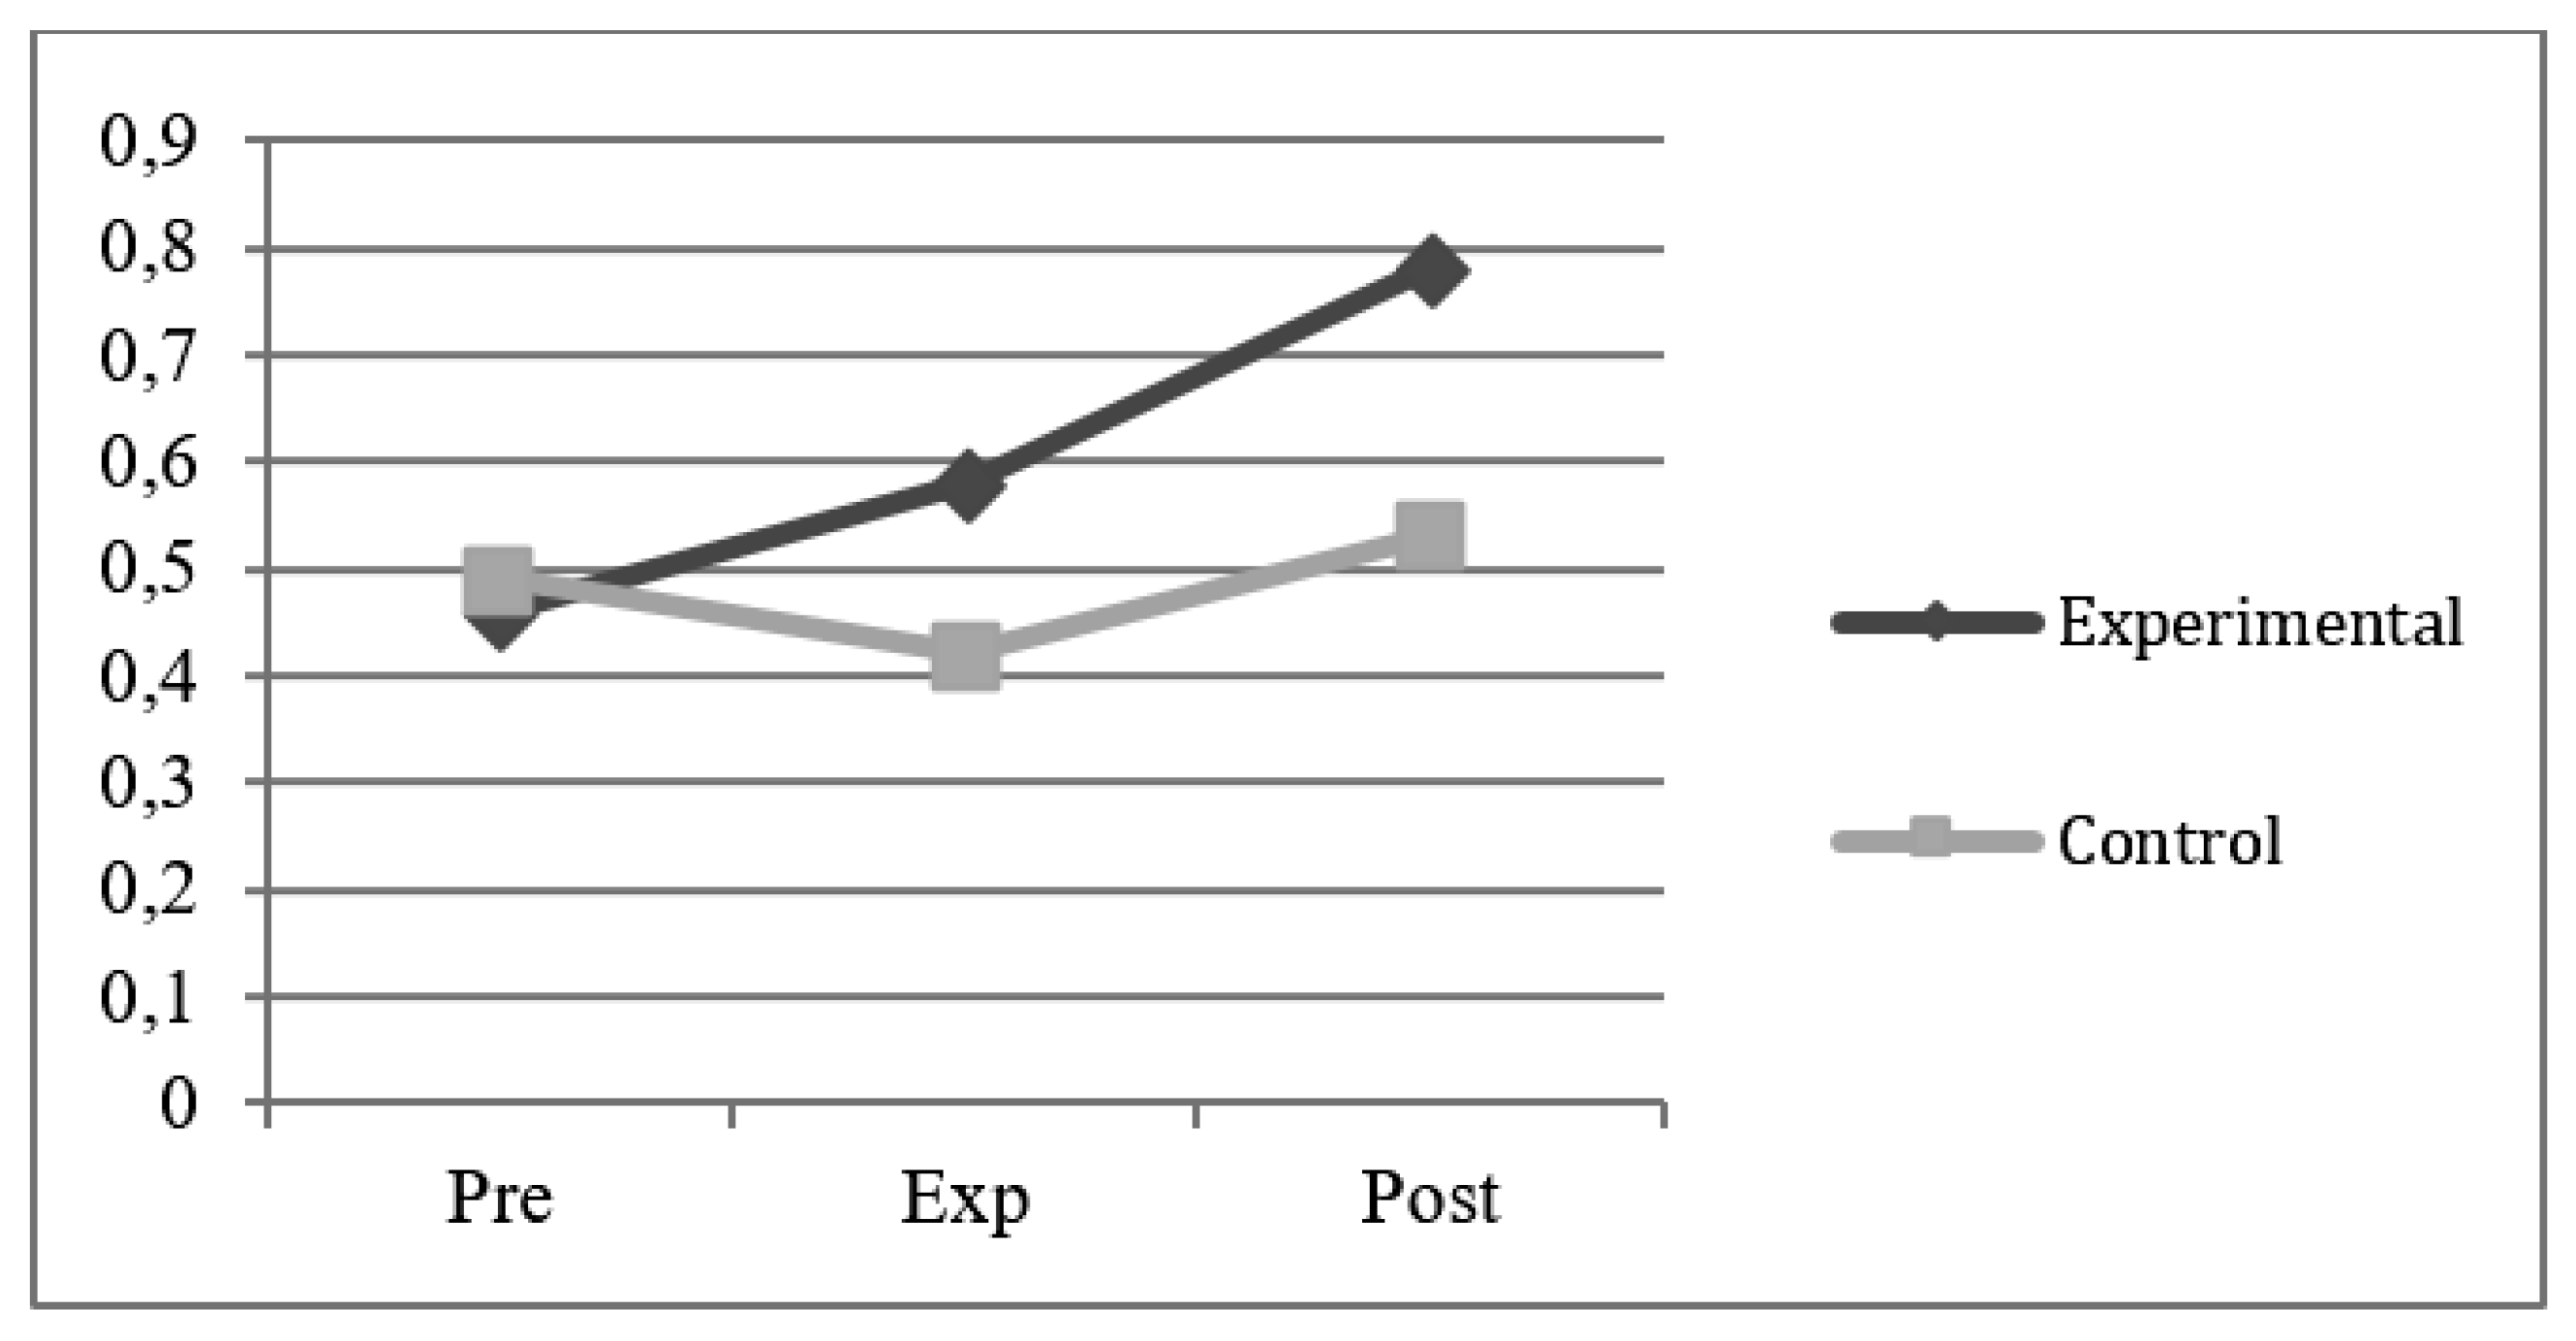
Table 6) data collected before the experiment showed F(1, 70) = 0.23, P = 0.63, therefore there were no pre-existing differences between groups. The data collected during the use of BeingExample were analyzed with the following results F(1, 70) = 4.19, P = 0.045, the difference being significant. After using the platform, the data obtained were F(1, 70) = 4.15, P = 0.046; again, there is a significant difference. Finally, all the classroom participation data were analyzed, and gave the following results: F(1, 70) = 3.36 and P = 0.068, which is close to, but not, a significant difference.
Figure 4 shows how participation data for the experimental and control group are similar. During the second stage of the experimental study, when students used the platform, the experimental group increased their participation. This positive tendency continued once this stage ended up, and they stopped using the BeingExample platform, as it can be seen in the post-experiment stage.
The during-use stage ended up with positive results for classroom participation. Students from the experimental group improved their participation. Furthermore, there was a significant difference between the control and the experimental group. Post-use data showed a significant difference between groups. However, once the classroom participation data were gathered, there was no significant difference between groups. This might be due to the data from the pre-use stage.
Consequently, the answer to research question 1 is that there is indeed a clear positive relationship between BeingExample PRSN use and students’ participation, since there is a significant difference between the control and experimental group: However, this may change when the platform is not used in class. Although classroom data were collected individually for this initial study, they were processed as a group, to see if PRSN adapted to educational environments is a useful tool for teachers. These individual data should be analyzed in future works, as they may provide answers to some interesting questions. It is important to establish these data as the initial data for the use of this platform, which aims to improve academic outcomes. Normalizing some of the data in order to allow comparison with future data may help to improve the process and the results.
5.3. Perceptions of Online Social Skills
An anonymous survey was conducted before and after using the BeingExample platform in order to answer research question number 2. It also helped identify similarities and differences between groups and students’ perceptions. The most important data on social skills and students’ perceptions on them are shown in
Table 7. The differences between pre- and post-use survey data are also depicted. These surveys were completed by students from the experimental group. As the surveys were anonymous in order to allow students to freely answer questions, some of the students did not complete them. The initial survey was answered by 41 students. The final survey was answered by 40. These data have helped us to answer research question 2: “What effect does the use of PRSN have on students’ perceptions of their own skills?”.
Table 7 shows that, in post-experiment data, there is an improvement in the positive answers to every question. There is also a decrease, for all questions, in the number of students answering sometimes or somehow. Consequently, students who had doubts about their social perceptions may be helped by the use of PRSNs. Moreover, the positive intention of becoming an active participant or leader was increased after the experiment. Therefore, it can be concluded that using the platform BeingExample has a positive impact on students’ self-perceived social skills, or at least in many of them, such as communication, initiative, participation, and leadership.
Moreover, analyzing the data collected through specific questions about the platform: “Did you like the BeingExample project?” and “Would you recommend BeingExample to your friends or teachers?”, we can conclude that the use of the platform was positively received by most of the students.
In summary, the differences found in the experimental group and the control group demonstrate that the use of the BeingExample platform, developed as a PRSN adapted to the educational environment, has a clear positive effect on students’ active participation and improved perception of their social skills. These effects translate into improved academic results.
5.4. Limitations
This experimental study has several limitations that are worth being pointed out. As it was the first time that PRSNs were adapted and used in an educational environment for academic purposes, there were no previous data for comparison. It would be interesting to use the data produced in this work for further related experimental research.
The sample initially comprised 140 students; 67 in the experimental group and 73 in the control group. However, the problem we faced was that they were divided into six sub-groups with different Mathematics subjects and different exams. Moreover, a prior analysis of the Algebra 2 groups showed they were not as homogeneous as the Geometry groups. Therefore, the Geometry groups were finally selected for the experiment.
As seen in [
26], instructors are a key part of e-learning processes. It must be highlighted that, while using PRSNs in educational environments, teachers are a key factor to achieve positive results. It is hypothesized that a motivated teacher, trained in using the platform, will have better results with their students than teachers using the platform as an obligation. It would be interesting to experiment with a group of teachers and their students to analyze how teachers’ interactions on the platform and their motivational level impact the students’ academic outcomes (online and offline).
A large amount of data was gathered during this research. Nevertheless, future research should focus on collecting even more data. It would have been interesting to track classroom participation data in a weekly basis during the six weeks of BeingExample use, in order to compare these two items week by week. Instead, classroom participation data was tracked during the three stages of the experiment.
6. Conclusions
This research study provides experimental evidence that using positive reinforcement social networks in educational environments can increase the participation of students in class; therefore, the first research question can be answered positively. As the use of the platform BeingExample had a positive impact on classroom participation, it can be said that the participation model proposed is a valid model for educational environments. Furthermore, these positive results demonstrate the success of implementing PRSNs in educational settings. However, more tests and an extensive analysis of other academic outcomes should be conducted to identify any negative effects.
Students who had doubts about their online social skills were helped by the use of PRSNs, given that, in the final survey, there was a reduction in the number of students answering sometimes or somehow. Furthermore, there was an increase of positive answers to every question. Therefore, it can be concluded that using BeingExample has a positive impact on students’ perceptions of their own social skills, which implies that research question two can also be answered positively.
Students and teachers are increasingly using ICTs, and it is expected that this study can help them to decide between different technological options, or motivate them to implement similar functionalities to those which have proved to succeed, and try to avoid those which do not enhance academic outcomes.
Although positive outcomes can be extracted from this research, it is important to identify the key factors in order to apply these results to other real environments. Therefore, drawing on the work of [
40] where factors affecting ICT adoption processes were explored, it can be said that the main factors influencing the implementation of this and other new technologies in classrooms are: organizational support, leadership, training and development, and resources. It is worth noting that individual teachers are usually the ones who bring new technology-based approaches to their teaching practice [
8].
Communication between students and between students and teachers can be said to have been improved. This is not new, as there are several works highlighting this improvement in communication when social media are used for academic purposes. The use of the platform also encouraged cooperation between students.
It would be interesting to set up a longer experimental study with an initial analysis of the class and improvements to be achieved through platform use. Varying the weight of the indicators might be useful. In this case, weights were not used. However, if a measure of goal achievement is needed, for example, improving classroom communication, teachers should have the option of giving more weight (for the calculation of rewards) to the items related to communication.
There are many questions still unanswered that could be the starting point for future works. Some of the most important ones are the following:
Would results be similar if the content shared and studied on a PRSN was only related to the subject taught by the teacher using the platform with their students?
Is there a relation between academic performance and student PRSN interactions and/or indicators?
Is there an individual pattern between classroom participation and student PRSN interactions and/or indicators?
In addition to the questions presented above, future work should focus on answering the issues as yet unsolved. Once the impact on academic outcomes is confirmed, teachers need to be provided with the power to analyze, configure and create their own rules within PRSNs, so as to resolve their students’ learning difficulties. Working on the indicators of the use of the BeingExample platform is required to facilitate this process. Teachers need to be offered more tools to detect and help low-achieving students, but also to identify high-achieving students and help them fulfill their potential.


 ,
, 


