Article

Mueller Matrix-Based Approach for the Ex Vivo Detection of Riboflavin-Treated Transparent Biotissue

1
Hannover Centre for Optical Technologies, Leibniz University Hannover, Nienburger Straße 17, 30167 Hannover, Germany
2
Laser Zentrum Hannover e.V., Hollerithallee 8, 30419 Hannover, Germany
3
Cluster of Excellence PhoenixD, Welfengarten 1A, 30167 Hannover, Germany
*
Author to whom correspondence should be addressed.
These authors contributed equally to this work.
Appl. Sci. 2021, 11(23), 11515; https://doi.org/10.3390/app112311515
Submission received: 21 October 2021 / Revised: 26 November 2021 / Accepted: 29 November 2021 / Published: 5 December 2021

Abstract

:
Corneal collagen cross-linking is an established procedure for the treatment of certain eye diseases which is applied to enhance the mechanical stability of such biotissue without deteriorating its functionality. However, being transparent, the optical analysis of the outcome of such treatments is cumbersome and relies on relatively expensive experimental equipment. We aim to apply the Mueller matrix polarimetry for the detection of photo-induced collagen cross-linking in transparent biotissue after treatment with riboflavin and UV irradiation. A simple Mueller matrix polarimetry setup could provide a fast and non-invasive analysis of transparent media to sensitively detect small photo-induced cross-linking effects in biotissue. We demonstrated the current capabilities of the approach on non-planar porcine cornea samples ex vivo. We reported the distinction between untreated and riboflavin-treated samples. The differences observed were correlated with the variation of certain Mueller matrix elements and parameters derived from the decomposition. The measurement data show variation in the cross-linked and non-cross-linked samples, although the effect of the UV treatment on the riboflavin-treated samples was not at the same level of significance yet and needs further investigation. The Mueller matrix measurement represents a promising approach for the detection of the effects of corneal collagen cross-linking. Further studies with a larger sample number are required to validate this approach. In the future, this could enable the reliable and non-invasive detection of photo-induced effects in biotissue and open the possibility for in vivo application, e.g., in eye disease treatment or the detection of scar collagen development.

1. Introduction

The fast and non-invasive detection of tissue properties can be relevant to investigations in the life sciences or medical diagnostics and could provide interesting alternatives to invasive approaches. Optical techniques have already proven their impressive capabilities for the detection of subtle effects in biotissues, in many cases also for in vivo measurements. However, techniques such as Brillouin microscopy [1], optical coherence tomography (OCT) [2], optical coherence elastography [3,4], laser scanning microscopy [5], hyperspectral imaging [6], multi-photon imaging [7] or diffuse reflectance methods [8,9] rely on relatively sophisticated equipment and might not be applicable to certain use cases. With regard to achievable contrast or sensitivity, all approaches have their individual strengths and weaknesses. In particular, the visualization of effects in transparent biological media with reasonable sensitivity and speed, ideally in vivo and under real conditions as clinical settings represent an important challenge to be addressed. Additionally, as laser light is employed as the coherent radiation in most cases, safety aspects must be considered.
The highly ordered structure of some bio-tissues [10,11] provides measurable depolarization values in polarimetry setups [12]. The human cornea is one such bio-tissue consisting of successive layers of collagen fibrils immersed in an amorphous ground substance containing water, proteins and salts [13]. Such a formation is optically anisotropic and is therefore a suitable sample for polarimetry measurements [14]. Corneal collagen cross-linking (CXL) is a promising treatment that increases the mechanical stiffness of the cornea. This is particularly useful for several diseases in ophthalmology such as keratoconus in which the cornea thins over time. The treatment combines the application of ultraviolet-A light and a chromophore-like riboflavin following the Dresden protocol to induce polymerization [15]. The quantitative assessment of the treatment was performed via corneal stroma depth and biomechanical stiffness measurements. To date, optical methods such as OCT [16], confocal microscopy [17] and non-linear microscopy [18] were also applied for this purpose. Mueller matrix (MM) polarimetry is promising for the evaluation of CXL treatment because the degree of orientation in the samples can in principle be detected by polarization-sensitive measurements [19,20]. Compared to the optical methods mentioned above, it provides a relatively simple and straightforward approach that delivers information about the polarization changing properties of a sample [9,21,22,23]. This relies on the measurement of the laser intensity reflected from or transmitted through a sample for different polarization states of the radiation before and after the interaction with the biotissue. Among many others, Mueller matrix polarimetry was utilized for the examination of skin tissue properties in dermatology [24], the assessment of the quality of tissue implants [20] or the identification of cancerous tissue sections from excised samples [25]. In addition, the technique was applied for the evaluation of β-amyloid progression in Alzheimer’s disease [21]. Depending on the application, measurements in reflection or transmission mode are required and can be realized. As the Mueller matrix contains the full polarization information of a sample, it is advantageous over other biotissue imaging techniques such as non-contact dermoscopy which uses cross-polarization configurations for imaging [19,26,27].
In this work, we employed Mueller matrix polarimetry for the fast and non-invasive analysis of transparent biological media. As an example, we investigated porcine cornea samples ex vivo to demonstrate that small effects originating from photo-induced collagen cross-linking processes in the tissue can be detected. In the long term, this technique might represent an interesting alternative to the detection of cross-linking processes in human cornea in vivo and could lead to a relatively simple and cost-effective approach for the examination of therapy outcomes in ophthalmology. Moreover, it might be applicable for the quantification of collagen deposition in scars, which is relevant for wound healing, or pathological scar treatment and where the in vivo measurement of small changes of the tissues properties is desirable [28]. In order to evaluate the capability of the technique, in a first attempt, we applied an established protocol to the porcine cornea samples consisting of the application of riboflavin followed by UV irradiation to induce the cross-linking of the collagen fibers contained therein [29].

2. Materials and Methods

2.1. Photo-Induced Corneal Collagen Cross-Linking

The ex vivo porcine eye cornea samples were obtained from a local slaughterhouse. The cornea was cut and stored in a MEM (minimal essential medium with Earle’s salts) solution with 6% Dextran 500, 2% FBS (fetal bovine serum) and antibiotic–antimycotic solution overnight. On the measurement day, we placed the cornea in an artificial chamber where it was stored in a 15% Dextran 500 solution for at least 90 min to minimize the influence of dehydration. Stable hydration conditions were reached if the thickness of the sample differed by less than 3% in three consecutive measurements taken 5 min apart from each other. The pachymetry was controlled before every step of the measurement procedure. For the MM measurements, as mentioned above, we considered corneal collagen cross-linking (CXL) as a relevant use case for a potential future application [29]. In this case, the aim was to change the rigidity of the cornea by cross-linking the collagen fiber contained therein through the generation of oxygen radicals. This method was used as a therapy for corneal degeneration [30]. To do this, the cornea samples were exposed to 0.1% riboflavin (vitamin B2) in 15% Dextran 500 solution which diffuses into the tissue. The samples are then irradiated with UV irradiation according to the established Dresden protocol [29]. Here, this procedure was applied to the ex vivo porcine cornea samples. For this purpose, the samples were first stored in a riboflavin solution (0.1%) for 30 min and then exposed to UV irradiation at 365 nm at a fluence of 3 mW/cm2 for another 30 min. As in everyday clinical practice, the protocol was often adapted and the UV exposure time was reduced to 10 min when applying 9 mW/cm2 [31]. In this work, we used the modified protocol for preparation. The aim was to identify whether the cross-linking was induced inside the cornea which is not observable by eye but can be detected by the Mueller matrix measurements.

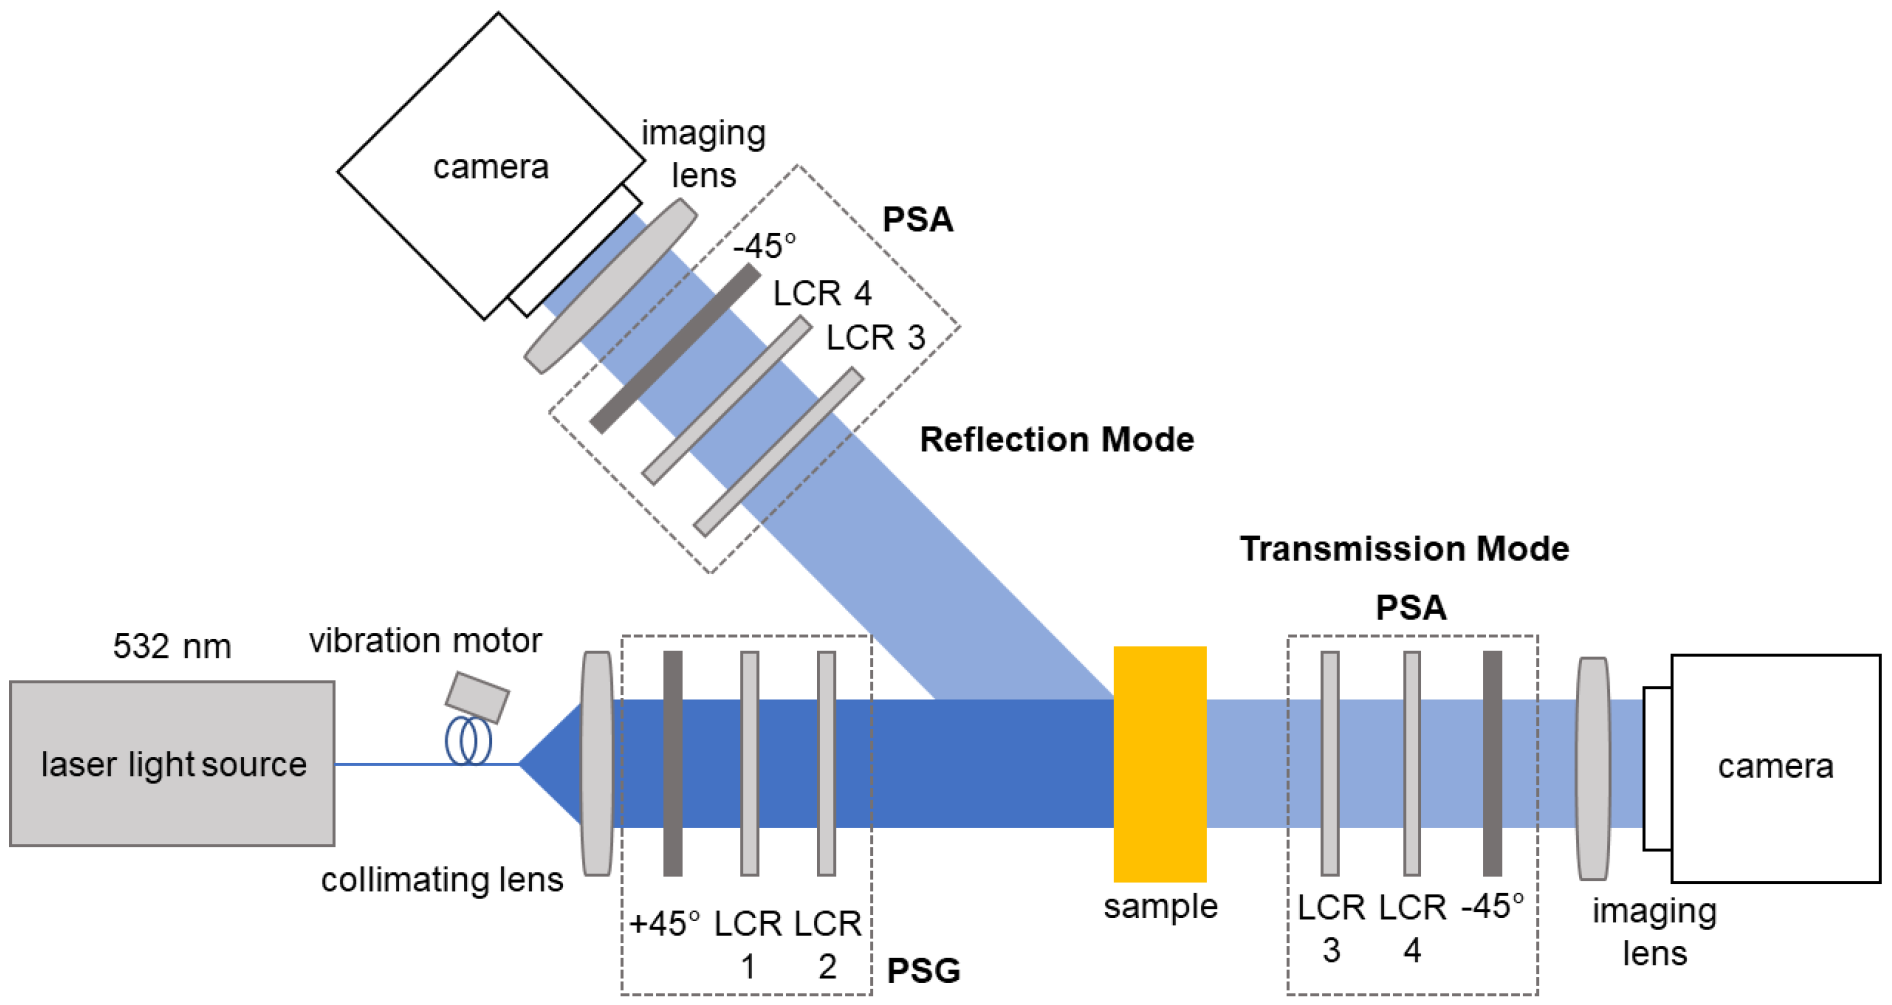
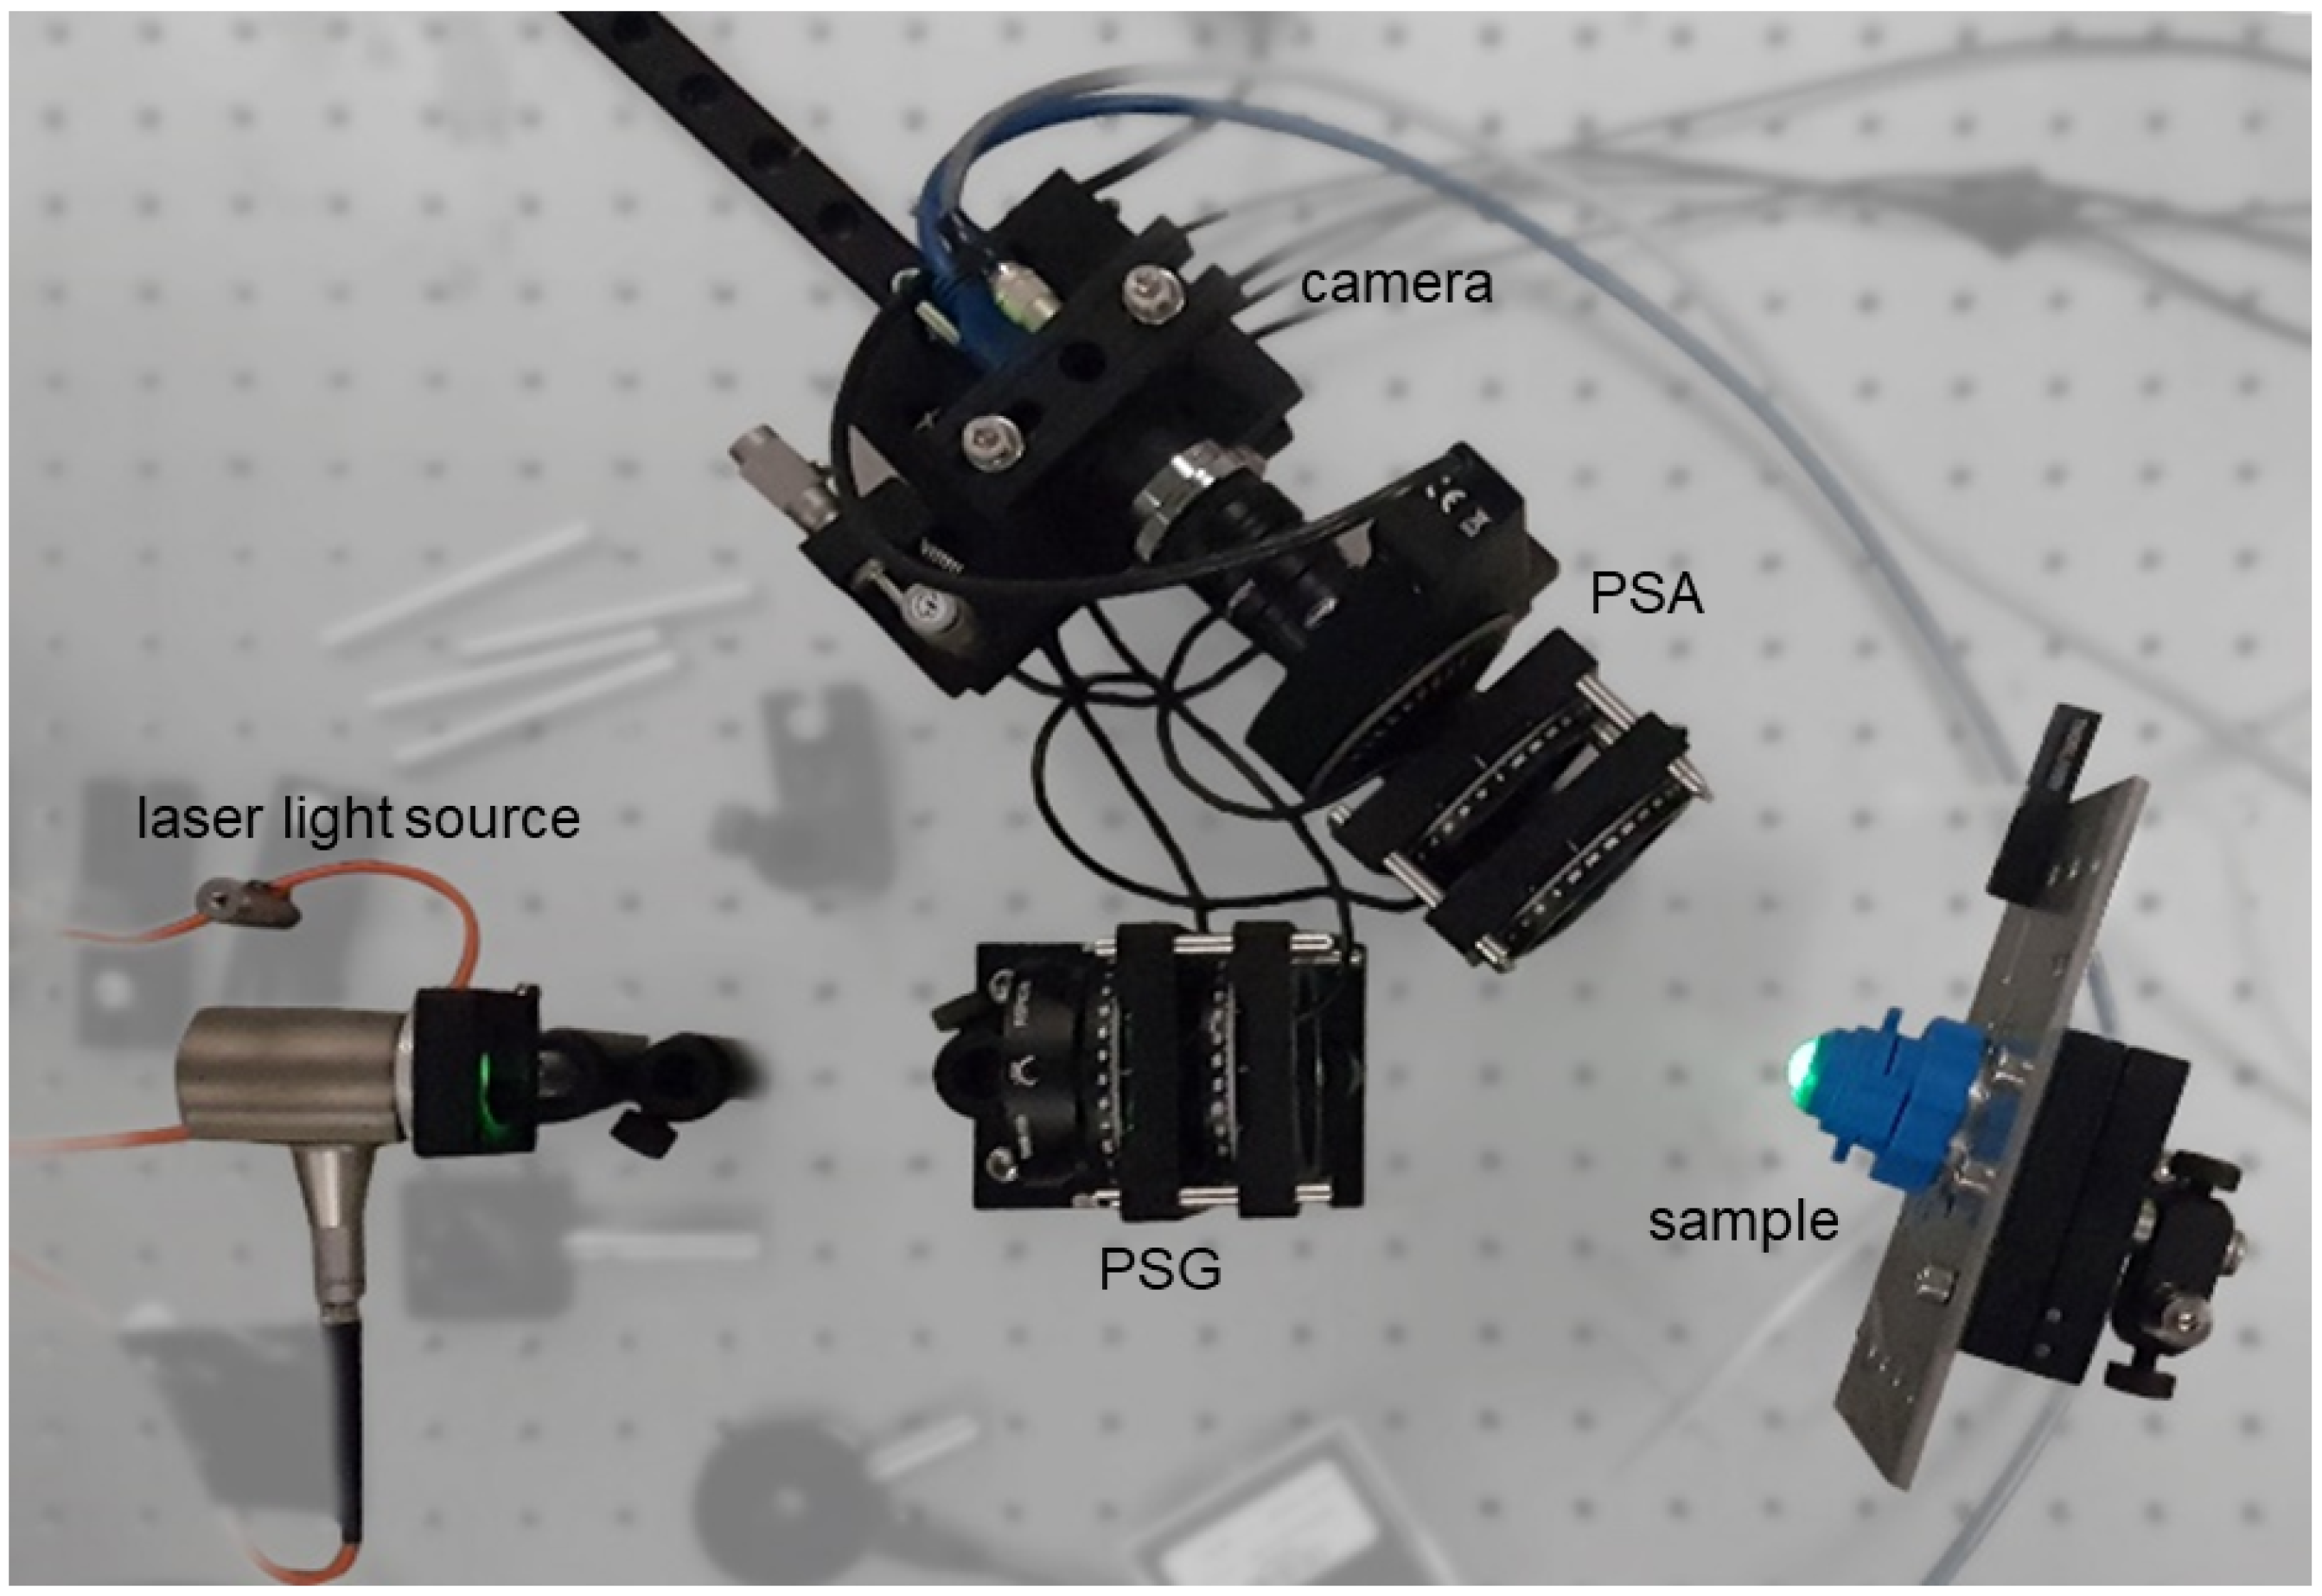
2.2. Mueller Matrix Measurement Setup

Mueller matrix (MM) polarimetry delivers information about the polarization changing properties of the samples under study. This information can be derived from the measurement of the intensity of light which is reflected or transmitted through a sample following illumination at different polarization states. The Mueller matrix relates to the Stokes formalism used to describe the polarization state of light before and after interaction with the sample [32,33,34,35]. The Stokes vector S o of the light field after interaction with a sample can be calculated from the Stokes vector of the incoming light S i for known MM as follows:
S o 0 S o 1 S o 2 S o 3 = M 11 M 12 M 13 M 14 M 21 M 22 M 23 M 24 M 31 M 32 M 33 M 34 M 41 M 42 M 43 M 44 S i 0 S i 1 S i 2 S i 3
Here, the 4 × 4 MM contains all information about the polarization-changing properties of the samples. The Stokes vectors consist of defined intensity values of different polarization states:
S S t o k e s = I H + I V I H I V I P I M I R + I L = I H + I V I H I V 2 I P ( I H + I V ) 2 I R ( I H + I V )
The indices for the intensity values I stand for the different polarization states of the light (H: horizontal polarization; V: vertical polarization; P: light polarized at an angle of 45°; M: light polarized at −45°; R: right circular polarization; L: left circular polarization). For the measurement of the MM, the change in the Stokes vector after the interaction of the incoming light field with the sample was recorded. In total, this typically requires either 16 or 36 different measurements depending on the polarization states which need to be generated, i.e., 4 states (H, V, P, R) or 6 states (H, V, P, M, R, L), respectively, as can be seen in Equation (2). Details on the formalism can be found in reference [36]. In this work, we determined 6 polarization states and performed 36 different intensity measurements, in order to compensate for the calibration and measurement errors and increase the accuracy. This, however, increases the measurement times and needs to be individually considered with respect to the demands of each application, particularly when in vivo measurements are required. As the experimentally obtained values for the MM elements cannot be directly related to the physical properties of a sample, the decomposition of the MM into matrices of known contributions is usually performed. Here, we employed the polar decomposition by Lu and Chipman, which was widely used in the literature as [37]:
M e x p = M Δ · M R · M D
M e x p represents the experimentally measured MM, M Δ a depolarizer, M R a retarder and M D a diattenuator. For a pure depolarizer, M Δ can be written in the matrix form as
M Δ = 1 0 0 0 0 a 0 0 0 0 b 0 0 0 0 c
Further to that, key figures are the parameter Δ , the depolarization power; R, the total retardance (combination of the effect of linear and circular birefringence), and P, the total polarizance. These parameters can be calculated to determine specific sample properties by Equations (5)–(7) [37] as follows:
Δ = 1 | a | + | b | + | c | 3
R = c o s 1 t r ( M R ) 2 1
P = 1 M 11 M 21 2 + M 31 2 + M 41 2
For the measurements reported in this work, we used our in-house polarimetry system which was described in detail in [20]. A sketch of the system is shown in Figure 1.
Here, we briefly summarize the main aspects of the system and methodology. The MM measurement system generates the polarization states of the incoming light using a polarization state generator (PSG) and records the outgoing states upon the interaction with the samples and passing through a polarization state analyzer (PSA). Using a CCD camera (BFS-U3-32S4M-C, FLIR Integrated Imaging Solutions Inc., Richmond, BC, Canada), 2D measurements of the MM of a sample were obtained in one shot [20]. The PSG and PSA components were assembled from fixed polarizers (LPVISE100-A2”, Thorlabs, Newton, NJ, USA) and liquid crystal retarders (LCRs) (LCC1223T, Thorlabs, Newton, NJ, USA). By changing the voltage applied to the LCR, all required polarization states can be generated in approximately 15 s in total. The system was designed to operate in reflection and transmission mode and uses laser light at a wavelength of 532 nm (CW532-04-1, Roithner Lasertechnik GmbH, Vienna, Austria) for the measurement. From the measured intensity values, the MM matrix elements were calculated for each pixel, as can be seen in Table 1.
The setup was calibrated to ensure the optical system is adjusted and behaves similarly to an ideal system. This requires the LCRs to be oriented at the correct angle with respect to each another. For this, the retardation to be set at the 532 nm wavelength needs to be determined. The detailed calibration procedure and steps are described in refs. [38,39]. Here, we summarized the main aspects in brief. The calibration relies on applying suitable values for the supply voltages of the LCRs for achieving λ /4 and λ /2 phase delays, respectively. All angles are aligned with respect to the first polarizer in the PSG which does not change its orientation during the whole process. The second polarizer is mounted in a motorized rotating holder and is then oriented perpendicular to the first one. Then, the first polarizer is manually set to 45° and the following steps are implemented: (i) the fast axes of all LCRs are calibrated to 0°; (ii) a λ /2 retardation is calibrated for all LCRs by the analysis of the relation between the applied supply voltage and the intensity at the sensor; and (iii) a λ /4 retardation is calibrated accordingly for LCR2 and LCR3 by using a quarter-wave-plate. The procedure is based on intensity measurements with the imaging camera acting as the sensor. The displayed inhomogeneity of the Mueller matrix entries in Figure 2 can be partly due to changes in the required phase delay over the aperture of the LCRs [40]. However, measurements of the homogeneous samples such as air or polarizers (not displayed in this work) show homogeneity over the illuminated field-of-view.

3. Results

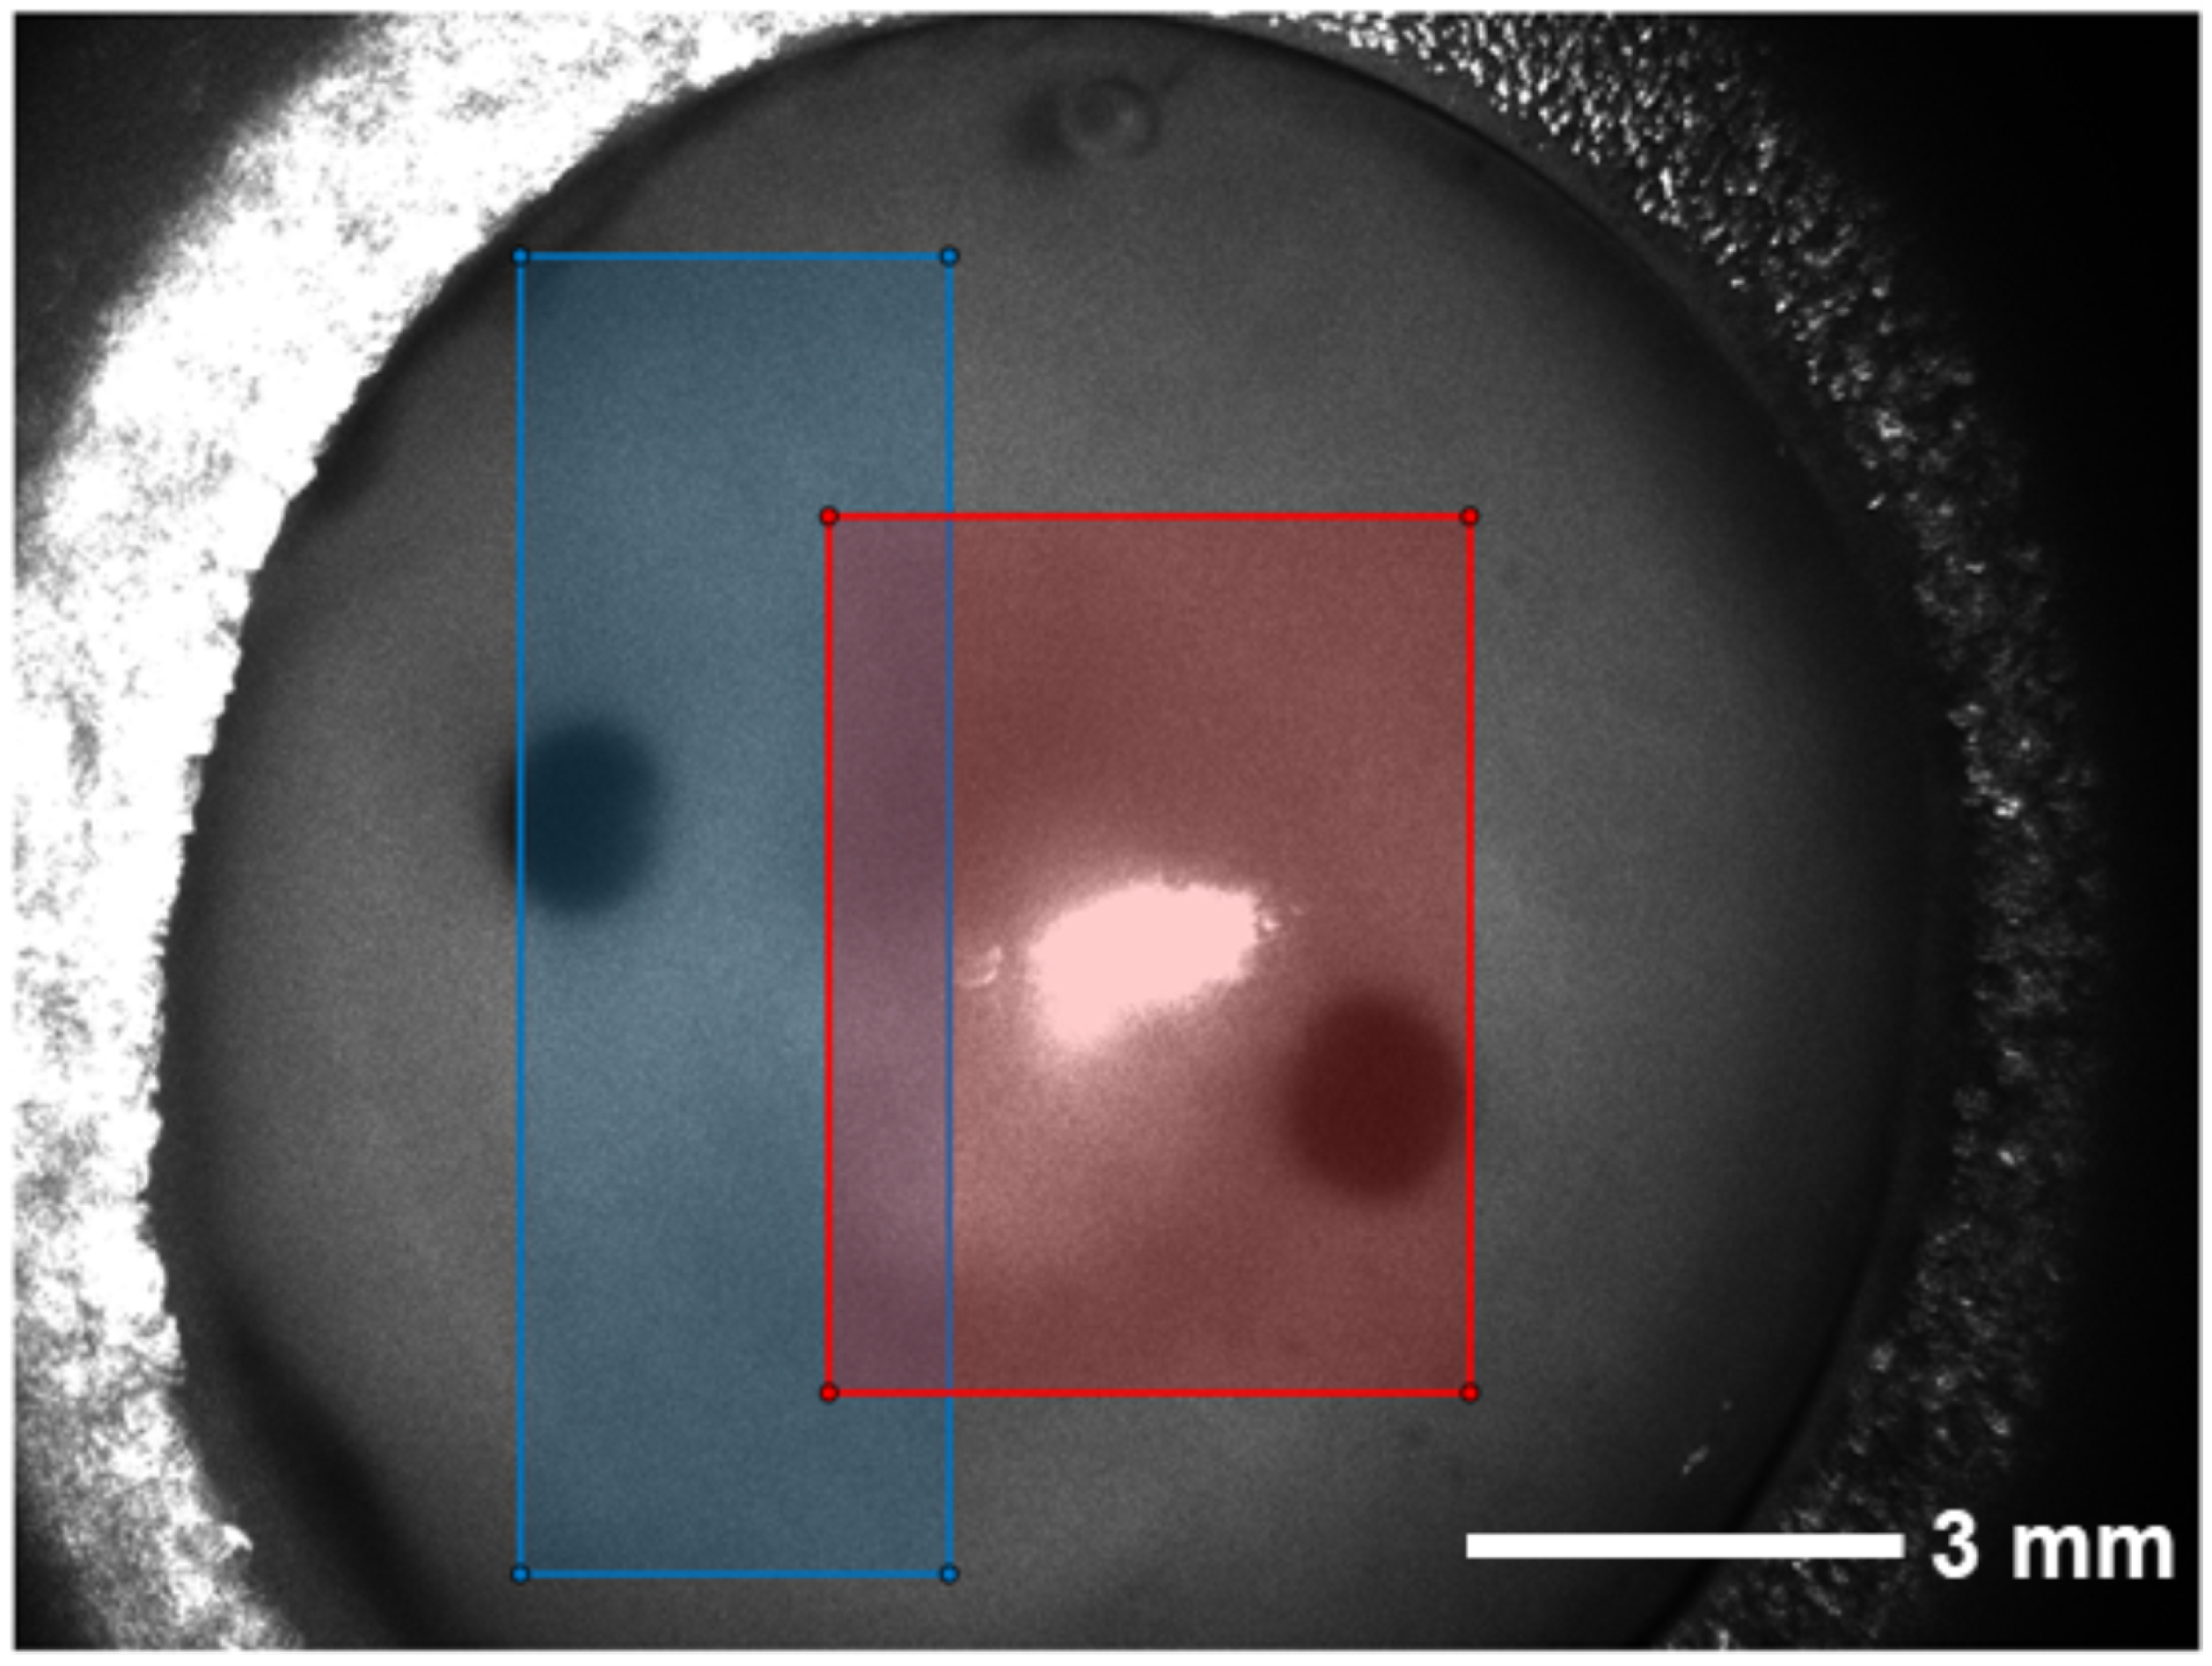
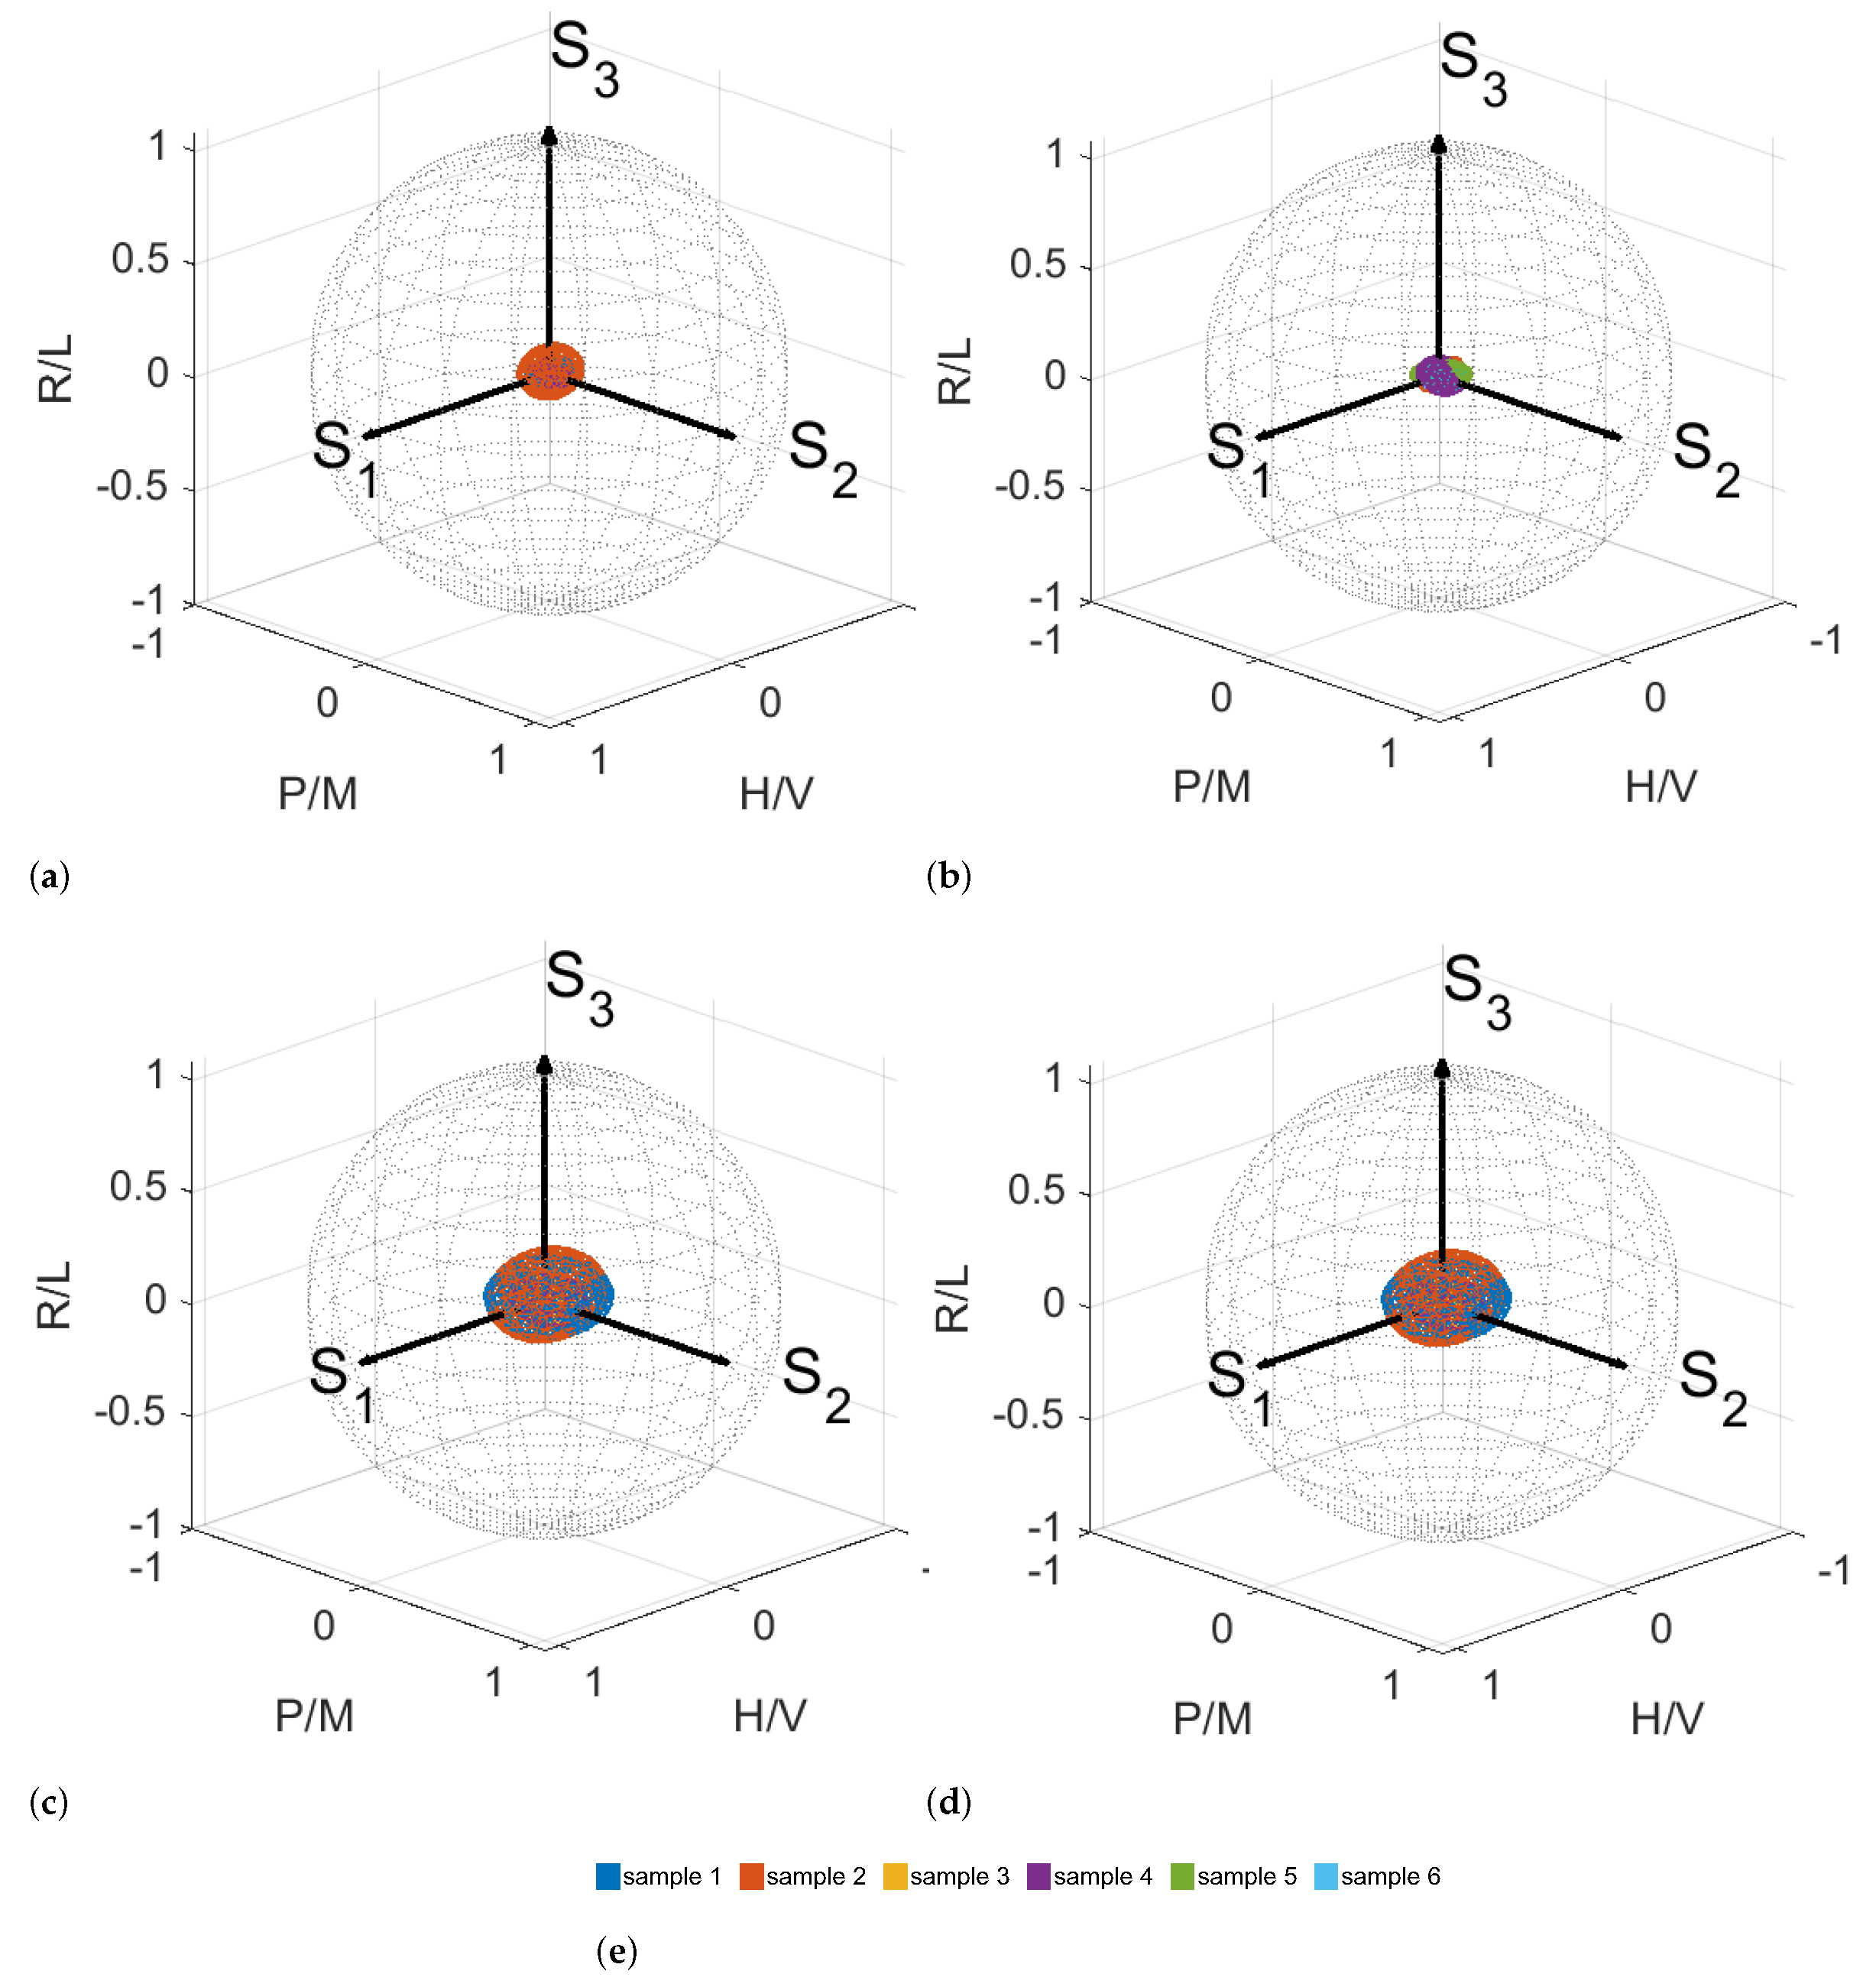
3.1. Polarimetry of Porcine Cornea in Transmission and Reflection Mode

In a first step, we recorded the MM of unmodified porcine cornea ex vivo by using our polarimetry system in transmission mode [20]. For this purpose, the cornea was carefully placed in a 3D printed ring holder. The result of a MM measurement with illumination at a wavelength of 532 nm is shown in Figure 2.
A clear non-zero signal can be seen in some diagonal and off-diagonal entries in the MM, with M ( 2 , 2 ) , M ( 2 , 3 ) , M ( 3 , 2 ) , M ( 3 , 3 ) and M ( 4 , 4 ) having the largest mean values. These values indicate the polarization-changing properties of the sample. The signals are not homogeneously distributed over the whole surface area of the cornea. This may be because the cornea cannot be held with tension in the current holder. Therefore, the surface remains curved. The birefringent properties of the cornea are already known from the literature [41]. Spatially resolved features and the anisotropy of the human cornea were shown using an imaging polarimeter, demonstrating negative biaxial material features [42,43]. It was clearly observed here that our polarimetry setup was capable of resolving spatial features on such samples. In order to improve similar measurements in the future, the special cornea sample holders consisting of spherically shaped quartz glass elements could be used.
The measurements, discussed in the remainder of this work, were carried out in reflection mode as shown in Figure 3 [38]. The effect of non-optimal sample fixation is smaller in this mode. Another reason is that the measurements in reflection mode are the only option for the needed in vivo measurements.
A photograph of the experimental setup used for this study is shown in Figure 3. The cornea is clamped in a specific holder that prevents it drying out. To do this, an artificial anterior chamber behind the cornea was filled with Dextran 500 soluble salt. Figure 4 shows a measurement image obtained with the polarization state HH of the illuminating source and detector, as ensured by the PSG and PSA elements.
An overexposed area can be seen in the center of the cornea. Since the cornea is not planar, there is always a part of the surface for which the angle of incidence of the exposure source is equal to the angle of reflection to the detector. From this area, a part of the light is directly reflected from the surface of the sample and causes the overexposure of the CCD camera sensor. A circular, dark area located on the left side of the cornea image stems from the opening to the rear chamber through which fluid exchange can be realized.
From the setup it is clear that the hemispheric shape of the cornea needs to be considered. The effects of polarized light incident to a curved surface can be a source of measurement error. For the following measurements, we tried to reduce the influence of the hemispheric shape by maintaining the same relative orientation for each sample. We assumed that the radius of the curvature of the cornea was approximately constant for the different samples.

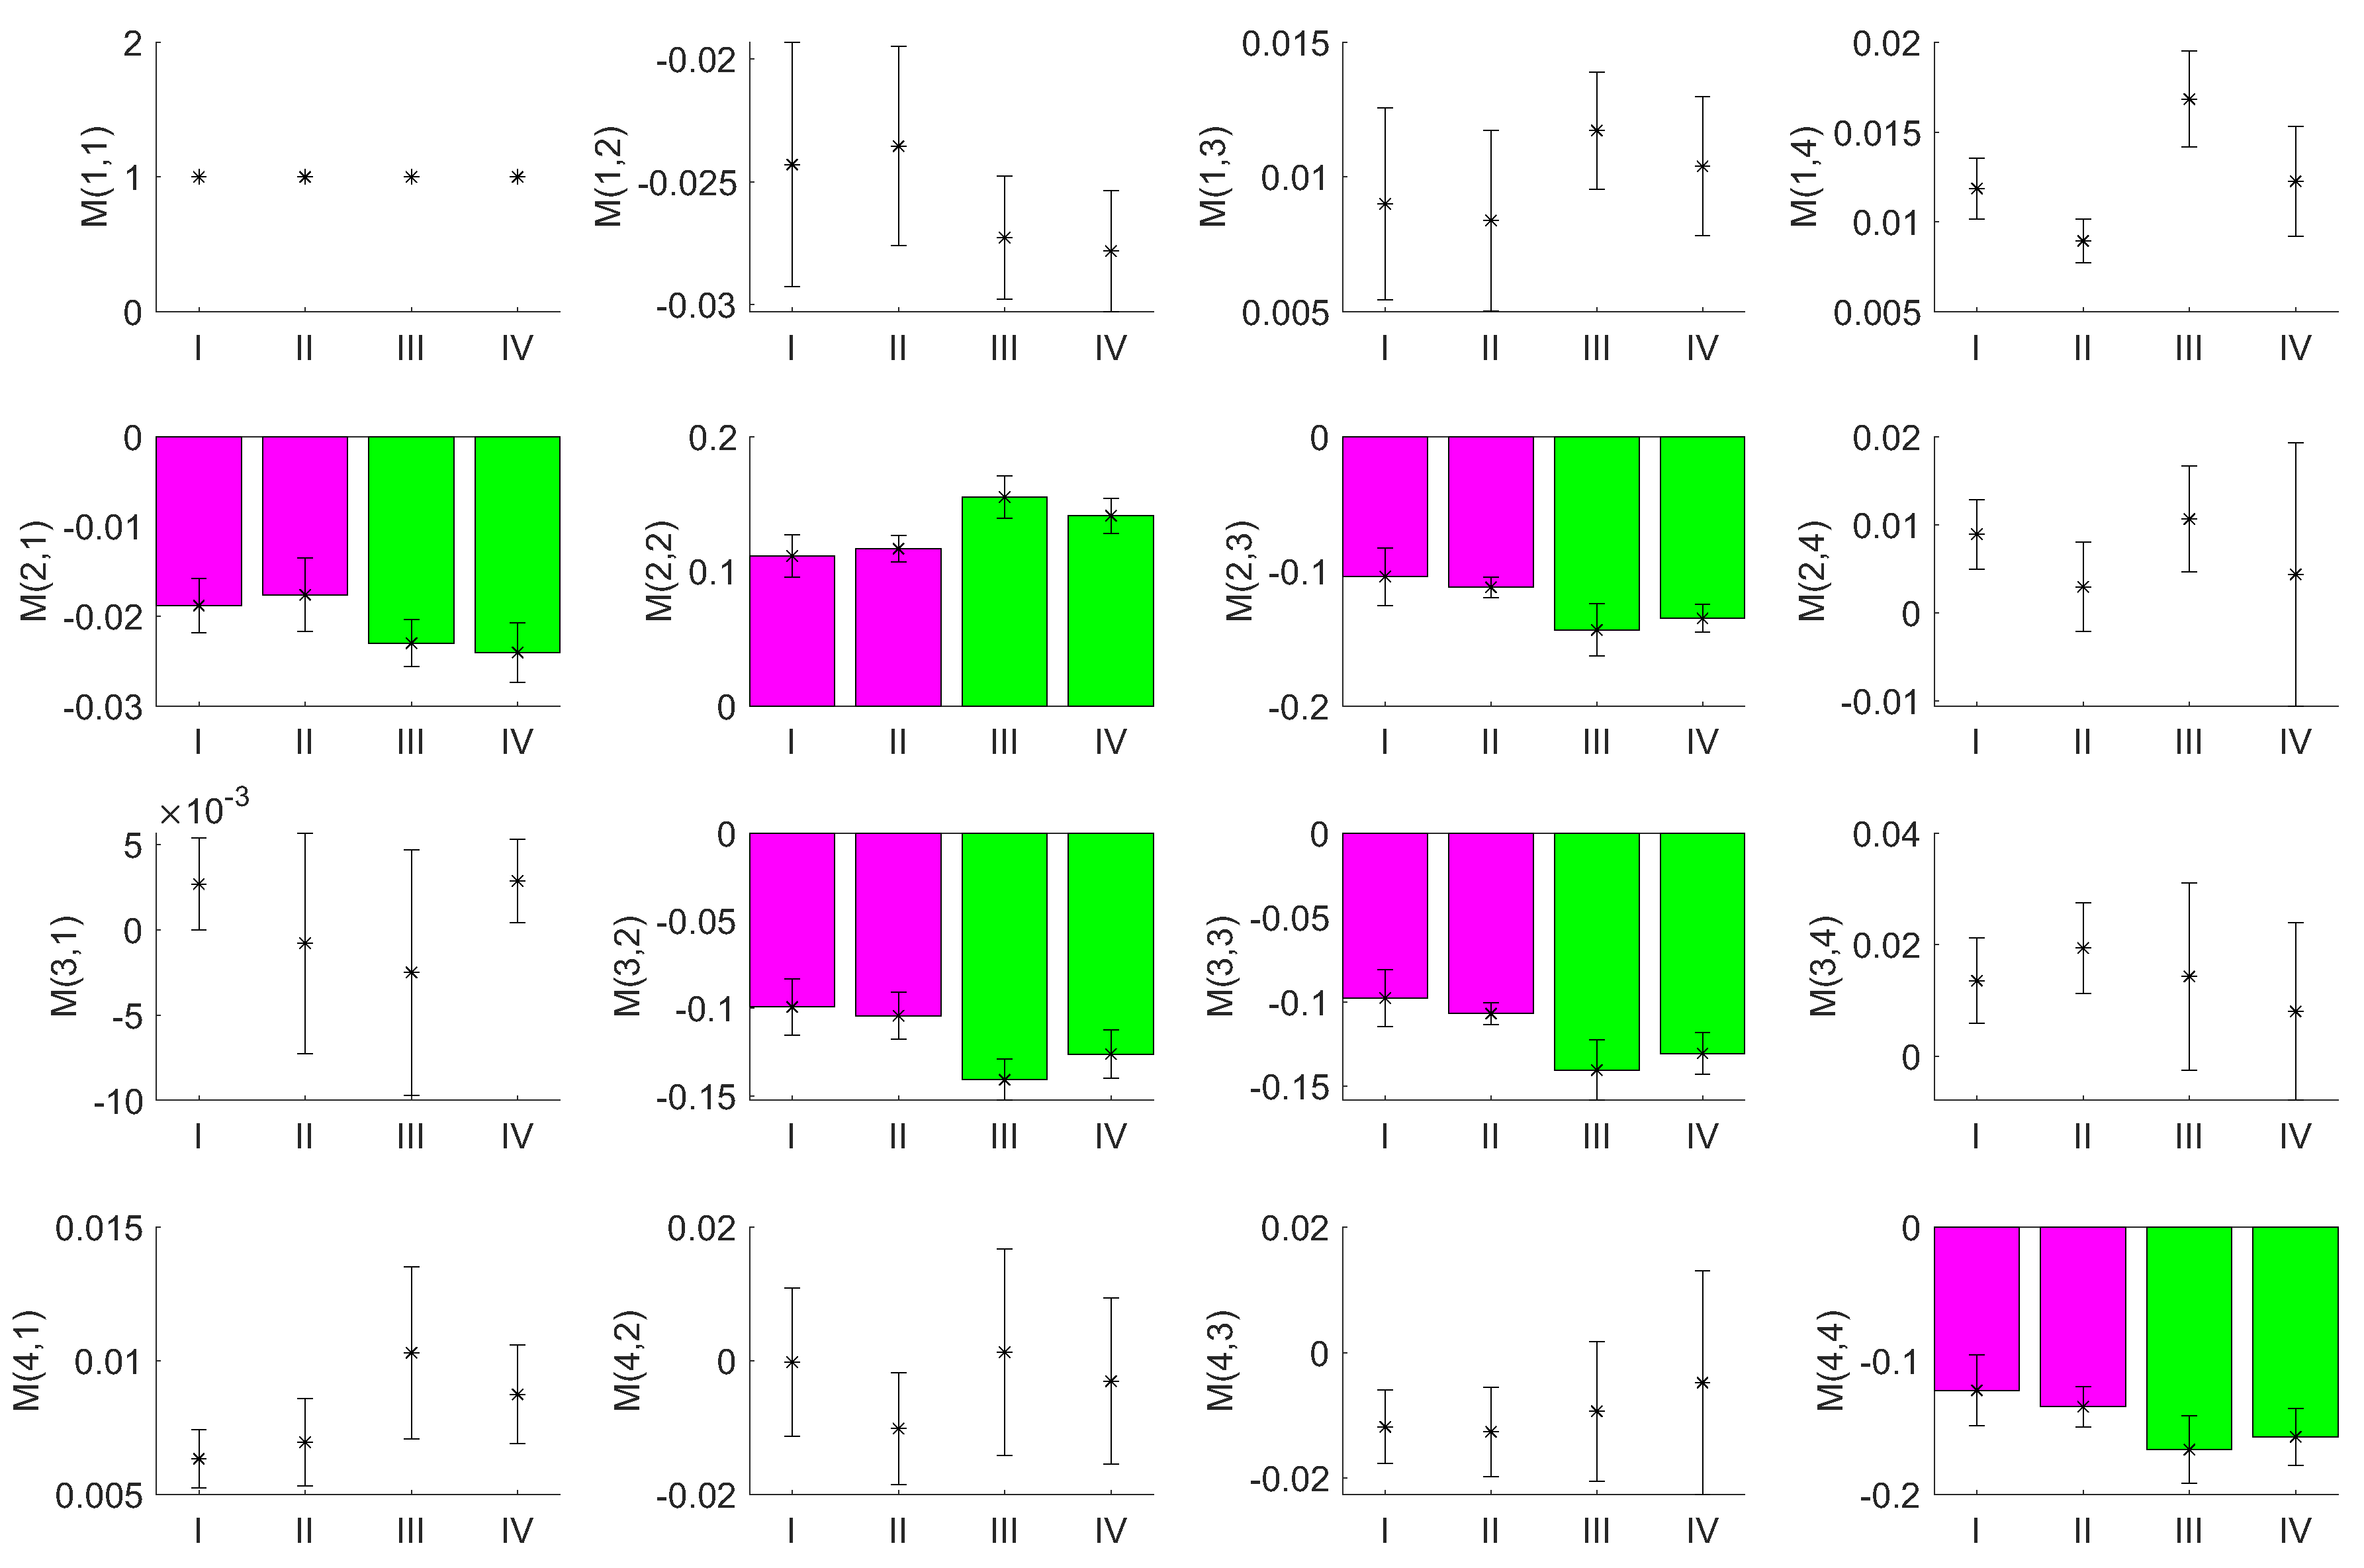
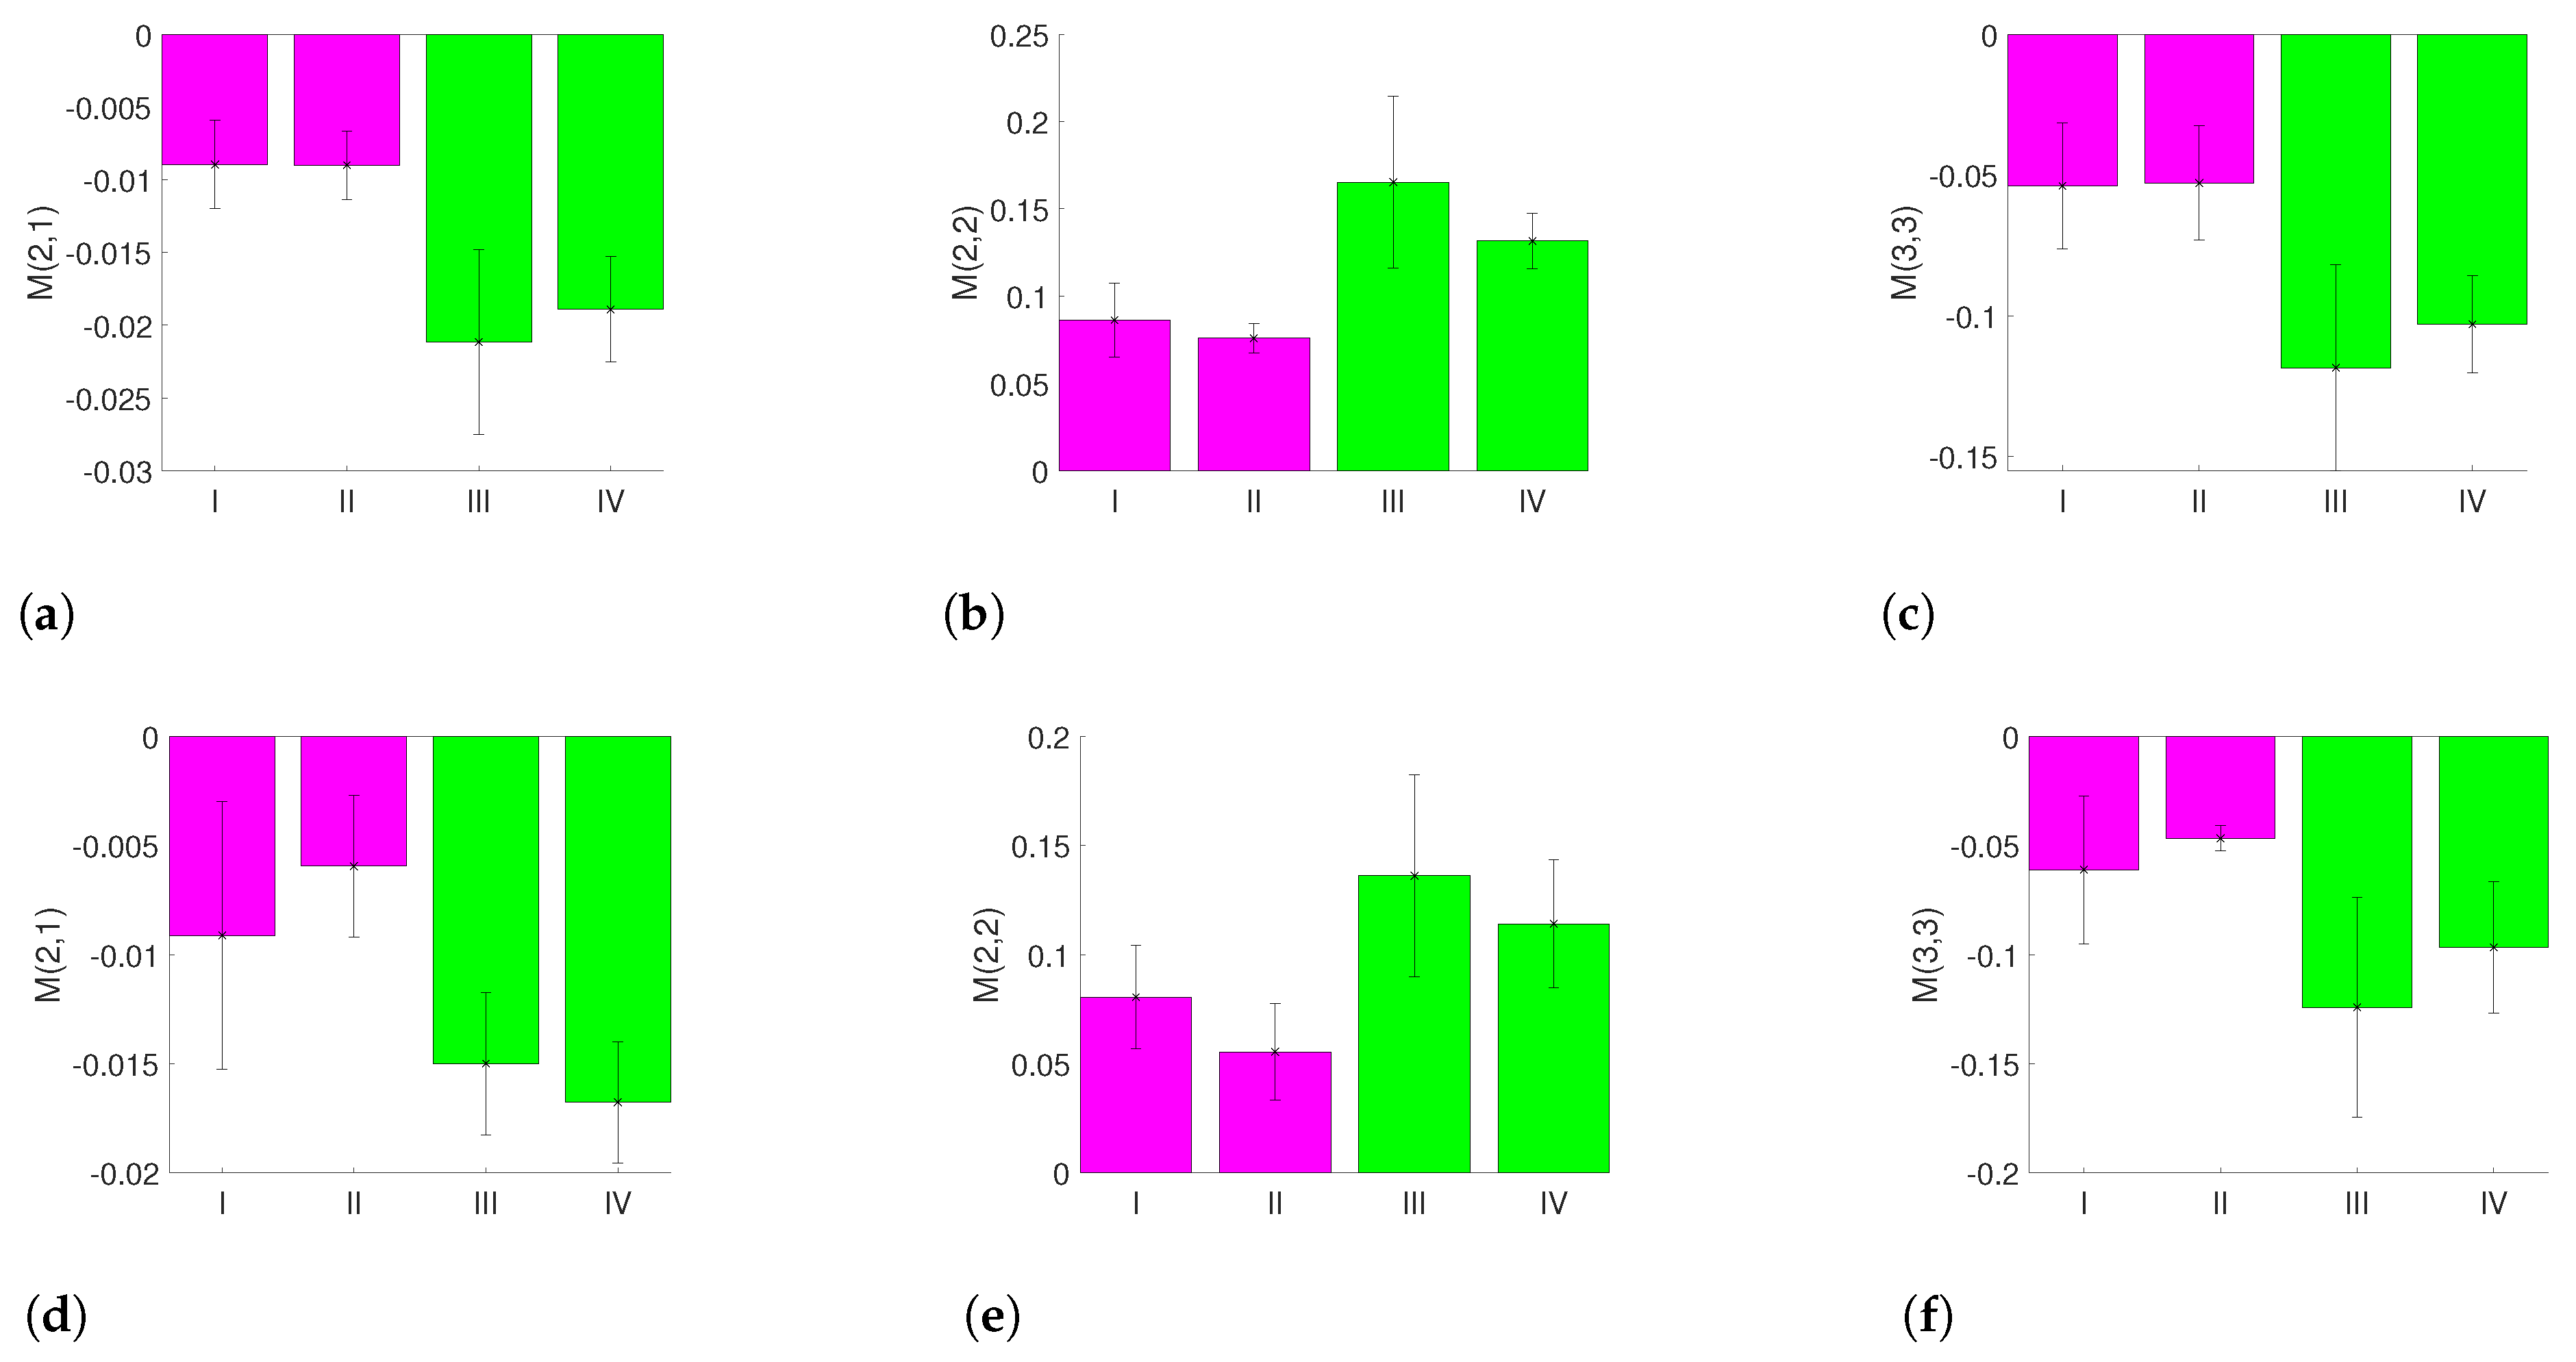
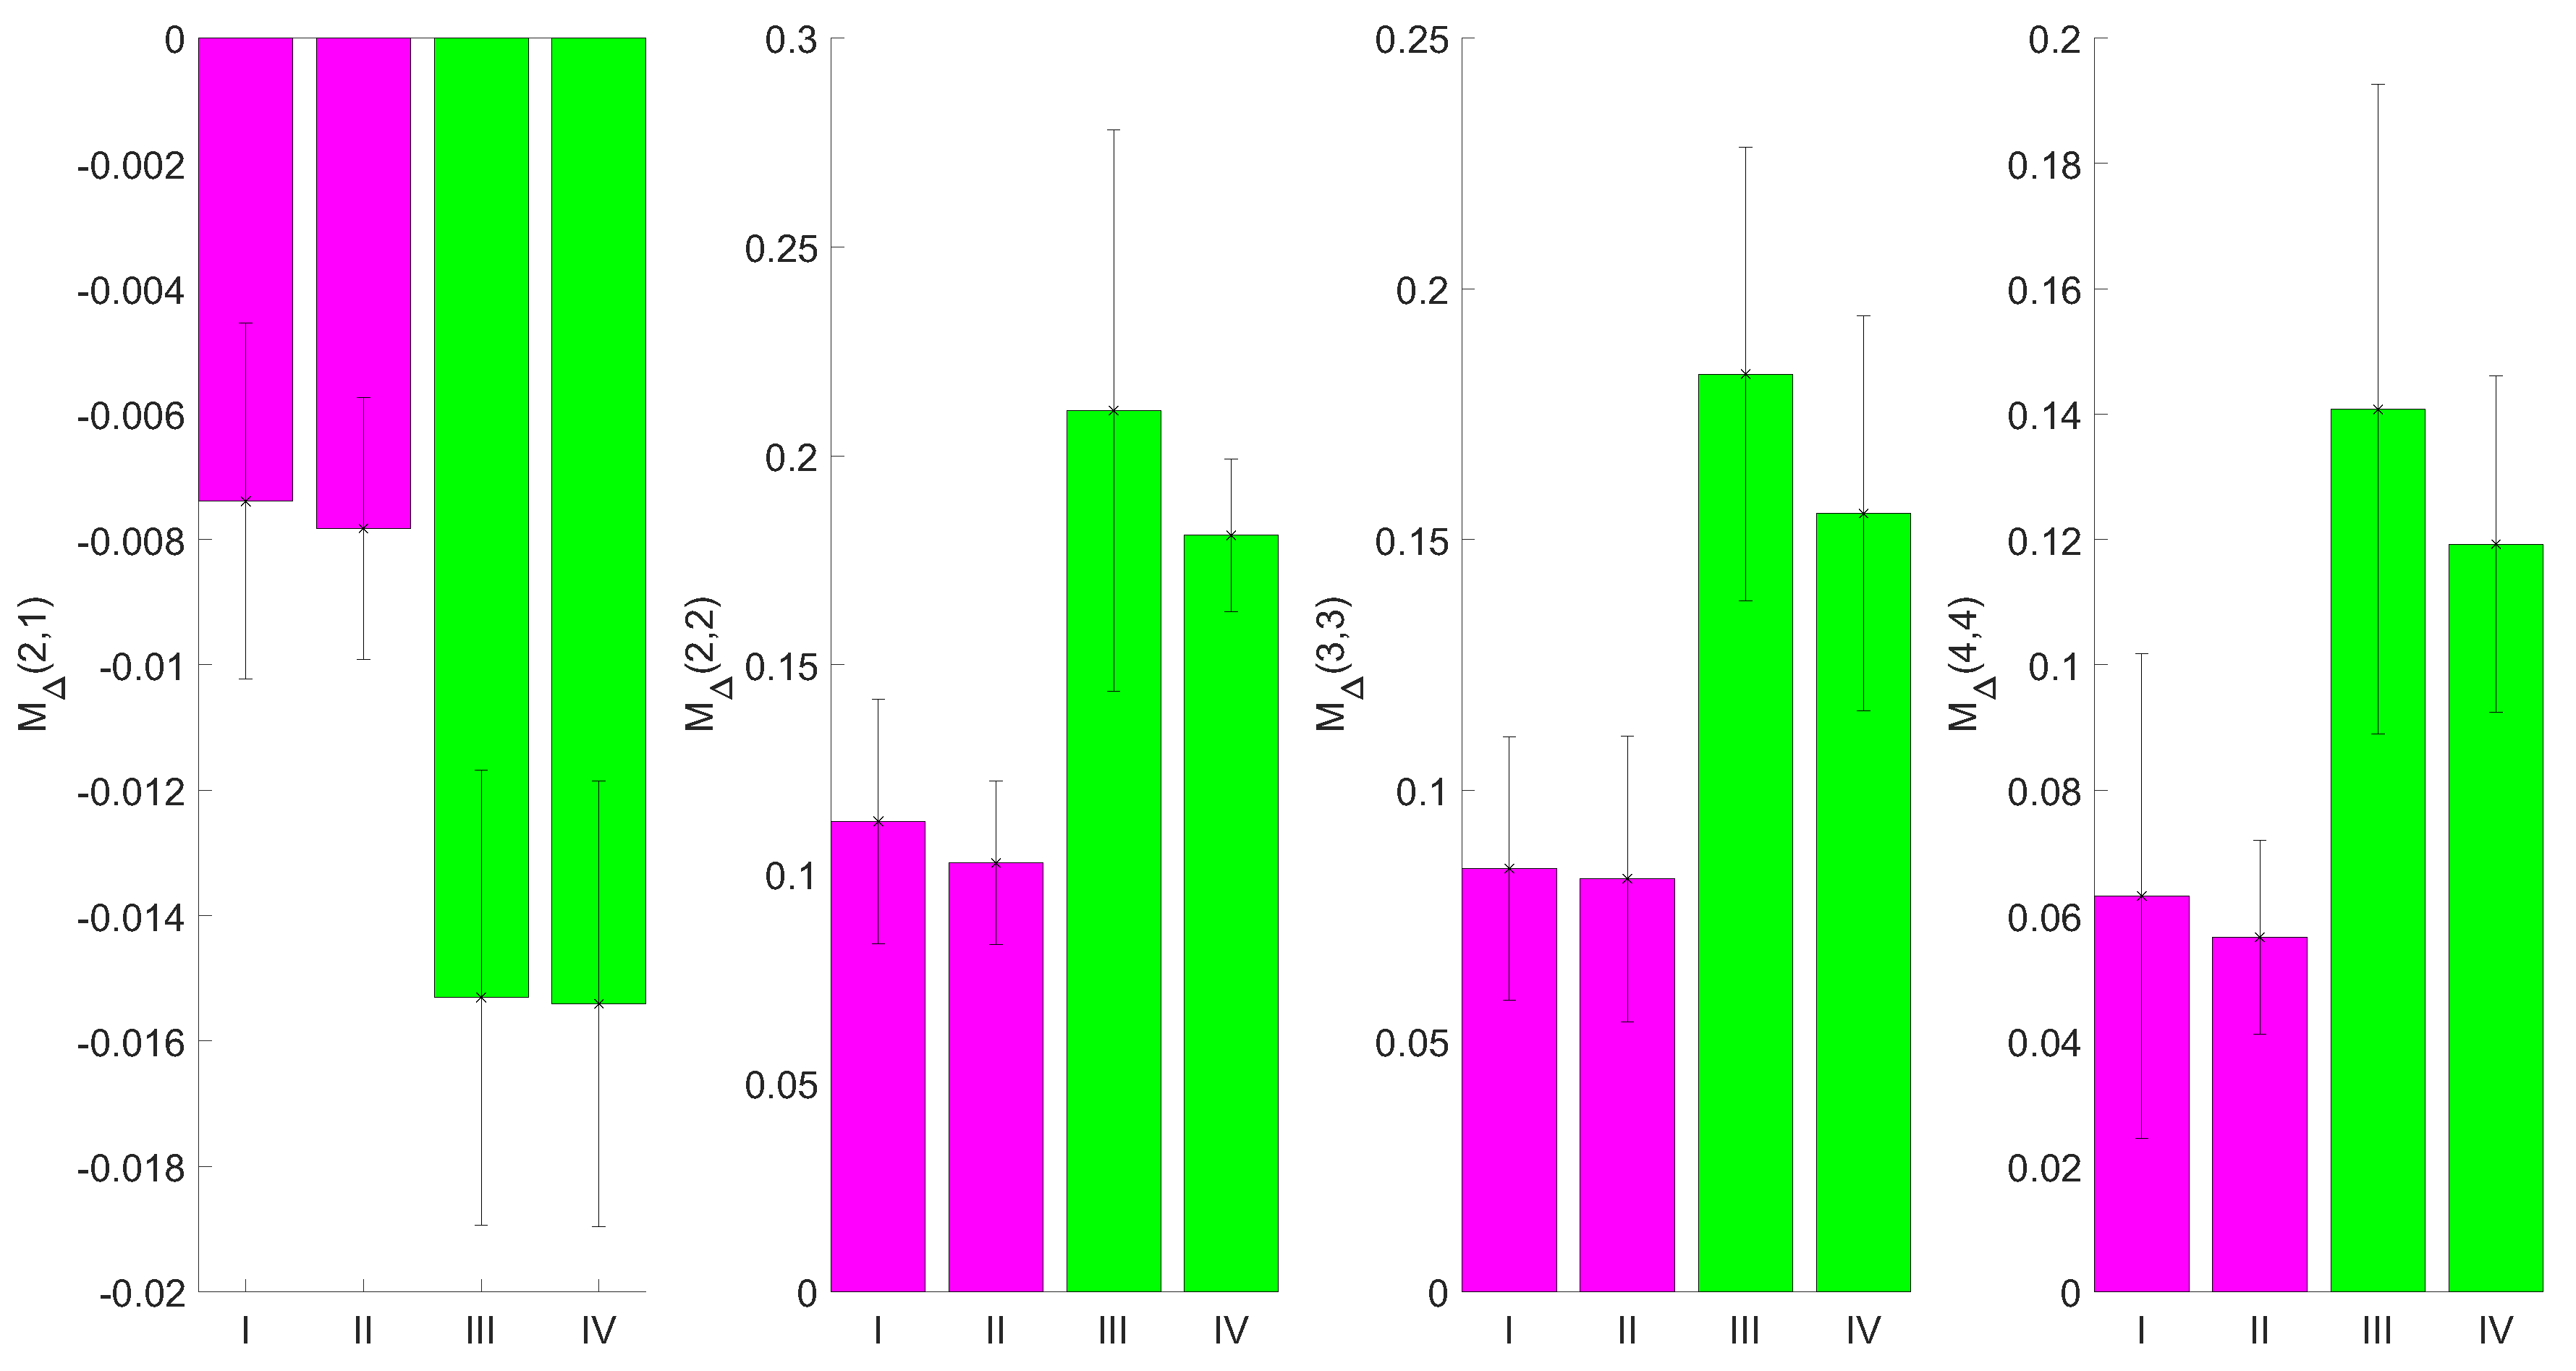
3.2. Mueller Matrix Measurements Ex Vivo

Porcine samples prepared as described in Section 3.1 were used for the study presented in this work. A distinction was made between the four measurement conditions as specified in Table 2.
Noticeable corneal collagen cross-linking (CXL) should only take place in the last group of samples (IV), i.e., the established procedure for photo-induced cross-linking. The remaining conditions are intended for reference and cross-checking. A total of nine cornea samples were available in the first series of measurements. Through the multiple sample use, a sample size of n = 4 can be achieved in all measurement conditions. Five cornea samples were available for the group without riboflavin exposure but with UV radiation. This is because one sample was not used several times to rule out the influence of multiple use on the measurement. The other cornea samples were measured first without UV irradiation and then with UV irradiation. Care was taken to keep the timing for the preparation of the measurements constant. This was important to minimize the influence of drying out of the cornea samples during the measurement.
The results of the measurements are displayed in Figure 5. There, the mean values obtained for each MM entry are plotted with the standard deviation. For the calculation, we used the whole images as the input. The series of measurements were grouped for samples that were not prepared with riboflavin (conditions I and II) and those that were prepared with riboflavin (conditions III and IV).
It is obvious that even for the small number of samples investigated, the MM entries for the elements M ( 2 , 1 ) , M ( 2 , 2 ) , M ( 2 , 3 ) , M ( 3 , 2 ) , M ( 3 , 3 ) , and M ( 4 , 4 ) differed between the two groups as a consequence of CXL due to the application of riboflavin and UV irradiation, whereas they are quite similar for all other MM entries. Matching to the results of the measurement in transmission mode, these elements also show the largest mean values, with M ( 2 , 2 ) , M ( 2 , 3 ) , M ( 3 , 2 ) , M ( 3 , 3 ) representing the entries constructed from linear polarized light states. In contrast, M ( 4 , 4 ) was obtained from circular polarized light states. Especially in M ( 2 , 2 ) and M ( 3 , 3 ) , the results between the measurements with and without riboflavin differed even for the small number samples. However, the measurement data for conditions III and IV should differ from each other as well, as in the former case, UV irradiation was not applied and the effects of the cross-linking should be smaller.
As the area of the holder does not contain information about the CXL process, it can be omitted. For the calculation of the MM entries, we crop the images as shown in Figure 4. The blue area is the largest continuous rectangle that does not contain the reflection region. Thus, the maximal number of pixels can be evaluated. For the processing, it is beneficial in the current approach to evaluate rectangular areas of the same size only. If only the measurement data from the blue area is used, the entries M ( 2 , 1 ) , M ( 2 , 2 ) and M ( 3 , 3 ) show a clear difference between the measurements with and without riboflavin (Figure 6a–c). If only the measurement data from the red area are taken into account, the same difference is less obvious (Figure 6d–f).
For the calculated R, P and Δ metrics, a difference between the measurement conditions I, II and III, IV can be found for P and Δ after a reduction in the measurement data to the certain areas specified in Figure 4. The results are displayed in Figure 7.
This indicates that the signal-to-noise-ratio can be improved by the careful choice of the region of interest segmentation for the input images and that the effect of the CXL is measurable with the MM setup. The polar decomposed MMs can show the effect of CXL after adding riboflavin and treating the samples with UV irradiation as well. This can be derived from the comparison of the matrix entries of M D and M Δ . For the entries of M D (not displayed), the elements M ( 1 , 2 ) , M ( 1 , 4 ) , M ( 2 , 1 ) , M ( 2 , 4 ) , M ( 3 , 3 ) , M ( 3 , 4 ) , M ( 4 , 1 ) , M ( 4 , 2 ) , M ( 4 , 3 ) and M ( 4 , 4 ) show differences between the samples with and without riboflavin treatment. Similarly to the results for M D , there is a difference between the samples with and without riboflavin treatment for the entries of M Δ in the elements M ( 2 , 1 ) , M ( 2 , 2 ) , M ( 3 , 3 ) and M ( 4 , 4 ) as displayed in Figure 8.
The analysis of the decomposed MMs shows that the difference between measurement conditions I, II, and III, IV can also be derived after the polar decomposition of the MMs. As shown in [20] the degree of orientation of the samples, in this case polymer fibers, is related to the Mueller matrix and its decomposition. In the present work, the changes displayed in Figure 7 and Figure 8 might be attributed to the changes in the orientation of the collagen fibers in the cornea. The structural changes due to the induced corneal collagen cross-linking, leading to a higher degree of orientation, might increase the polarizance and decrease the depolarization power—both of which are observable as macroscopic effects.
As a practical way to quantify and to distinguish the polarization states of corneal collagen cross-linking, a Poincaré sphere is used [44]. Such representation has been used for the diagnosis and classification of cancer tissues [45]. To visualize the measured MMs from the four different measurement conditions, we generated 50,000 Stokes vectors which are uniformly distributed within the Poincaré sphere. Each of these Stokes vectors is multiplied with the visualized MM. The resulting Stokes vectors are plotted in the Poincaré sphere. The obtained surfaces in the Poincaré sphere are displayed in Figure 9. Every color refers to the MM of a different sample.
In Figure 9, it can be seen that the MMs occupy different spaces within the Poincaré sphere. The influence of the riboflavin is visible. The radius of the ellipsoids can be related to the degree of polarization. The larger the radii, the higher the degree of polarization is. We cannot yet separate measurement conditions III and IV, which would also be the case if the MM occupies a certain space in the Poincaré sphere solely. In further work, the standard deviation can be taken into account if the sample size can be increased. There might be room for the further optimization of the choice of the region of interest for the measurement data that is used for the calculation of MMs as well as the metrics derived from the MM. Another approach would be the calculation of another metric that enhances the contrast between measurements III and IV. The visualization within the Poincaré sphere remains a promising approach. Due to the scatter of the data and the small number of samples available, the difference between the two cases of riboflavin with and without UV irradiation is not yet obvious for the whole measurement data as well as selected measurement data. We attribute the observed behavior to the possible cross-linking from ambient UV irradiation that we cannot completely rule out. This will be studied in detail in the next steps using an improved fixation and housing setup and on a larger amount of samples. The measurement results, however, indicate that the effects of the CXL treatment, which is established in medicine for strengthening the mechanical properties of the cornea, can be investigated with the MM polarimetry, as proposed here.

4. Summary and Outlook

In this work, we reported MM measurements on non-planar collagen containing animal tissue, i.e., ex vivo porcine corneas. We developed a setup which allowed for the investigation of such samples in transmission and reflection mode capable of spatially resolving the inhomogeneities of the sample or the effect of photo-induced processes. The application of riboflavin followed by UV exposure along the Dresden protocol leads to noticeable changes in the MM entries indicating that these can be correlated with the photo-induced cross-linking. Furthermore, we found that the careful choice of the region-of-interest segmentation, i.e., removing overexposed areas as well as bright patches on the surface originating from impurities, leads to an improved analysis. The polarization decomposition metrics point towards changes induced by the CXL. This indicates that the results of subtle processes occurring in such media can be observed using non-invasive MM polarimetry in reflection mode. One potential application of such polarimetric measurements may address the detection of the photo-induced cross-linking of collagen fibers in the human corneas in vivo [46]. This procedure, applied to increase the mechanical stability of the cornea, was employed as therapy for various diseases in ophthalmology and demands for better monitoring technologies. Furthermore, the studies of the change of collagen texture in scars to monitor wound healing appear feasible [47]. However, better systematic quantification is required in the future steps to improve the insight into photo-induced processes as well as the dynamics of cross-linking. For the measurement setup and procedure, several improvements are reasonable to overcome the current limitations. For example, an improved mechanical holder can be developed including a spherically shaped quartz glass form to induce tension in the cornea sample tissue [48]. In the future, the analysis of the statistical moments of the distributions of individual MM elements may reveal static and dynamic changes for the cornea samples and enhance accuracy [49]. In addition, exposure bracketing can be applied to reduce overexposed areas. Also, the visualization of the MMs within the Poincaré sphere remains a promising approach for the quantitative manifestation of the physical changes of sample targets. Experimentally, the polarimetric measurements could be compared with data from Brillouin spectroscopy to better correlate the optical and mechanical properties of biotissue for further validation [50].

Author Contributions

Conceptualization, D.F. and B.R.; data curation, G.S. and L.J.; data/formal analysis, L.J., G.S. and D.F.; funding acquisition, B.R.; experimentation, D.F. and M.F.; methodology, D.F., M.W. and B.R.; software, D.F., L.J. and G.S.; supervision, M.W. and B.R.; visualization, L.J., D.F. and G.S.; writing—original draft, D.F. and B.R.; draft editing, G.S., L.J., B.R. and M.F.; writing—review and editing, all authors. All authors have read and agreed to the published version of the manuscript.

Funding

This project was funded by the Lower Saxony Ministry for Culture and Science (MWK) through the program Tailored Light and the Deutsche Forschungsgemeinschaft (DFG, German Research Foundation) under Germany’s Excellence Strategy within the Cluster of Excellence PhoenixD (EXC 2122, Project ID 390833453).

Institutional Review Board Statement

Ethical review and approval were waived for this study, due to the fact that the samples can be considered slaughterhouse waste.

Informed Consent Statement

Not applicable.

Data Availability Statement

The data presented in this study are available on request from the corresponding author. The data are not publicly available due to the size of the dataset.

Acknowledgments

The authors thank Timm Landes for his experimental support.

Conflicts of Interest

The authors declare no conflict of interest.

References

  1. Scarcelli, G.; Kling, S.; Quijano, E.; Pineda, R.; Marcos, S.; Yun, S.H. Brillouin microscopy of collagen crosslinking: Noncontact depth-dependent analysis of corneal elastic modulus. Investig. Ophthalmol. Vis. Sci. 2013, 54, 1418–1425. [Google Scholar] [CrossRef] [PubMed] [Green Version]
  2. Doors, M.; Tahzib, N.G.; Eggink, F.A.; Berendschot, T.T.J.M.; Webers, C.A.B.; Nuijts, R.M.M.A. Use of anterior segment optical coherence tomography to study corneal changes after collagen cross-linking. Am. J. Ophthalmol. 2009, 148, 844–851.e2. [Google Scholar] [CrossRef]
  3. Singh, M.; Li, J.; Vantipalli, S.; Han, Z.; Larin, K.V.; Twa, M.D. Optical coherence elastography for evaluating customized riboflavin/UV-A corneal collagen crosslinking. J. Biomed. Opt. 2017, 22, 91504. [Google Scholar] [CrossRef]
  4. Zhou, Y.; Wang, Y.; Shen, M.; Jin, Z.; Chen, Y.; Zhou, Y.; Qu, J.; Zhu, D. In vivo evaluation of corneal biomechanical properties by optical coherence elastography at different cross-linking irradiances. J. Biomed. Opt. 2019, 24, 1–7. [Google Scholar] [CrossRef]
  5. Mazzotta, C.; Traversi, C.; Baiocchi, S.; Caporossi, O.; Bovone, C.; Sparano, M.C.; Balestrazzi, A.; Caporossi, A. Corneal healing after riboflavin ultraviolet-A collagen cross-linking determined by confocal laser scanning microscopy in vivo: Early and late modifications. Am. J. Ophthalmol. 2008, 146, 527–533. [Google Scholar] [CrossRef]
  6. Zherebtsov, E.; Dremin, V.; Popov, A.; Doronin, A.; Kurakina, D.; Kirillin, M.; Meglinski, I.; Bykov, A. Hyperspectral imaging of human skin aided by artificial neural networks. Biomed. Opt. Express 2019, 10, 3545–3559. [Google Scholar] [CrossRef] [PubMed] [Green Version]
  7. Batista, A.; Breunig, H.G.; Hager, T.; Seitz, B.; König, K. Early evaluation of corneal collagen crosslinking in ex vivo human corneas using two-photon imaging. Sci. Rep. 2019, 9, 10241. [Google Scholar] [CrossRef] [PubMed] [Green Version]
  8. Myllylä, T.; Harju, M.; Korhonen, V.; Bykov, A.; Kiviniemi, V.; Meglinski, I. Assessment of the dynamics of human glymphatic system by near-infrared spectroscopy. J. Biophotonics 2018, 11, e201700123. [Google Scholar] [CrossRef] [PubMed]
  9. Kunnen, B.; Macdonald, C.; Doronin, A.; Jacques, S.; Eccles, M.; Meglinski, I. Application of circularly polarized light for non-invasive diagnosis of cancerous tissues and turbid tissue-like scattering media. J. Biophotonics 2015, 8, 317–323. [Google Scholar] [CrossRef]
  10. Greenfield, D.S.; Knighton, R.W.; Huang, X.R. Effect of corneal polarization axis on assessment of retinal nerve fiber layer thickness by scanning laser polarimetry. Am. J. Ophthalmol. 2000, 129, 715–722. [Google Scholar] [CrossRef]
  11. Gross, C.T.; Salamon, H.; Hunt, A.J.; Macey, R.I.; Orme, F.; Quintanilha, A.T. Hemoglobin polymerization in sickle cells studied by circular polarized light scattering. Biochim. Biophys. Acta (BBA) Protein Struct. Mol. Enzymol. 1991, 1079, 152–160. [Google Scholar] [CrossRef]
  12. Gurjar, R.S.; Backman, V.; Perelman, L.T.; Georgakoudi, I.; Badizadegan, K.; Itzkan, I.; Dasari, R.R.; Feld, M.S. Imaging human epithelial properties with polarized light-scattering spectroscopy. Nat. Med. 2001, 7, 1245–1248. [Google Scholar] [CrossRef]
  13. Tuchin, V.V. Polarized light interaction with tissues. J. Biomed. Opt. 2016, 21, 071114. [Google Scholar] [CrossRef] [Green Version]
  14. Weinreb, R.N.; Bowd, C.; Greenfield, D.S.; Zangwill, L.M. Measurement of the magnitude and axis of corneal polarization with scanning laser polarimetry. Arch. Ophthalmol. 2002, 120, 901–906. [Google Scholar] [CrossRef] [PubMed] [Green Version]
  15. Randleman, J.B.; Khandelwal, S.S.; Hafezi, F. Corneal cross-linking. Surv. Ophthalmol. 2015, 60, 509–523. [Google Scholar] [CrossRef]
  16. Kymionis, G.D.; Grentzelos, M.A.; Plaka, A.D.; Tsoulnaras, K.I.; Diakonis, V.F.; Liakopoulos, D.A.; Kankariya, V.P.; Pallikaris, A.I. Correlation of the corneal collagen cross-linking demarcation line using confocal microscopy and anterior segment optical coherence tomography in keratoconic patients. Am. J. Ophthalmol. 2014, 157, 110–115.e1. [Google Scholar] [CrossRef] [PubMed]
  17. Jouve, L.; Borderie, V.; Sandali, O.; Temstet, C.; Basli, E.; Laroche, L.; Bouheraoua, N. Conventional and Iontophoresis Corneal Cross-Linking for Keratoconus: Efficacy and Assessment by Optical Coherence Tomography and Confocal Microscopy. Cornea 2017, 36, 153–162. [Google Scholar] [CrossRef]
  18. Chai, D.; Gaster, R.N.; Roizenblatt, R.; Juhasz, T.; Brown, D.J.; Jester, J.V. Quantitative assessment of UVA-riboflavin corneal cross-linking using nonlinear optical microscopy. Investig. Ophthalmol. Vis. Sci. 2011, 52, 4231–4238. [Google Scholar] [CrossRef]
  19. Fricke, D.; Denker, E.; Heratizadeh, A.; Werfel, T.; Wollweber, M.; Roth, B. Non-Contact Dermatoscope with Ultra-Bright Light Source and Liquid Lens-Based Autofocus Function. Appl. Sci. 2019, 9, 2177. [Google Scholar] [CrossRef] [Green Version]
  20. Fricke, D.; Becker, A.; Jütte, L.; Bode, M.; de Cassan, D.; Wollweber, M.; Glasmacher, B.; Roth, B. Mueller Matrix Measurement of Electrospun Fiber Scaffolds for Tissue Engineering. Polymers 2019, 11, 2026. [Google Scholar] [CrossRef] [Green Version]
  21. Borovkova, M.; Bykov, A.; Popov, A.; Pierangelo, A.; Novikova, T.; Pahnke, J.; Meglinski, I. Evaluating b-amyloidosis progression in Alzheimer’s disease with Mueller polarimetry. Biomed. Opt. Express 2020, 11, 4509–4519. [Google Scholar] [CrossRef] [PubMed]
  22. Peyvasteh, M.; Popov, A.; Bykov, A.; Pierangelo, A.; Novikova, T.; Meglinski, I. Evolution of raw meat polarization-based properties by means of Mueller matrix imaging. J. Biophotonics 2021, 14, e202000376. [Google Scholar] [CrossRef]
  23. Borovkova, M.; Peyvasteh, M.; Dubolazov, O.; Ushenko, Y.; Ushenko, V.; Bykov, A.; Deby, S.; Rehbinder, J.; Novikova, T.; Meglinski, I. Complementary analysis of Mueller-matrix images of optically anisotropic highly scattering biological tissues. J. Eur. Opt. Soc. Rapid Publ. 2018, 14, 287. [Google Scholar] [CrossRef]
  24. Dong, Y.; He, H.; Sheng, W.; Wu, J.; Ma, H. A quantitative and non-contact technique to characterise microstructural variations of skin tissues during photo-damaging process based on Mueller matrix polarimetry. Sci. Rep. 2017, 7, 14702. [Google Scholar] [CrossRef] [PubMed] [Green Version]
  25. Antonelli, M.R.; Pierangelo, A.; Novikova, T.; Validire, P.; Benali, A.; Gayet, B.; de Martino, A. Mueller matrix imaging of human colon tissue for cancer diagnostics: How Monte Carlo modeling can help in the interpretation of experimental data. Opt. Express 2010, 18, 10200–10208. [Google Scholar] [CrossRef]
  26. Meinhardt-Wollweber, M.; Heratizadeh, A.; Basu, C.; Günther, A.; Schlangen, S.; Werfel, T.; Schacht, V.; Emmert, S.; Haenssle, H.A.; Roth, B. A non-contact remote digital dermoscope to support cancer screening and diagnosis of inflammatory skin disease. Biomed. Phys. Eng. Express 2017, 3, 055005. [Google Scholar] [CrossRef]
  27. Heratizadeh, A.; Fricke, D.; Meinhardt-Wollweber, M.; Roth, B.; Werfel, T. Non-contact remote digital dermoscopy—New perspectives on differential diagnosis of inflammatory skin diseases. J. Eur. Acad. Dermatol. Venereol. 2020, 34, e125–e126. [Google Scholar] [CrossRef]
  28. Wang, Q.; Liu, W.; Chen, X.; Wang, X.; Chen, G.; Zhu, X. Quantification of scar collagen texture and prediction of scar development via second harmonic generation images and a generative adversarial network. Biomed. Opt. Express 2021, 12, 5305–5319. [Google Scholar] [CrossRef]
  29. Spoerl, E.; Huhle, M.; Seiler, T. Induction of cross-links in corneal tissue. Exp. Eye Res. 1998, 66, 97–103. [Google Scholar] [CrossRef] [PubMed]
  30. Spadea, L. Corneal collagen cross-linking with riboflavin and UVA irradiation in pellucid marginal degeneration. J. Refract. Surg. 2010, 26, 375–377. [Google Scholar] [CrossRef]
  31. Wernli, J.; Schumacher, S.; Spoerl, E.; Mrochen, M. The efficacy of corneal cross-linking shows a sudden decrease with very high intensity UV light and short treatment time. Investig. Ophthalmol. Vis. Sci. 2013, 54, 1176–1180. [Google Scholar] [CrossRef] [Green Version]
  32. Fallet, C.; Pierangelo, A.; Ossikovski, R.; de Martino, A. Experimental validation of the symmetric decomposition of Mueller matrices. Opt. Express 2010, 18, 831–842. [Google Scholar] [CrossRef] [PubMed]
  33. Angelo, P.; Sandeep, M.; Abdelali, B.; Maria, R.A.; Tatiana, N.; Pierre, V.; Brice, G.; De Martino, A. Use of Mueller polarimetric imaging for the staging of human colon cancer. SPIE 2011, 65–72. [Google Scholar] [CrossRef]
  34. Pierangelo, A.; Manhas, S.; Benali, A.; Fallet, C.; Totobenazara, J.L.; Antonelli, M.R.; Novikova, T.; Gayet, B.; de Martino, A.; Validire, P. Multispectral Mueller polarimetric imaging detecting residual cancer and cancer regression after neoadjuvant treatment for colorectal carcinomas. J. Biomed. Opt. 2013, 18, 046014. [Google Scholar] [CrossRef] [PubMed]
  35. Du, E.; He, H.; Zeng, N.A.; Liu, C.; Guo, Y.; Liao, R.A.; Sun, M.; He, Y.; Ma, H.U. Characteristic features of mueller matrix patterns for polarization scattering model of biological tissues. J. Innov. Opt. Health Sci. 2014, 7, 1350028. [Google Scholar] [CrossRef]
  36. Bickel, W.S.; Bailey, W.M. Stokes vectors, Mueller matrices, and polarized scattered light. Am. J. Phys. 1985, 53, 468–478. [Google Scholar] [CrossRef]
  37. Lu, S.Y.; Chipman, R.A. Interpretation of Mueller matrices based on polar decomposition. J. Opt. Soc. Am. A 1996, 13, 1106. [Google Scholar] [CrossRef]
  38. Fricke, D. Entwicklung einer dermatoskopischen Kamera mit Müller-Matrix-Bildgebung: Entwicklung einer dermatoskopischen Kamera mit Müller-Matrix-Bildgebung. Ph.D. Thesis, Institutional Repository of Leibniz University Hannover, Hannover, Germany, 2020. [Google Scholar] [CrossRef]
  39. Compain, E.; Poirier, S.; Drevillon, B. General and self-consistent method for the calibration of polarization modulators, polarimeters, and Mueller-matrix ellipsometers. Appl. Opt. 1999, 38, 3490. [Google Scholar] [CrossRef]
  40. Ramírez, C.N.; Montes-González, I.; Bruce, N.C.; López-Téllez, J.M.; Rodríguez-Herrera, O.G.; Rosete-Aguilar, M. Characterization of retardance spatial variations over the aperture of liquid-crystal variable retarders. Appl. Opt. 2021, 60, 2998–3005. [Google Scholar] [CrossRef] [PubMed]
  41. Knighton, R.W.; Huang, X.-R. Linear Birefringence of the Central Human Cornea. Investig. Ophthalmol. Vis. Sci. 2002, 43, 82–86. [Google Scholar]
  42. Bueno, J.M.; Vargas-Martín, F. Measurements of the corneal birefringence with a liquid-crystal imaging polariscope. Appl. Opt. 2002, 41, 116–124. [Google Scholar] [CrossRef]
  43. Bone, R.A.; Draper, G. Optical anisotropy of the human cornea determined with a polarizing microscope. Appl. Opt. 2007, 46, 8351–8357. [Google Scholar] [CrossRef]
  44. Ossikovski, R.; Gil, J.J.; San José, I. Poincaré sphere mapping by Mueller matrices. JOSA A 2013, 30, 2291–2305. [Google Scholar] [CrossRef]
  45. Zaffar, M.; Pradhan, A. Mapping of retardance, diattenuation and polarizance vector on Poincare sphere for diagnosis and classification of cervical precancer. J. Biophotonics 2020, 13, e201960139. [Google Scholar] [CrossRef] [PubMed]
  46. Caporossi, A.; Baiocchi, S.; Mazzotta, C.; Traversi, C.; Caporossi, T. Parasurgical therapy for keratoconus by riboflavin-ultraviolet type A rays induced cross-linking of corneal collagen: Preliminary refractive results in an Italian study. J. Cataract Refract. Surg. 2006, 32, 837–845. [Google Scholar] [CrossRef] [PubMed]
  47. Wang, M.; Löhle, A.; Gompf, B.; Dressel, M.; Berrier, A. Physical interpretation of Mueller matrix spectra: A versatile method applied to gold gratings. Opt. Express 2017, 25, 6983–6996. [Google Scholar] [CrossRef] [PubMed]
  48. Westphal, P.; Kaltenbach, J.M.; Wicker, K. Corneal birefringence measured by spectrally resolved Mueller matrix ellipsometry and implications for non-invasive glucose monitoring. Biomed. Opt. Express 2016, 7, 1160–1174. [Google Scholar] [CrossRef] [Green Version]
  49. Peyvasteh, M.; Dubolazov, A.; Popov, A.; Ushenko, A.; Ushenko, Y.; Meglinski, I. Two-point Stokes vector diagnostic approach for characterization of optically anisotropic biological tissues. J. Phys. D Appl. Phys. 2020, 53, 395401. [Google Scholar] [CrossRef]
  50. Scarponi, F.; Mattana, S.; Corezzi, S.; Caponi, S.; Comez, L.; Sassi, P.; Morresi, A.; Paolantoni, M.; Urbanelli, L.; Emiliani, C.; et al. High-Performance Versatile Setup for Simultaneous Brillouin-Raman Microspectroscopy. Phys. Rev. X 2017, 7, 031015. [Google Scholar] [CrossRef] [Green Version]
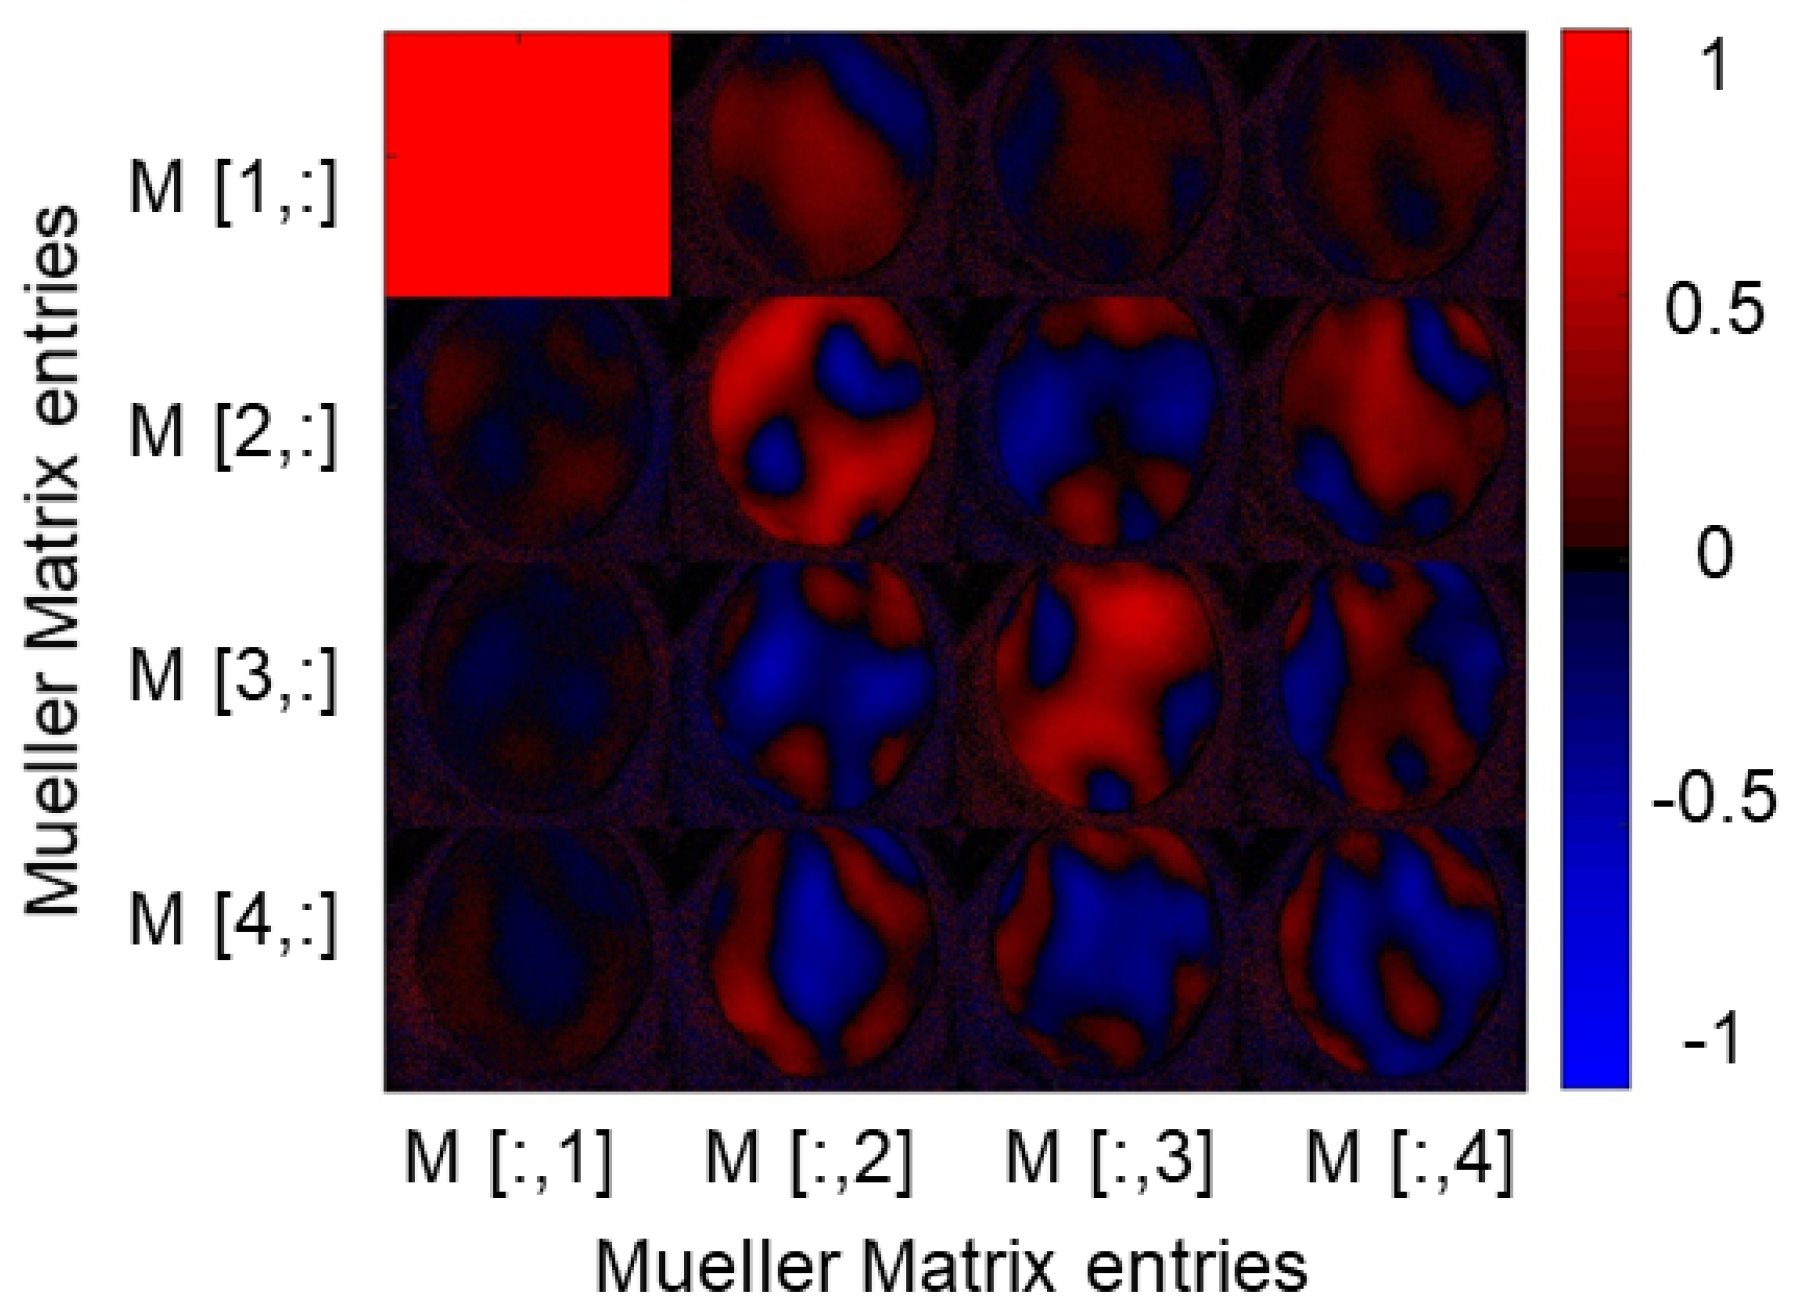
Figure 1. Sketch of the Mueller matrix polarimetry system. The light from the laser passes through the polarization state generator (PSG) which consists of two liquid crystal retarders (LCR) and a linear polarizer. After the interaction with the sample, the polarization states were analyzed by the polarization state analyzer (PSA) which also consists of LCRs and a linear polarizer. The LCR pairs are placed at different angles with respect to their principal axes.
Applsci 11 11515 g001
Figure 2. Result of a MM measurement in the transmission mode of a porcine cornea sample at a wavelength of 532 nm. The sample has a polarization-changing effect, as obvious from the non-zero entries of the different matrix elements, essentially all, which are normalized to the M ( 1 , 1 ) entry. However, the size of the effect is not homogeneously distributed over the surface of the cornea, which is evident from the individual entries and probably due to non-optimal sample fixation.
Applsci 11 11515 g002
Figure 3. Photograph of the setup for MM measurements of porcine corneas in reflection mode. Since the cornea has a curved surface, the sample cannot be aligned in parallel to the illumination beam. Reproduced from [38].
Applsci 11 11515 g003
Figure 4. Raw image taken with the polarization state HH for PSG (first letter) and PSA (second letter) as an example. The cornea is mounted on a specific polymer chamber to prevent it drying out which is achieved by the refilling of Dextran 500 solution. The back of the holder can also be seen as the cornea is transparent. In the central part, it becomes obvious that a region of the image is overexposed which needs to be excluded from later analysis. The black, nearly circular areas in the image show the liquid access to the chamber. The two boxes indicate from which areas of the images the used measurement data are. The blue area consists of the cornea without the reflection while the red area also contains the reflection spot.
Applsci 11 11515 g004
Figure 5. Mean values of the MM images from a series of measurements on porcine corneas. The measurements were performed on corneas neither prepared with riboflavin nor irradiated with UV (I), not prepared with riboflavin but irradiated with UV (II), prepared with riboflavin but not irradiated with UV (III) and both prepared with riboflavin and irradiated with UV (IV). The error bars represent the standard deviation for the sample size used as derived from multiple measurements. The elements M ( 2 , 1 ) , M ( 2 , 2 ) , M ( 2 , 3 ) , M ( 3 , 2 ) , M ( 3 , 3 ) and M ( 4 , 4 ) , highlighted by bar plots show a clear difference between the samples with and without riboflavin treatment.
Applsci 11 11515 g005
Figure 6. MM entries for different regions of interest with an observable difference between the measurements with and without riboflavin: (a) mean value of M ( 2 , 1 ) using the blue area; (b) mean value of M ( 2 , 2 ) using the blue area; (c) mean value of M ( 3 , 3 ) using the blue area; (d) mean value of M ( 2 , 1 ) using the red area; (e) mean value of M ( 2 , 2 ) using the red area; and (f) mean value of M ( 3 , 3 ) using the red area.
Applsci 11 11515 g006
Figure 7. Metrics for the measurements I, II, III and IV for different regions of interest showing clear differences for measurements with and without riboflavin: (a) mean value of the total polarizance P using whole images; (b) mean value of the depolarization power Δ using whole images; (c) mean value of the total polarizance P using the blue area; and (d) depolarization power Δ using the blue area.
Applsci 11 11515 g007
Figure 8. Mean values of M Δ from the blue region of porcine cornea images. The errorbars represent the standard deviation for the sample size used, as derived from multiple measurements. Elements M ( 2 , 1 ) , M ( 2 , 2 ) , M ( 3 , 3 ) and M ( 4 , 4 ) show the difference between the samples with and without riboflavin treatment.
Applsci 11 11515 g008
Figure 9. Poincaré sphere with every measurement included in the same sphere. Surfaces in the Poincaré sphere for measurement conditions I (a), II (b), III (c) and IV (d). (e) Color legend.
Applsci 11 11515 g009
Table 1. Calculation of the MM elements. The individual elements result from different polarization states of PSG and PSA (first and second letter on the right side of each matrix element equation). Symbols are as in (2). All MM images are normalized by the first matrix element M[1,1].
M[:,1]M[:,2]M[:,3]M[:,4]
M[1,:]HH+HV+VH+VVHH+HV-VH-VVPH+PV-MH-MVRH+RV-LH-LV
M[2,:]HH-HV+VH-VVHH-HV-VH+VVPH-PV-MH+MVRH-RV-LH+LV
M[3,:]HP-HM+VP-VMHP-HM-VP+VMPP-PM-MP+MMRP-RM-LP+LM
M[4,:]HR-HL+VR-VLHR-HL-VR+VLPR-PL-MR+MLRR-RL-LR+LL
Table 2. The different measurement conditions specify the different treatments of the porcine cornea samples with UV irradiation and riboflavin.
Measurement ConditionRiboflavinUV Irradiation
I××
II×
III×
IV
Publisher’s Note: MDPI stays neutral with regard to jurisdictional claims in published maps and institutional affiliations.

