Article

Modeling and Control of a Microgrid Connected to the INTEC University Campus

by
Miguel Aybar-Mejía
1,*,
Lesyani León-Viltre
2,3,
Félix Santos
3,4,
Francisco Neves
5,*,
Víctor Alonso Gómez
6 and
Deyslen Mariano-Hernández
1
1
Engineering Area, Instituto Tecnológico de Santo Domingo, Santo Domingo 10602, Dominican Republic
2
Faculty of Electrical Engineering, University Central “Marta Abreu” de Las Villas, Santa Clara 50100, Cuba
3
Basic Sciences Area, Instituto Tecnológico de Santo Domingo, Santo Domingo 10602, Dominican Republic
4
Centre for Energy Studies and Environmental Technologies (CEETA), University Central “Marta Abreu” de Las Villas, Santa Clara 50100, Cuba
5
Department of Electrical Engineering and Power Systems, University Federal de Pernambuco, UFPE, Recife 50670-901, Brazil
6
Department of Physics, University of Valladolid, Duques de Soria, 42004 Soria, Spain
*
Authors to whom correspondence should be addressed.
Appl. Sci. 2021, 11(23), 11355; https://doi.org/10.3390/app112311355
Submission received: 4 November 2021 / Revised: 25 November 2021 / Accepted: 25 November 2021 / Published: 30 November 2021

Abstract

:
A smart microgrid is a bidirectional electricity generation system—a type of system that is becoming more prevalent in energy production at the distribution level. Usually, these systems have intermittent renewable energy sources, e.g., solar and wind energy. These low voltage networks contribute to decongestion through the efficient use of resources within the microgrid. In this investigation, an energy management strategy and a control scheme for DG units are proposed for DC/AC microgrids. The objective is to implement these strategies in an experimental microgrid that will be developed on the INTEC university campus. After presenting the microgrid topology, the modeling and control of each subsystem and their respective converters are described. All possible operation scenarios, such as islanded or interconnected microgrids, different generation-load possibilities, and state-of-charge conditions of the battery, are verified, and a seamless transition between different operation modes is ensured. The simulation results in Matlab Simulink show how the proposed control system allows transitions between the different scenarios without severe transients in the power transfer between the microgrid and the low voltage network elements.

1. Introduction

The constant growth in renewable energy generation and the integration of these systems into large-scale grids represents a challenge for the proper functioning of the electrical system [1]. Grid integration requirements have therefore become a significant concern as renewable energy sources, such as wind and solar photovoltaic (PV) systems, slowly begin to replace conventional plants [2]. The proper control and operation of electric microgrids integrated into the electrical network can improve the electrical system’s power quality, stability, and reliability [3].
In [4], a hybrid AC/DC microgrid has been incorporated into a low voltage AC distribution system. A power control scheme is presented to improve the system’s stability after load steps when the microgrid operates in island mode. However, the authors of this study do not consider the presence of mini wind power sources in the microgrid. Further, they do not describe the control algorithm for islanded operation, nor the batteries being fully charged—a condition that requires that distributed generators (DG) units abandon maximum power point tracking (MPPT) and share the total load in proportion to their available primary powers.
A power management system for hybrid AC/DC microgrids, designed to optimize a cost function that considers the maximum utilization of renewable resources, minimal usage of fuel-based generators, extending the lifetime of batteries, and limited utilization of the main power converter between the AC and DC micro-grids is presented in [5]. However, the power management algorithm needs several input variables which are usually not available in most microgrids, e.g., PV and wind primary energies, namely, demanded power (sum of load power, power line loss, and power loss due to the circulating current), the state-of-charge (SOC) of the battery banks, and some statistical and dynamical operational limits.
The management and optimization of a hybrid AC/DC microgrid are still open issues, as affirmed in [6]. In this study, the authors propose a model predictive power and voltage control (MPPVC) method for providing microgrid control under different possible scenarios with smooth transients. However, the precise details about the control of the DG units for off-MPPT operation while ensuring proper total load sharing are not given.
In this paper, a power management scheme for a hybrid AC/DC wind–PV–ESS microgrid is proposed. The only input variables necessary for the converters’ control are those usually measured, the state of the microgrid (interconnected or not), and the battery SOC. The control schemes of the converters for all operation scenarios are described in detail. The results obtained in this paper serve as a basis for a hybrid AC/DC microgrid comprising a PV system, an energy storage system (ESS) using lithium-ion batteries, DC loads, a wind microturbine with a permanent-magnet synchronous generator system (PMSG), and AC loads that are under development as part of a project financed by the Ministerio de Educación Superior, Ciencia y Tecnología (MESCyT) of the Dominican Republic which will be installed on the campus of the Instituto Tecnológico de Santo Domingo Instituto de Santo Domingo (INTEC). The objective of the project is to implement and verify the behavior of the hybrid microgrid through the intelligent management of the distributed generation (DG) units and loads and the collection of information. While the microgrid is under construction as part of the energy management and control system (EMCS) design, its behavior is studied through a detailed simulation system. In the present study, the sizes of the photovoltaic, wind, and storage systems are the same as those of the equipment available for installation, and energy production is estimated based on forecasting data. However, implementing the control and management of this system is not limited to the specific elements of the microgrid. The results can be extrapolated to other low voltage infrastructures to meet the voltage and electrical frequency conditions. This project aims to promote the applications of hybrid DG systems integrated into electrical microgrids.
In the present work, we evaluate a control strategy that allows power transitions between the microgrid connected to the university campus and all possible operating scenarios, such as islanded or interconnected microgrids, different generation-load possibilities, and state-of-charge conditions of the battery. The converters have a low number of switches but allow adequate control of each element of the microgrid, so that the GD units operate in maximum power point tracking (MPPT) mode or promote the balance between the generated power, loads, and battery charge/discharge powers.
The overall management strategy, together with the proposal of control schemes for the DG units for off-MPPT operation while ensuring proper total load sharing, are the main original contributions of this article.
The rest of the paper is organized as follows. The proposed topology and modes of operation are described in Section 2. Models were constructed to enable the design of the system control loops, the PV, PMSG-wind, and ESS systems, together with the respective interface converters, and these are presented in Section 3. The control strategies for the interface converters are explained in Section 4. The operational scenarios used to verify and validate the proposed control strategies are described in Section 5, and the corresponding simulation results are presented in Section 6. The conclusions of the study are drawn in Section 7.

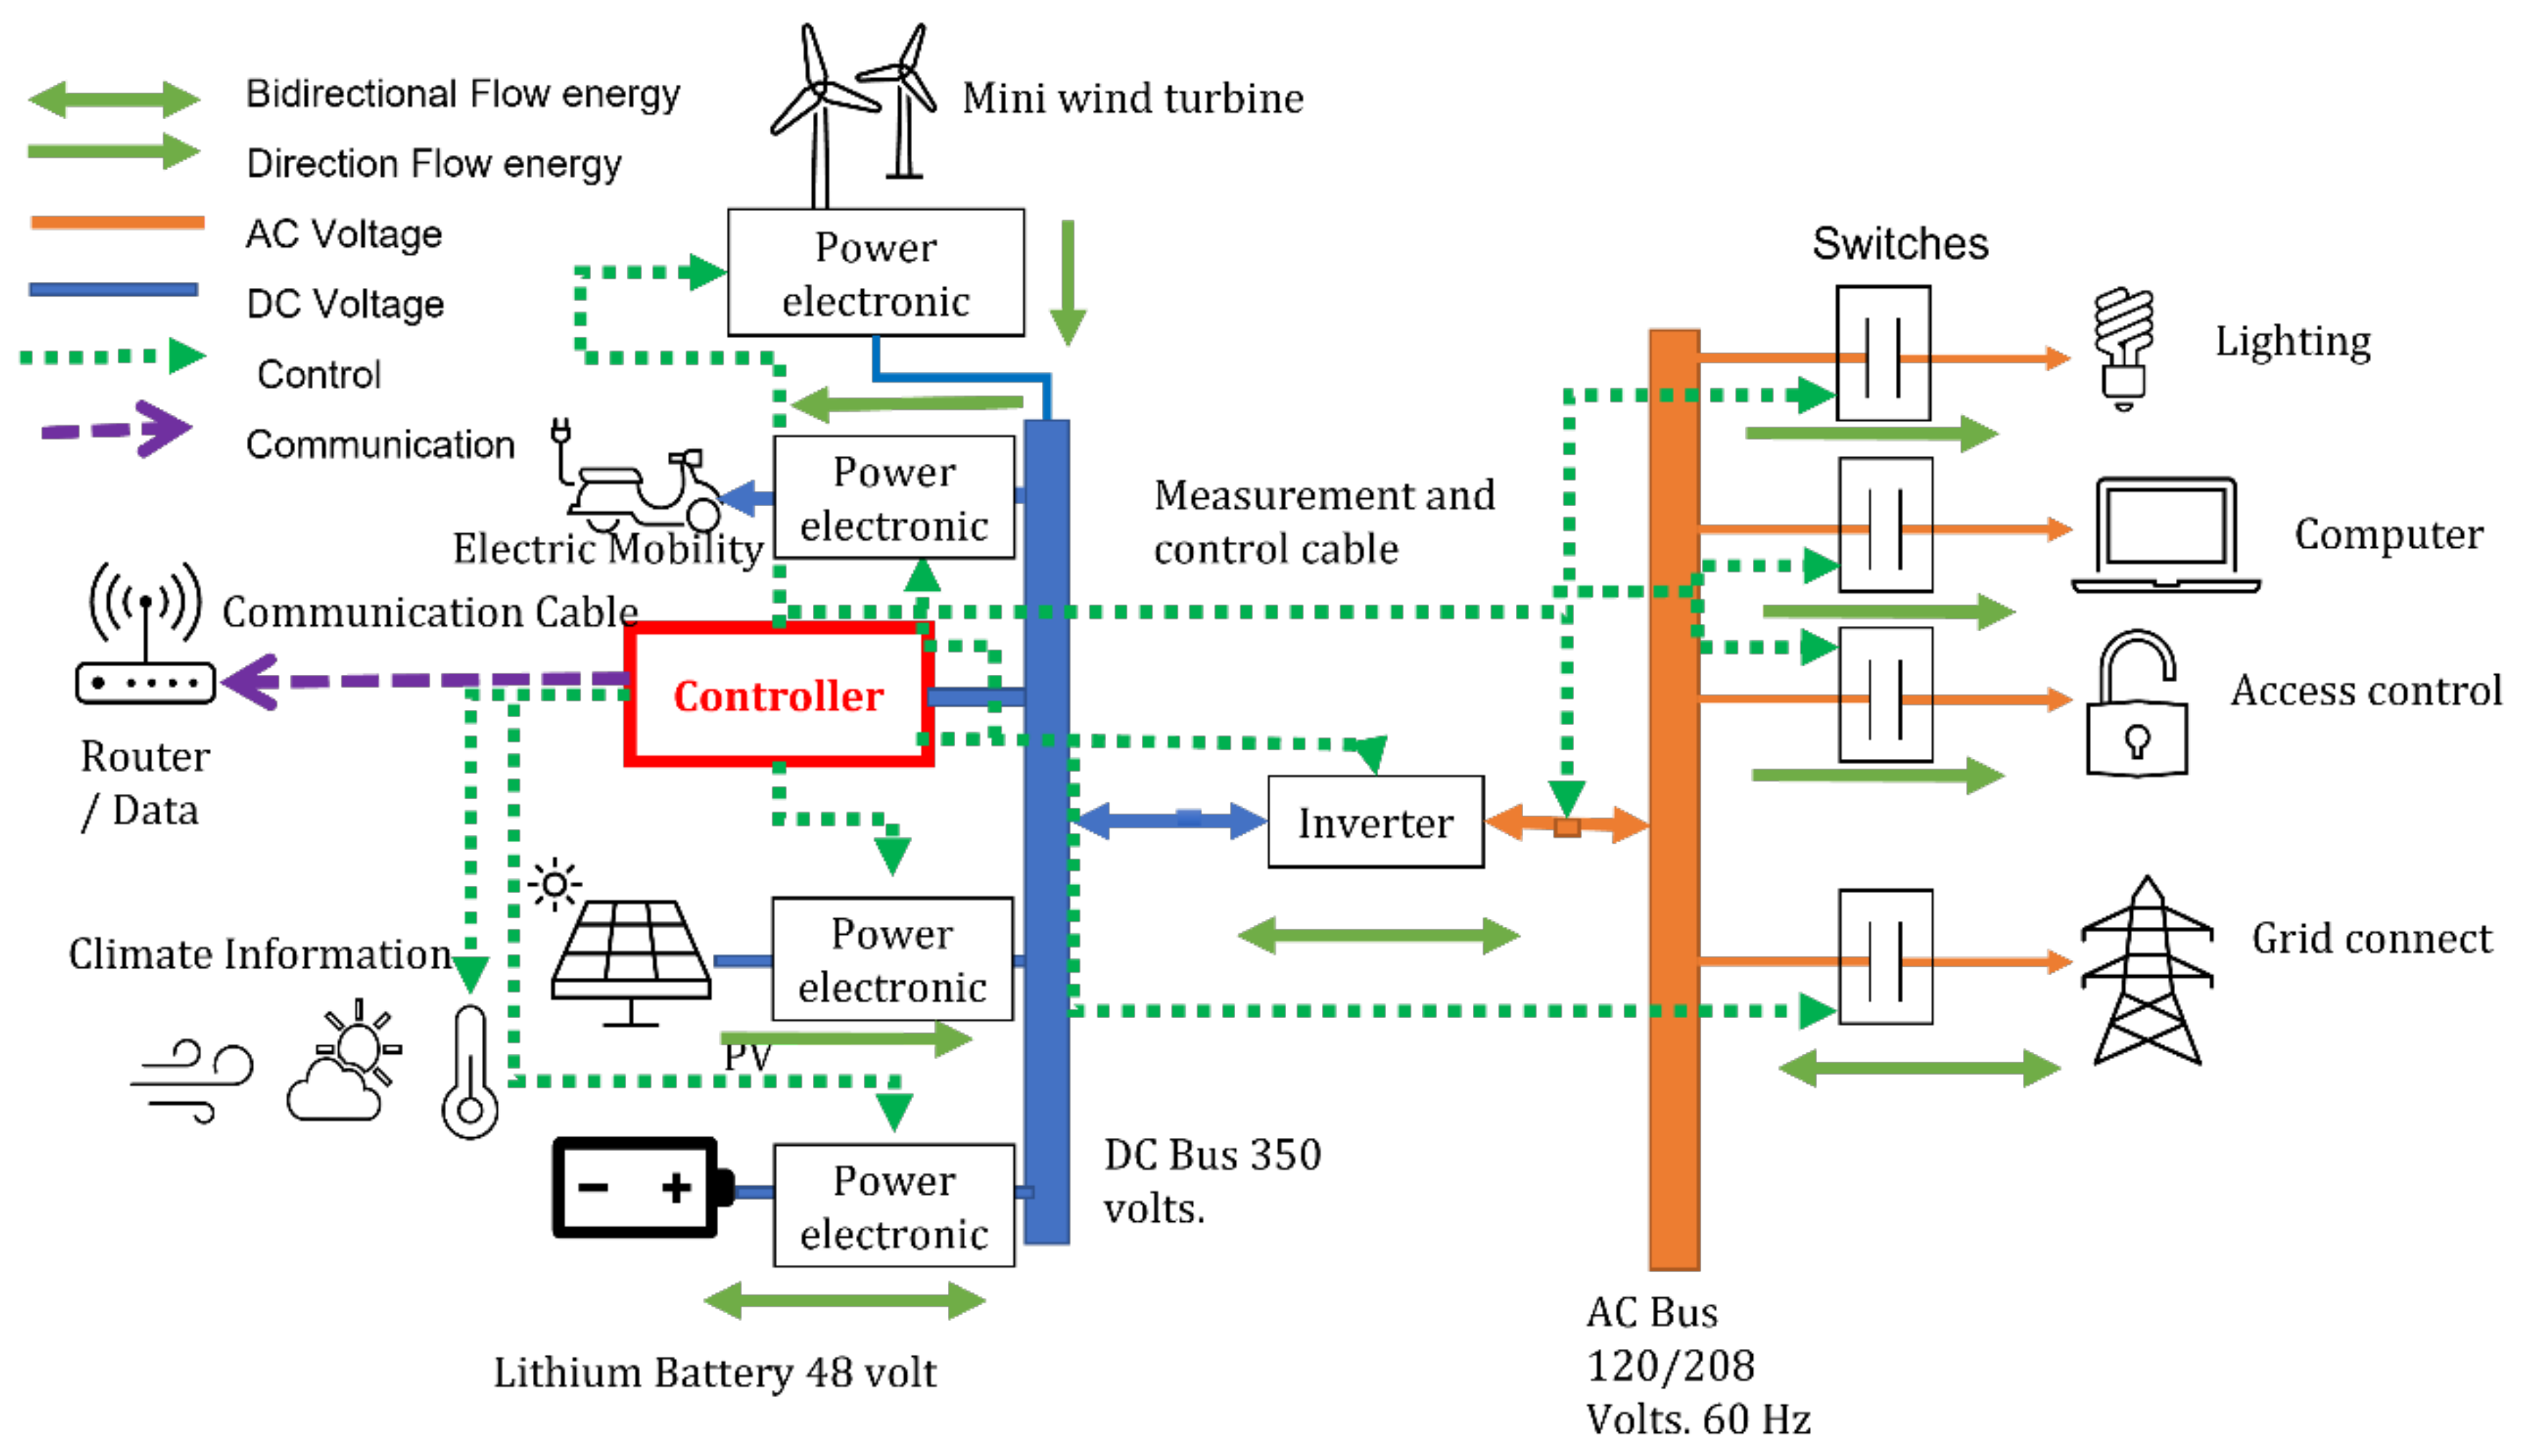
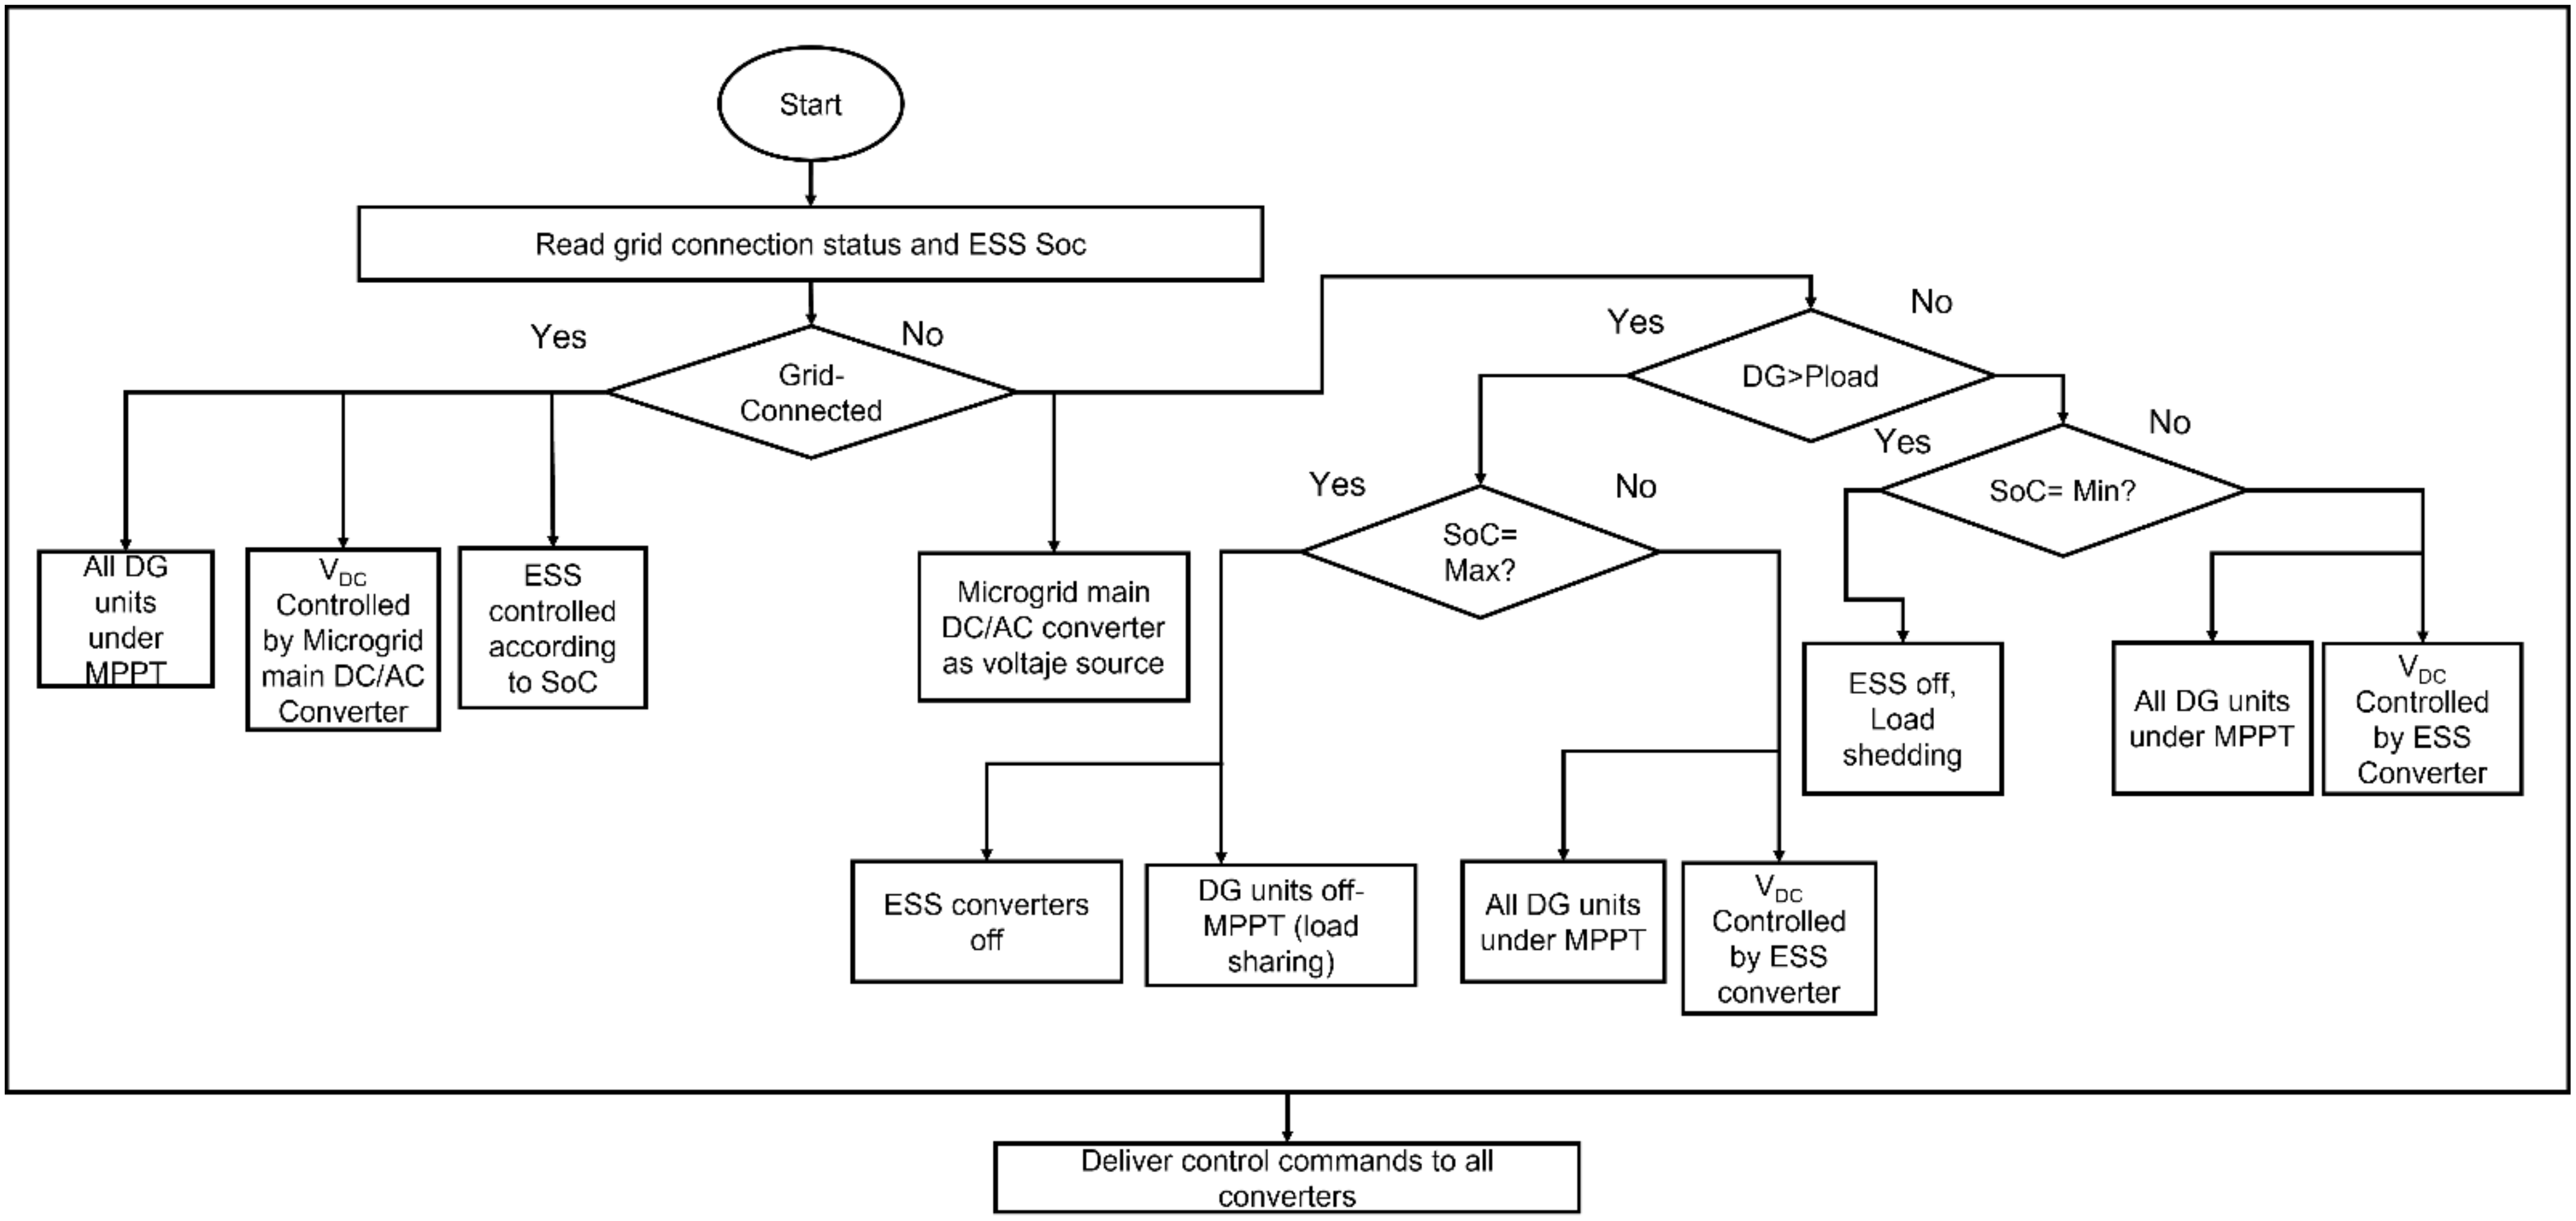
2. Microgrid Topology and Modes of Operation

Figure 1 presents a schematic diagram of the PV–wind–ESS hybrid AC/DC microgrid. The photovoltaic panels, lithium-ion battery, and PMSG-based wind system are connected to the microgrid DC bus via DC/DC converters. A bidirectional inverter is used to control the energy flow between the DC and AC microgrid buses. AC loads are connected to the microgrid at 220 V, 60 Hz AC bus, through which the microgrid is connected to the central power system. The capacity of the microgrid simulated for a PV system is 500 Wp, wind turbine capacity is 2 kW, and lithium storage capacity is 5 kWh. A simple boost converter has been chosen as the PV system interface, and a low-cost two-switch bidirectional converter topology was used for the proper control of the ESS.
The DG and ESS interface converters must allow different control modes, depending on whether the microgrid is connected to the central power system or not. Furthermore, with respect to island mode, the converters’ control strategies depend on the batteries’ state of charge (SoC) and the total DG units’ instantaneous injected power versus total load demand. Thus, some quantities necessary for the decision about the microgrid mode of operation must be sent to a central control unit, which decides the DG unit’s operation mode (under MPPT or with reduced generation) and ESS operation (charging or supplying the instantaneous power deficit).
For long-term operation, climatology information obtained for the project’s location in the university was used (18°29′15.9” N 69°57′48.5” W).
When the microgrid is connected to the primary grid, the PMSG wind and PV systems must be controlled to maximize the use of available primary energy, i.e., MPPT is adopted. Furthermore, if the battery is not fully charged, its converter controller should determine the instantaneous power to be absorbed. Therefore, for operation in under-connected mode, the inverter between the DC and AC buses must transfer to (or absorb from) the AC microgrid bus the difference between the power generated and consumed by the battery and DC loads.
On the other hand, loads should preferably be fed by the DG sources when the microgrid is islanded. In case of insufficient generation, the batteries should complement the power to meet the load’s demand. However, if the generation exceeds the power required by the loads there are two possible situations that might result: (i) the battery is fully charged, in which case the DG systems can no longer operate at the maximum power point MPP and must share the total power consumed by the loads proportionally to their nominal powers; or (ii) the battery can be charged, allowing the DG systems to operate at the MPP, and the excess of generated power is used for battery charging.
It is essential to mention that the topology and control strategies must ensure proper operation under the different conditions described above and provide smooth transitions between operating modes. The energy management strategy described is represented in the flow diagram of Figure 2.

3. Modeling of the Microgrid
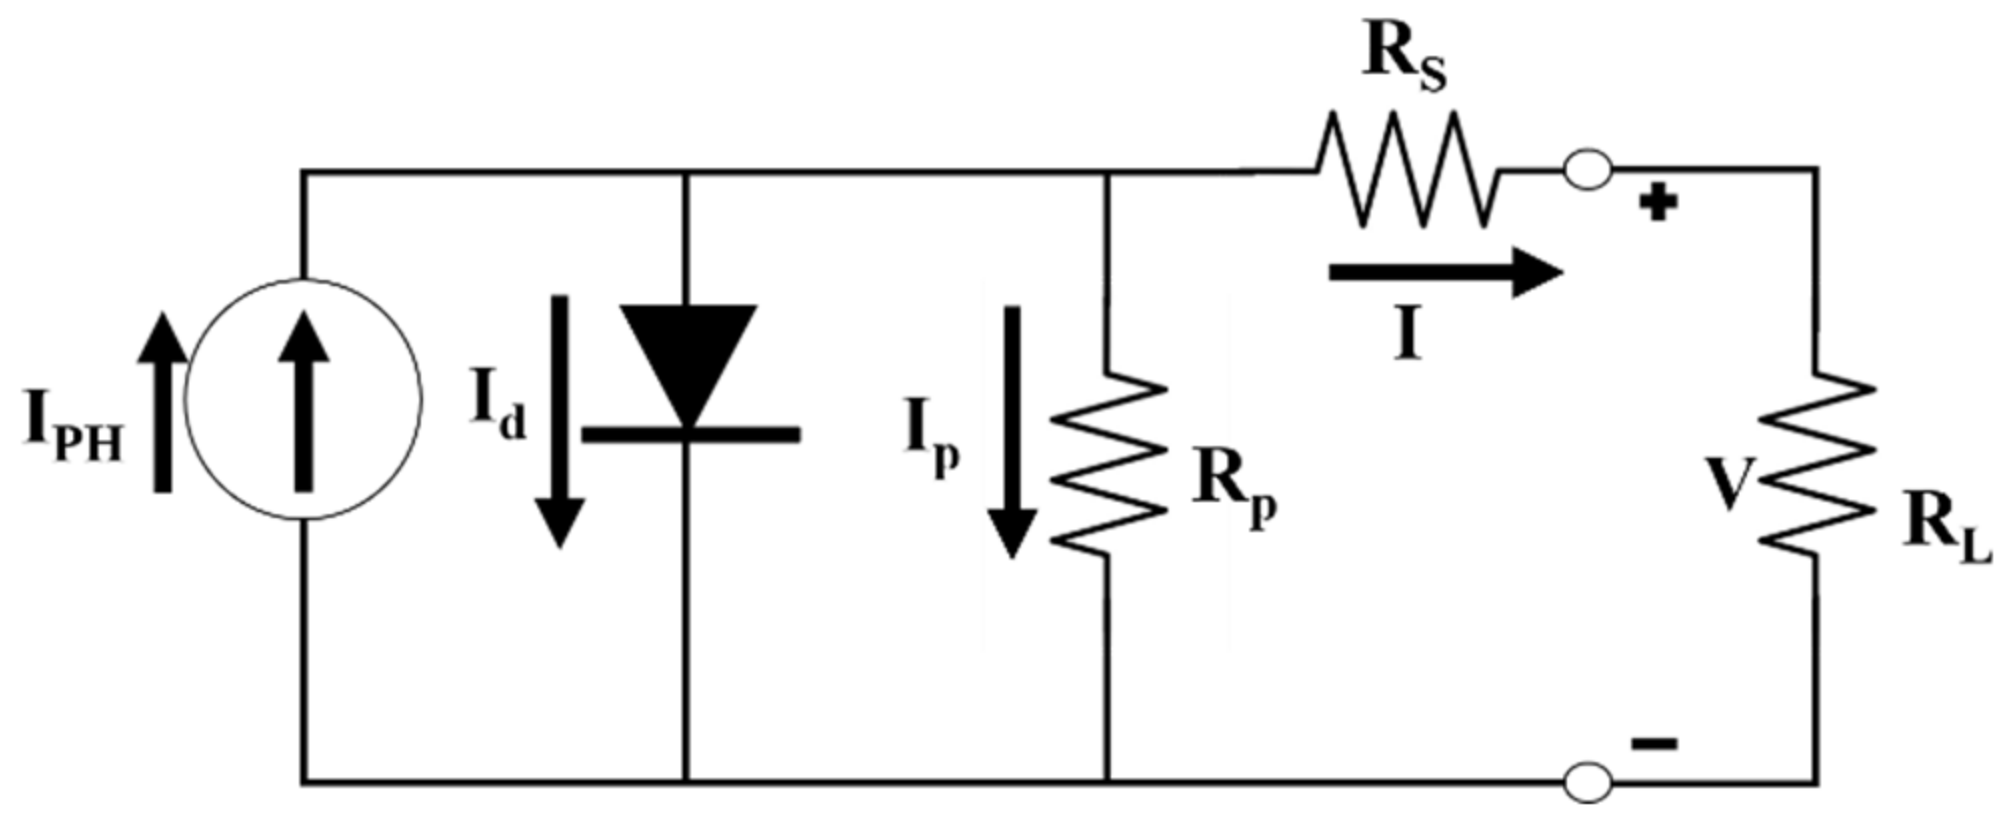
In this section, the models of the main microgrid elements—the PMSG wind system, the PV module, and the battery—are briefly described.

3.1. PV System

The PV module can be characterized by a nonlinear I–V curve that changes according to the local temperature and irradiance conditions. Among the different proposals to accurately represent the PV module, the most used is the single-diode model, shown in Figure 3, due to its good compromise between simplicity and accuracy. Furthermore, it is possible to estimate the model’s parameters based on the data provided in the panel manufacturer datasheet [7]. Table 1 describes the characteristics of the one-diode model elements.
Equations (1)–(4) demonstrate the equation of the PV panel for the light-generated photocurrent as presented in [7]. The output current of the single diode model is a function of the output voltage, and it can be described as:
I = I g I s a t   e V + I R s V t 1 V + I R s R p
V t = N s A k t q  
where V and I are the module output voltage and current, I g is the photogenerated current, I s a t is the reverse saturation current of the diode, V t is the thermal voltage, q is the electron charge, A is the ideality factor of the diode, k is the Boltzmann constant, T is the module temperature, N s is the number of series-connected cells forming the PV module, and R s and R p are the series and the parallel resistances, respectively.
The PV module manufacturers do not directly provide the five parameters of the single-diode model. For this reason, it is difficult to determine those parameters using simple analytical methods. Instead, all datasheets provide the following information for the standard test conditions (STC): open-circuit voltage (Voc), short-circuit current (Isc), MPP voltage (Vmp), MPP current (Imp), a temperature coefficient for Voc (kV), a temperature coefficient for Isc (ki), and maximum power (Pmp). An analysis of the electrical model in three operation points of the I–V curve (Isc, Voc, and Pmp) allows the unknown parameters of the electrical model to be related to the datasheet information.
Several authors propose novel photovoltaic parameter estimation methods. This article uses the method proposed in [7], which involves finding the five unknown parameters that guarantee the absolute minimum error between the P–V curves generated by the electrical model and the P–V curves provided by the manufacturers’ datasheets for different external conditions, such as temperature and irradiance. I g is given by (3), I s a t is obtained from (4):
I g = I s c , S T C + k i T T R S 1000 .
I s a t = I g V o c R p e V o c V t 1 ....
A complete scan of all possible values of A (from 1 to 2, with a step of 0.01) and R s (from 0 to 2 Ω, with a step of 1 mΩ) is made.

3.2. Wind Turbine and Permanent Magnet Synchronous Generator

The instantaneous power delivered to the PMSG axis by the wind turbine, as in the system described in [8], can be represented by:
P = 1 2 ρ A V 3 C p λ , β ,
where ρ is the air density, A is the area swept by the turbine rotor blades, V is the instantaneous wind speed and C p λ , β is the efficiency power conversion factor, which is a nonlinear function of the tip speed ratio λ = ω t R / V and the pitch blades angle β . Since the manufacturers of wind turbines do not give information about power conversion factor characteristics, some typical empirical curves are often used for representing wind turbines in power system studies, such as the one presented in [8]:
C p λ , β = 0.22 116 λ i 0.4 β 5 e 12.5 λ i ,  
where:
1 λ i = 1 λ + 0.08 β 0.035 β 3 + 1 .  
The PMSG was represented using the model in the dq reference frame rotating at a rotor electrical angular speed ω r = P / 2 ω t :
v s d = R s i s d + d d t λ s d ω r λ s q v s q = R s i s q + d d t λ s q + ω r λ s d 2 J P d d t ω r = T e T m 2 b P ω r ,  
where v s d , v s q , i s d , i s q , λ s d , and λ s q are the direct and quadrature axes components of the stator voltage, current, and flux space vectors, respectively. T e and T m are the electromagnetic and mechanical torque machines, and J and b are rotor inertia and viscous friction coefficients. The flux–current relations and the electromagnetic torque equation complete the model:
λ s d = L s d i s d + Λ λ s q = L s q i s q T e = 3 2 P 2 λ s d i s q λ s q i s d = 3 2 P 2 Λ i s q + L s d L s q i s d i s q ,  
where Λ is the permanent magnet flux.

3.3. Battery Model

Mathematical modeling and dynamic simulation of battery storage systems can be challenging due to their nonlinear nature. The published literature has presented several thermal models of lithium-ion battery packs [9,10].
In [9], a suitable, convenient dynamic battery model is presented that can be used to model a general battery storage system. The proposed dynamic battery model can analyze the effect of temperature, cyclic charging/discharging, and voltage stabilization effects. Temperature makes a difference to three battery parameters in an equivalent electrical circuit battery model. These are the polarization voltage K, the battery constant E 0 , and the exponential coefficients, A and B. The dynamic battery model can be described as [9]:
E q , t = X E 0 T . E 0 X K . K Q Q q + A   e x p X B B q  
where E(q,t) = no load voltage (V), E0 = battery constant voltage (V), K = polarization voltage (V), Q = battery capacity (Ah), A and B = exponential constants, and q = charge or extracted capacity (Ah).
The thermal effect on A has been ignored to make the model simpler, since A and B are highly related. For this reason, the mathematical relationships are:
X n = f T = A + B T + C T 2 ..
n = f K , E 0 , B . C

4. Control Strategies

The converters of the microgrid DG and battery units and the converter between the DC and AC buses must be controlled according to the modes of operation described in Section 2. The control scheme implemented in each converter is presented in this section. Procedures for tuning these controllers are also explained.

4.1. PV Converter Control

As already mentioned in Section 2, the PV generation system should operate in MPPT mode in three possible situations: (i) when the microgrid is in the connected mode; (ii) when the microgrid is islanded, and the total power demanded by the loads is greater than the total power produced by the DG units (the battery supplies the difference); and (iii) when the microgrid is islanded, and the power produced by the DG units is greater than the power demanded by the loads but the battery is not fully charged (so it can absorb the exceeding generated power). However, if the microgrid is islanded, the DG units’ produced power is more significant than that demanded by the loads, and the battery is fully charged, then the MPPT cannot be imposed, and the generated power must be reduced so that it equals the total load power. In this last case, the load power is shared among the DG units proportionally to the DG units’ rated powers.

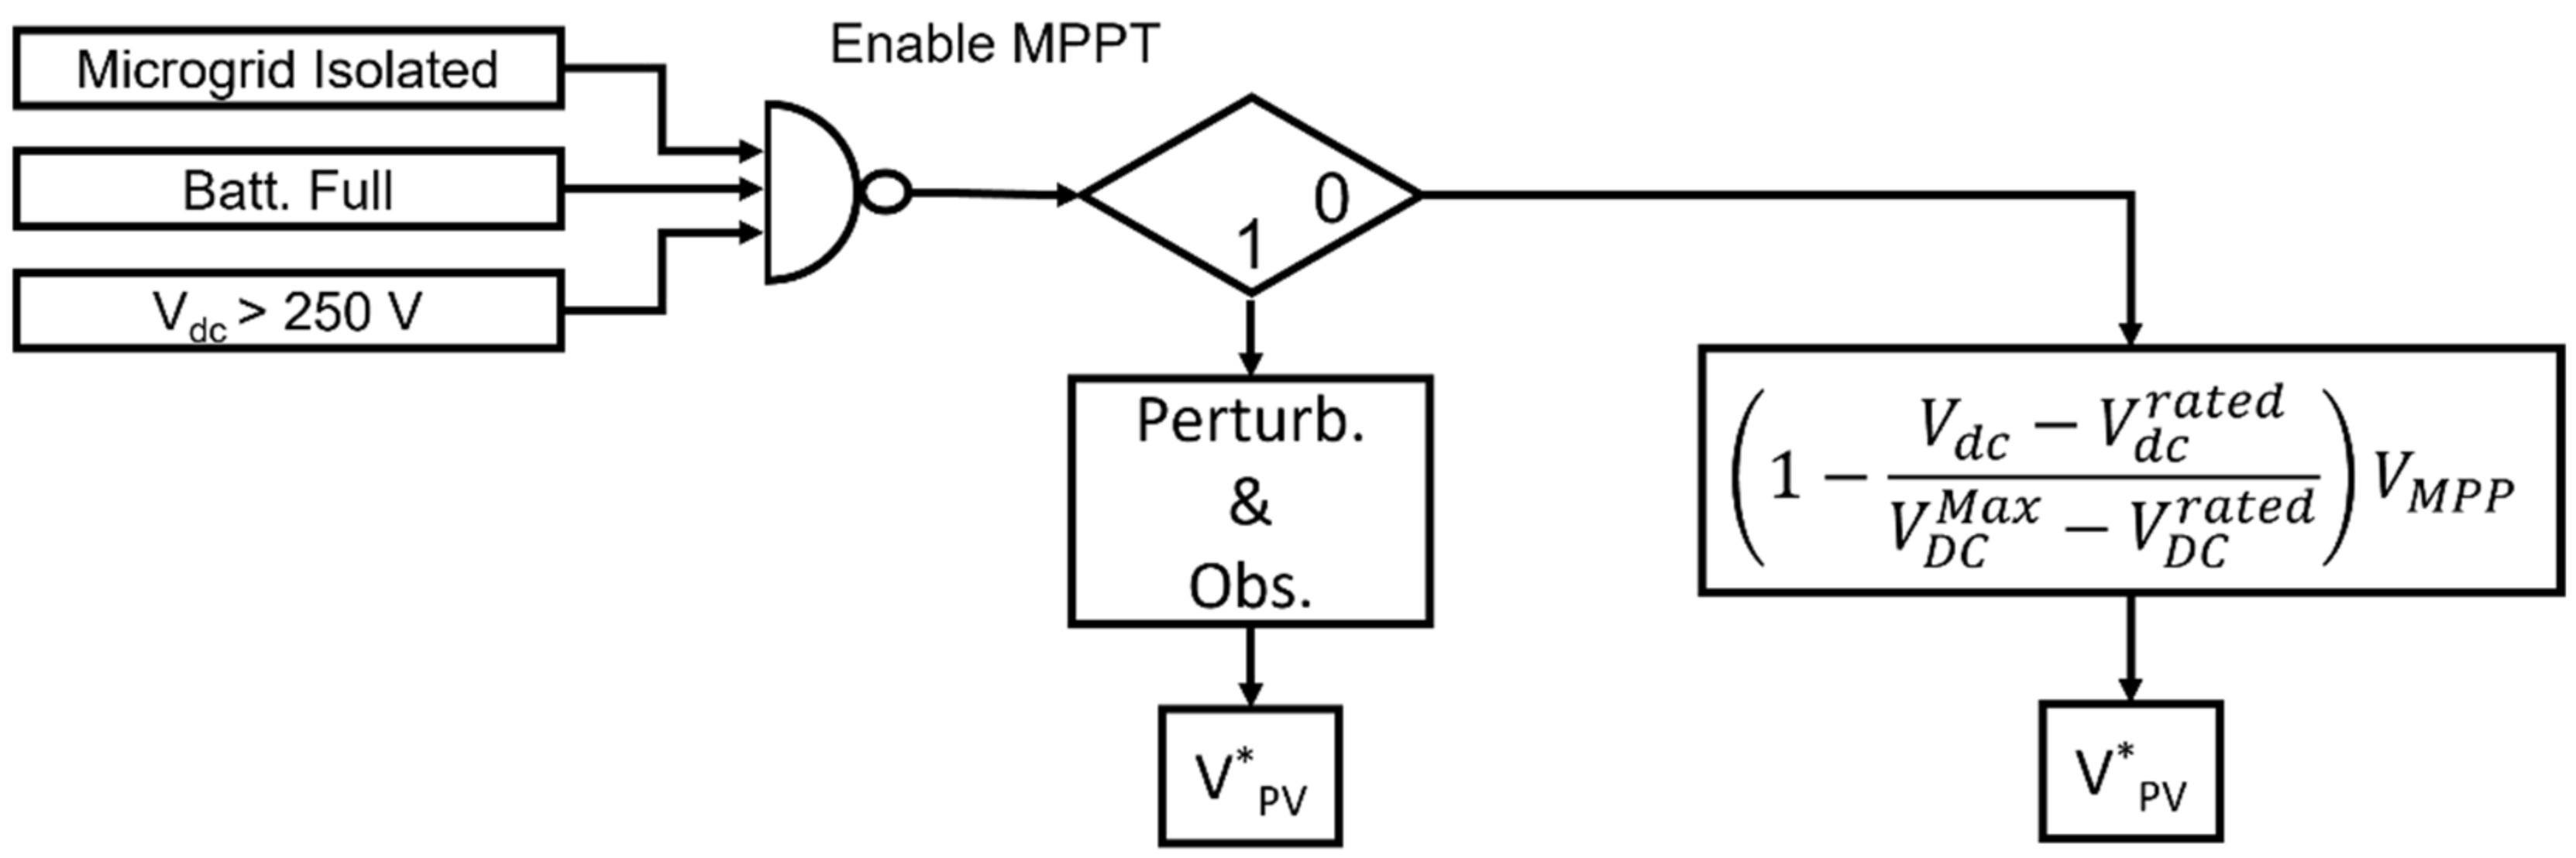
4.1.1. PV Converter MPPT Method

The electrical power supplied by PV cells is a non-linear function of voltage, current, temperature, and solar irradiance. This non-linearity makes it challenging to obtain the operating point at which its maximum power is extracted, as this point varies throughout the day due to variations in irradiance and temperature. The objective of any MPPT algorithm is to find the voltage to be applied to the PV string terminals that results in the maximum possible generated power for the momentary conditions of irradiance and temperature.
Several techniques for determining MPP have been proposed over the years. These techniques vary in complexity, speed of convergence, voltage fluctuation around the MPP, and computational cost. The MPPT technique chosen for this project was the very popular perturb and observe (P&O) algorithm due to its simplicity and acceptable performance in most situations [11]. The P&O MPPT technique changes the PV array voltage in one direction and observes the variation in the output power. If the generated power increases, then the voltage perturbation continues in the same direction. However, if the output power reduces, the voltage perturbation occurs in the opposite direction. The voltage disturbance process is repeated periodically, each T M P P T , and the array voltage oscillates around the MPP. This oscillation can be minimized by reducing the size of the disturbance, but minimal disturbances make the technique slow to track the MPP. The parameters of the P&O MPPT method are T M P P T and the magnitude of the voltage perturbation is Δ V . Typical choices of these parameters are Δ V = 0.5 % of the PV array open-circuit voltage and T M P P T = 4 τ V d c , where τ V d c is the time constant of the PV array output voltage variation.
After the reference value of the PV array, DC voltage is determined, and the DC/DC boost converter synthesizes it. Thus, the duty cycle of the boost converter is determined from the DC bus voltage of the microgrid and the reference PV array voltage, calculated according to the P&O algorithm for achieving MPPT.

4.1.2. PV Converter Control for Sharing the Microgrid Load Power

As has already been mentioned, if the microgrid is islanded, the battery is fully charged, and the total DG power exceeds the microgrid AC + DC load power, then each DG source must reduce the generated power until the load power demand is shared among the DG units. Ideally, this sharing should be proportional to the maximum power delivered by each DG unit.
If the DG power is greater than the load power demand, considering that no power can be transferred to the grid or the battery, the excess power flows to the DC bus capacitors bank, increasing the DC bus voltage. Thus, based on the information that the microgrid is islanded and that the battery state-of-charge is complete, the DC bus voltage increase indicates that the power generated by each DG unit must be reduced.
A typical voltage–power curve for a PV system is shown in Figure 4. However, it can be observed that, below the MPP voltage, the voltage–power relation can be considered approximately linear.
The strategy proposed here to make the DG units share the total power required by the microgrid loads is based on the DC bus voltage increase per unit of the maximum allowed voltage increase, expressed as:
Δ V D C , p u = Δ V D C Δ V D C M A X = V D C V D C r a t e d V D C M A X V D C r a t e d .
Assuming that on the left side of the P–V characteristic, the PV-generated power is approximately proportional to the PV string output voltage, this voltage can be reduced linearly with the DC bus voltage increase. Since the DC bus voltage becomes constant only when the generated and load powers are equal, the steady-state condition ensures that, for some DC bus acceptable overvoltage, the PV output voltage ensures DG and load powers to match. The PV output voltage command can then be obtained, as shown in Figure 5.
If other PV units were connected to the microgrid, their output voltages would be calculated using the scheme presented in Figure 5. Thus, the generated powers would be approximately proportional to each PV unit’s maximum power available.

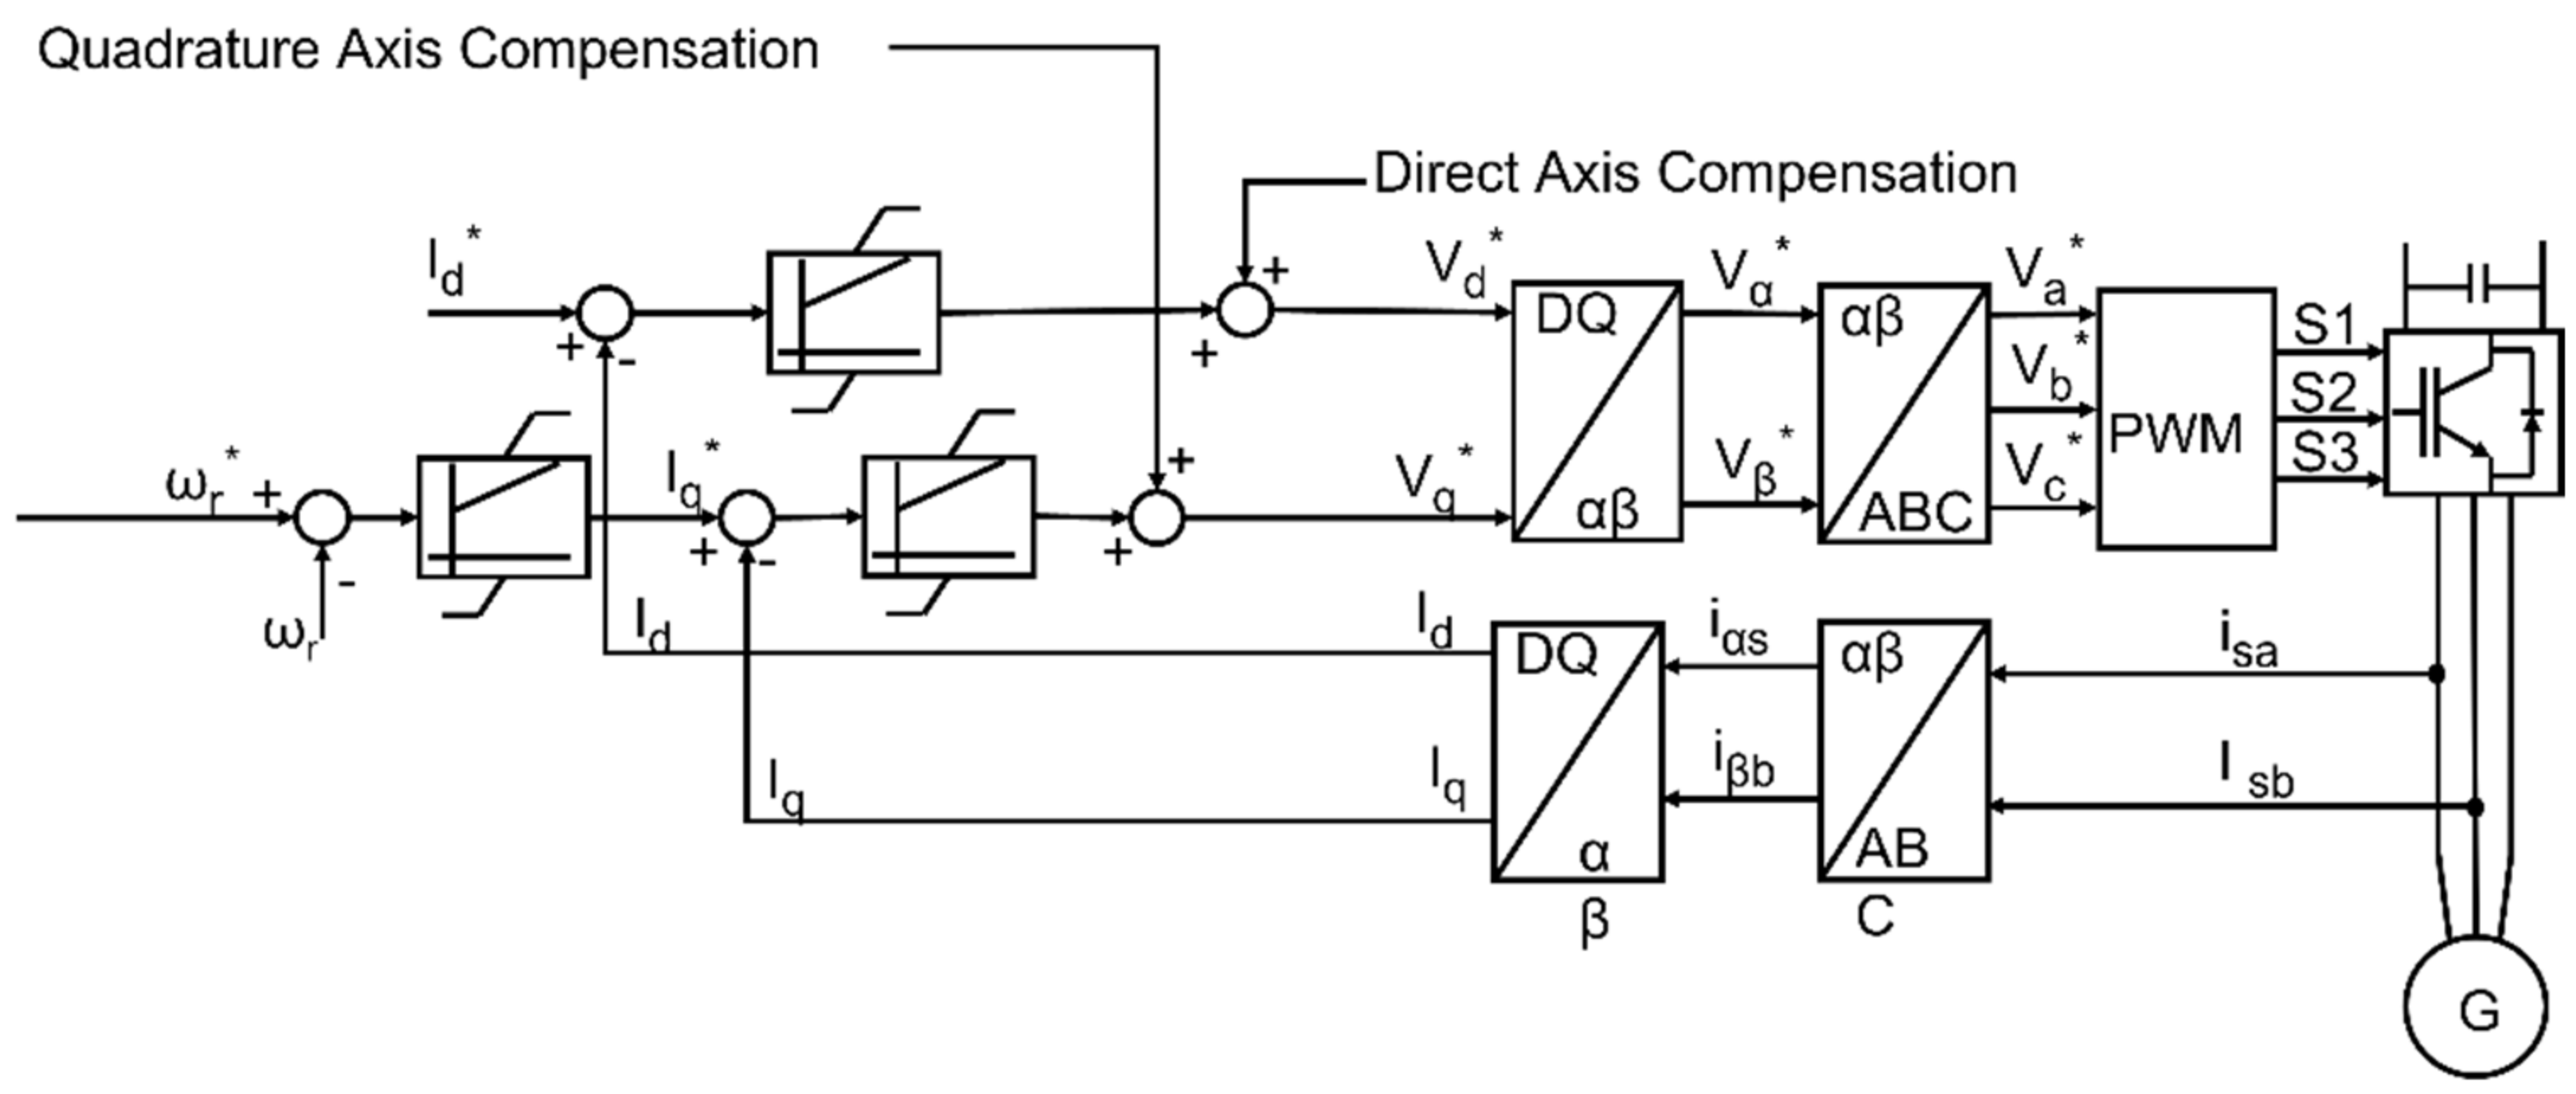
4.2. PMSG-Based Wind Turbine Control

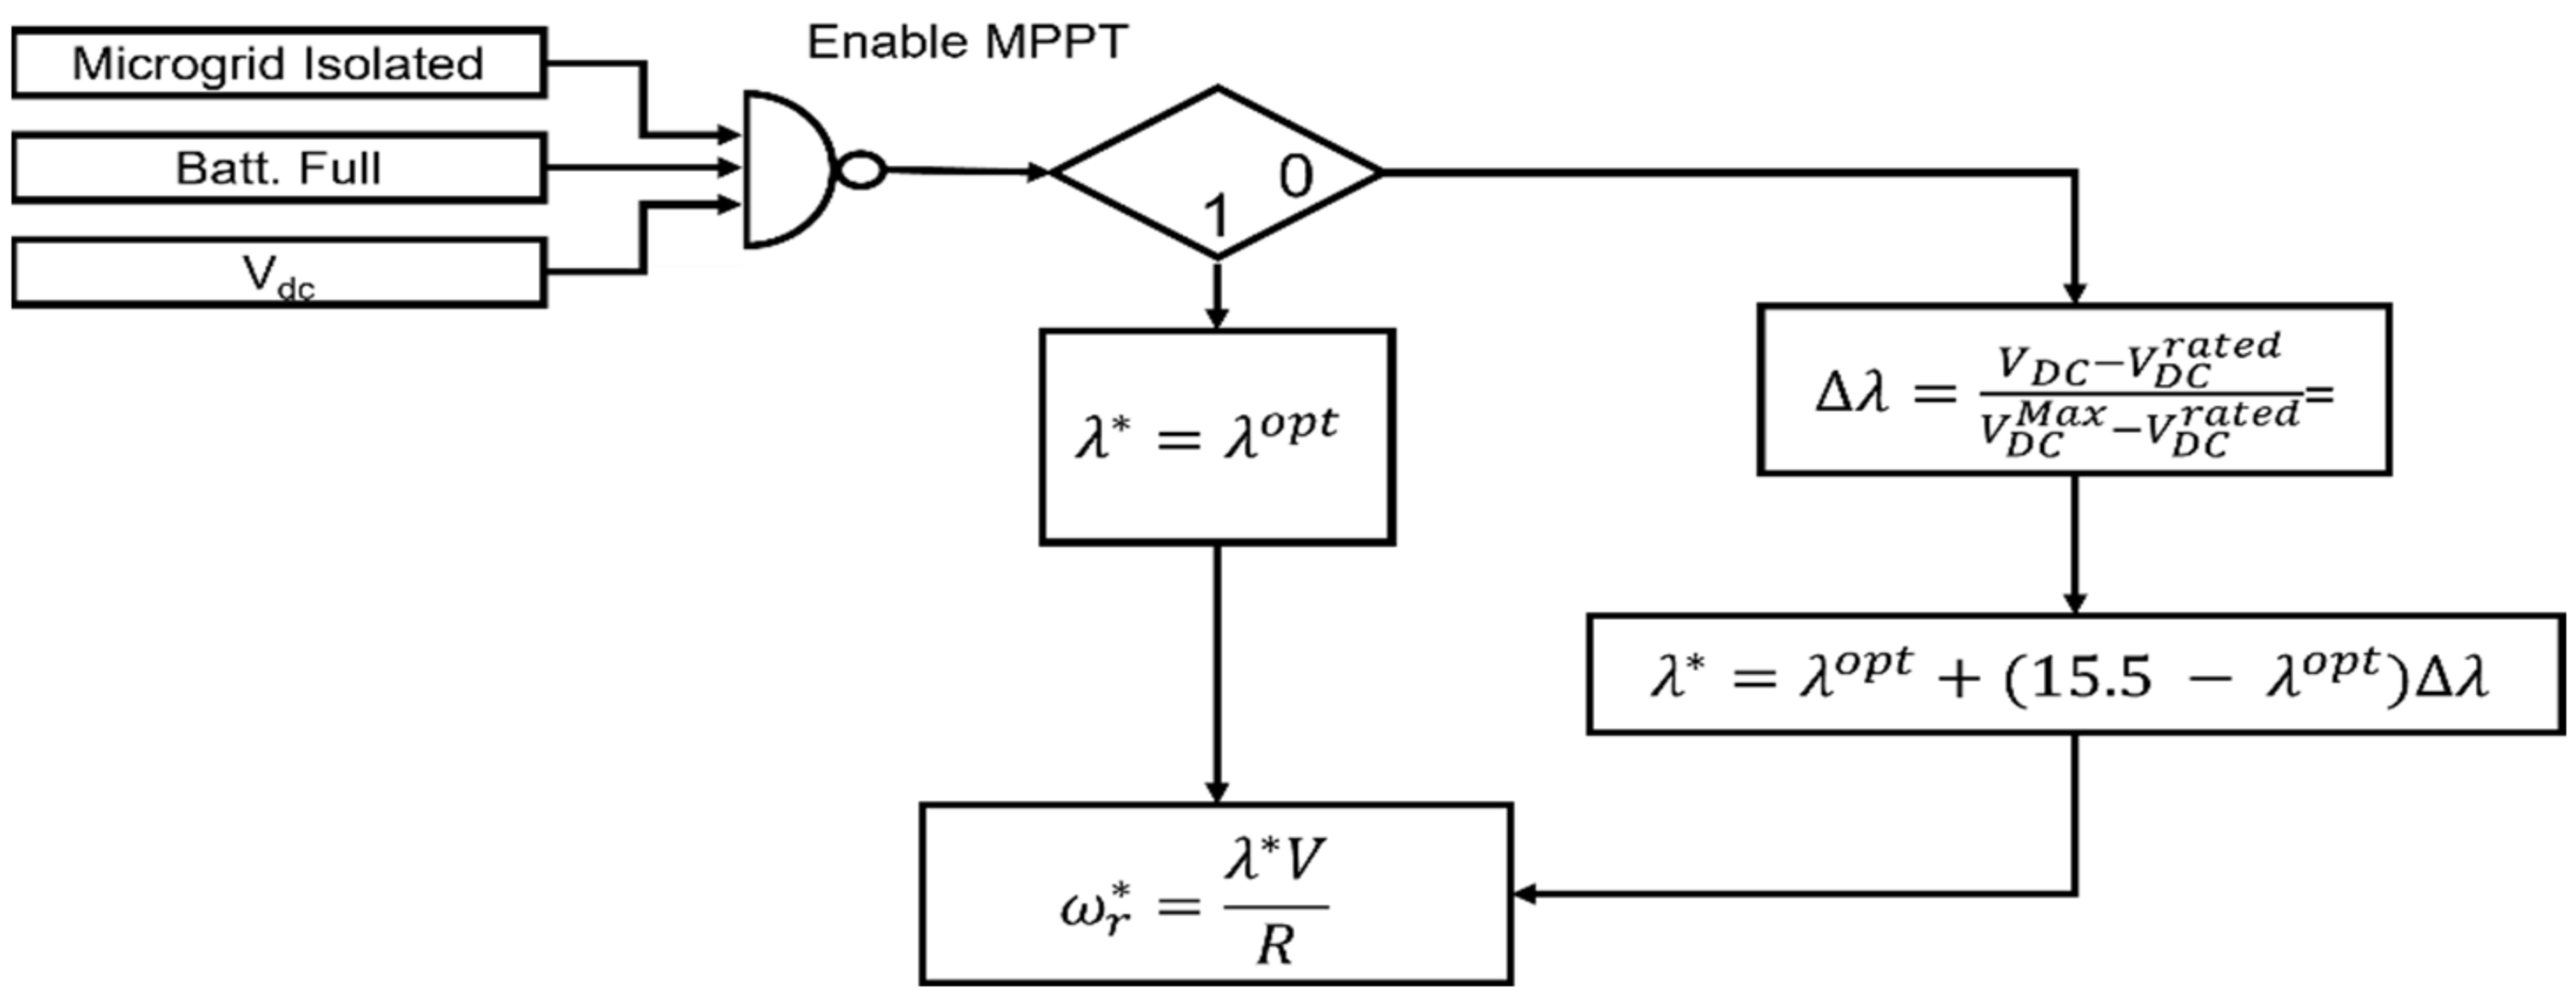
4.2.1. Control for Ensuring MPPT

The PMSG stator terminals are connected to a three-leg AC/DC voltage source converter. If the PMSG rated stator voltage is low enough, the AC/DC converter can directly connect to the microgrid DC bus, otherwise a transformer between the PMSG terminals and the AC/DC converter or a DC/DC converter between the AC/DC converter and the microgrid DC bus would be necessary.
The main objective of the AC/DC converter is to optimize the power extracted from the turbine for any incoming wind speed. The wind microturbine has fixed-pitch blades at angle β . Thus, according to Equations (5)–(7), the turbine efficiency factor C p λ ,   β depends only on the tip speed ratio λ = ω t R / V . For each wind speed V , there is an angular speed of the turbine rotor ω t that maximizes C p λ , β , allowing the maximum available power to be extracted. This optimum angular speed is obtained from:
ω t o p t = λ o p t V R
The PMSG reference rotor speed (in electrical radians per second) can then be obtained from ω r * = P / 2 ω t o p t . A vector control scheme is then applied to impose the reference rotor speed.
The PMSG model is in a rotor-oriented reference frame, i.e., the d-axis is aligned with the permanent magnet flux. The reference d-axis stator current is then set to zero since a negative value would reduce the main flux and a positive value could cause magnetic saturation. Furthermore, if i s d = 0 , the electromagnetic torque becomes T e = 3 2 P 2 Λ i s q , so it can be controlled through i s q . The overall control scheme is depicted in Figure 6.

4.2.2. Control for Proportional Load Sharing

As explained in Section 3, when the microgrid is islanded, if the battery is full, a full charge and the DG units’ generated power exceeds the total load power demand, and the excessive produced energy starts to flow to the microgrid DC bus capacitors, making the DC voltage rise. A scheme can again be applied to reduce the PMSG output power proportionally to the DC bus voltage increase per unit of the maximum allowed voltage increment.
Based on the wind generation efficiency characteristic shown in Figure 7, it can be observed that if the tip speed ratio λ is increased from the optimum value for MPP ( λ o p t = 6.9 ), the efficiency factor C p decreases from the maximum value (0.42), becoming zero when λ 15.5 . Therefore, an adjustment in the value of the tip speed ratio can be made, according to Figure 8, to force a reduction of generated power in proportion (approximately) to the increase in the DC bus voltage increase.
It is essential to mention that, similarly to the PV power reduction method proposed, wind power is reduced from the level corresponding to the MPP condition in a linear relation with the microgrid DC bus voltage increase per unit of the maximum DC bus voltage variation. Thus, the total load power-sharing among all DG units will be approximately proportional to their respective instantaneous MPPs.

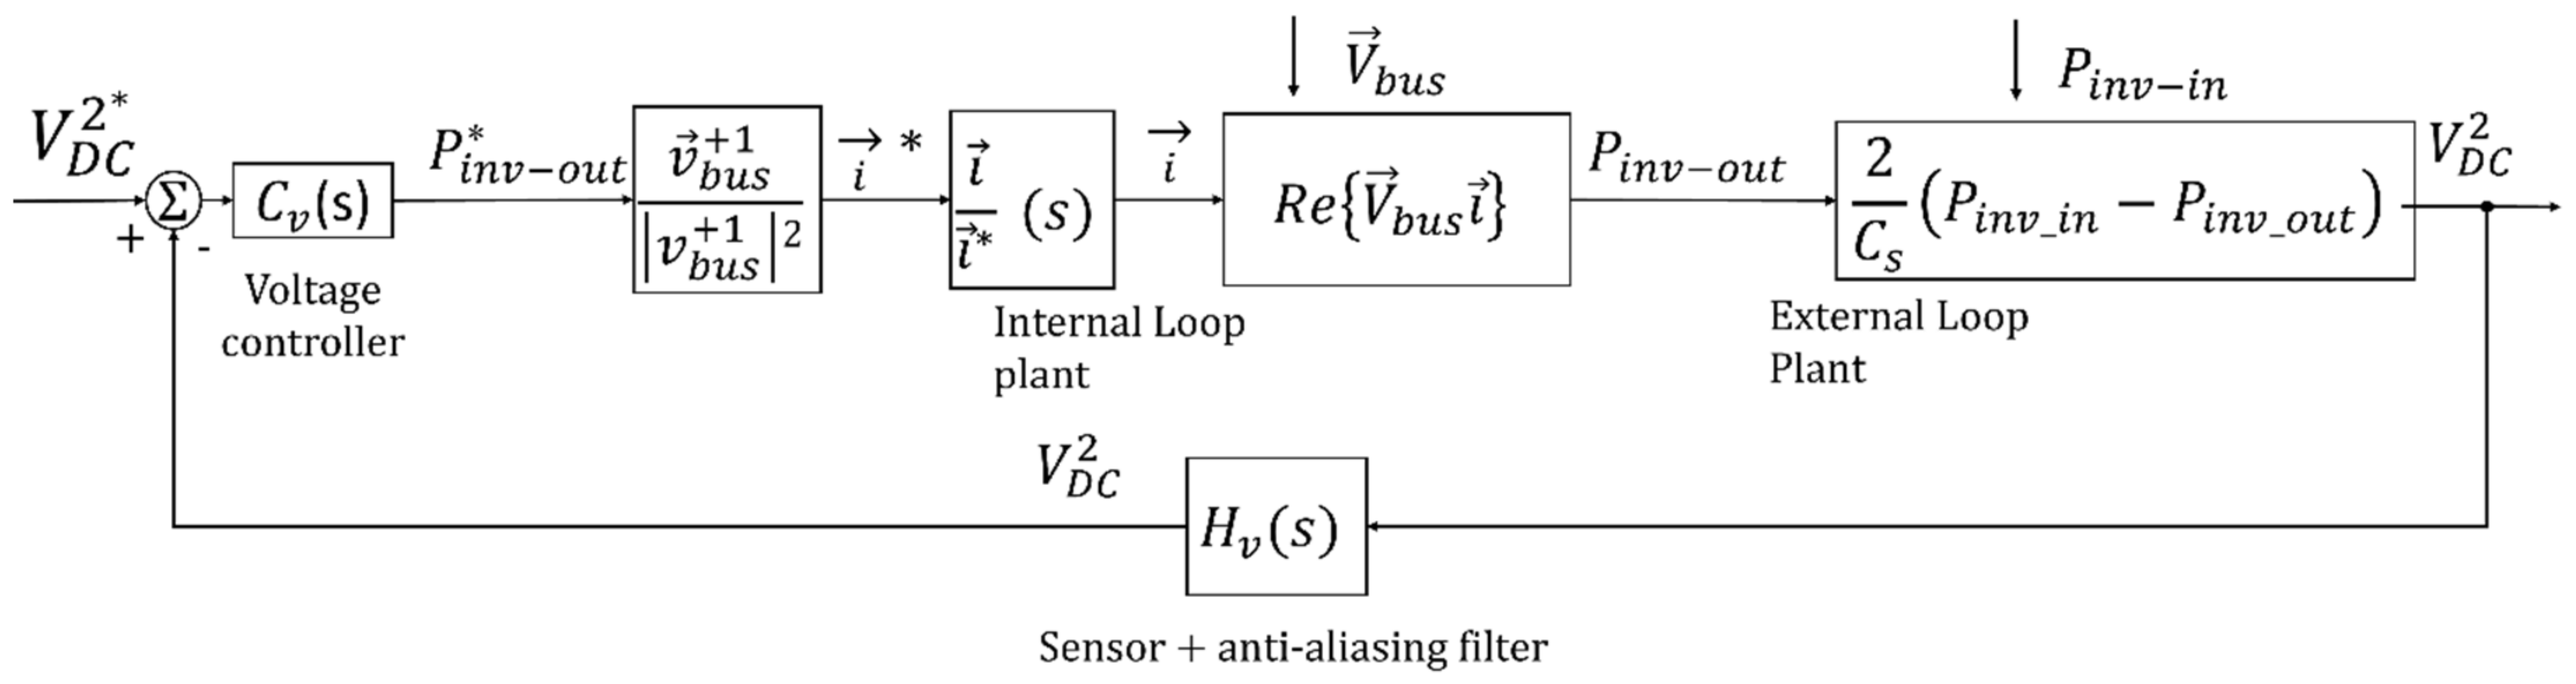
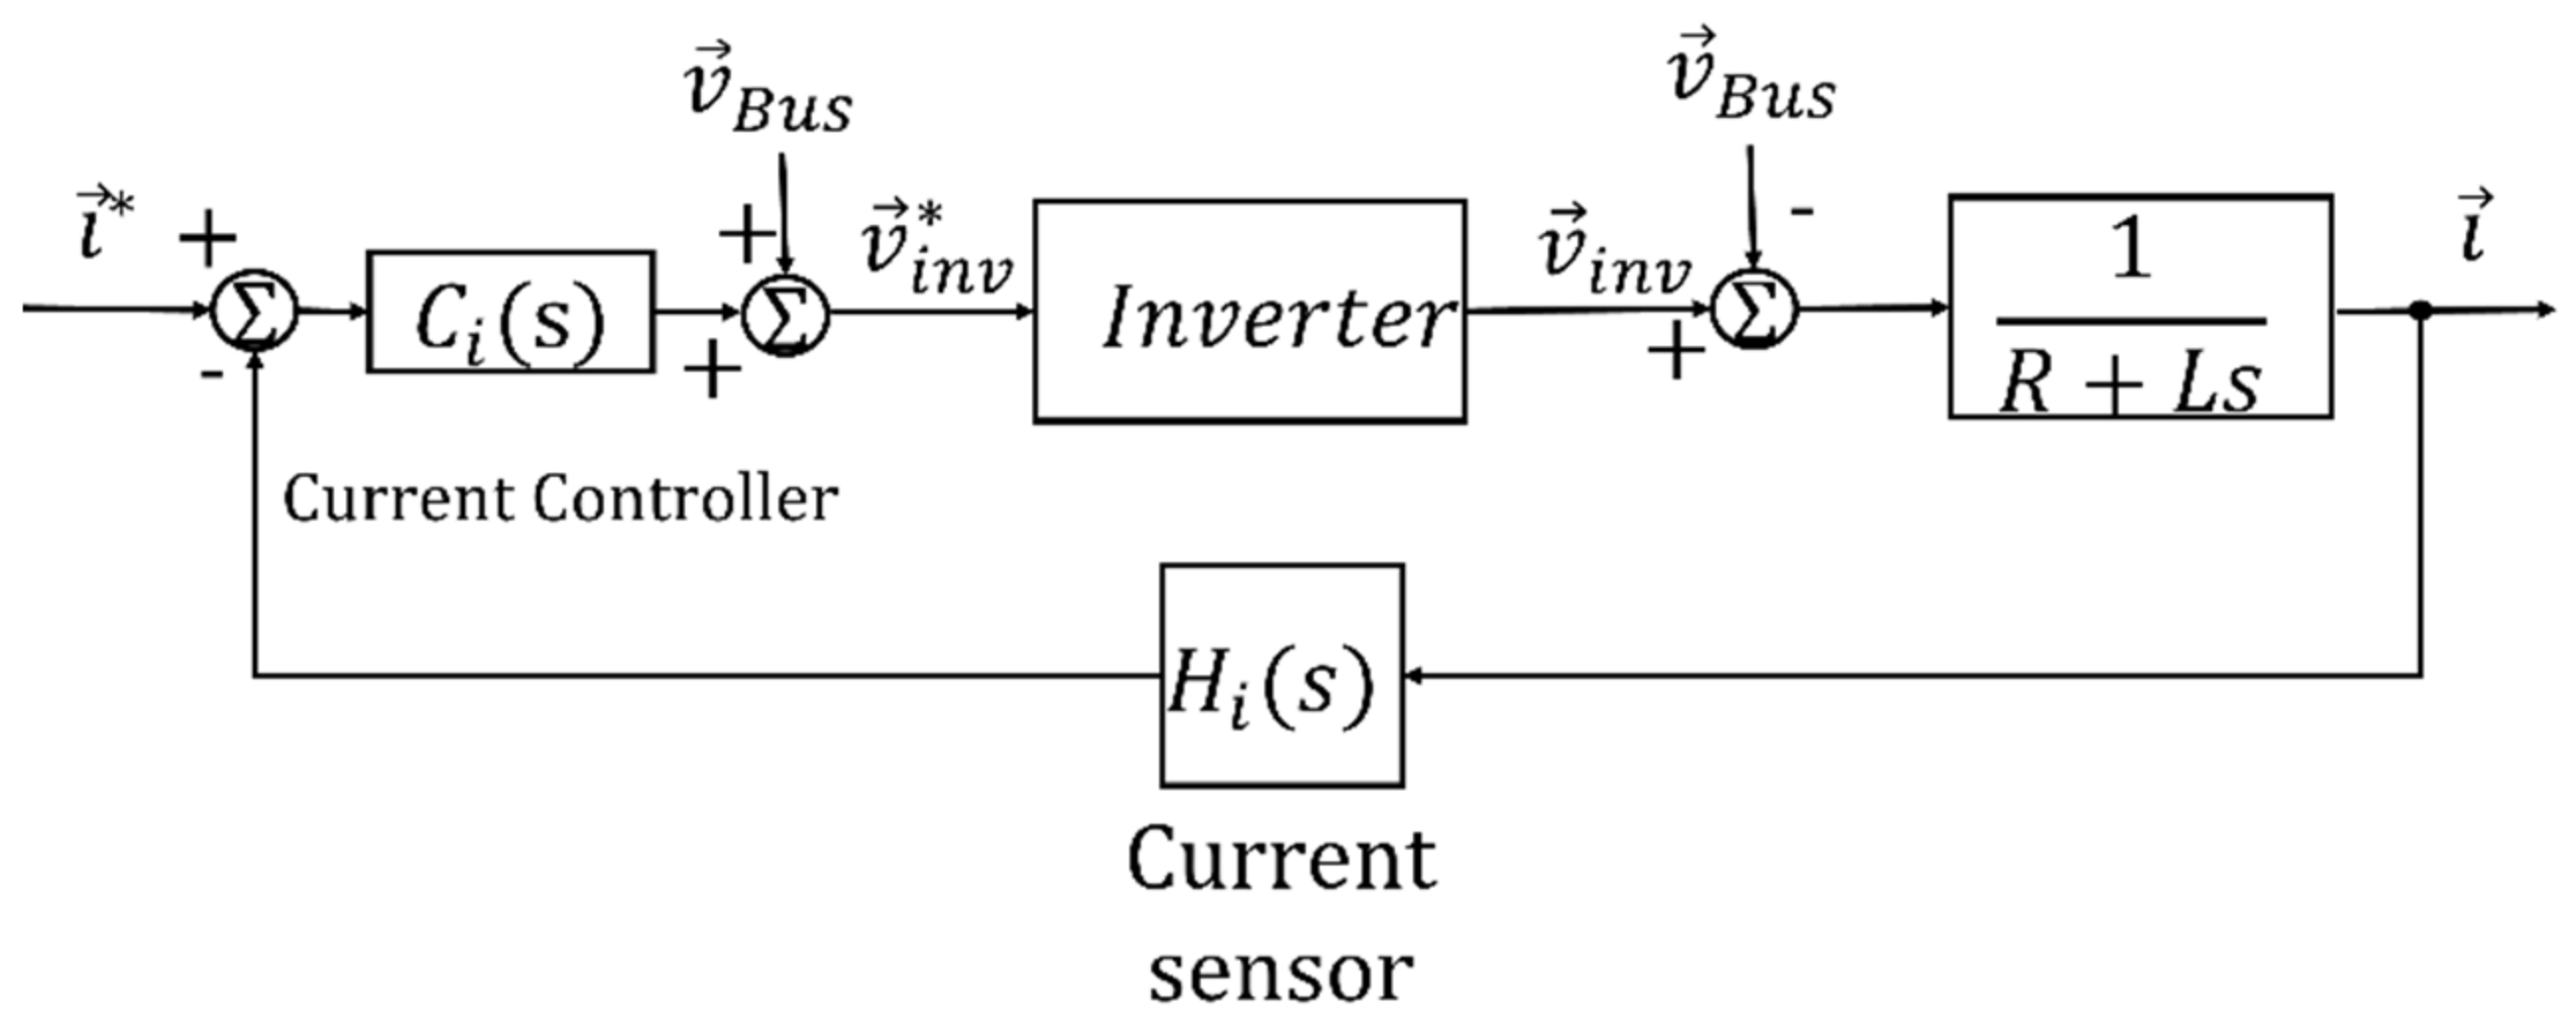
4.3. Control of the Microgrid Inverter

The main objective of the microgrid inverter is to transfer to the microgrid AC bus the excess of power produced by the DG units connected to the microgrid DC bus (or absorb the deficit). Neglecting the system losses, if the net power P I N V _ i n injected into the microgrid DC bus (produced by DG units minus the power consumed by the loads and battery being charged) is higher (lower) than the active power P I N V _ o u t delivered to the microgrid AC bus by the inverter, the difference is absorbed (delivered) by the microgrid DC bus capacitors, and the microgrid DC bus voltage rises (falls). Therefore, the control objective of the microgrid inverter can be accomplished by regulating its DC bus voltage. The effect of P I N V _ i n and P I N V _ o u t on the microgrid DC bus voltage can be written as:
P I N V _ i n P I N V _ o u t = d d t 1 2 C V D C 2 = 1 2 C d d t V D C 2
According to (15), P I N V _ o u t can be used to control V D C 2 (and therefore to control V D C ). Due to the linear relationship between P I N V _ i n P I N V _ o u t and V D C 2 , and since the reference voltage V D C * is constant in a steady-state condition, then a proportional–integral (PI) controller is adopted, taking the error V D C 2 * V D C 2 as input and the negative of the inverter output power P I N V _ o u t * as the output control action. P I N V _ i n is considered a disturbance to be rejected by the controller.
As a second goal, the reactive power delivered by the microgrid AC side should be maintained equal to zero ( Q I N V _ o u t * = 0 ) to avoid unnecessary reactive current components flowing through the inverter.
The above shows that it is necessary to regulate the inverter output of active and reactive powers to achieve the objectives. According to the instantaneous power theory [12], the active and reactive powers delivered to the AC bus of the microgrid can be written, in space-vector α β Clarke coordinates, in terms of the inverter AC output current vector i and microgrid AC bus voltage vector v B U S as follows:
s I N V = p I N V + j q I N V = v B U S i = v B U S α + j v B U S β i α j i β .  
From (16), the inverter output current components necessary to impose the reference values of active and reactive powers are
i α * i β * = 1 v B U S 2 v B U S α v B U S β v B U S β v B U S α P I N V _ o u t * 0 ,  
Alternatively, using complex space vector notation:
i * = P I N V _ o u t * v B U S v B U S 2 .  
Assuming the reference active power P I N V _ o u t * is constant (or slowly varying), if the voltages at the microgrid AC bus are not balanced or contain harmonic components, the currents calculated through (18) would contain the same levels of unbalance and harmonic contamination. For this reason, it is generally preferred to calculate the reference current vector using the positive-sequence fundamental-frequency (FFPS) vector component of v B U S :
i * = P I N V _ o u t * v B U S + 1 v B U S + 1 2 .
Using (19), the active and reactive powers delivered to the microgrid AC bus might contain oscillations, but their mean values correspond to the reference components. Furthermore, the inverter output phase currents will be balanced and sinusoidal. Finally, to ensure the inverter’s desired behavior, inner control loops regulate the inverter α and β current components. The inverter is connected to the microgrid AC bus through an inductive filter, modeled as an LR circuit where L and R are the filter inductance and internal resistance. The following vector equation expresses the relationship between the filter voltages and current in the stationary α β reference frame:
v I N V v B U S = R i + L d i d t .  
Thus, the inverter output voltage vector v I N V can be used to regulate the current vector i . In this case, the microgrid AC voltage vector v B U S is a known disturbance (since it is necessarily measured for computing the current reference), allowing a feedforward compensation.
In [13,14], several current controllers used in grid-connected converters are described and compared. Advanced control techniques are necessary whenever the voltage at the grid point of common coupling (PCC) contains harmonic components and/or unbalance once the controller is required to reject these disturbances. In these cases, the most popular control strategies recommend using PI controllers in multiple DQ reference frames [15], second-order PR controllers in parallel [16], PI controllers with resonant controllers in a rotating DQ reference frame [17], stationary-frame controllers using the space-vector Fourier transform [18], or repetitive controllers (in a real domain [19] or a complex domain [20,21,22]).
This work used a proportional action and some resonant controllers in parallel due to the acceptable performance and relatively simple implementation.
The external loop of the inverter control scheme is shown in Figure 9. If the internal controller is designed to be considerably faster than the external one, then the external controller can be designed neglecting the internal dynamics, i.e., considering i / i * = 1 .
The block diagram of the described internal control loop ( α and β current controllers) is presented in Figure 10.
The internal current control loop must have a high bandwidth and high gains at the fundamental frequency and the harmonic frequencies corresponding to typical harmonic disturbances of the grid. These specifications can be met using proportional action and second-order sinusoidal integrators (SSIs) as resonant controllers in parallel. The selection of the appropriate proportional gain enables the imposition of the desired dynamic response to the system, while the resonant terms, implemented in parallel, guarantee a low steady-state error.
A resonant term is included at the fundamental frequency to track the FFPS reference current with a low steady-state error. Resonant terms are also implemented in the low-order harmonic frequencies (3rd, 5th, 7th, and 9th), considering that these are usual components of disturbances in the voltage. In this context, when selecting the maximum harmonic component h = 9, the minimum 0 dB crossover frequency (fPM) required is 540 Hz (an fPM around 1500 Hz was adopted).
In addition to the phase margin (PM) and the gain margin (GM), the sensitivity index η, which defines the minimum distance from the Nyquist diagram to the critical point 1 ,   0 , is also verified. As a design criterion, we considered GM 3 dB, η 0.3 , and PM 30 ° . The proportional controller gain needed to ensure the desired crossover frequency is k p = 0.09899 . Then, the SSI-based resonant controllers are added in parallel and tuned with the harmonic components h = 6k ± 1 until h = 9. The same resonant gain of k i = 1 was chosen for all resonant units, and it was observed that the desired phase margin was maintained. Concerning the inevitable delay in digital implementation, a computational delay of two samples was considered. The Bode and Nyquist diagrams of the resulting current control loop are presented in Figure 11a,b, respectively, demonstrating that the design criteria were met.
After defining the internal current control loop gains, the much slower external DC bus voltage loop tuning was considered. The 0 dB crossover frequency of the external loop was chosen so that
f c v < f c i 10
where f c v and f c i represent the 0 dB crossover frequencies of the external and internal control loops, respectively. This design criterion is selected so that the DC bus voltage regulation does not compromise the dynamics of the current control. Therefore, for f c i = 1500 Hz, f c v < 150 Hz must be chosen. For practical reasons, in order to avoid the too frequent saturation of the controller output, f c v = 6 Hz was adopted. Furthermore, the indices GM 3 dB and PM 30 ° were considered as design specifications. The frequency response of the open-loop transfer function for k i = 1.0562 and proportional controller gain k p = 0.084 , which is the value that results in the desired crossover frequency f c v = 6 Hz, is shown in Figure 12. The compensated system has a gain margin GM = 65 dB and phase margin PM = 71.5 ° , meeting the design specifications.

4.4. Synchronization with the Electrical Network

In many practical situations, the distribution network exhibits distorted and unbalanced voltages. In these cases, synchronization with the network strongly influences the performance of the entire control scheme of the power converter connected to the network. Determining the correct value of the fundamental-frequency positive-sequence (FFPS) component of the microgrid bus voltage vector is essential for reasonable control of the inverter. This information is obtained through a phase-locked loop (PLL) algorithm.
Several PLL schemes for three-phase systems have been proposed in recent years, the synchronous reference frame PLL (SRF-PLL) being the most popular [23,24]. However, due to its poor performance when the voltages contain harmonics and/or unbalance, preferable alternatives have been presented [25]. In this paper, the PLL scheme that uses the generalized delayed signal cancelation (GDSC) method as a pre-filter to eliminate the effects of unbalances and harmonic components eventually present in the microgrid AC bus voltage was used [26,27]. The choice was based on the fast and accurate determination of the FFPS component of a three-phase signal, even under severe unbalanced and distorted conditions.

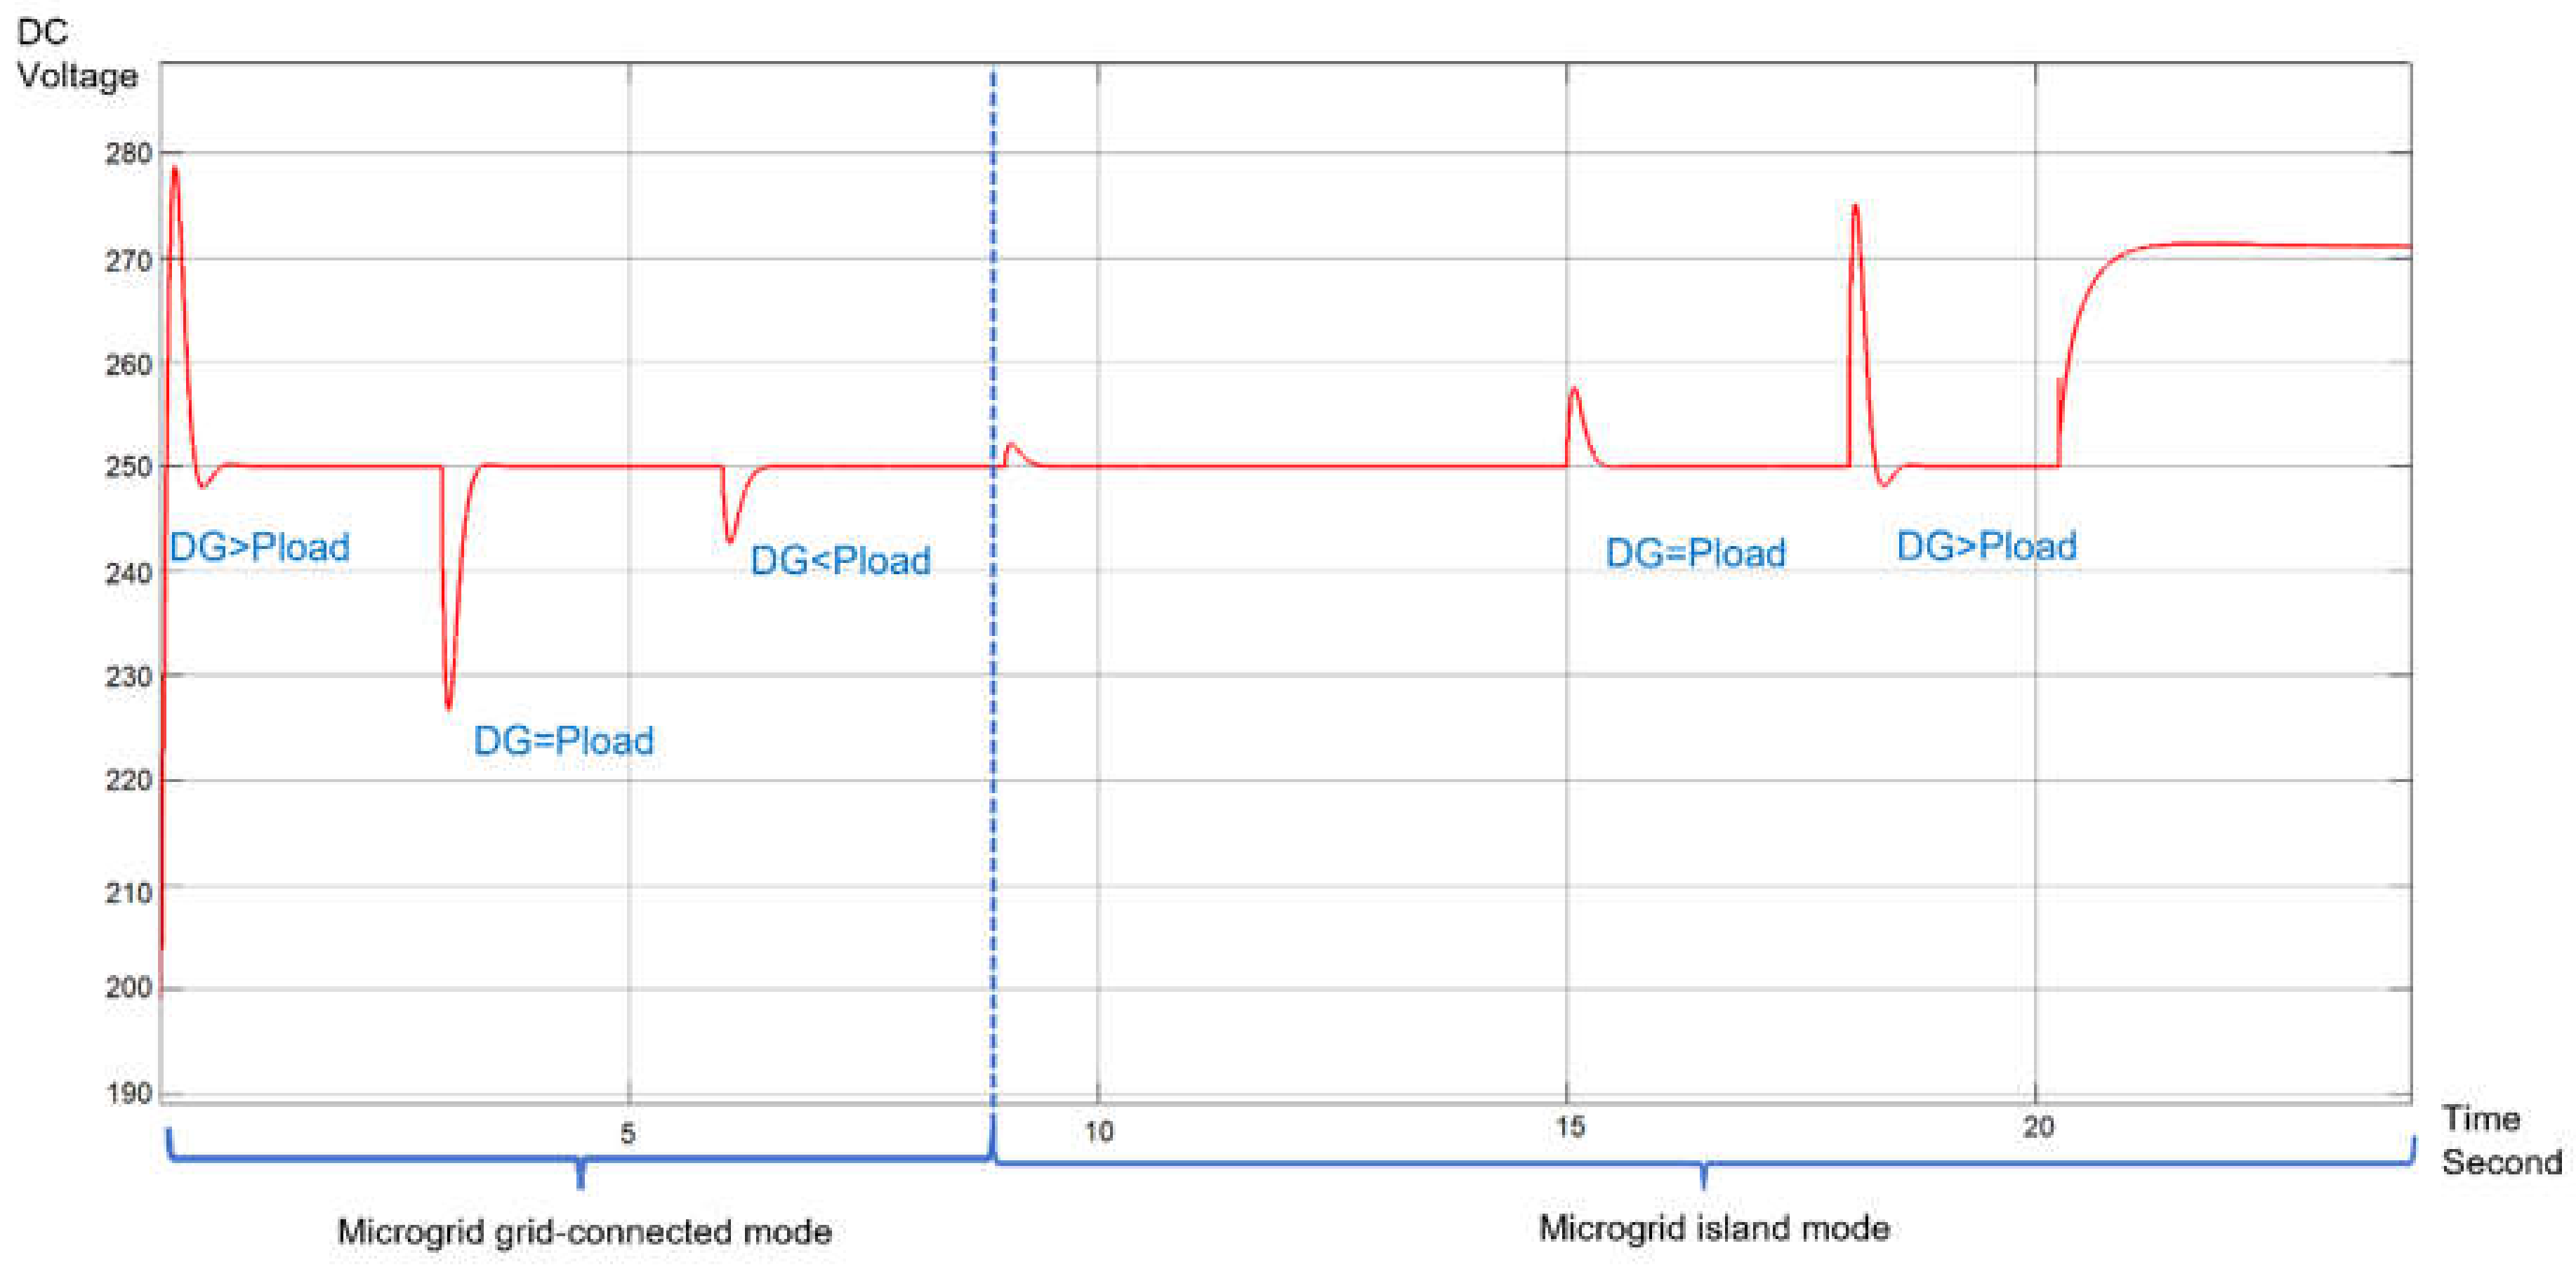
5. Operational Scenarios Used for the Validation of the Proposed System

First, the power flow balance is assumed, i.e., regardless of the state of the distributed generation sources, battery, and load:
PPV + PWT ± PESS − Pload ± Pgrid = 0
The power generated photovoltaic panel = PPV; the power generated by the mini-wind generator = PWT, the power injected or absorbed by the storage system = PESS, the total load power = Pload, and the power injected into or absorbed from the electrical network of the university = Pgrid.
Depending on the microgrid operational condition (interconnected or isolated), the instantaneous generated power, the total load power, and battery state-of-charge, the converters must behave according to the modes of operation described.
For interconnected conditions, it is assumed that the battery does not inject any power into the electrical network; in addition, the PV and WT are maintained at their maximum power points.
  • Interconnected mode, DG > Pload:
    PPV + PWT = Pload + Pgrid; PESS = 0;
  • Interconnected mode, DG = Pload:
    PPV + PWT = Pload; Pgrid = 0; PESS = 0;
  • Interconnected mode, DG < Pload:
    PPV + PWT + Pgrid = Pload; PESS = 0.
For isolated conditions, no power can be transferred to or absorbed from the electricity grid. Therefore, if the balance between generation and load demand does not occur, the battery must supply or absorb the difference. However, the DG units must reduce their generated power to meet the load demand if the battery is completely charged. Thus, the following conditions must be verified:
  • Isolated mode, DG > Pload, battery not fully charged:
    PPV + PWT − PESS = Pload; Pgrid = 0, PV, and wind units under MPPT;
  • Isolated mode, DG > Pload, battery fully charged:
    PPV + PWT = Pload; Pgrid = 0; PESS = 0, PV, and wind units under reduced power mode;
  • Isolated mode, DG = Pload:
    PPV + PWT = Pload; Pgrid = 0; PESS = 0, PV, and wind units under MPPT;
  • Isolated mode, DG < Pload:
    PPV + PWT + PESS = Pload; Pgrid = 0, PV, and wind units under MPPT.

6. Results

A simulation was performed in which load steps were applied for evaluating the operation of the microgrid under all seven of the operational scenarios described.
The behavior of the microgrid DC bus voltage for the different control strategies and operating modes is shown in Figure 13. It can be seen how the DC bus voltage tends to the reference value, regardless of the interconnected or isolated condition of the microgrid, except when the microgrid is isolated, the battery is fully charged, and the load demanded power is lower than the DG available power. In this case, the power generated by each DG unit is reduced in approximate proportion to the increase in the DC bus voltage, as expected. As shown in Figure 14, a relatively smooth transition is achieved for each operating mode of the microgrid.
Initially, the microgrid is connected to the main power system, and three possible situations are considered. (i) DG > Pload: in this case, since the main microgrid DC/AC converter transfers to the grid the excess of generated power, the DC bus voltage is controlled to remain at the rated value, as shown in Figure 13. Additionally, the PV and wind generation units operate under MPPT mode, producing around 480 W and 1900 W, respectively, as observed in Figure 14. The battery is considered to be fully charged and therefore does not absorb any power. (ii) DG = Pload: at t = 3 s, the load power abruptly increases, becoming approximately equal to the total power produced by the DG units. Due to the net power (Pnet = DG-Pload) reduction, the DC bus voltage starts to decrease, but the DC bus voltage controller asks for the DC/AC converter power (Pgrid) to rise until the DC bus voltage returns to the rated value, which occurs when Pgrid = Pnet = 0. (iii) At t = 6 s, the total load power increases again, making DG < Pload. In this case, the DC bus voltage controller is forced to absorb active power from the AC mains (Pgrid < 0) to make VDC = 250 V. The microgrid is connected to the main power system and the DG units generated powers are constant since they remain under MPPT operation. (iv) At t = 9 s, the microgrid interconnection circuit breaker is turned off, making Pgrid = 0. At this moment, the battery interface converter assumes the responsibility for the DC bus voltage control and starts to deliver the necessary net power to regulate the DC bus voltage at its nominal value. (v) At t = 15 s, the total load power decreases so that DG = Pload again. Once the battery is delivering some power to the DC bus voltage, its value tends to increase right after t = 15 s, but the DC bus voltage controller commands a decrease in the power delivered by the battery. (vi) At t = 18 s, an additional decrease in the total load power makes DG > Pload again, and the DC bus voltage experiences a transient increase, but the battery converter again regulates this voltage and absorbs the excess power. However, at some instant after t = 20 s (vii), the battery becomes wholly charged (SoC = max), and the battery cannot absorb any more power. Since DG > Pload, the net power is delivered to the DC bus, the voltage of which naturally starts to increase. During phases (iv), (v), and (vi), the DG units operate under MPPT, but the energy management strategy commands off-MPPT behavior when SoC = max. The power generated by each DG unit decreases in inverse proportion to the DC bus voltage until the total generated power becomes equal to the power demanded by the microgrid loads. As can be seen in Figure 13 and Figure 14, the proposed energy management strategy, together with the proposed DG units’ control schemes, operate as theoretically predicted.

7. Conclusions

The control of a microgrid makes it possible to take full advantage of the distributed generation resources, and this, in turn, allows it to be used to satisfy the energy demand of low voltage electrical installations. These control strategies are necessary to achieve smooth transitions and interaction between the electrical network and the micro-network for each of the operating modes. This paper simulates and evaluates a control strategy that allows power transitions between the microgrid interconnected to the university campus and all possible operating scenarios. The converters have a low number of switches but allow adequate control of each element of the microgrid so that the GD units operate under maximum power point tracking (MPPT) mode or promotes the balance of the generated and load powers.
As observed in the simulations, the correct control strategies for all the elements that make up the distributed generation system, such as for PV MPPT control or load power-sharing, PMSG-based wind turbine MPPT control or load power sharing, the control of the microgrid inverter and the synchronization algorithm demonstrated that the proposed strategy is adequate to integrate electrical microgrids in the low voltage network. This type of technology allows a change in the current electrical energy distribution system, making end-users important actors in regulating, controlling, and decongesting electrical networks.
Currently, work is being done on the implementation phase of the proposed control system in the microgrid that is being developed at the Technological Institute of Santo Domingo as part of a project seeking to integrate electrical microgrids in distributed low voltage electrical networks. Future work will be dedicated to implementing the energy management and control system (EMCS) to allow the management of the microgrid in a testing center that will help to analyze the behavior of the control system proposed.

Author Contributions

Conceptualization, M.A.-M., L.L.-V. and F.N.; methodology, M.A.-M., L.L.-V. and F.N.; software, M.A.-M. and F.N.; validation, F.S., F.N. and V.A.G.; formal analysis, M.A.-M., L.L.-V. and F.N.; investigation, M.A.-M. and L.L.-V.; writing—original draft preparation, M.A.-M.; writing—review and editing, F.S., F.N., D.M.-H. and V.A.G.; visualization, M.A.-M. and D.M.-H.; supervision, L.L.-V. and F.N.; funding acquisition, M.A.-M. All authors have read and agreed to the published version of the manuscript.

Funding

This research was funded by FONDOCYT Grant No. 2018-2019-3C1-160 (055-2019 INTEC) in the Dominican Republic.

Institutional Review Board Statement

Not applicable.

Informed Consent Statement

Not applicable.

Data Availability Statement

Not applicable.

Acknowledgments

The authors gratefully acknowledge the National Background of Innovation and Scientific and Technological Development of the Dominican Republic (FONDOCYT) for the financial support for this research.

Conflicts of Interest

The authors declare no conflict of interest.

References

  1. Impram, S.; Varbak Nese, S.; Oral, B. Challenges of renewable energy penetration on power system flexibility: A survey. Energy Strateg. Rev. 2020, 31, 100539. [Google Scholar] [CrossRef]
  2. Čepin, M. Evaluation of the power system reliability if a nuclear power plant is replaced with wind power plants. Reliab. Eng. Syst. Saf. 2019, 185, 455–464. [Google Scholar] [CrossRef]
  3. Aybar-Mejía, M.; Villanueva, J.; Mariano-Hernández, D.; Santos, F.; Molina-García, A. A Review of Low-Voltage Renewable Microgrids: Generation Forecasting and Demand-Side Management Strategies. Electronics 2021, 10, 2093. [Google Scholar] [CrossRef]
  4. Ma, T.; Cintuglu, M.H.; Mohammed, O. Control of hybrid AC/DC microgrid involving energy storage, renewable energy and pulsed loads. In Proceedings of the 2015 IEEE Industry Applications Society Annual Meeting, Addison, TX, USA, 18–22 October 2015; pp. 1–8. [Google Scholar]
  5. Hosseinzadeh, M.; Salmasi, F.R. Robust Optimal Power Management System for a Hybrid AC/DC Micro-Grid. IEEE Trans. Sustain. Energy 2015, 6, 675–687. [Google Scholar] [CrossRef]
  6. Hu, J.; Shan, Y.; Xu, Y.; Guerrero, J.M. A coordinated control of hybrid ac/dc microgrids with PV-wind-battery under variable generation and load conditions. Int. J. Electr. Power Energy Syst. 2019, 104, 583–592. [Google Scholar] [CrossRef] [Green Version]
  7. Silva, E.A.; Bradaschia, F.; Cavalcanti, M.C.; Nascimento, A.J. Parameter Estimation Method to Improve the Accuracy of Photovoltaic Electrical Model. IEEE J. Photovolt. 2016, 6, 278–285. [Google Scholar] [CrossRef]
  8. Slootweg, J.G.; Polinder, H.; Kling, W.L. Dynamic modelling of a wind turbine with doubly fed induction generator. In Proceedings of the 2001 Power Engineering Society Summer Meeting. Conference Proceedings (Cat. No.01CH37262), Vancouver, BC, Canada, 15–19 July 2001; Volume 1, pp. 644–649. [Google Scholar]
  9. Wijewardana, S.M. New Dynamic Battery Model for Hybrid Vehicles and Dynamic Model Analysis Using Simulink. Eng. J. Inst. Eng. Sri Lanka 2014, 47, 53. [Google Scholar] [CrossRef] [Green Version]
  10. Zhu, C.; Li, X.; Song, L.; Xiang, L. Development of a theoretically based thermal model for lithium ion battery pack. J. Power Sources 2013, 223, 155–164. [Google Scholar] [CrossRef]
  11. Mejias, M.A.; Landera, Y.G.; Viltre, L.L. Comparison of maximum power point tracking techniques used in photovoltaic system. ITEGAM-JETIA 2021, 7, 4–12. [Google Scholar] [CrossRef]
  12. Akagi, H.; Watanabe, E.H.; Aredes, M. Instantaneous Power Theory and Applications to Power Conditioning; Wiley: Hoboken, NJ, USA, 2007; ISBN 9780470118924. [Google Scholar]
  13. Limongi, L.R.; Bojoi, R.; Griva, G.; Tenconi, A. Digital current-control schemes. IEEE Ind. Electron. Mag. 2009, 3, 20–31. [Google Scholar] [CrossRef] [Green Version]
  14. Neto, R.C.; Neves, F.A.S.; de Souza, H.E.P. Complex Controllers Applied to Space Vectors: A Survey on Characteristics and Advantages. J. Control. Autom. Electr. Syst. 2020, 31, 1132–1152. [Google Scholar] [CrossRef]
  15. Bojrup, M.; Karlsson, P.; Alaküla, M.; Gertmar, L. Multiple Rotating Integrator Controller for Active Filters. In Proceedings of the EPE 99 Conference, Lausanne, Switzerland, 7–9 September 1999. [Google Scholar]
  16. Yuan, X.; Allmeling, J.; Merk, W.; Stemmler, H. Stationary frame generalized integrators for current control of active power filters with zero steady state error for current harmonics of concern under unbalanced and distorted operation conditions. In Proceedings of the Conference Record of the 2000 IEEE Industry Applications Conference. Thirty-Fifth IAS Annual Meeting and World Conference on Industrial Applications of Electrical Energy (Cat. No.00CH37129), Rome, Italy, 8–12 October 2000; Volume 4, pp. 2143–2150. [Google Scholar]
  17. Lascu, C.; Asiminoaei, L.; Boldea, I.; Blaabjerg, F. High Performance Current Controller for Selective Harmonic Compensation in Active Power Filters. IEEE Trans. Power Electron. 2007, 22, 1826–1835. [Google Scholar] [CrossRef]
  18. Neves, F.A.S.; Arcanjo, M.A.C.; Azevedo, G.M.S.; de Souza, H.E.P.; Viltre, L.T.L. The SVFT-Based Control. IEEE Trans. Ind. Electron. 2014, 61, 4152–4160. [Google Scholar] [CrossRef]
  19. Escobar, G.; Hernandez-Briones, P.G.; Martinez, P.R.; Hernandez-Gomez, M.; Torres-Olguin, R.E. A Repetitive-Based Controller for the Compensation of 6ℓ±1 Harmonic Components. IEEE Trans. Ind. Electron. 2008, 55, 3150–3158. [Google Scholar] [CrossRef]
  20. Luo, Z.; Su, M.; Yang, J.; Sun, Y.; Hou, X.; Guerrero, J.M. A Repetitive Control Scheme Aimed at Compensating the 6k + 1 Harmonics for a Three-Phase Hybrid Active Filter. Energies 2016, 9, 787. [Google Scholar] [CrossRef] [Green Version]
  21. Zimann, F.J.; Neto, R.C.; Neves, F.A.S.; de Souza, H.E.P.; Batschauer, A.L.; Rech, C. A Complex Repetitive Controller Based on the Generalized Delayed Signal Cancelation Method. IEEE Trans. Ind. Electron. 2019, 66, 2857–2867. [Google Scholar] [CrossRef]
  22. Neto, R.C.; Neves, F.A.S.; de Souza, H.E.P. Complex nk+m Repetitive Controller Applied to Space Vectors: Advantages and Stability Analysis. IEEE Trans. Power Electron. 2021, 36, 3573–3590. [Google Scholar] [CrossRef]
  23. Kaura, V.; Blasko, V. Operation of a phase locked loop system under distorted utility conditions. IEEE Trans. Ind. Appl. 1997, 33, 58–63. [Google Scholar] [CrossRef]
  24. Chung, S.-K. A phase tracking system for three phase utility interface inverters. IEEE Trans. Power Electron. 2000, 15, 431–438. [Google Scholar] [CrossRef] [Green Version]
  25. Golestan, S.; Monfared, M.; Freijedo, F.D. Design-Oriented Study of Advanced Synchronous Reference Frame Phase-Locked Loops. IEEE Trans. Power Electron. 2013, 28, 765–778. [Google Scholar] [CrossRef]
  26. Neves, F.A.S.; Cavalcanti, M.C.; de Souza, H.E.P.; Bradaschia, F.; Bueno, E.J.; Rizo, M. A Generalized Delayed Signal Cancellation Method for Detecting Fundamental-Frequency Positive-Sequence Three-Phase Signals. IEEE Trans. Power Deliv. 2010, 25, 1816–1825. [Google Scholar] [CrossRef]
  27. Neves, F.A.S.; de Souza, H.E.P.; Cavalcanti, M.C.; Peña, E. Low effort digital filters for fast sequence components separation of unbalanced and distorted three-phase signals. In Proceedings of the 2010 IEEE International Symposium on Industrial Electronics, Bari, Italy, 4–7 July 2010; pp. 2927–2932. [Google Scholar]
Figure 1. Topology of the PV–wind–ESS hybrid microgrid.
Applsci 11 11355 g001
Figure 2. Microgrid energy management strategy.
Applsci 11 11355 g002
Figure 3. Equivalent circuit of the photovoltaic cell.
Applsci 11 11355 g003
Figure 4. Typical P–V characteristic of a PV string.
Applsci 11 11355 g004
Figure 5. PV output voltage references calculation for MPPT and for reduced generation to track load power demand.
Applsci 11 11355 g005
Figure 6. Control of the PMSG.
Applsci 11 11355 g006
Figure 7. Wind turbine typical efficiency characteristic, considering the fixed blades’ pitch angle.
Applsci 11 11355 g007
Figure 8. Wind generation schemes for MPPT or adaptation to load power demand.
Applsci 11 11355 g008
Figure 9. Simplified block diagram of the microgrid inverter’s external control loop.
Applsci 11 11355 g009
Figure 10. Simplified block diagram of the internal current control loop of the microgrid inverter.
Applsci 11 11355 g010
Figure 11. The Bode and Nyquist diagrams of the resulting current control loop. (a) Nyquist diagrams of the open-loop system with computational time delay compensation. (b) Bode diagrams of the open-loop system with computational time delay compensation. Results were obtained for the proportional controller (blue) and P-SSI in parallel (green).
Applsci 11 11355 g011
Figure 12. Bode diagrams of the DC bus voltage open-loop control system.
Applsci 11 11355 g012
Figure 13. Voltage DC bus microgrid.
Applsci 11 11355 g013
Figure 14. Relation of electrical power between the control strategies and modes of operation of the microgrid with PPV, PWT, PESS, Pload, and Pgrid.
Applsci 11 11355 g014
Table 1. Model of photovoltaic modules.
ModelFeature
One-diode modelConsiders the photogenerated current and the diffusion diode current, which correspond to the electronic conduction phenomena in the neutral zone of the semiconductor.
Series resistanceRepresents the losses of the metal contacts of the module.
Parallel resistanceRepresents losses from eddy currents circulating in the module.
DiodeRepresents the recombination of carriers in the semiconductor charge zone.
I P H Current generated by the PV cell.
Publisher’s Note: MDPI stays neutral with regard to jurisdictional claims in published maps and institutional affiliations.

