Article

Wind Tunnel Test on Windblown Sand Two-Phase Flow Characteristics in Arid Desert Regions

1
School of Civil Engineering and Architecture, Hainan University, Haikou 570228, China
2
Key Laboratory of Building Safety and Energy Efficiency of the Ministry of Education, Hunan University, Changsha 410082, China
3
School of Vocational Engineering, Health and Sciences, RMIT University, GPO Box 2476, Melbourne, VIC 3001, Australia
4
Key Laboratory of Solar Thermal Energy and Photovoltaic System, Chinese Academy of Sciences, Beijing 100190, China
*
Author to whom correspondence should be addressed.
Appl. Sci. 2021, 11(23), 11349; https://doi.org/10.3390/app112311349
Submission received: 6 October 2021 / Revised: 27 November 2021 / Accepted: 27 November 2021 / Published: 30 November 2021

Abstract

:
Windblown sand two-phase flow characteristics become an essential factor in evaluating the windblown sand load on infrastructures and civil structures. Based on the measured wind characteristics in arid desert regions, windblown sand flow fields with three kinds of sand beds are simulated in the wind tunnel, respectively. The results indicate that the characteristic saltation height of sand particles increases with the wind speed and particle size in the windblown sand flow field. As the sand concentration increases, the wind speed decreases, and the turbulence intensity increases. The concentration, energy, and impact pressure of sand particles increase with increasing wind speed and decrease exponentially with increasing height. At the same wind speed, the concentration, energy, and impact pressure of the coarse sand, fine sand, and mixed sand increases, in turn. Moreover, the variation of kinetic energy with height is similar to that of total energy with height and the proportion of potential energy to total energy is quite small.

1. Introduction

There are many cases of interaction between windblown sand and infrastructures and civil structures in arid desert regions. For example, windblown sand affects the operation of roads and railways by reducing visibility, eroding and scouring roadbeds, burying roads and tracks, breaking windows, and causing trains to derail [1,2,3,4,5]. Windblown sand also exposes oil and gas pipelines in desert regions and erodes the pipeline structures [6,7,8]. In addition, windblown sand seriously attacks farms [9], buildings [10,11], bridges [12], photovoltaic systems [13], thermal power generation systems [14,15], and other structures. In short, windblown sand may cause the capacity loss of infrastructures and civil structures, and even the occurrence of catastrophic events, thereby increasing management and maintenance costs. In the windblown sand environment, infrastructures and civil structures are subjected to both wind load and particle impact load, and their control load is the sum of the two, namely the windblown sand load. In this case, if only the wind load is considered and the particle impact load is ignored, infrastructures and civil structures will be in an unsafe state. Understanding the flow field characteristics of the actual site is the basis for studying structural wind-induced load through wind tunnel tests and numerical simulation methods. Therefore, to evaluate the windblown sand load on infrastructures and civil structures in arid desert regions, it is the first task to study the characteristics of windblown sand two-phase flow.
Ehrenberg pointed out that wind force plays an important role in the formation of the landforms and defined the characteristics of moving sand dust under wind force in the middle of the 19th century [16], which means the windblown sand began to be noticed. After numerous expeditions in the Libyan desert [17] and wind tunnel tests [18,19], Bagnold published “The Physics of Blown Sand and Desert Dunes” in 1941 [20], which is known as the symbol of the birth of Aeolian Physics. Up to now, the theories on Aeolian Physics have further systematically developed, which covers aeolian processes, aeolian landforms, geomorphology, environmental impacts, and wind erosion. At the same time, researchers have used various methods in Aeolian Physics, including theoretical analysis, field observation, numerical simulation, wind tunnel tests, and the combination of wind tunnel tests and high-speed photography techniques, etc. [21,22,23,24,25]. In view of the above, we try to absorb the theory from Aeolian Physics into the research of structural wind engineering, which would provide a new research direction for the windblown sand resistance design of infrastructures and civil structures in arid desert regions.
There are a lot of studies on the flow field characteristics that affect the structural wind effect, including the flow field characteristics of monsoon, typhoon, tornado, and other phenomena [26,27,28,29]. However, there are few studies on the flow field characteristics of windblown sand that threaten structural safety. Existing research on windblown sand mainly focus on Aeolian Physics. The observation heights of windblown sand flow in most previous studies are generally less than 10 m; all measured results show that the sand amount decreases obviously with increasing height, and there is rarely collected sand at a height of 10 m [3,30,31]. Through long-term field measurement in the Tengger Desert, Zhang et al. found that the vertical and horizontal distribution of sand mass flux was expressed with exponential functions and power functions, respectively, [32]. Because the research intention of Aeolian Physics is different from that of structural wind engineering, there is little research on the turbulence characteristics in the field measurement of windblown sand. In fact, since the sampling frequency of the anemometer is lower than 1 Hz, it is also difficult to analyze the turbulence characteristics under the actual terrain conditions, although turbulence has an influence on the characteristics of sand transport. For this reason, Huang et al. obtained the wind characteristics within 10 m height in typical desert regions through field measurement [33], which could provide a basis for turbulence simulation in wind tunnel tests.
The field measurement is mainly used to analyze the wind regime and sand transport rate in arid desert regions, and it is difficult to analyze the influence of the sand concentration on the wind profile and turbulence characteristics in the windblown sand flow field. Through the wind tunnel tests, some researchers analyzed the sand transport rate models with different particle sizes [34,35], and found that the parameters in the model are affected by the particle size and wind speed. Nevertheless, the actual wind field in desert regions is simulated as a uniform flow field in the wind tunnel, without taking into account the actual fluctuating characteristics, which will lead to the deviation between the test results and the measured results. Additionally, in the existing windblown sand tests, the influence of sand concentration on wind profile and turbulence intensity in windblown sand flow field had not been analyzed in detail. Some researchers also attempted to simulate fluctuating characteristics in the actual environment through the numerical simulation method and analyzed the sand particle’s saltation and the evolution of windblown sand flow [31,36]. However, the application of two-phase flow model and the differences of structure characteristics between simulated windblown sand flow field and actual environment affected the accuracy of the results. Hence, verification by field measurements and wind tunnel tests is necessary.
The erosion and damage mechanism of various structures and materials in the windblown sand environment is closely related to the saltation movement of sand particles [37,38]. As the most important research area of windblown sand flow, the energy and impact pressure distribution of saltating sand particles become the breakthrough point of wind erosion control, wear resistance, windblown sand mitigation and windblown sand resistance design of structures. However, there are few studies on the energy and impact pressure distribution models of sand particles in the windblown sand flow field. The research conducted by Zou et al. showed that the variations in kinetic energy and total energy of sand particles with height accord with the pulse peak modified with power term law [39]. It is also worth noting that the wind tunnel test conducted by Zou et al. did not take the influence of the turbulence characteristics of the incoming flow on the sand transport into account [39]. Huang et al. simulated the sandstorm environment by having the sand fall from the top of the wind tunnel; the results showed that the critical height of the impact pressure profile is approximately 20 cm [33]. In other words, the impact pressure increases above 20 cm and decreases below 20 cm with increasing height.
Furthermore, Dong et al. investigated the influence of the fetch length of the sand tray on the sand transport flux profile through detailed wind tunnel tests [40], which showed that when the length of sand tray is larger than the threshold length, the sand transport flux profile is no longer affected, and the threshold length is related to wind speed. Some research focused on a detailed assessment of the effectiveness of various windblown sand mitigation measures along roads, highways and railways in cold and arid regions [1,3,5,41], while there are few studies on the windblown sand resistance design for infrastructures and civil structures [42]. All of the above studies need to be carried out based on an in-depth understanding of the characteristics of the windblown sand flow field.
In this study, based on measured impurity-free wind characteristics in typical desert regions, windblown sand flow fields with beds of fine sand, coarse sand, and mixed sand are simulated in the wind tunnel. The comparison of wind profiles and turbulence intensities between impurity-free wind flow fields and windblown sand flow fields are also presented to explore the influence of sand particles on wind characteristics. Furthermore, movement characteristics, concentration, energy, and impact pressure distribution of sand particles in three kinds of windblown sand flow fields are analyzed systematically.

2. Experimental Apparatus, Methods and Design

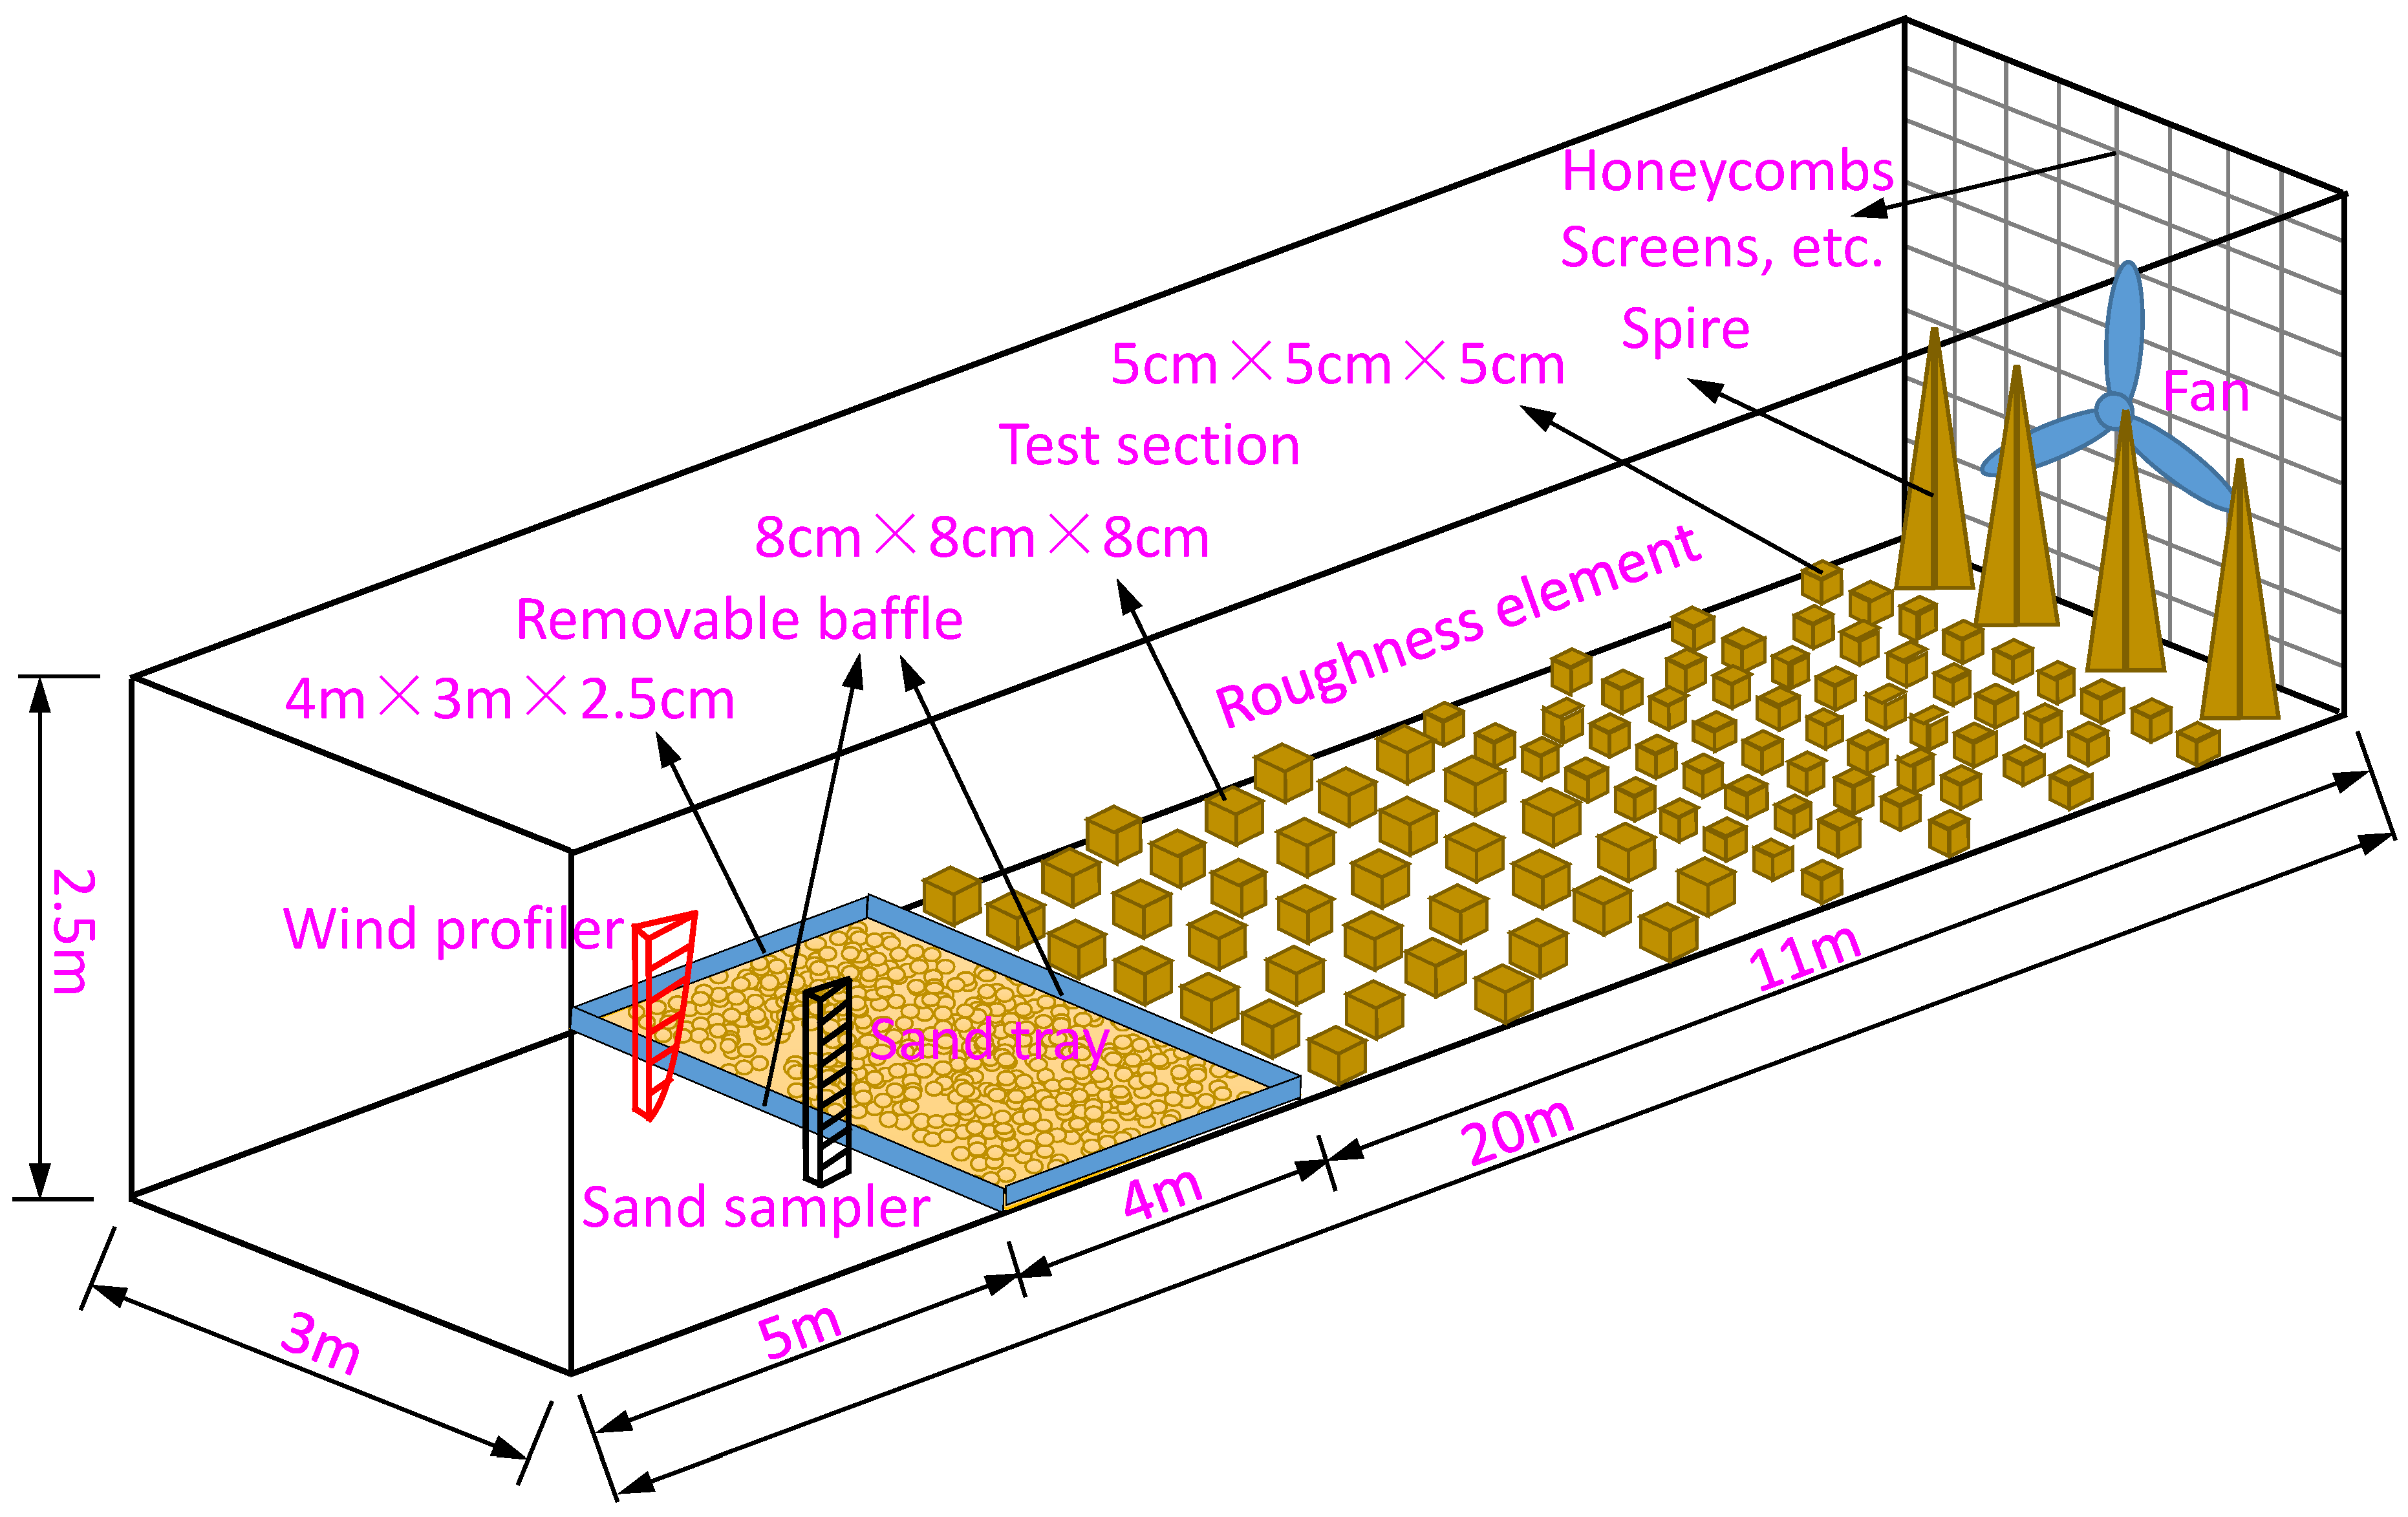
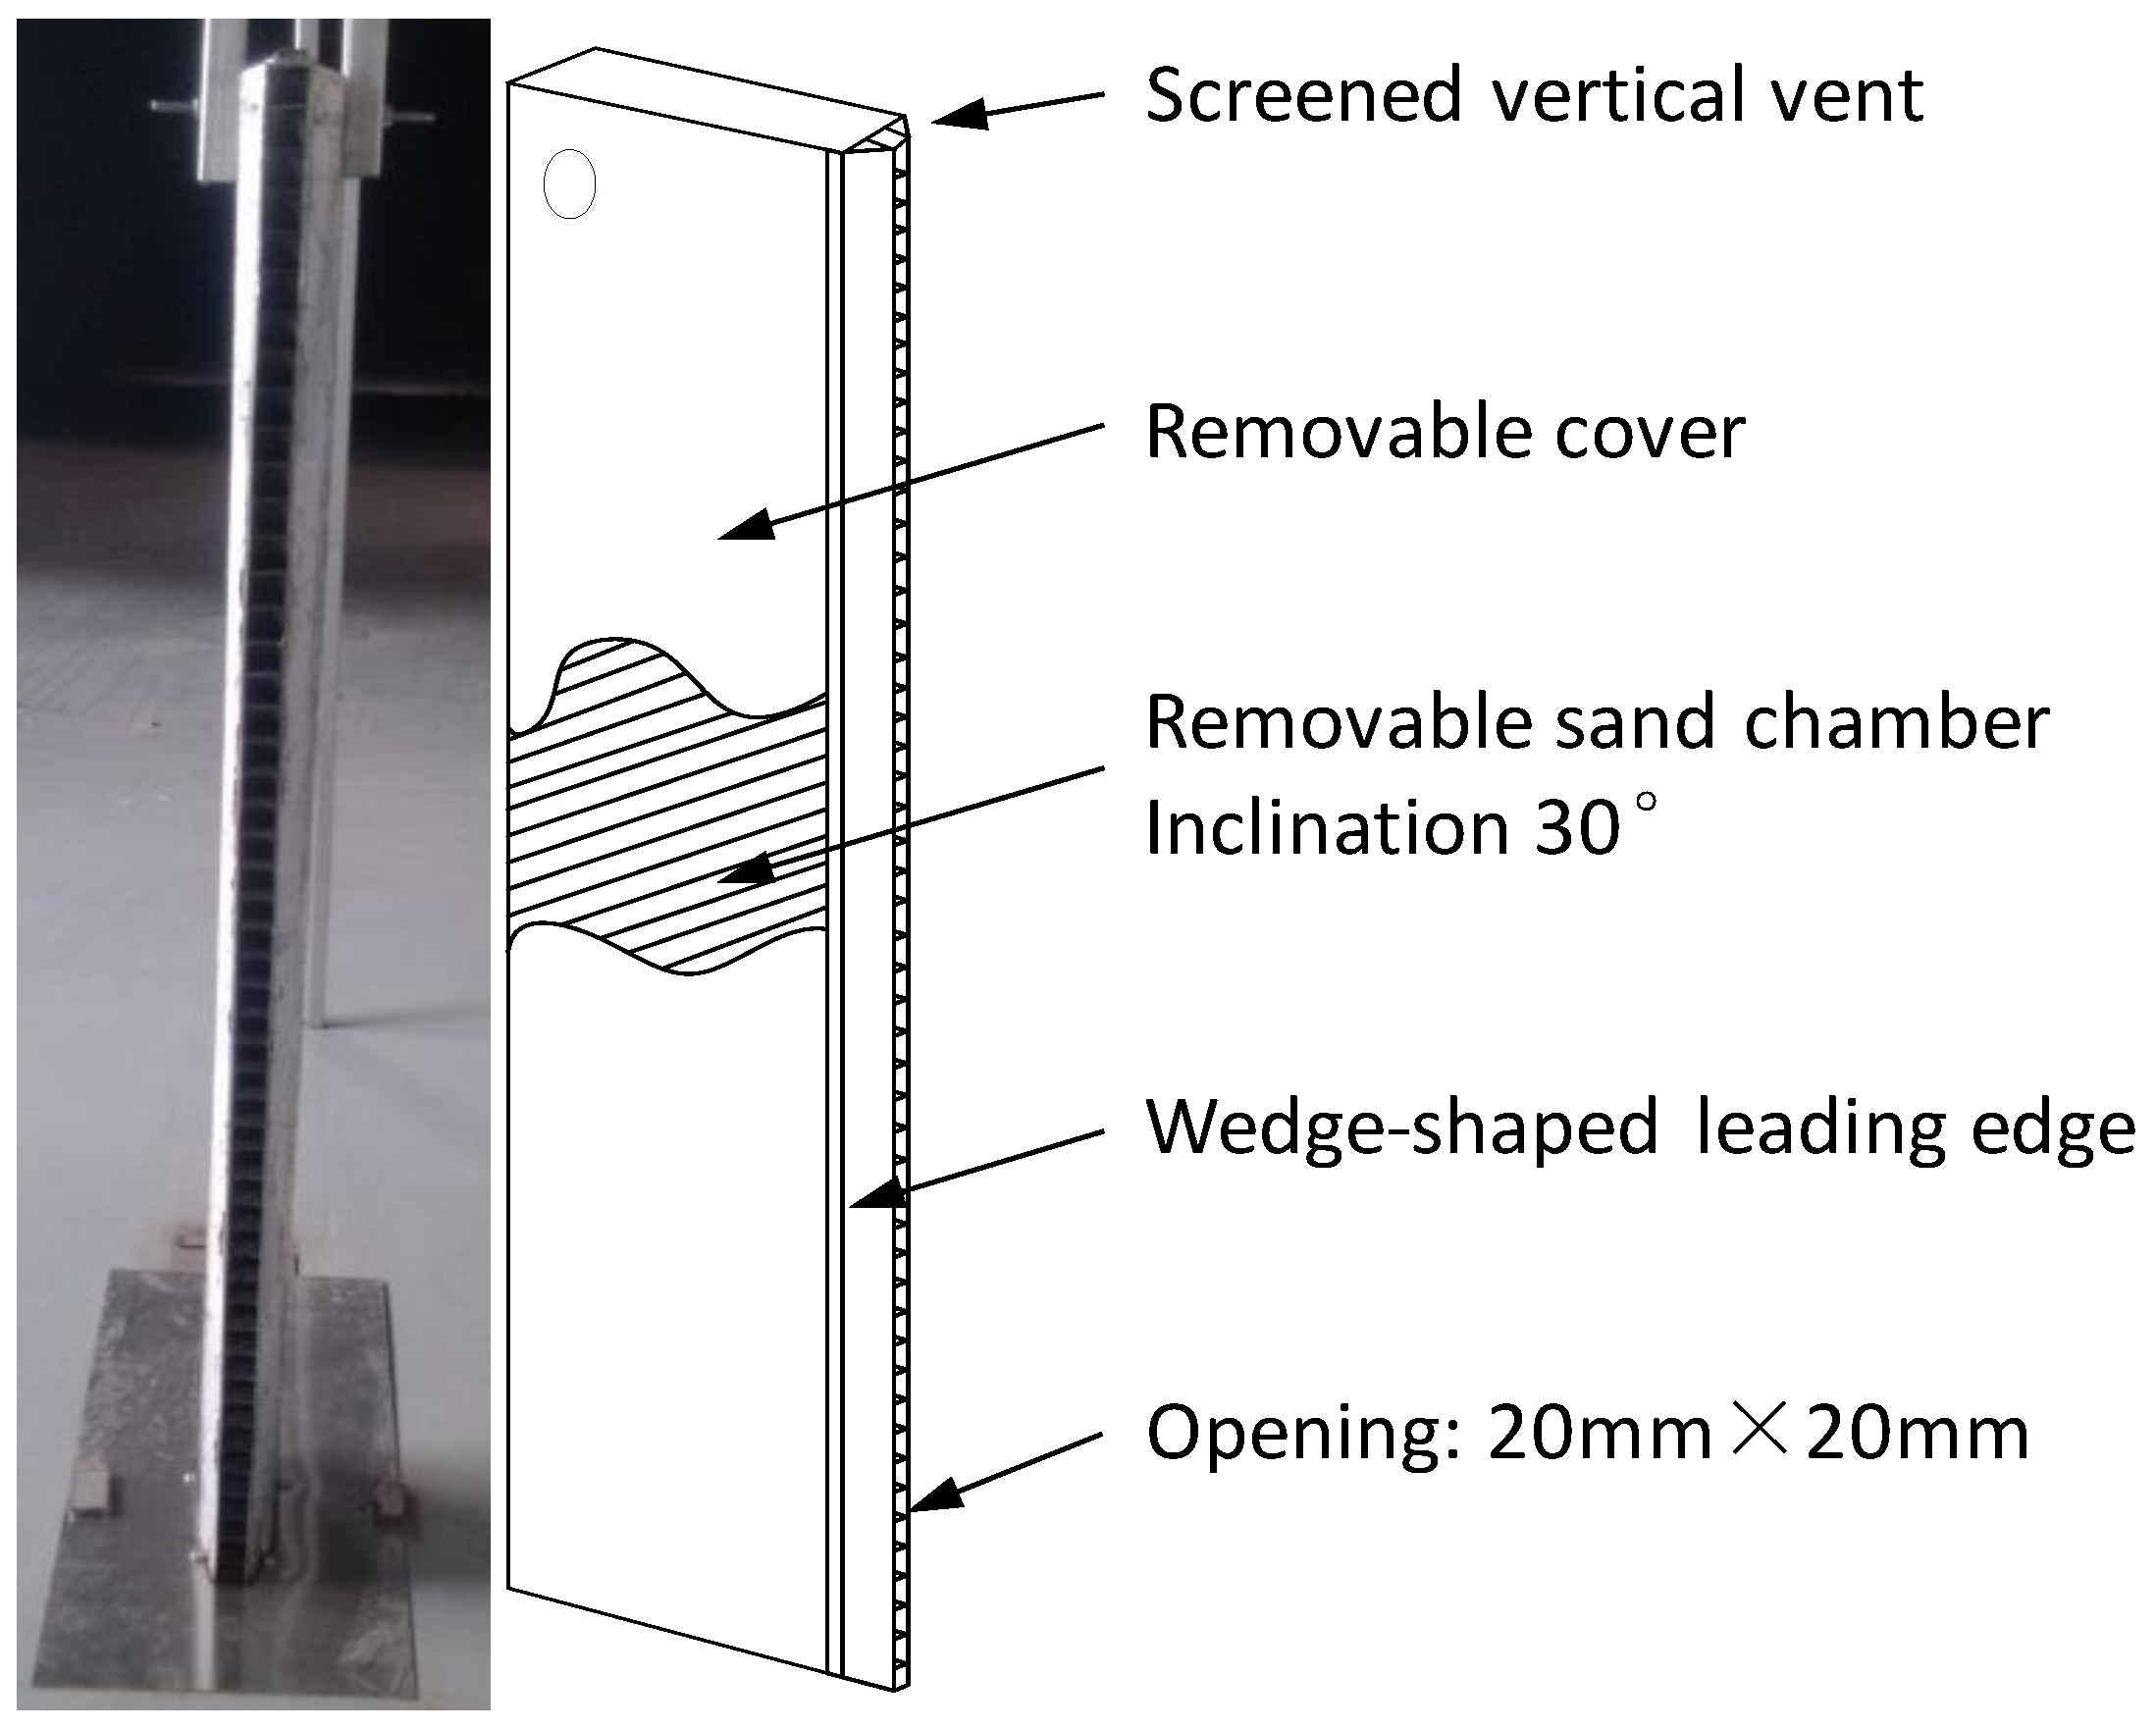
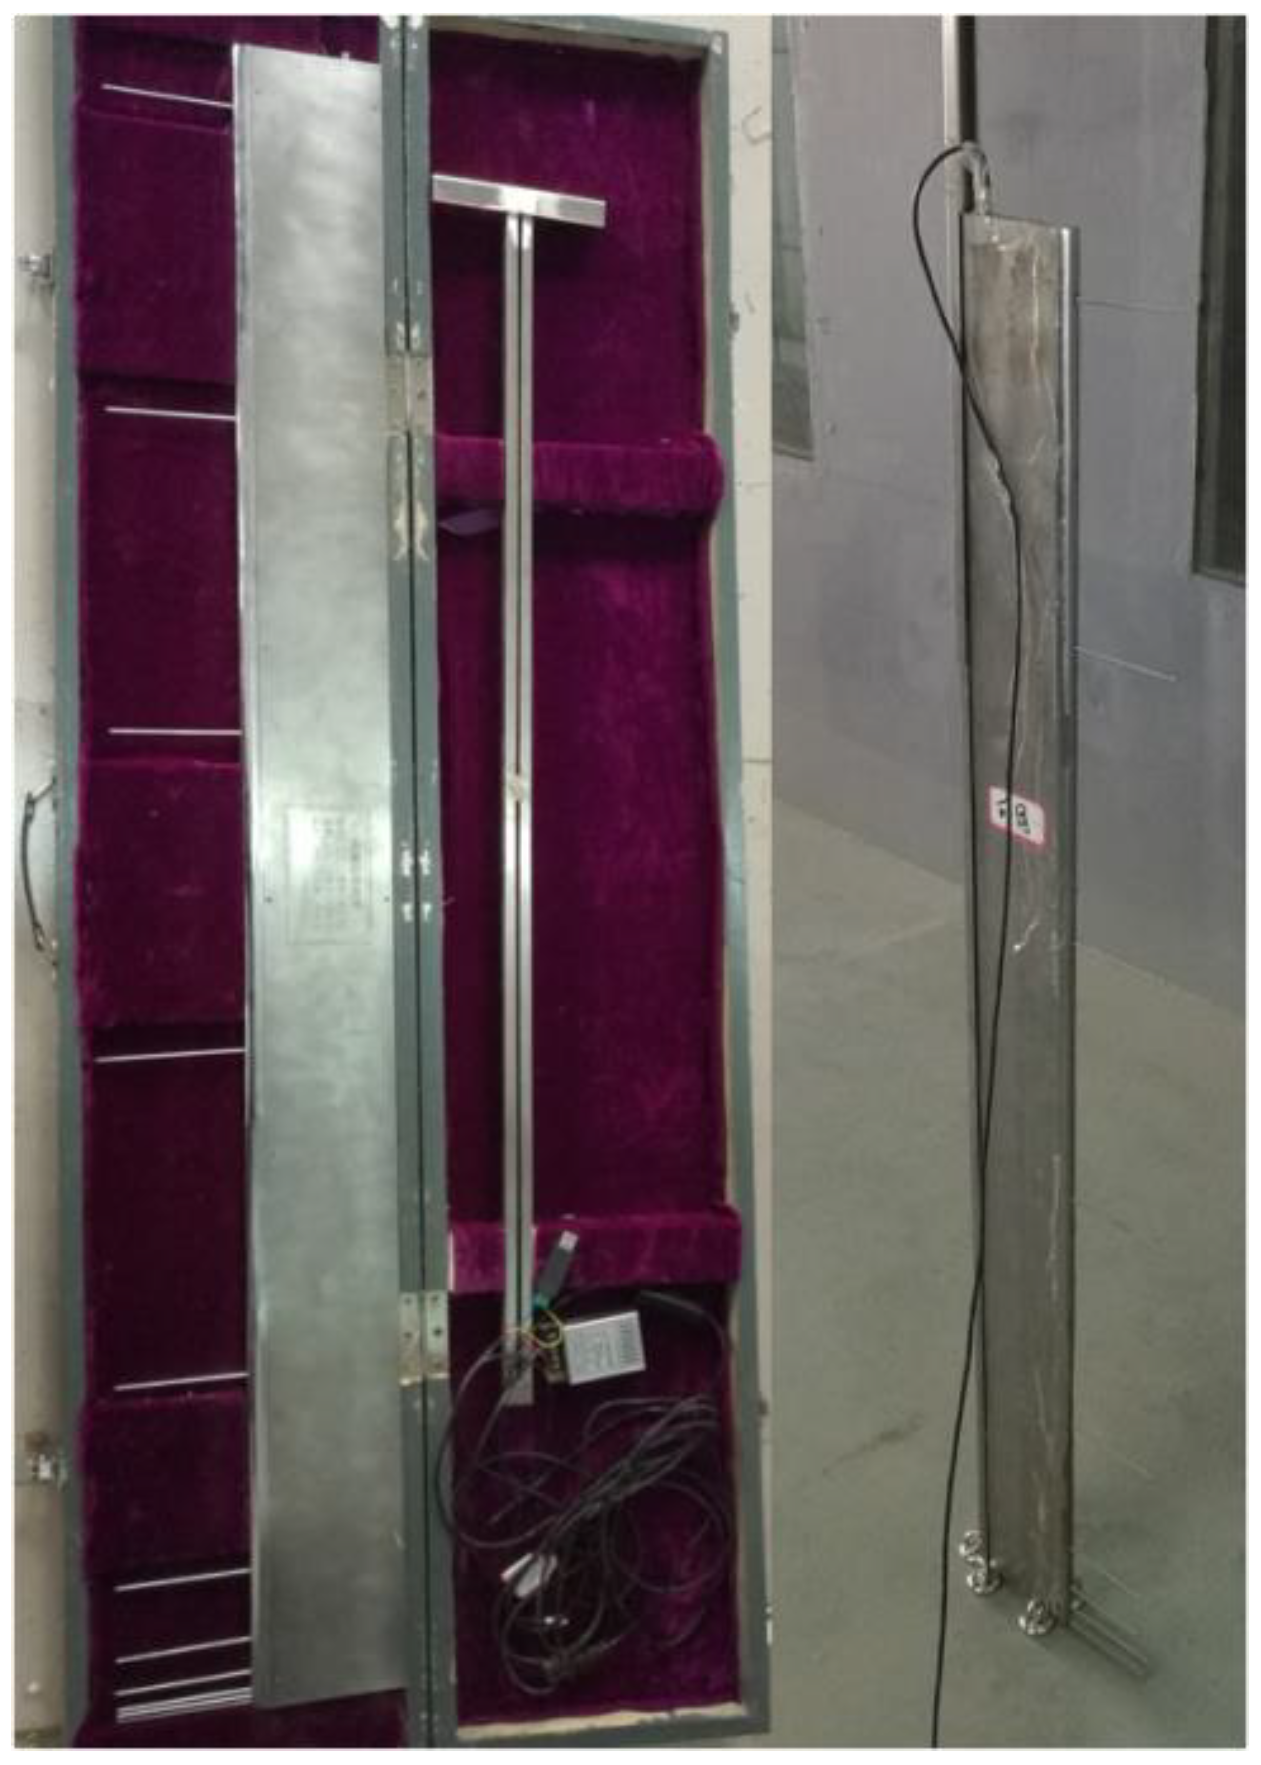
2.1. Wind Tunnel Test

Experiments were carried out in the blow-down wind tunnel at the Key Laboratory of Solar Thermal Energy and Photovoltaic System, Chinese Academy of Sciences (Figure 1). The test section of the wind tunnel is 20 m long, 3 m wide and 2.5 m high. The testing wind speed is continuously adjustable from 1.5 m/s to 30 m/s. The results for the flow and turbulence uniformity along and across the test section are as follows: the non-uniformity coefficient of the velocity field, μ 1.0 % , the non-uniformity coefficient of the directional field, Δ α 1.0 , Δ β 1.0 , the turbulence intensity of the uniform flow field, ε 1.0 % , the axial static pressure gradient, | d C p / d x | 0.003   m 1 . The bed surface device supplying sand is installed in the test section, including a number of sand trays with the bottom area of 2 m × 1 m. They can be flexibly assembled and used to conduct the windblown sand test. All these sand trays can slide and be fixed in the test section. Therefore, the amount and height of the windblown sand can be controlled through adjusting wind speed and positions of sand trays, so that the sand concentration distribution at the test location conforms to that in the windblown sand environment.
The sand sampler (Figure 2) was used to collect the blown sand at different heights to determine the vertical distribution characteristics of sand particles. The sand sampler is 1-m-high and there are 50 sand inlets with a cross-section of 20 mm × 20 mm at 50 different heights. Each sand inlet is connected to a detachable sand chamber. The sand concentration in the range of 1 m can be gained by weighing the collected sand amount with the help of an electronic balance with an accuracy of 0.001 g. The spacer between the sand inlets is made very thin to reduce the measurement error. At the same time, in order to reduce the interference of the sampler with the airflow, the front end of sampler is wedge-shaped and each sand chamber is connected to a vertical vent with a screen mesh to maximize the collection efficiency by reducing the air pressure in the sand chamber. The evaluation of the sand sampler in the wind tunnel shows that the device is highly efficient, especially for sand particles with low inter-particle cohesion (with diameters of over 0.1 mm) and the overall efficiency reaches up to 90% [34].
The wind speed profile in the windblown sand flow field is obtained by the wind profiler (Figure 3) placed behind the sand trays, which is specially used for windblown sand tunnel tests [33,43,44,45]. The wind profiler with a deviation of 0.15% of the measured value has 9 probes in the range of 1 m (mounted at 5 mm, 10 mm, 15 mm, 50 mm, 100 mm, 250 mm, 500 mm, 750 mm and 1000 mm) [33]. To further ensure the measurement accuracy, all the probes in the wind profiler are cleaned after each windblown sand test.
Sand samples are taken from Tengger Desert with a particle size of no more than 1.0 mm [46]. The particle size of the fine sand, coarse sand and mixed sand obtained through the screening instrument is 0–0.5 mm, 0.5–1.0 mm and 0–1.0 mm, respectively. The volume ratio of coarse sand to fine sand in mixed sand is approximately 1:3. The sand sampler is about 15 m away from the entrance to the test section and 5 cm away from the upwind sand tray. The bottom plate of the lowest sand inlet is flat with the wind tunnel floor. The sand bed device assembled by the sand trays is 4 m in length, 3 m in width and 2.5 cm in depth, which could ensure the full development of the saltation movement [34,40]. Before testing, put the sand samples into the sand trays and make their surface flat; and cover a piece of geo-textile on the sand trays before the preset wind speed is reached, so that the sand samples would not be blown away. When the wind speed reaches the preset value, remove the geo-textile and baffles of the sand trays to carry out the windblown sand test. If sand samples of approximately 2 cm depth in the sand trays are blown away, the sand samples must be refilled to reduce measurement errors.
Based on the actual conditions in desert regions, it is sufficient to describe the full development of particle movement and the characteristics of sand transport by simulating windblown sand flow field within the first 10 m of the surface layer, because the infrastructures and civil structures in desert regions are basically below 10 m. In this study, the wind tunnel simulation consists of two parts, namely, the impurity-free wind field and the windblown sand flow field within 10 m in desert regions.

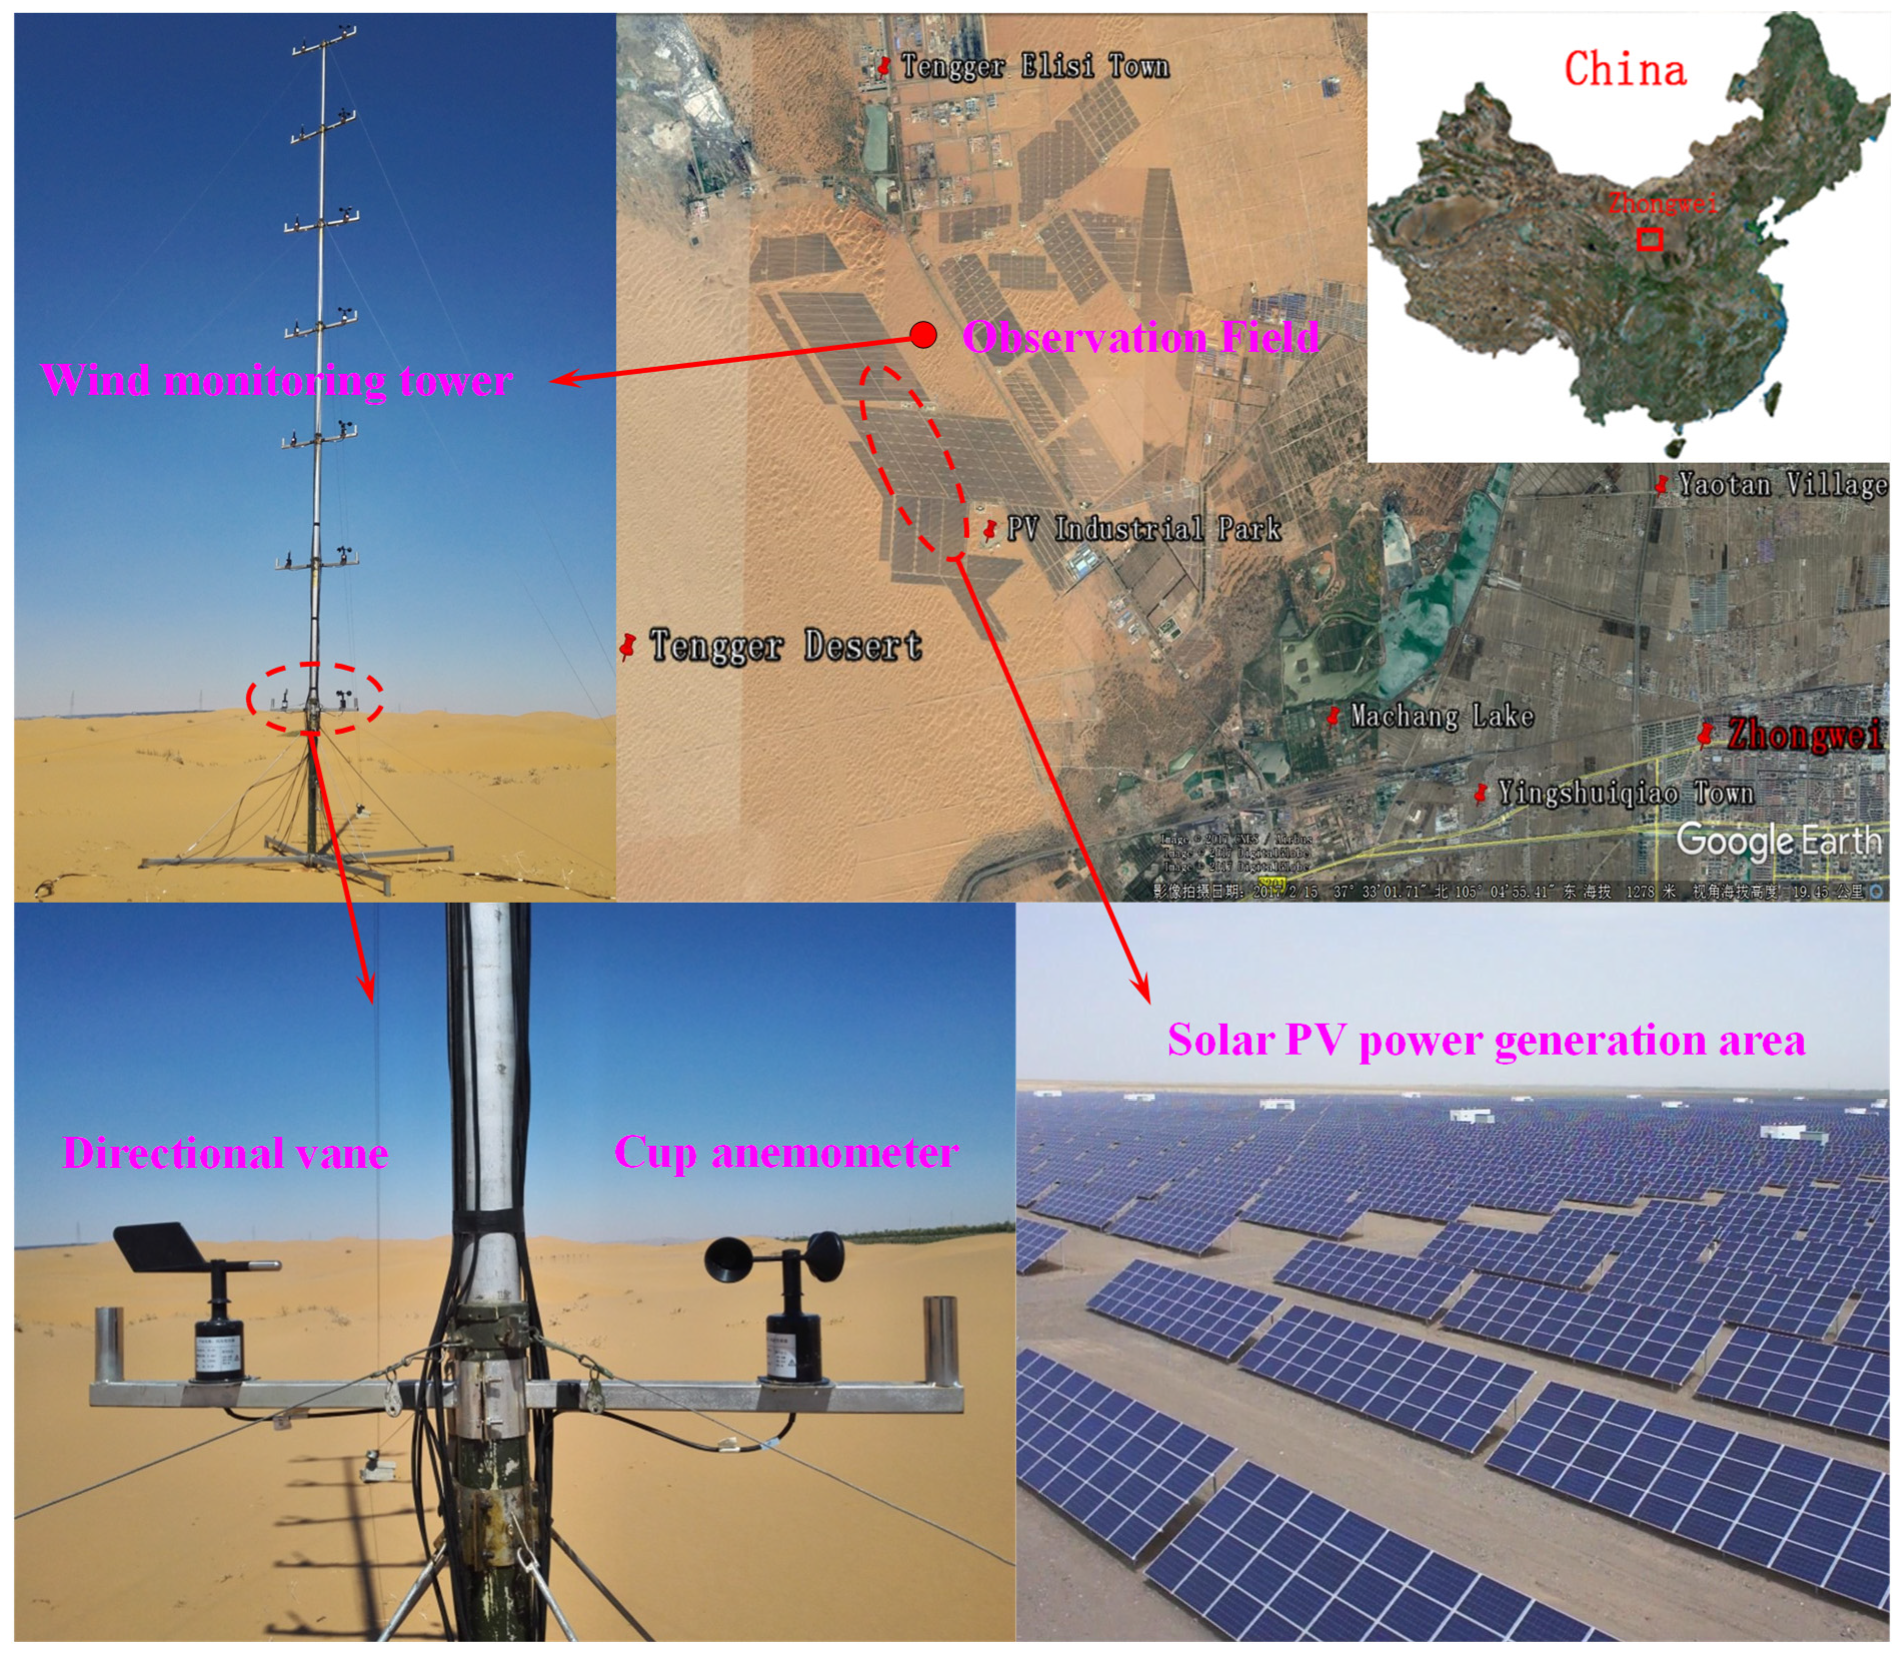
2.2. Field Measurement

Due to the unique climatic conditions and terrain complexity in desert regions, the characteristics of the near-ground impurity-free wind may be different from those of similar landform types as specified in existing wind codes and standards. To ensure the accuracy of the study and guide subsequent wind tunnel tests, the impurity-free wind characteristics in a typical desert region are obtained by using the field measurement method in the early stage of the test (A tiny sand concentration in the air stream or sand particles are not raised by wind, namely impurity-free wind flow field). As shown in Figure 4, the observation site is located in the photovoltaic power station on the southeastern edge of the Tengger Desert in Zhongwei, Ningxia Hui Autonomous Region, China. The measuring system consists of a wind monitoring tower, cup anemometers, directional vanes and data acquisition instrument. The cup anemometers and the directional vanes are installed at 1.4 m, 2.8 m, 4.2 m, 5.6 m, 7.0 m, 8.4 m and 10 m of the tower. More details about the experimental process and apparatuses had been provided by Huang et al. [33]. Sand flux data are missing in the field measurement, so we analyze the characteristics of windblown sand flow through wind tunnel tests.

3. Experimental Results and Discussion

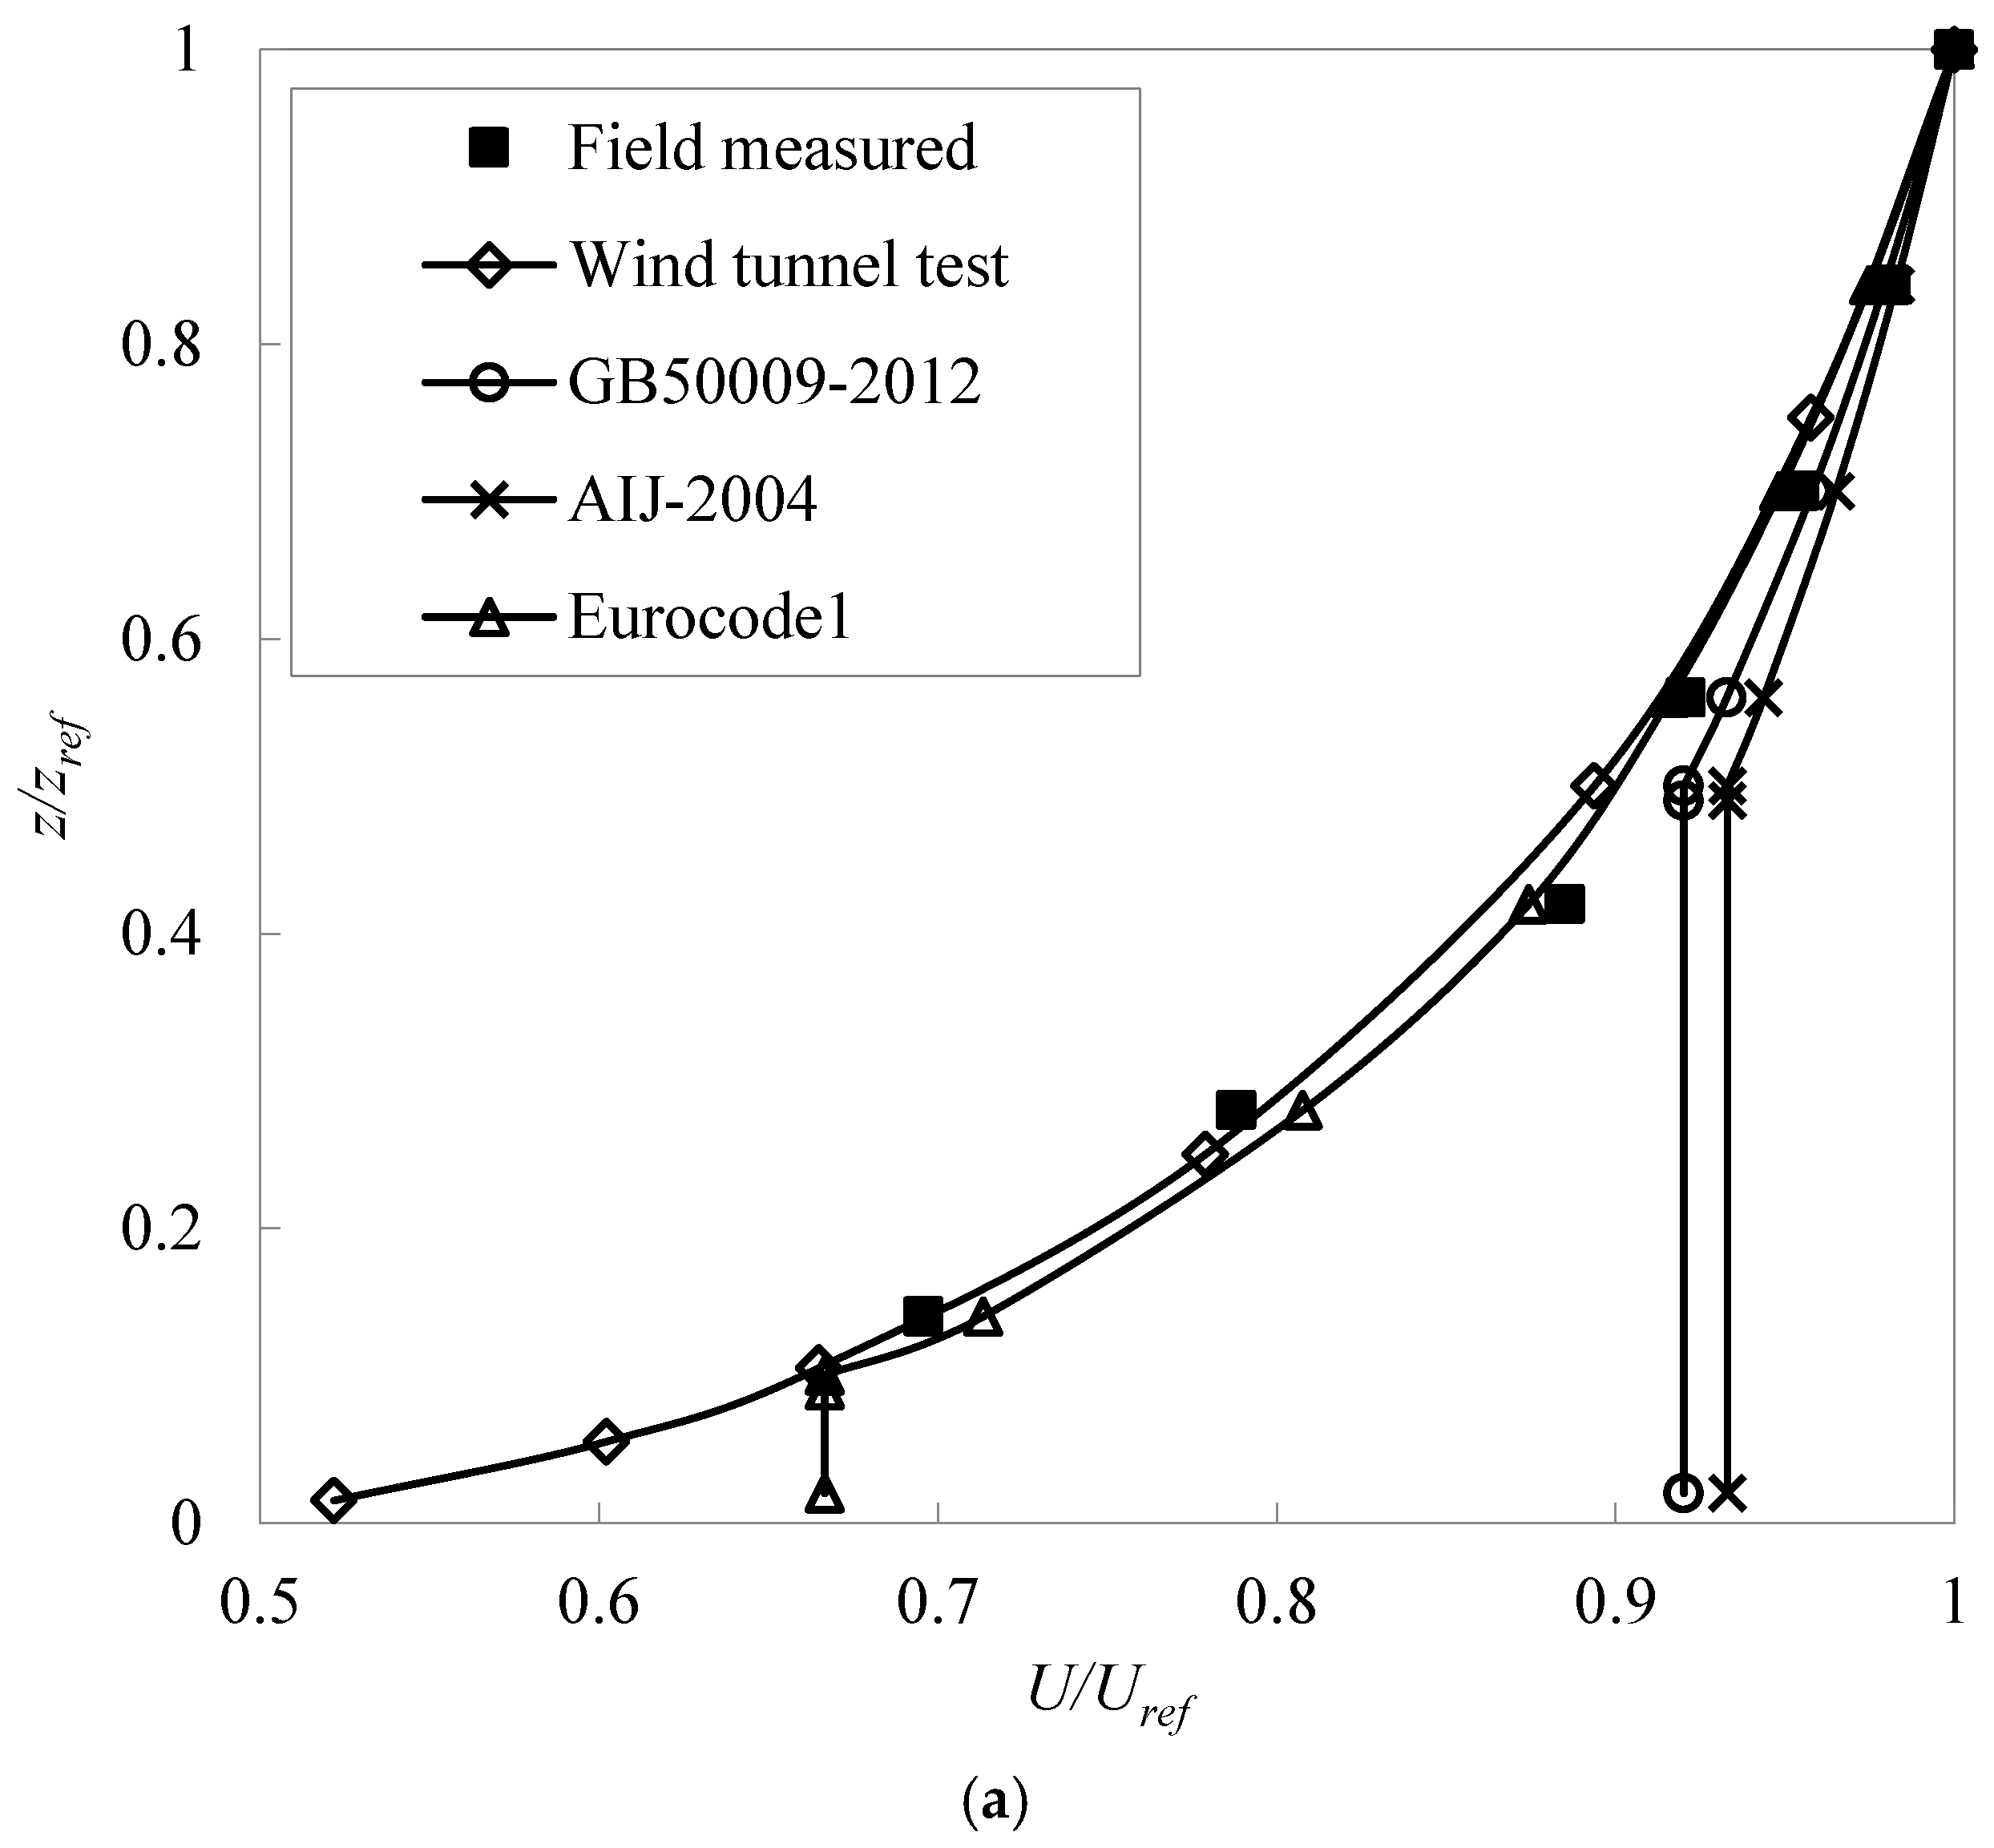
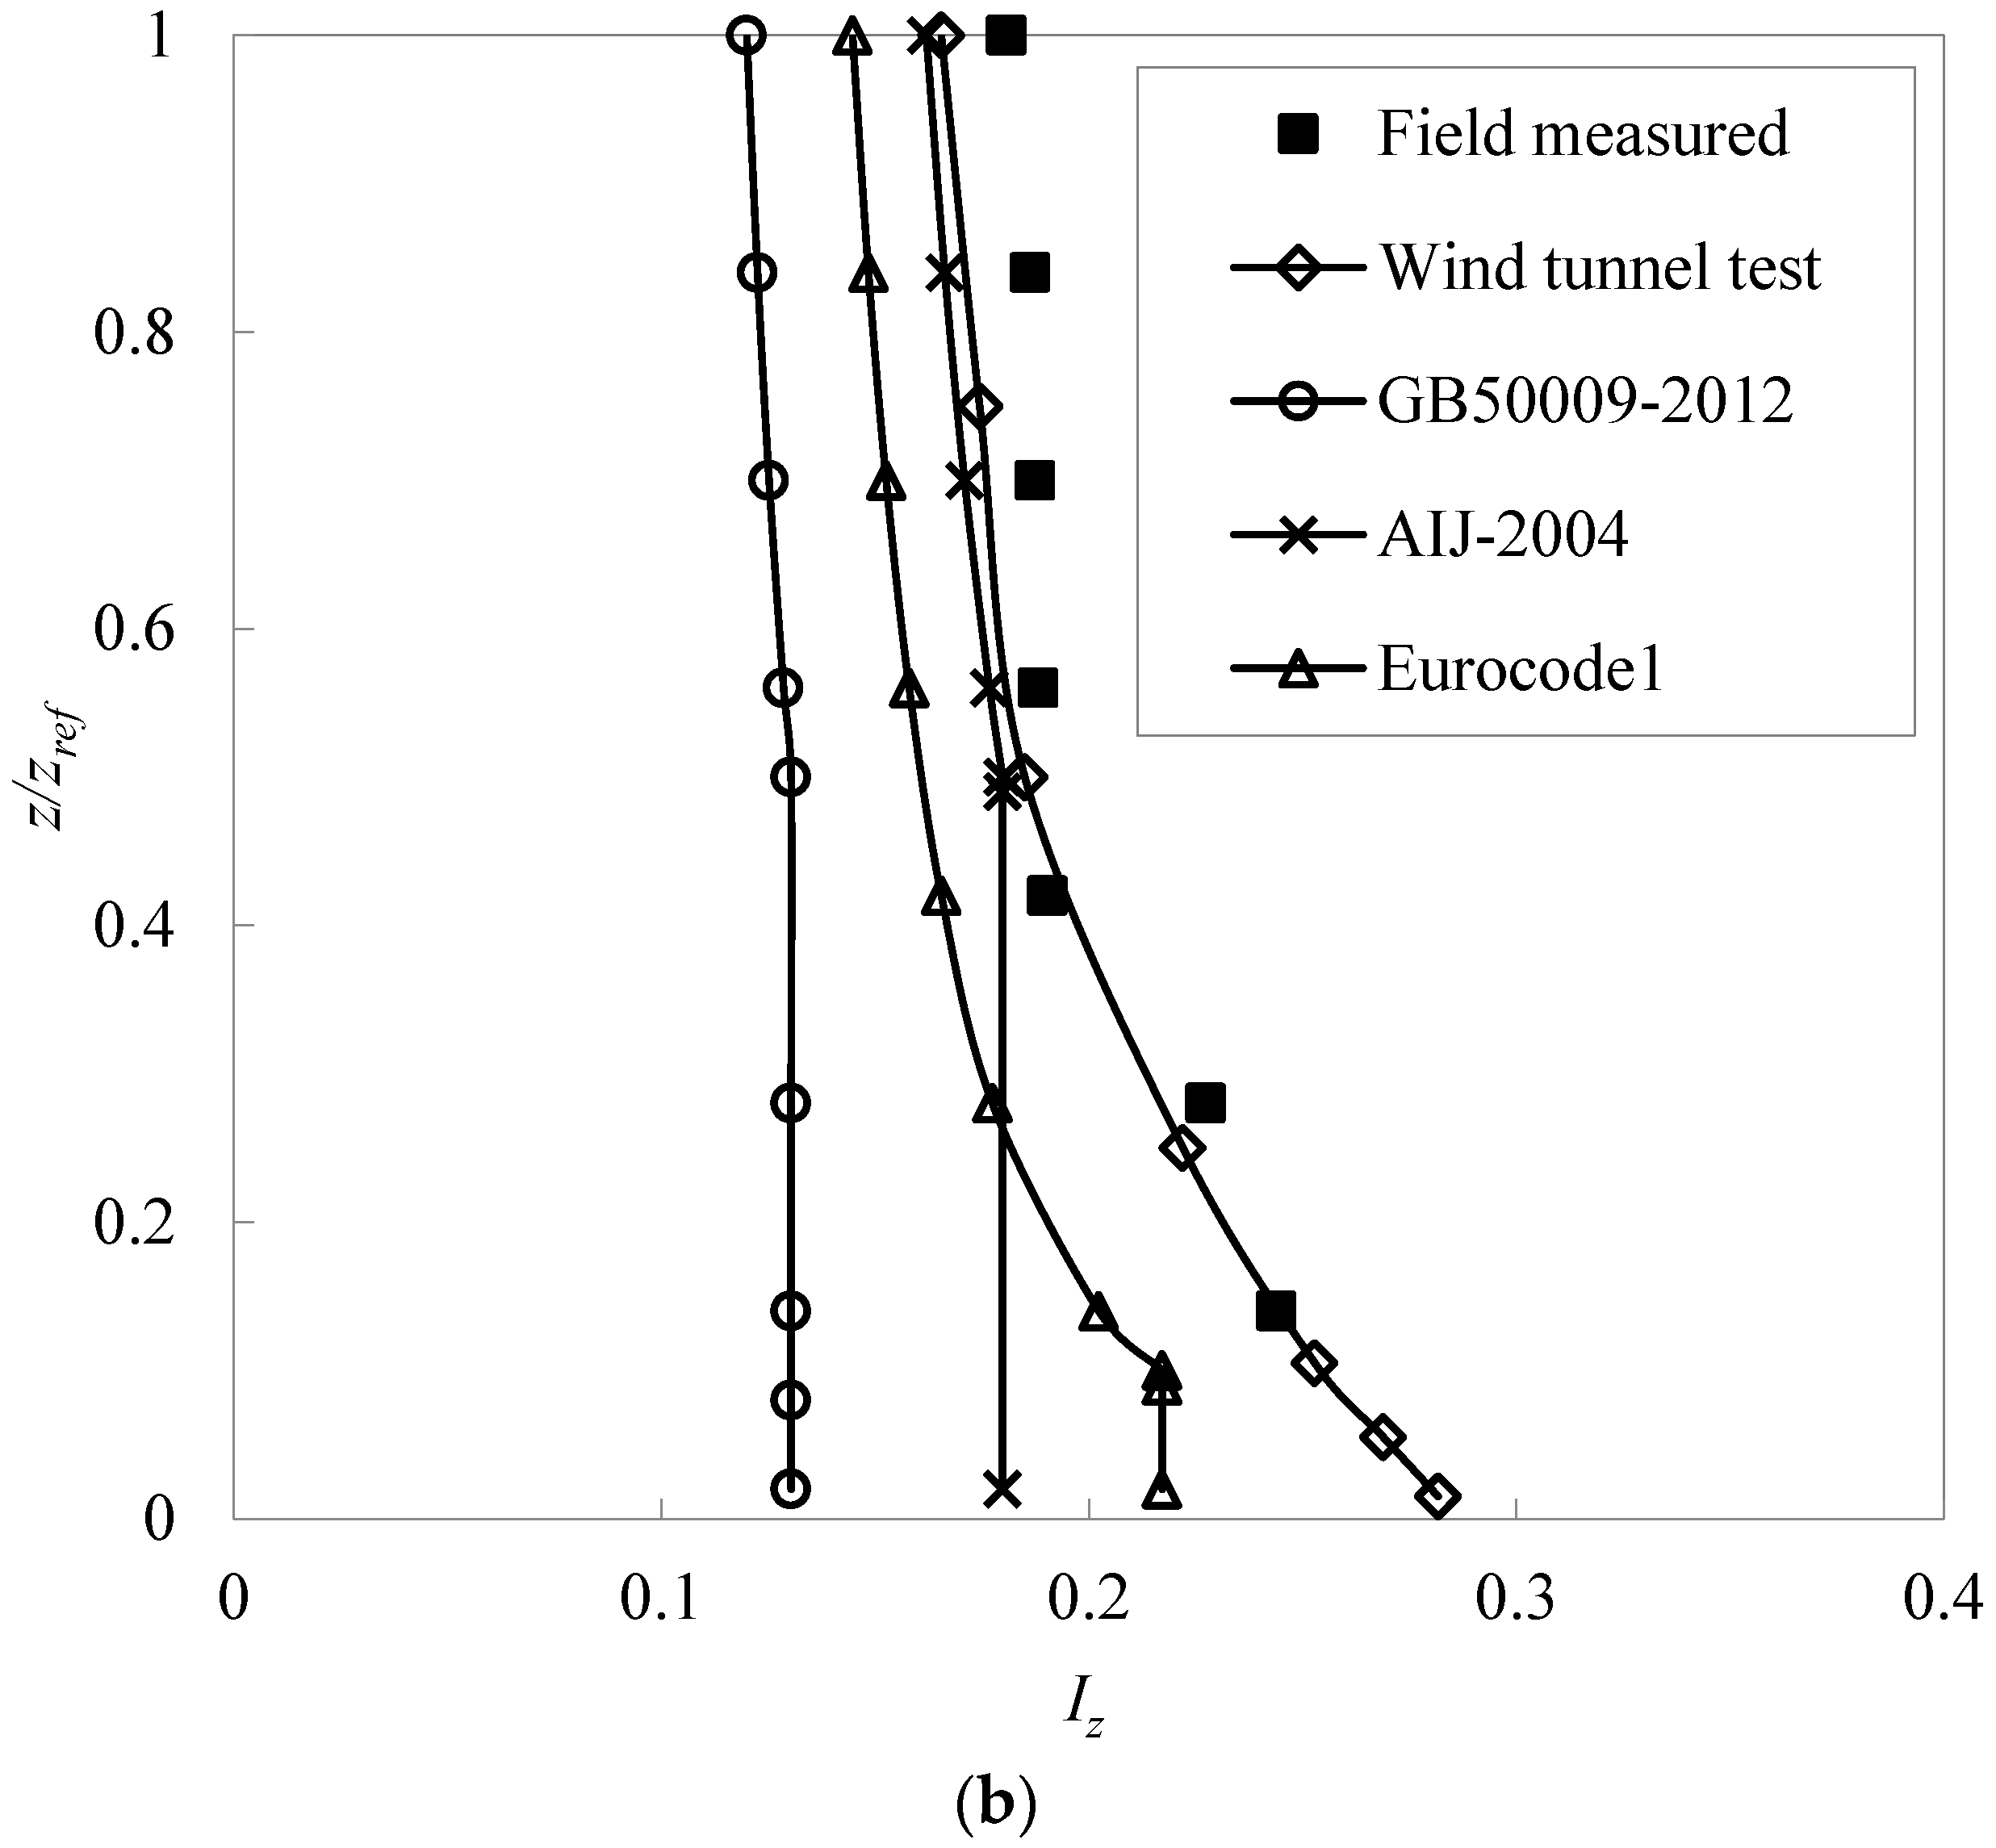
3.1. Wind Tunnel Simulation of the Measured Impurity-Free Wind Flow Field

The sand transport characteristics and interaction mechanism between wind and sand particles are significantly affected by turbulence characteristics of incoming flow under the actual terrain conditions. Therefore, it is necessary to simulate the impurity-free wind field under the actual terrain conditions before the windblown sand test in the wind tunnel. Unfortunately, in previous studies on Aeolian Physics, the influence of turbulence characteristics on the movement of windblown sand under actual terrain conditions had been neglected [34,35,39,40], resulting in a deviation between the simulation results and the actual results.
To further improve the reliability of windblown sand tests, we carefully consider the influence of turbulence characteristics of incoming flow on the sand transport in this study. The measured wind data are divided into sub-samples at a 10-min interval following Load Code for the Design of Building Structures (GB50009-2012) [47]. Thus, the measured impurity-free wind profile and turbulence intensity profile in desert regions are obtained, as shown in Figure 5.
Based on the measured results of sand collection in most previous studies [3,30,31] and the actual height of the existing infrastructures and civil structures in desert regions, the wind tunnel tests are designed to replicate the first 10 m of the surface layer. By comparing the measured height in desert regions with the size of the wind tunnel test section, the geometric scale ratio is chosen to be 1:10. It is difficult to consider the geometric scaling of sand particles because the particle size is less than 1 mm. Therefore, according to the existing windblown sand tests [33,35,40,44,45], we ignored the influence of the geometric scaling of sand particles on the results. The impurity-free wind flow field in desert regions is simulated by using artificial roughness with baffles, roughness elements and spires in the wind tunnel (Figure 1). For comparison, the wind profiles and longitudinal turbulence intensity profiles with the 10-min interval are also presented in Figure 5, and, respectively, specified by the Chinese, Japanese and European wind codes and standards in the terrain types of Class A, Class I and Class I [47,48,49]. The roughness lengths obtained by field measurement and wind tunnel test are 0.0095 m and 0.0086 m, and the shear velocities are 0.378 m/s and 0.373 m/s, respectively. As can be seen from Figure 5, the impurity-free wind profile and the longitudinal turbulence intensities simulated in the wind tunnel are consistent with field measurement results obtained by Huang et al. [33]. There is a significant difference between the measured wind profile and the exponential law wind profiles adopted by Chinese and Japanese wind codes and standards. The log-law wind profile defined by European wind code is in good agreement with the measured wind profile in desert regions. The measured turbulence intensities are greater than the turbulence intensities of a similar field specified by the Chinese, Japanese and European wind codes and standards.

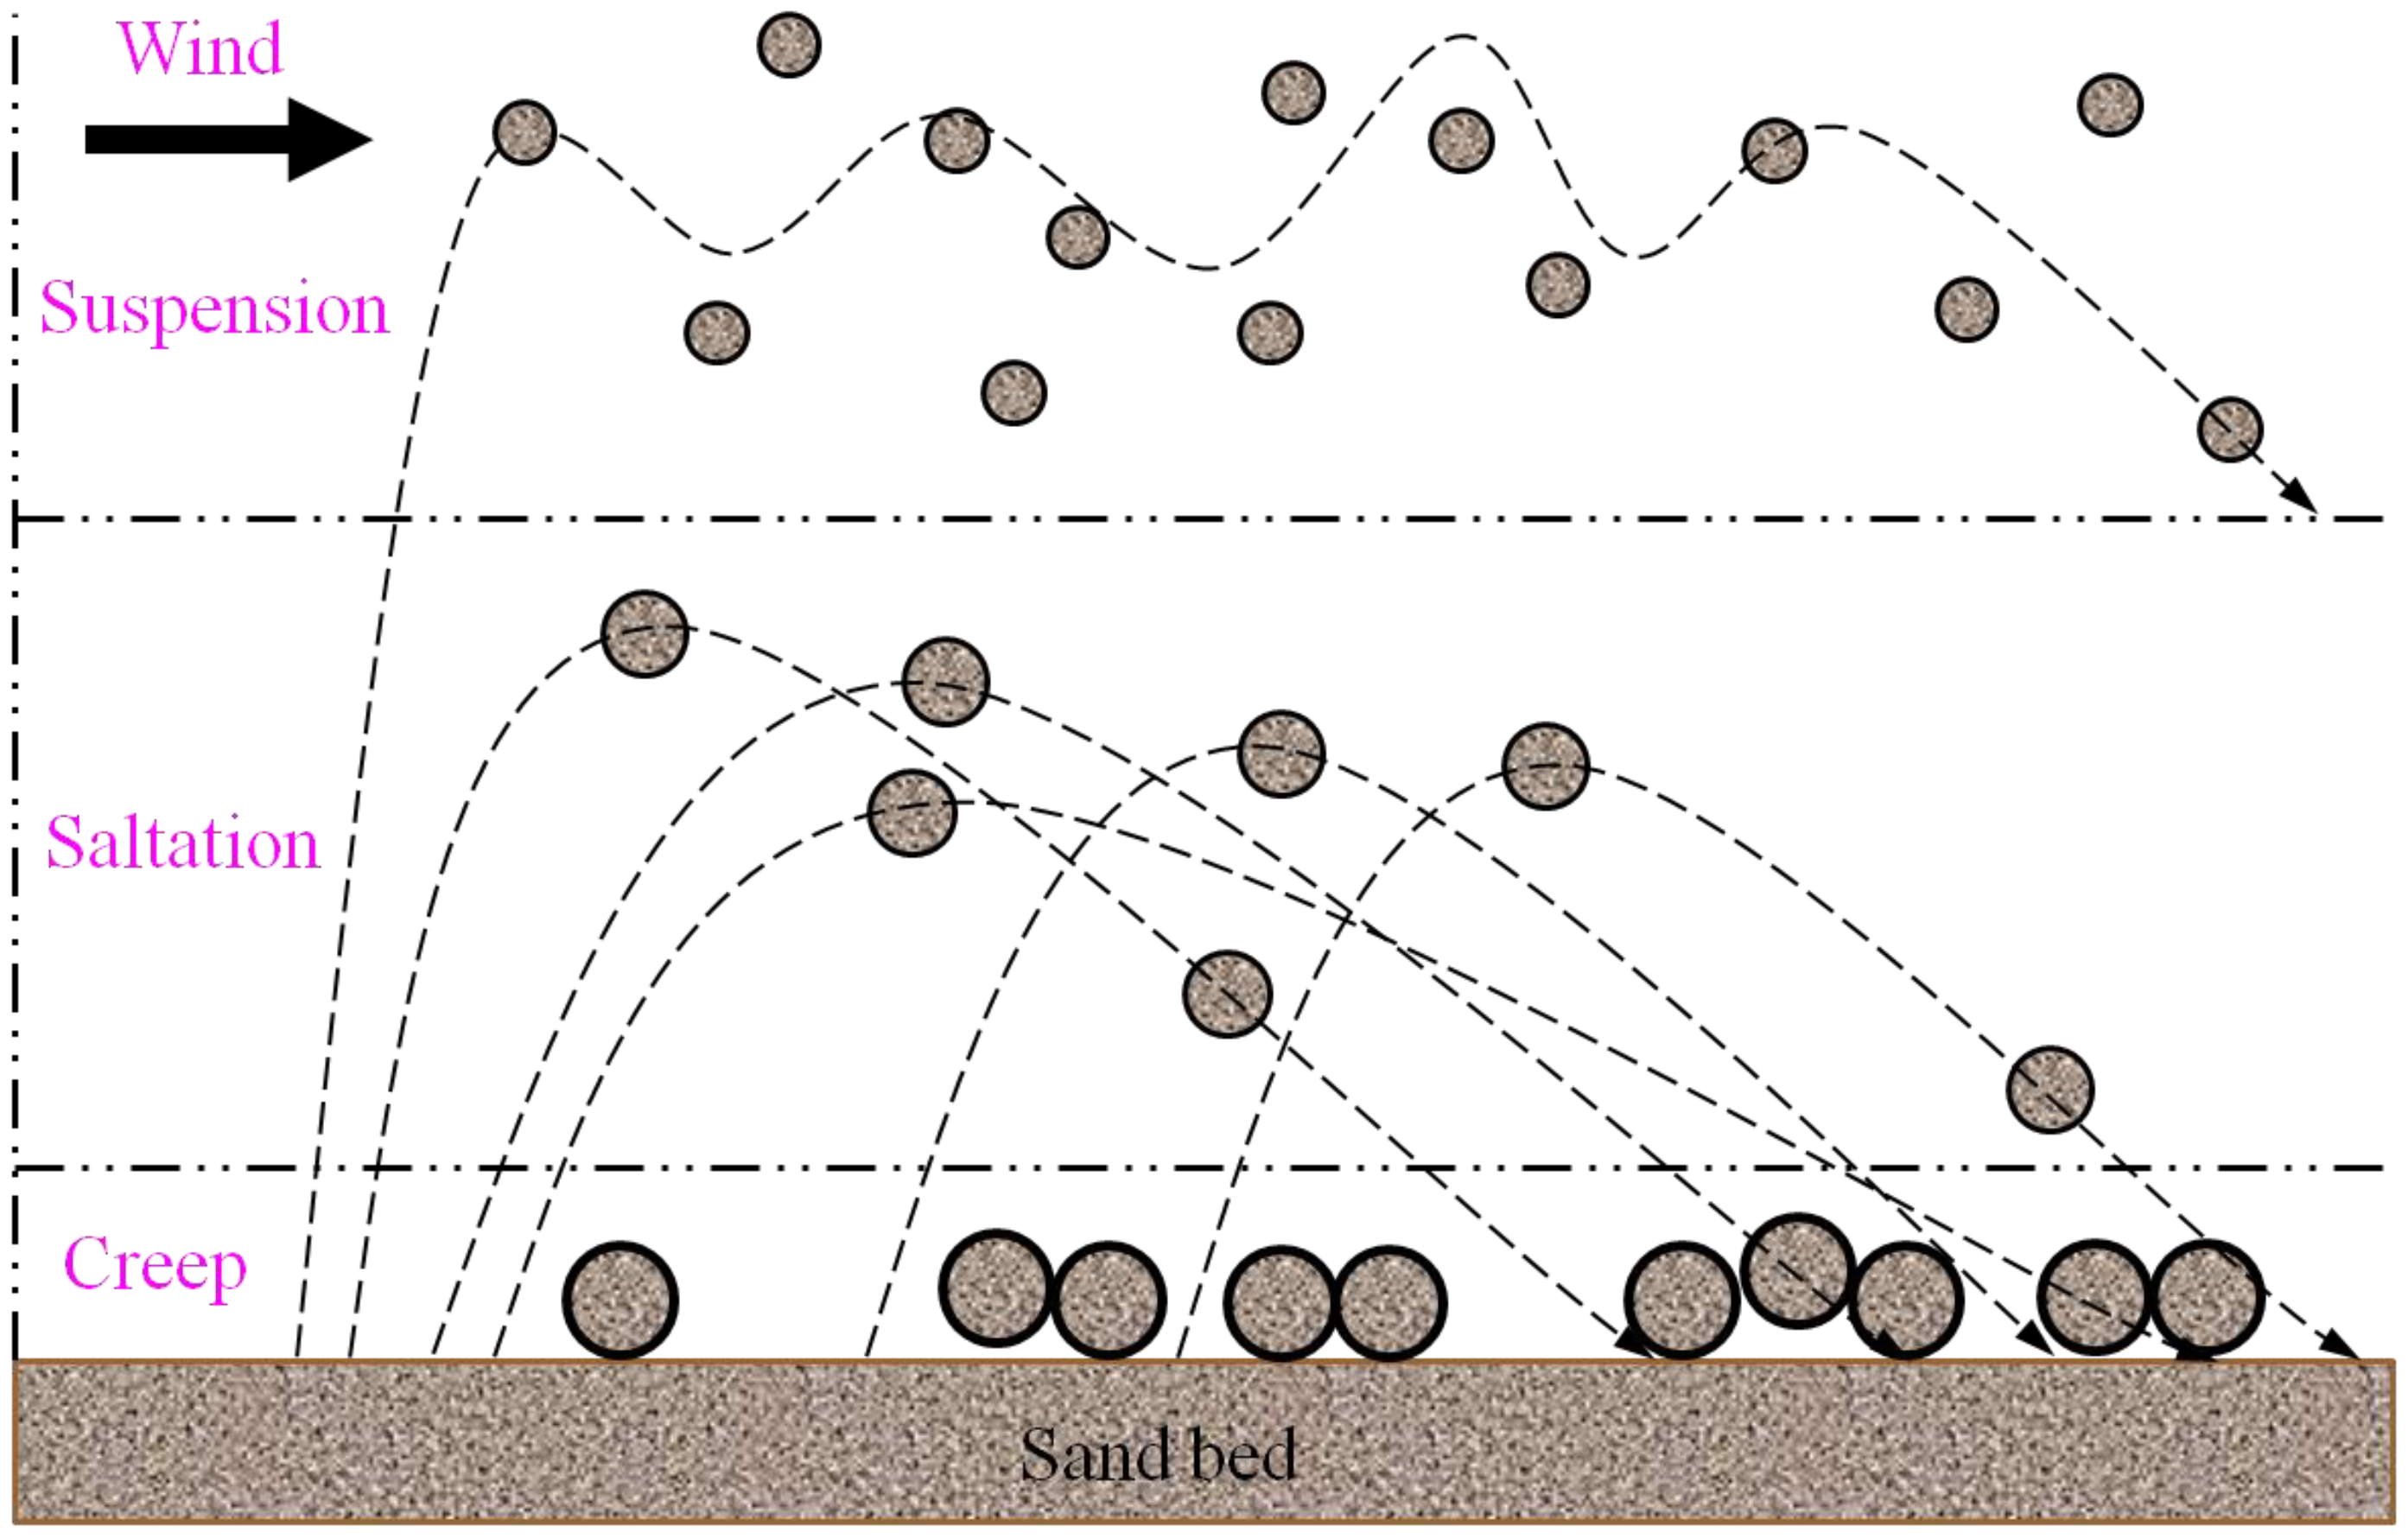
3.2. Movement Form of Sand Particles in the Windblown Sand Flow Field

The test wind speed at which the particles on the sand bed start to move under the action of airflow is called the threshold wind speed, and the larger the particle size, the greater the threshold wind speed. According to existing research on the threshold wind speed [34,46,50], three test speeds of 14.74 m/s, 16.68 m/s and 18.61 m/s at centerline height of 1 m under the impurity-free wind condition, above the threshold wind speed, are selected for windblown sand testing in this study. The bed surface device supplying sand is used to simulate the windblown sand flow fields with fine sand, coarse sand and mixed sand. The coarse sand or fine sand bed surface can be approximately regarded as the bed surface composed of uniform sand. However, the mixed sand bed surface belongs to the non-uniform sand bed surface because it contains coarse sand and fine sand [34,51]. Therefore, the results could indicate the influence of the particle size and bed surface properties on the characteristics of windblown sand flow field. In the following analysis and discussion, all distances refer to reduced-scale wind tunnel values.
Understanding the basic movement form of sand particles is the basis of studying the windblown sand two-phase flow. As shown in Figure 6, Bagnold concluded that there are three basic movement forms of sand particles under the wind force, which are creep, saltation and suspension through long-term field measurements and wind tunnel tests [17,18,19,20]. The form of sand particles rolling or sliding along the bed surface is called creep; the form of sand particles jumping and leaving the bed surface is called saltation; and the form of sand particles suspending in the air flow for a certain time without touching the bed surface is called suspension. Sand saltation is triggered by sand particle bouncing on the ground. As such, both wind flow and particle impact shall contribute to the total amount of transported sand. The movement form of sand particles is affected by wind speed, particle size, and random nature of sand particle movement. The threshold wind speed is directly proportional to the square root of the particle size. Only when the wind speed reaches the threshold value, the sand particles would start to move [52]. At the same wind speed, smaller sand particles are prone to suspend or saltate, while larger particles creep. However, for mixed sand, fine particles are more likely to saltate [53].
The ratio of the cumulative mass of particles below a certain height to the total mass of particles in the entire windblown sand flow field is determined as the cumulative mass percentage of sand particles. In this study, we collect the data of sand mass at each height of the sand sampler to analyze the cumulative mass percentage of sand particles, which shows the ratio of the cumulative mass of particles below a height Zm to the total sand mass collected at all heights in the sand sampler. The formula is as follows:
C M P Z m = i = 1 m Q Z i i = 1 n Q Z i × 100 % ,   i = 1 , 2 , 3 , m n ,   1 m n
where C M P Z m represents the cumulative mass percentage of sand particles below a height Zm, in %, Q Z i represents the sand mass at a height Zi, in g, n represents the number of sand collection heights of the sand sampler. When m equals n, C M P Z m reaches 100%.
The cumulative mass curves of fine sand, coarse sand and mixed sand at three indicated wind speeds are shown in Figure 7, and some characteristic parameters of particle movement are shown in Table 1. The results show that no matter what size particles are, and how the wind speed is, the mass percentage in the maximum height is below 0.1%, which means the thickness of the entire windblown sand flow field is about 0.6 m. For sand particles with three different sizes, the accumulative mass percentage within the height of 0–0.3 m has exceeded 90%, which means the sand particles mainly move in this layer. The accumulative mass curve at the height of 0.3–0.6 m is close to the vertical line, indicating that the sand is in a low concentration and suspended. The mass of the suspended particles to total mass in percentage ratio is defined as the suspension percentage Fs. For these three kinds of particles, Fs are quite small, and their mean value is between 1.0% and 1.7%.
The sand particles on the ground (at the height z = 0) are defined as creeping particles, which are very tricky to measure by the sand sampler [54]. Given this, further quantitative analysis on the creep percentage is not performed in this study.
In the windblown sand flow field, saltation is the most important movement form because the amount of saltating particles accounts for about 3/4. Moreover, the saltation has an effect on the creep and suspension in the windblown sand flow field, for example: (1) the momentum of the creep comes from the saltation; (2) the suspending small particles on the bed surface are difficult to be directly lifted by the wind because of the concealing effect of the underlying layer of the viscous flow and the adhesion between the particles. Only if the impact of the saltating particles removes them from the ground, the vortices in the air flow easily drive them to suspend and move in the air flow [52]. When the cumulative mass percentage of sand particles is 90%, the corresponding height is defined as the characteristic saltation height Z90. As can be seen from Figure 8, Z90 increases when the wind speed and particle size increase, which means the characteristic saltation height is the largest for coarse sand, followed by mixed sand, and the smallest for fine sand.

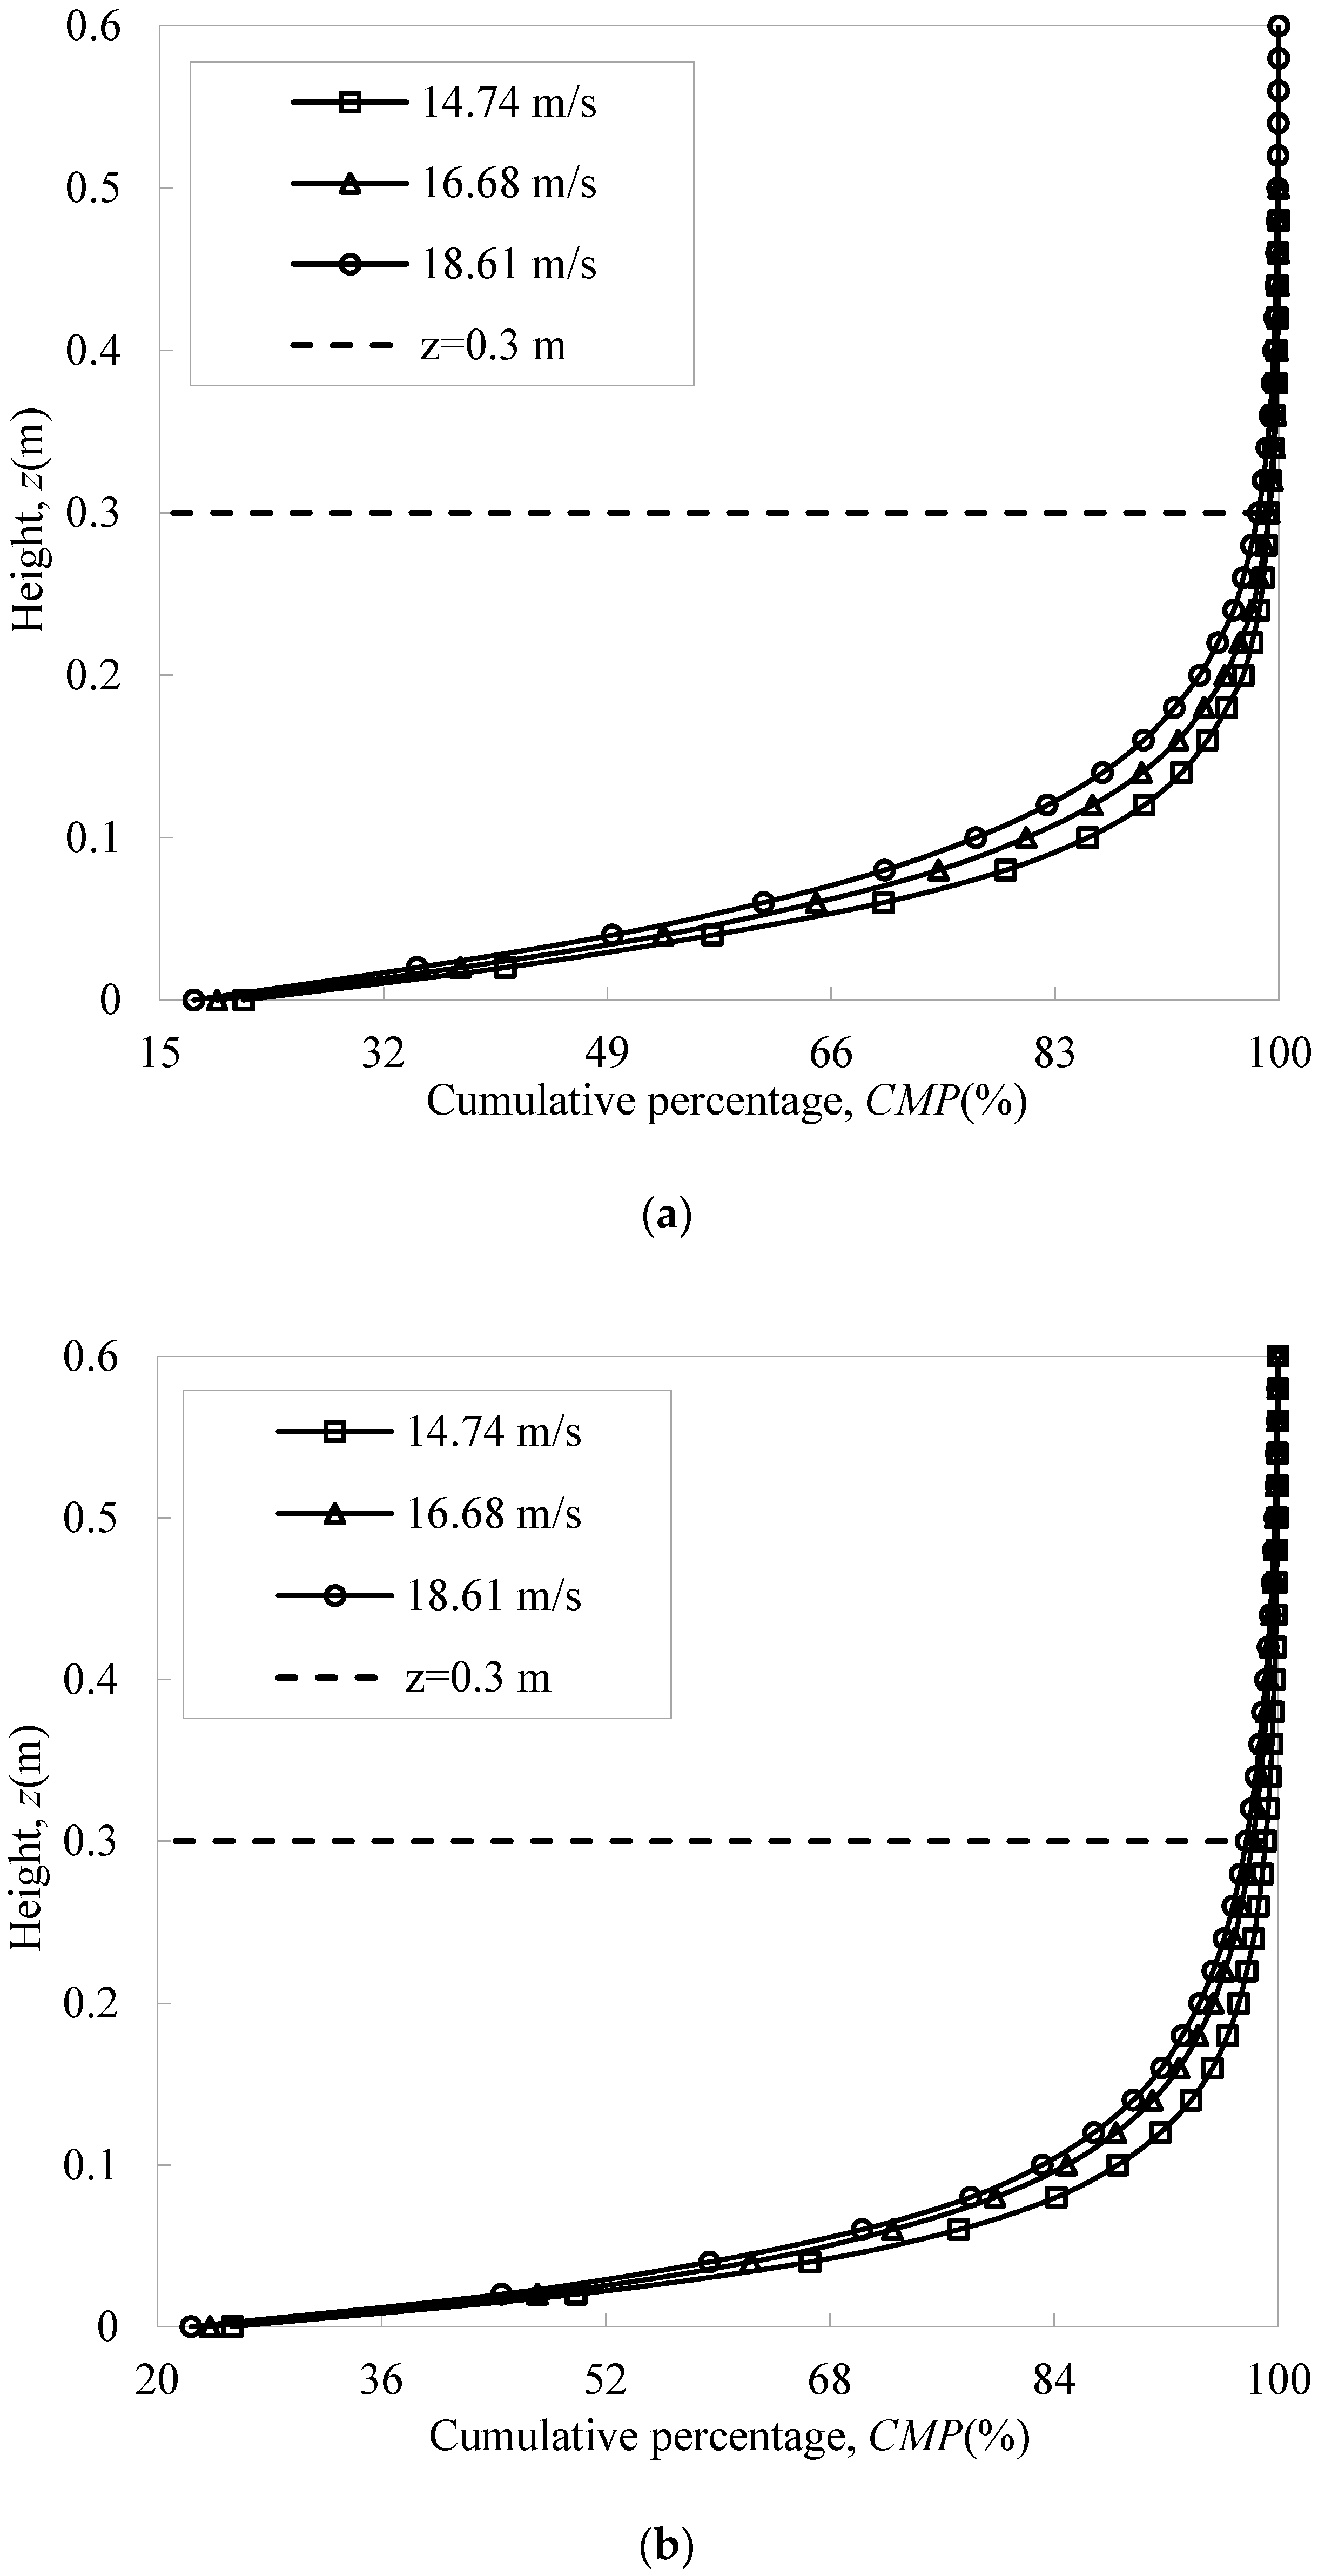
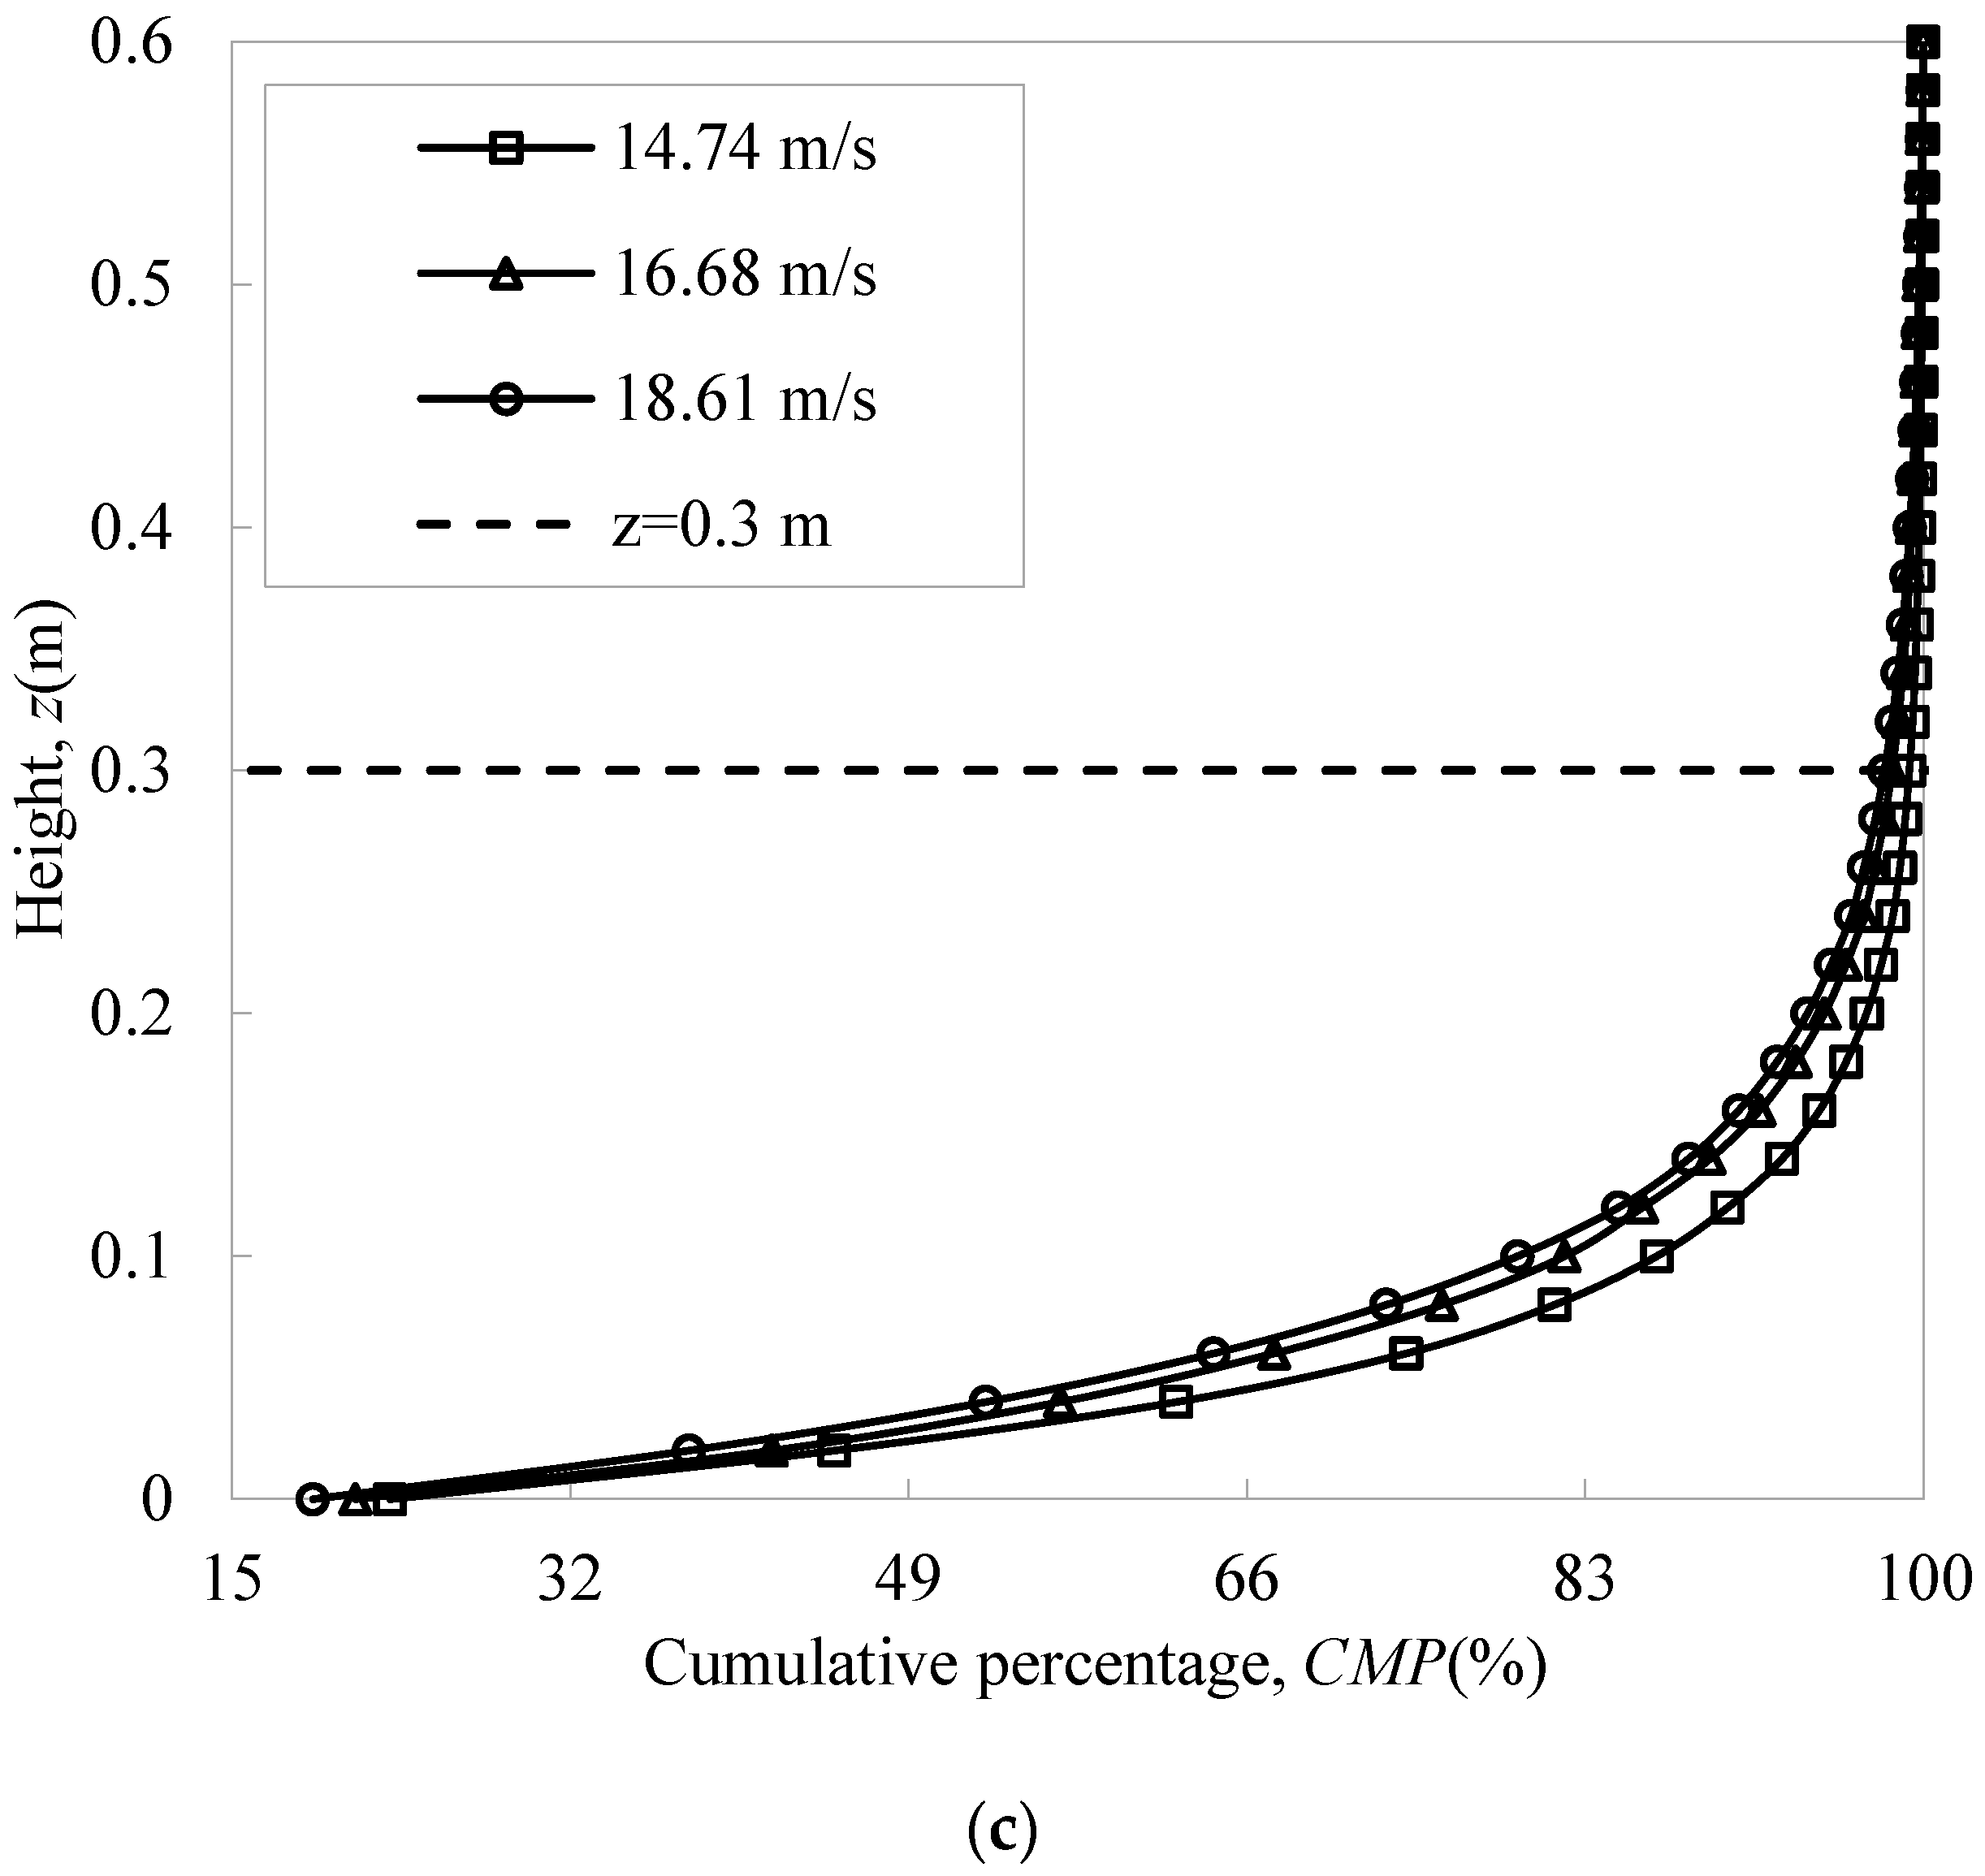
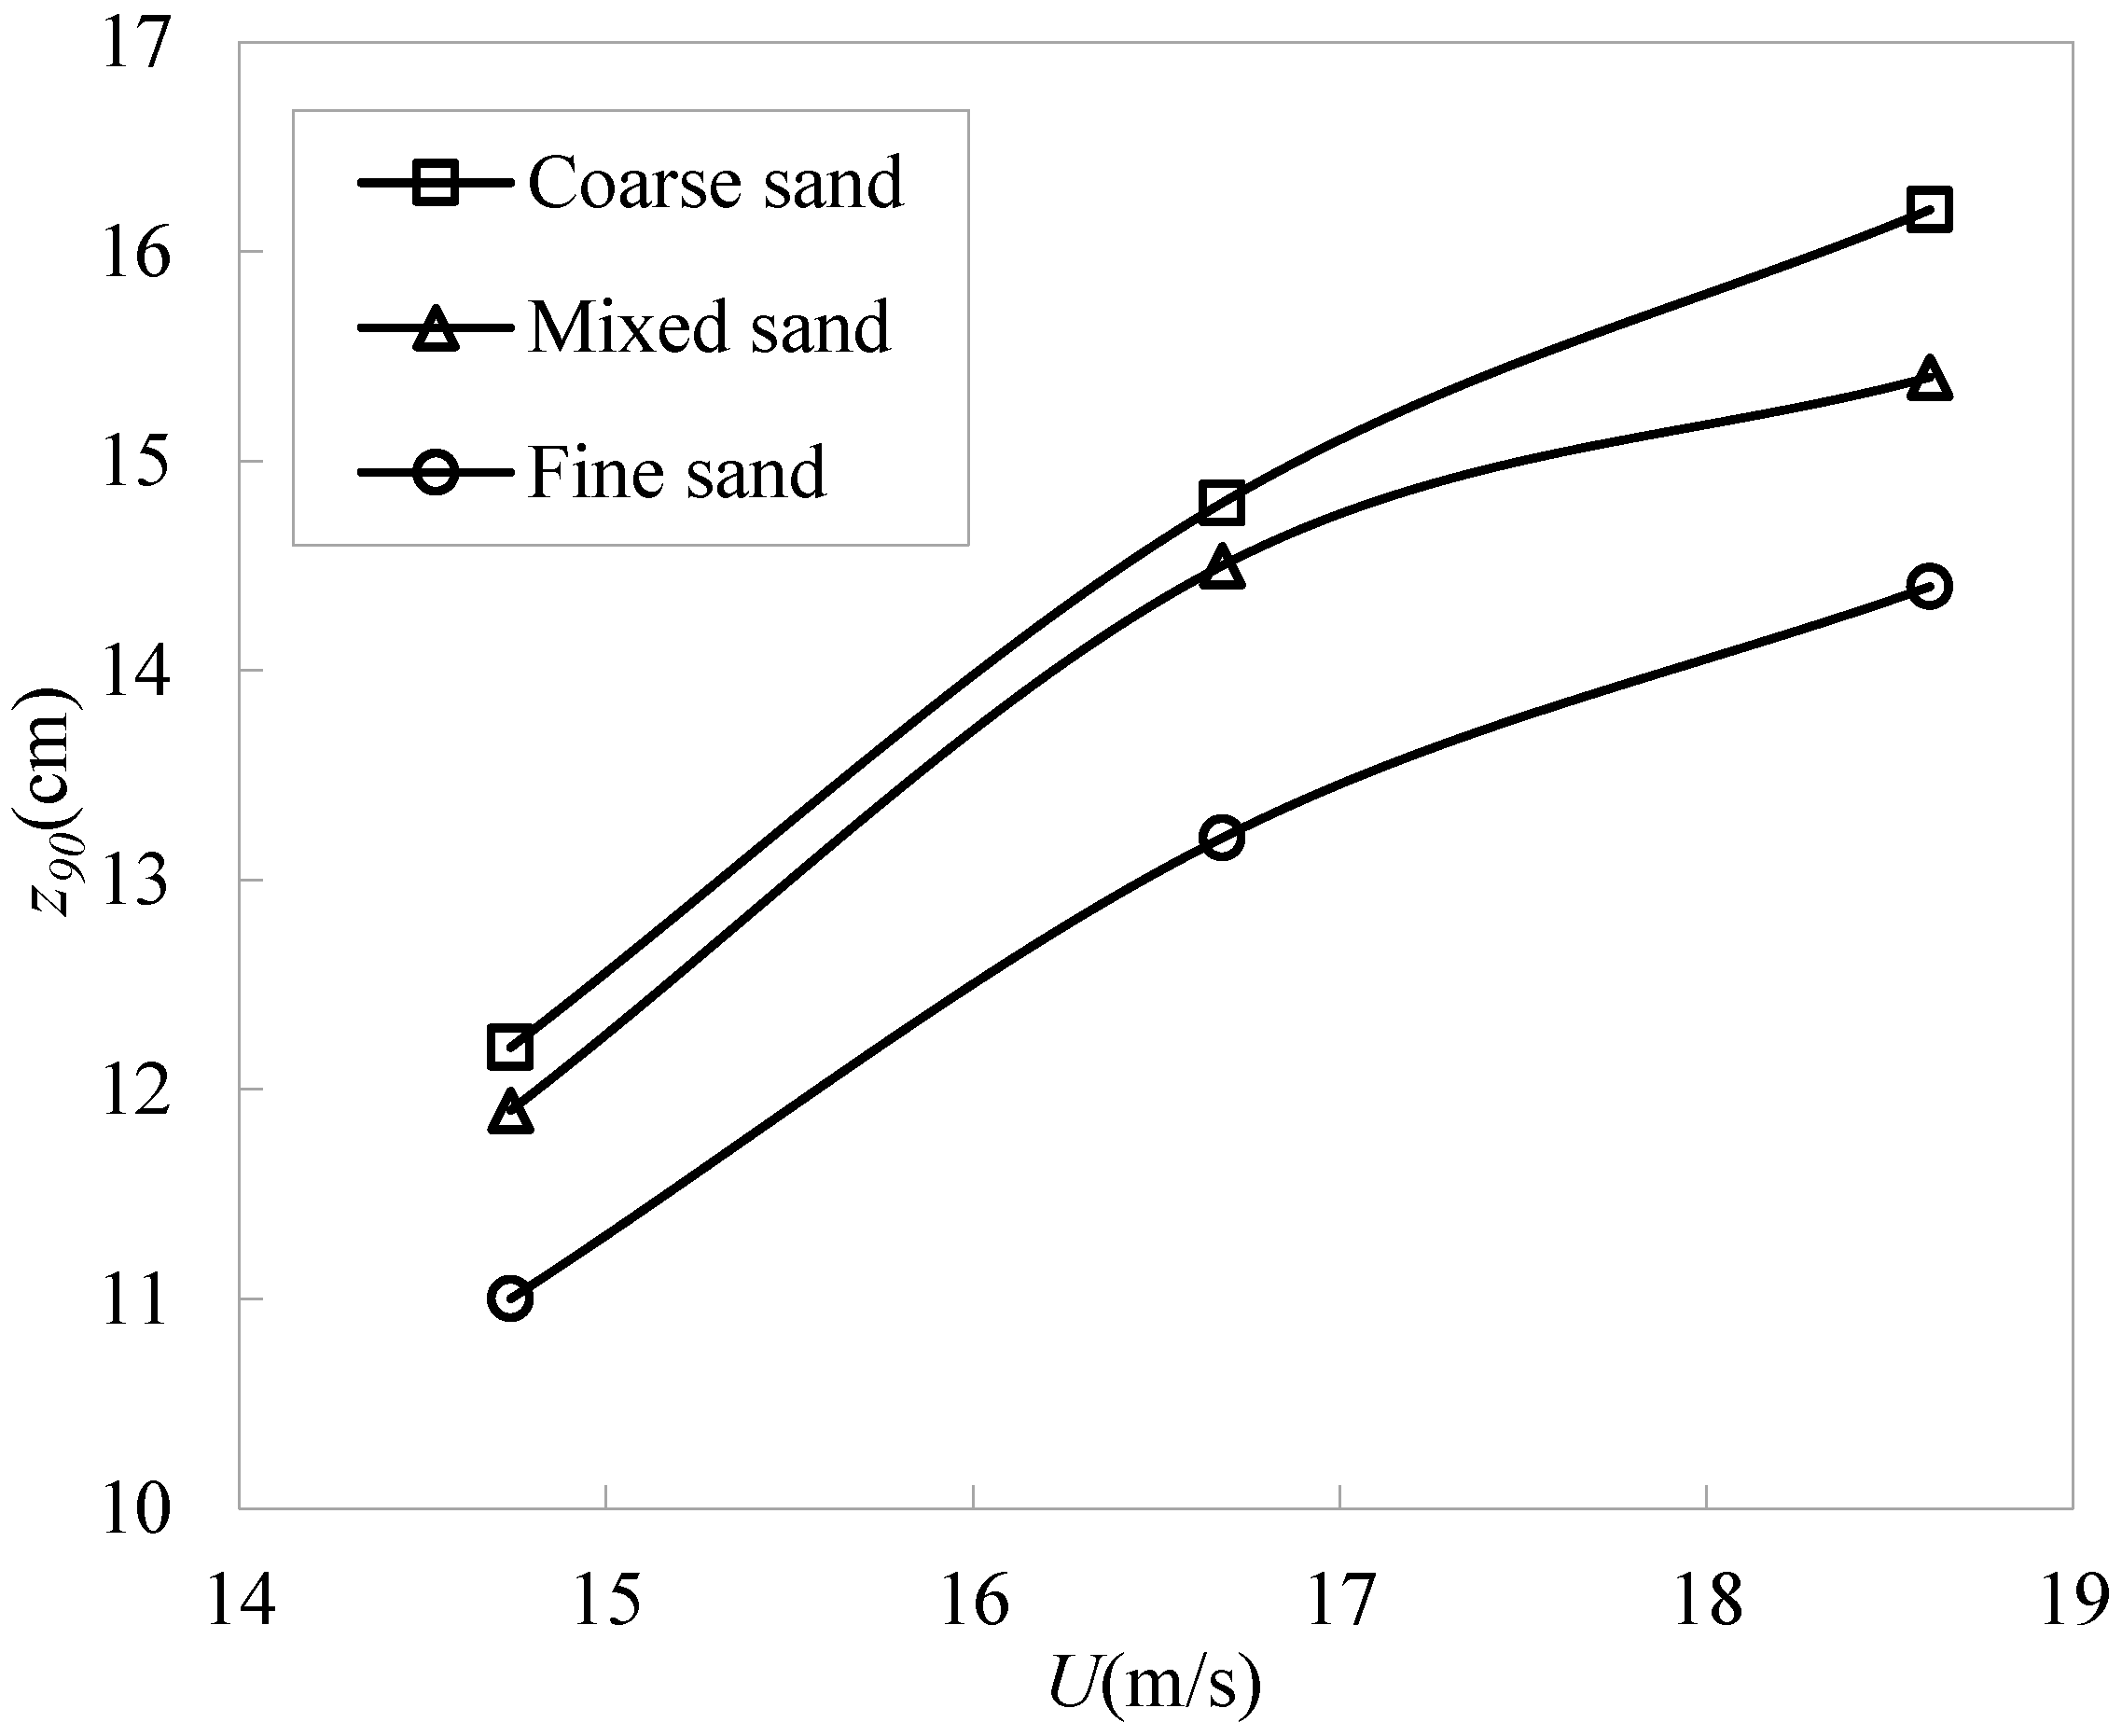
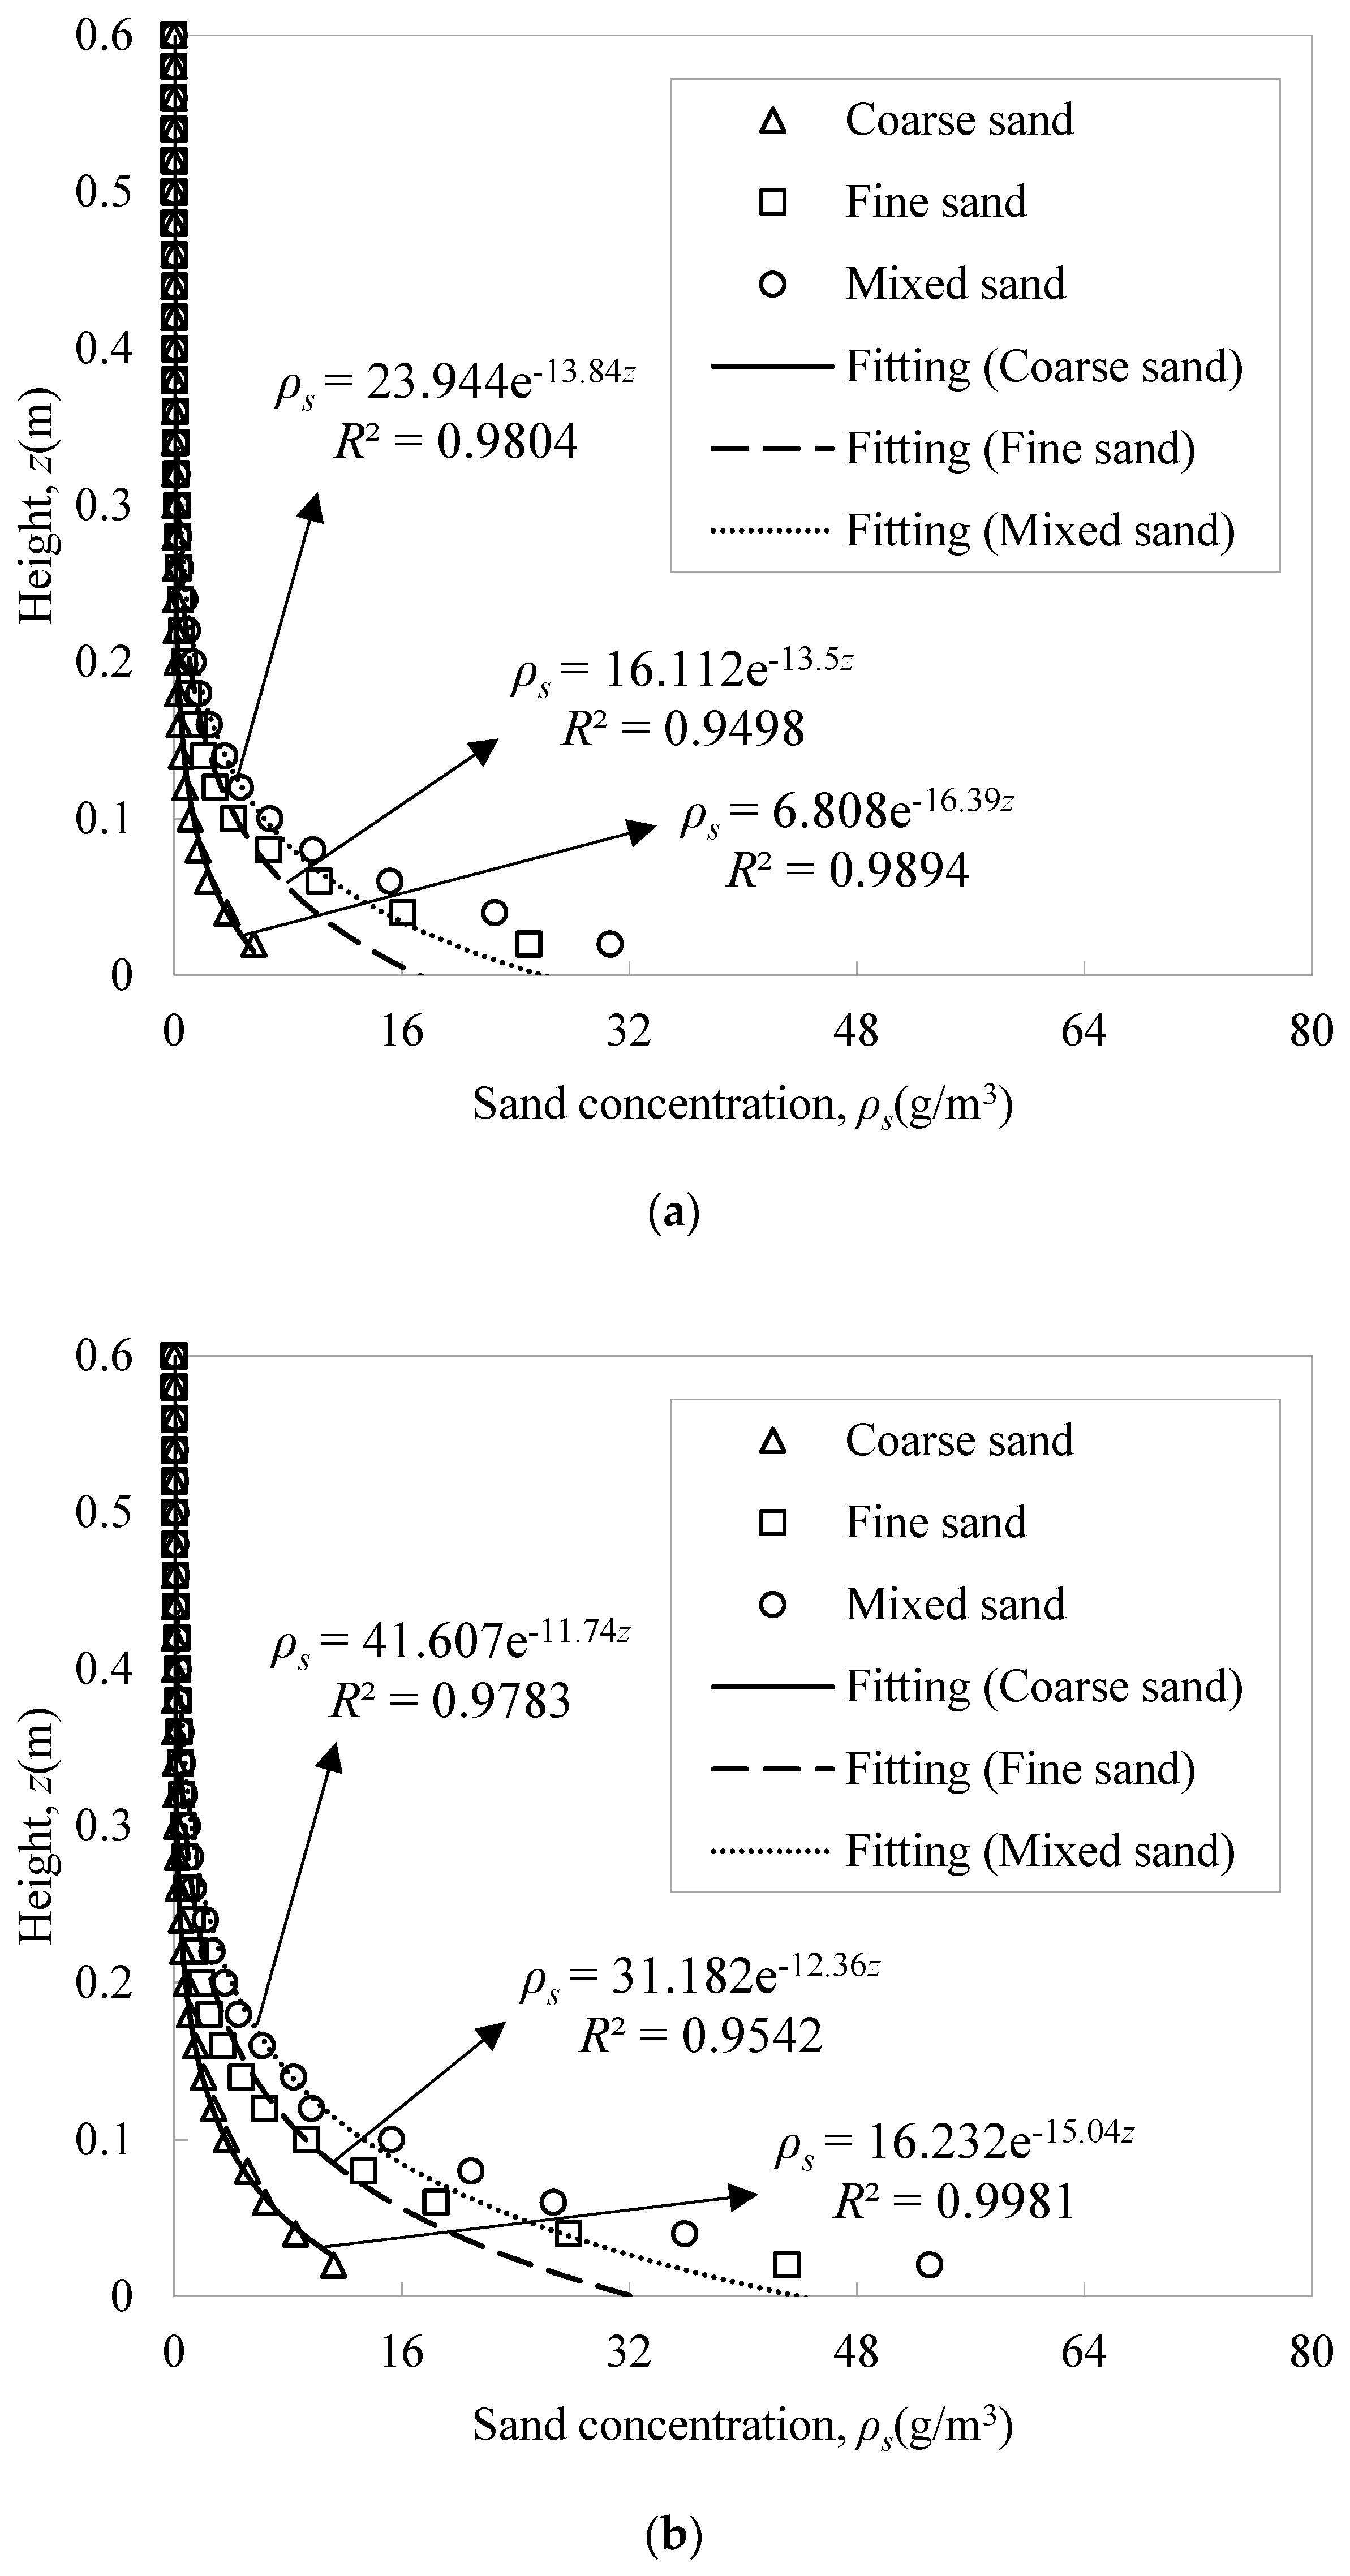
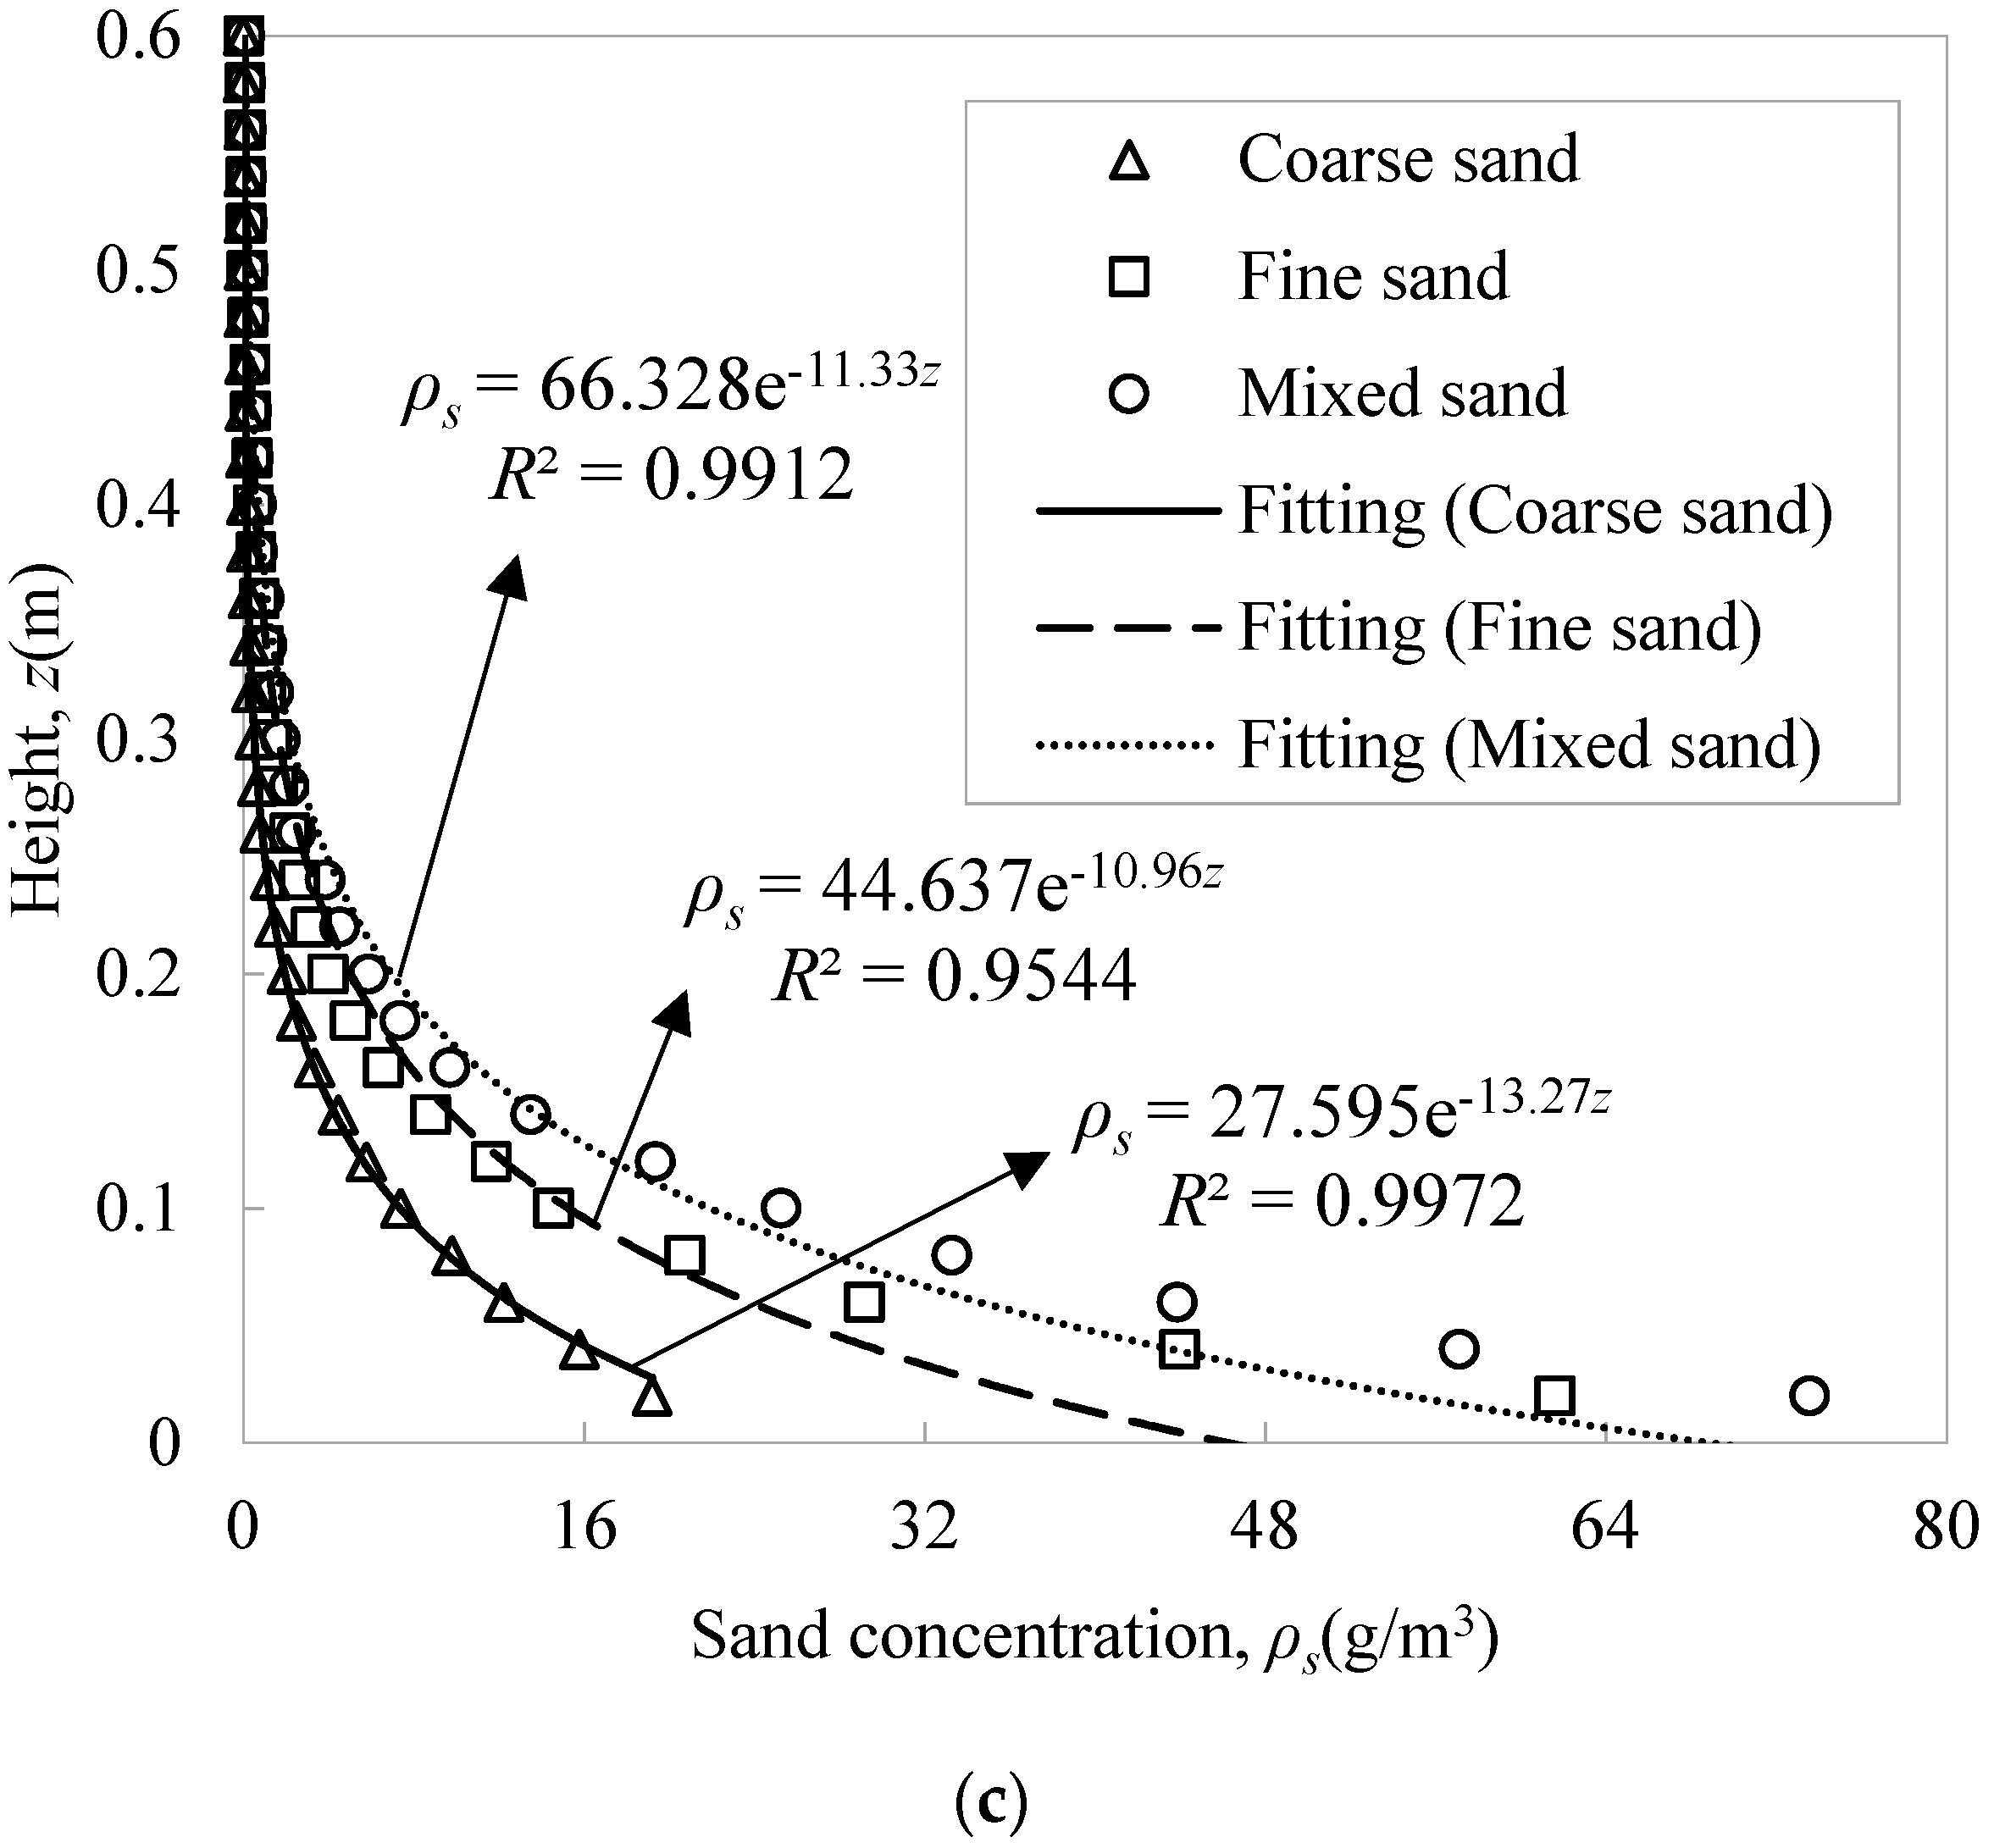
3.3. Sand Concentration and Sand Transport Rate in the Windblown Sand Flow Field

In Aeolian Physics, sand transport rate is one of the main parameters to describe the transport characteristics of windblown sand two-phase flow, which refers to the sand mass passing through unit bed width in unit time. While in structural wind engineering, sand concentration and velocity are important parameters for evaluating the effect of windblown sand load on the engineering structures. Sand concentration refers to the sand mass per unit volume in the windblown sand flow field. The sand transport rate and sand concentration profiles below 1 m can be presented by analyzing the collected sand at 50 different heights of the sand sampler in the windblown sand flow field. The equation can be expressed:
{ q = Q / ( L t ) ρ s = Q / ( A t U z )
where q represents the sand transport rate in the windblown sand flow field, in g/cm/s, ρs represents the sand concentration, in g/m3, Q represents the collected sand mass, in g, Uz represents the mean wind speed, in m/s, t represents the sand sampling time, in s, A represents the inlet area of the sand sampler, in m2, L represents the width of the inlet of the sand sampler, in cm [33,34].
Since the sand concentration and the sand transport rate can be linearly converted, and both of them share the same curve trends, only the plot of sand concentration with height is presented in Figure 9. The results show that three kinds of sand concentrations decrease with increasing heights. Below 0.3 m, the sand concentration varies widely at different heights; above 0.3 m, the sand concentration is minor and varies little at different heights. Results further indicates that sand particles mainly move within the 0.3 m layer under the action of wind force. The concentration of the three kinds of sand particles increases when the indicated wind speed increases. At the same indicated wind speed, the concentration of the coarse sand, fine sand and mixed sand increases in turn, which is because the particle size of fine sand is smaller than that of the coarse sand, and they are more likely to saltate under the action of wind force. As a result, more sand particles are lifted by the wind, resulting in a larger concentration. The concentration of mixed sand is higher than that of fine sand due to the following reasons: Compared with the other two kinds of sand beds, the mixed sand bed is a non-uniform sand bed. Sand particles with different particle sizes could interact and affect each other when they jump off the bed and move in the air stream, making the fine sand particles more likely to saltate [34,51].
The least-square method is used to fit the sand concentration at different heights. Regression analyses indicate that the relationship between sand concentration and height can be described by the exponential function. Similarly, the relationship between sand transport rate and height can also be described by the exponential function. The formula is as follows:
{ q = A exp ( z / B ) ρ s = a exp ( z / b )
where a, b, A and B are regression coefficients. Table 2 indicates that the correlation between the sand concentration (or sand transport rate) and height is reasonably good. The correlation coefficient R2 is over 0.94 for all particle sizes and indicated wind speeds. Formula (3) is in the same form as the decay function of the sand transport rate proposed by Williams for the 0.16 m near-surface layer based on wind tunnel tests [55]. Dong et al. also came up with the notion that changes in the sand transport rate below 0.6 m with height should be expressed by the exponential function [34,40]. The qualitative understanding in this study is basically consistent with the findings in previous studies. It is necessary to make a further quantitative comparison with previous research results based on the physical value of regression coefficients.
The values of coefficients a, b, A, and B at different conditions in Table 2 indicate that the decay curves of sand concentration and sand transport rate are affected by the wind speed and the particle size. If a logarithmic scale is used to express the sand transport rate, the corresponding curves are transformed into straight lines. The coefficient 1/B is the slope of the straight line, which presents the relative decay rate of the sand transport rate at different heights above the ground. The larger the 1/B, the more rapidly the sand transport rate decays with height. In the same way, the regression coefficients of the sand concentration profile also apply to corresponding physical meanings and laws. For the convenience of comparison with previous studies, the following focuses on the regression coefficients of sand transport rate under different conditions.
As can be seen from Table 2, the coefficient A increases with increasing wind speed for all particle sizes, which is consistent with the conclusion proposed by Dong et al. [34]. At the same wind speed, the value of coefficient A is the largest for mixed sand, followed by fine sand, and the smallest for coarse sand in this study. However, the research conducted by Dong et al. showed that the value of coefficient A is the largest for fine sand, followed by mixed sand, and the smallest for coarse sand, and the value of coefficient A for fine sand is obviously larger than our research results [34]. Predominantly, deviations in the results may be because the research carried out by Dong et al. ignored the turbulence characteristics of the incoming flow [34]. In fact, the turbulence causes more fine sand to break away from the creeping motion on the bed surface and enter the saltation motion. Then, compared with the uniform sand bed of fine sands, the mixed sand bed is a non-uniform sand bed. The turbulence causes sand particles with different particle sizes to interact and affect each other, thus making it easier for the original stationary sand particles to enter the creeping motion. Additionally, it may follow on from setup parameters, resulting in different similarity parameters affecting windblown sand transport.
The relative decay rate 1/B decreases with the increase in wind speed for all particle sizes, which reveals that at higher wind speed, turbulence makes the sand particles move more violently and makes more sand particles move at a greater height. However, the research carried out by Dong et al. does not reflect this law well [34], and the relative decay rate of fine sand is higher than our research results.

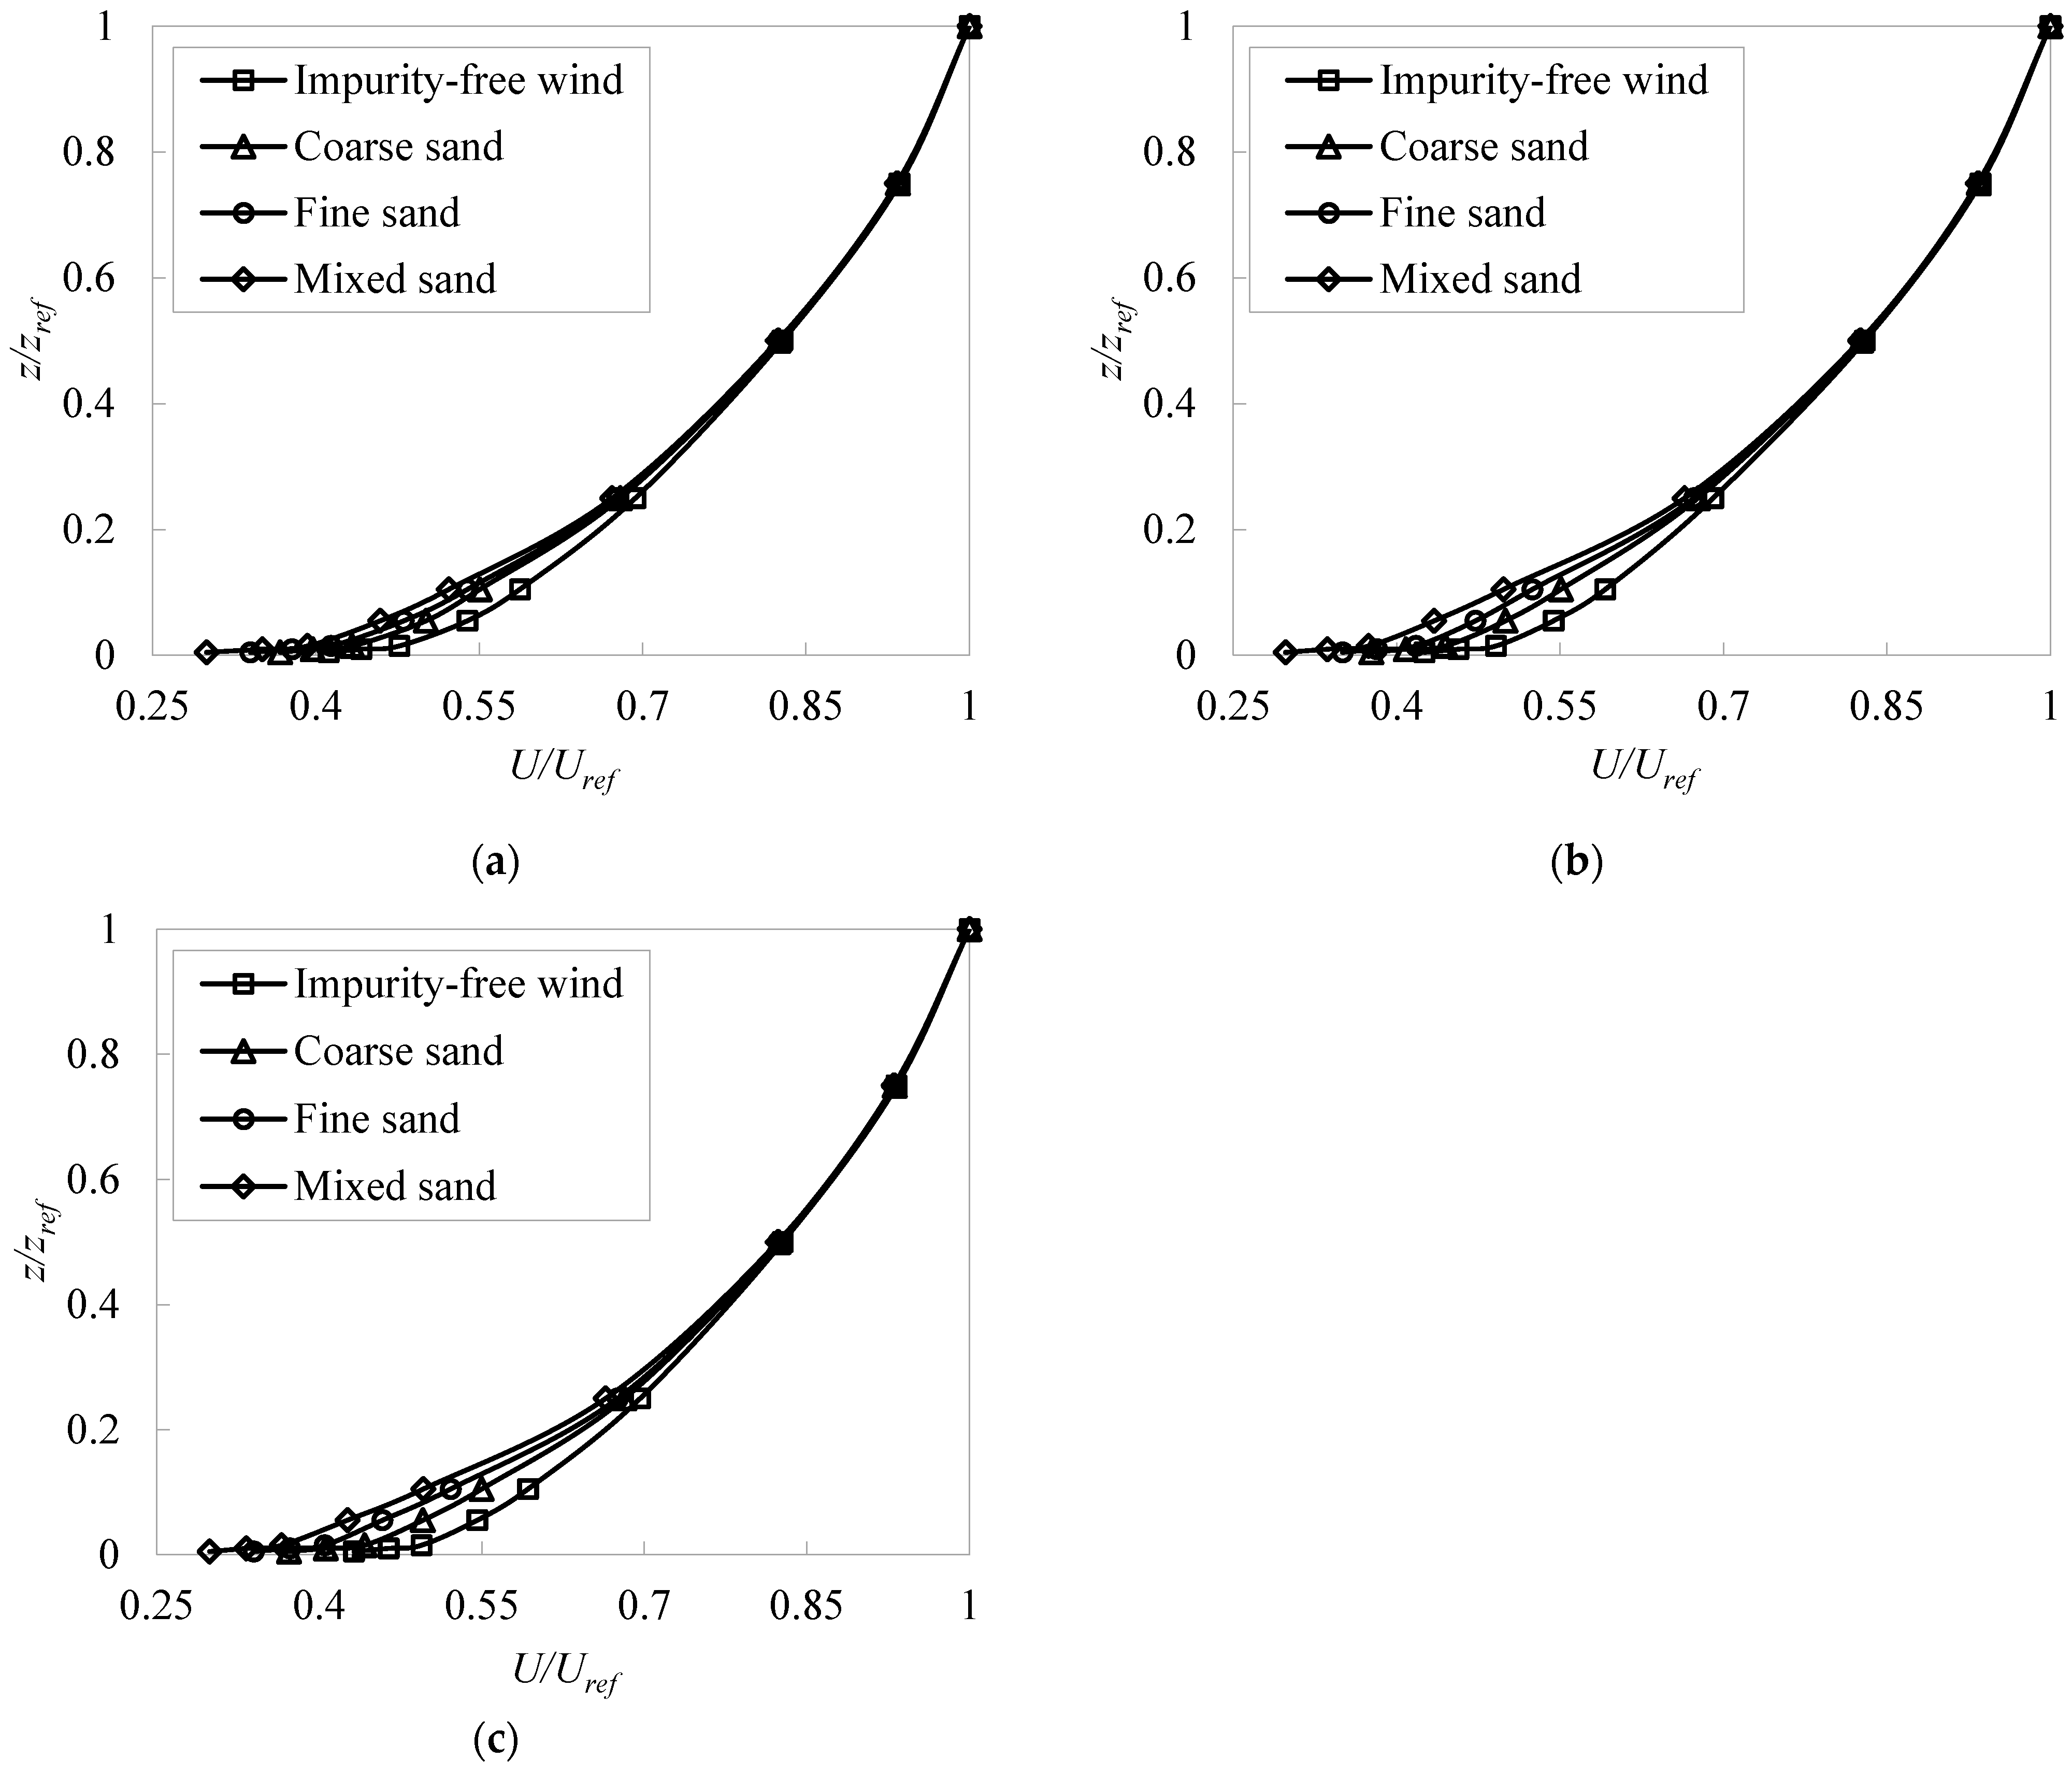
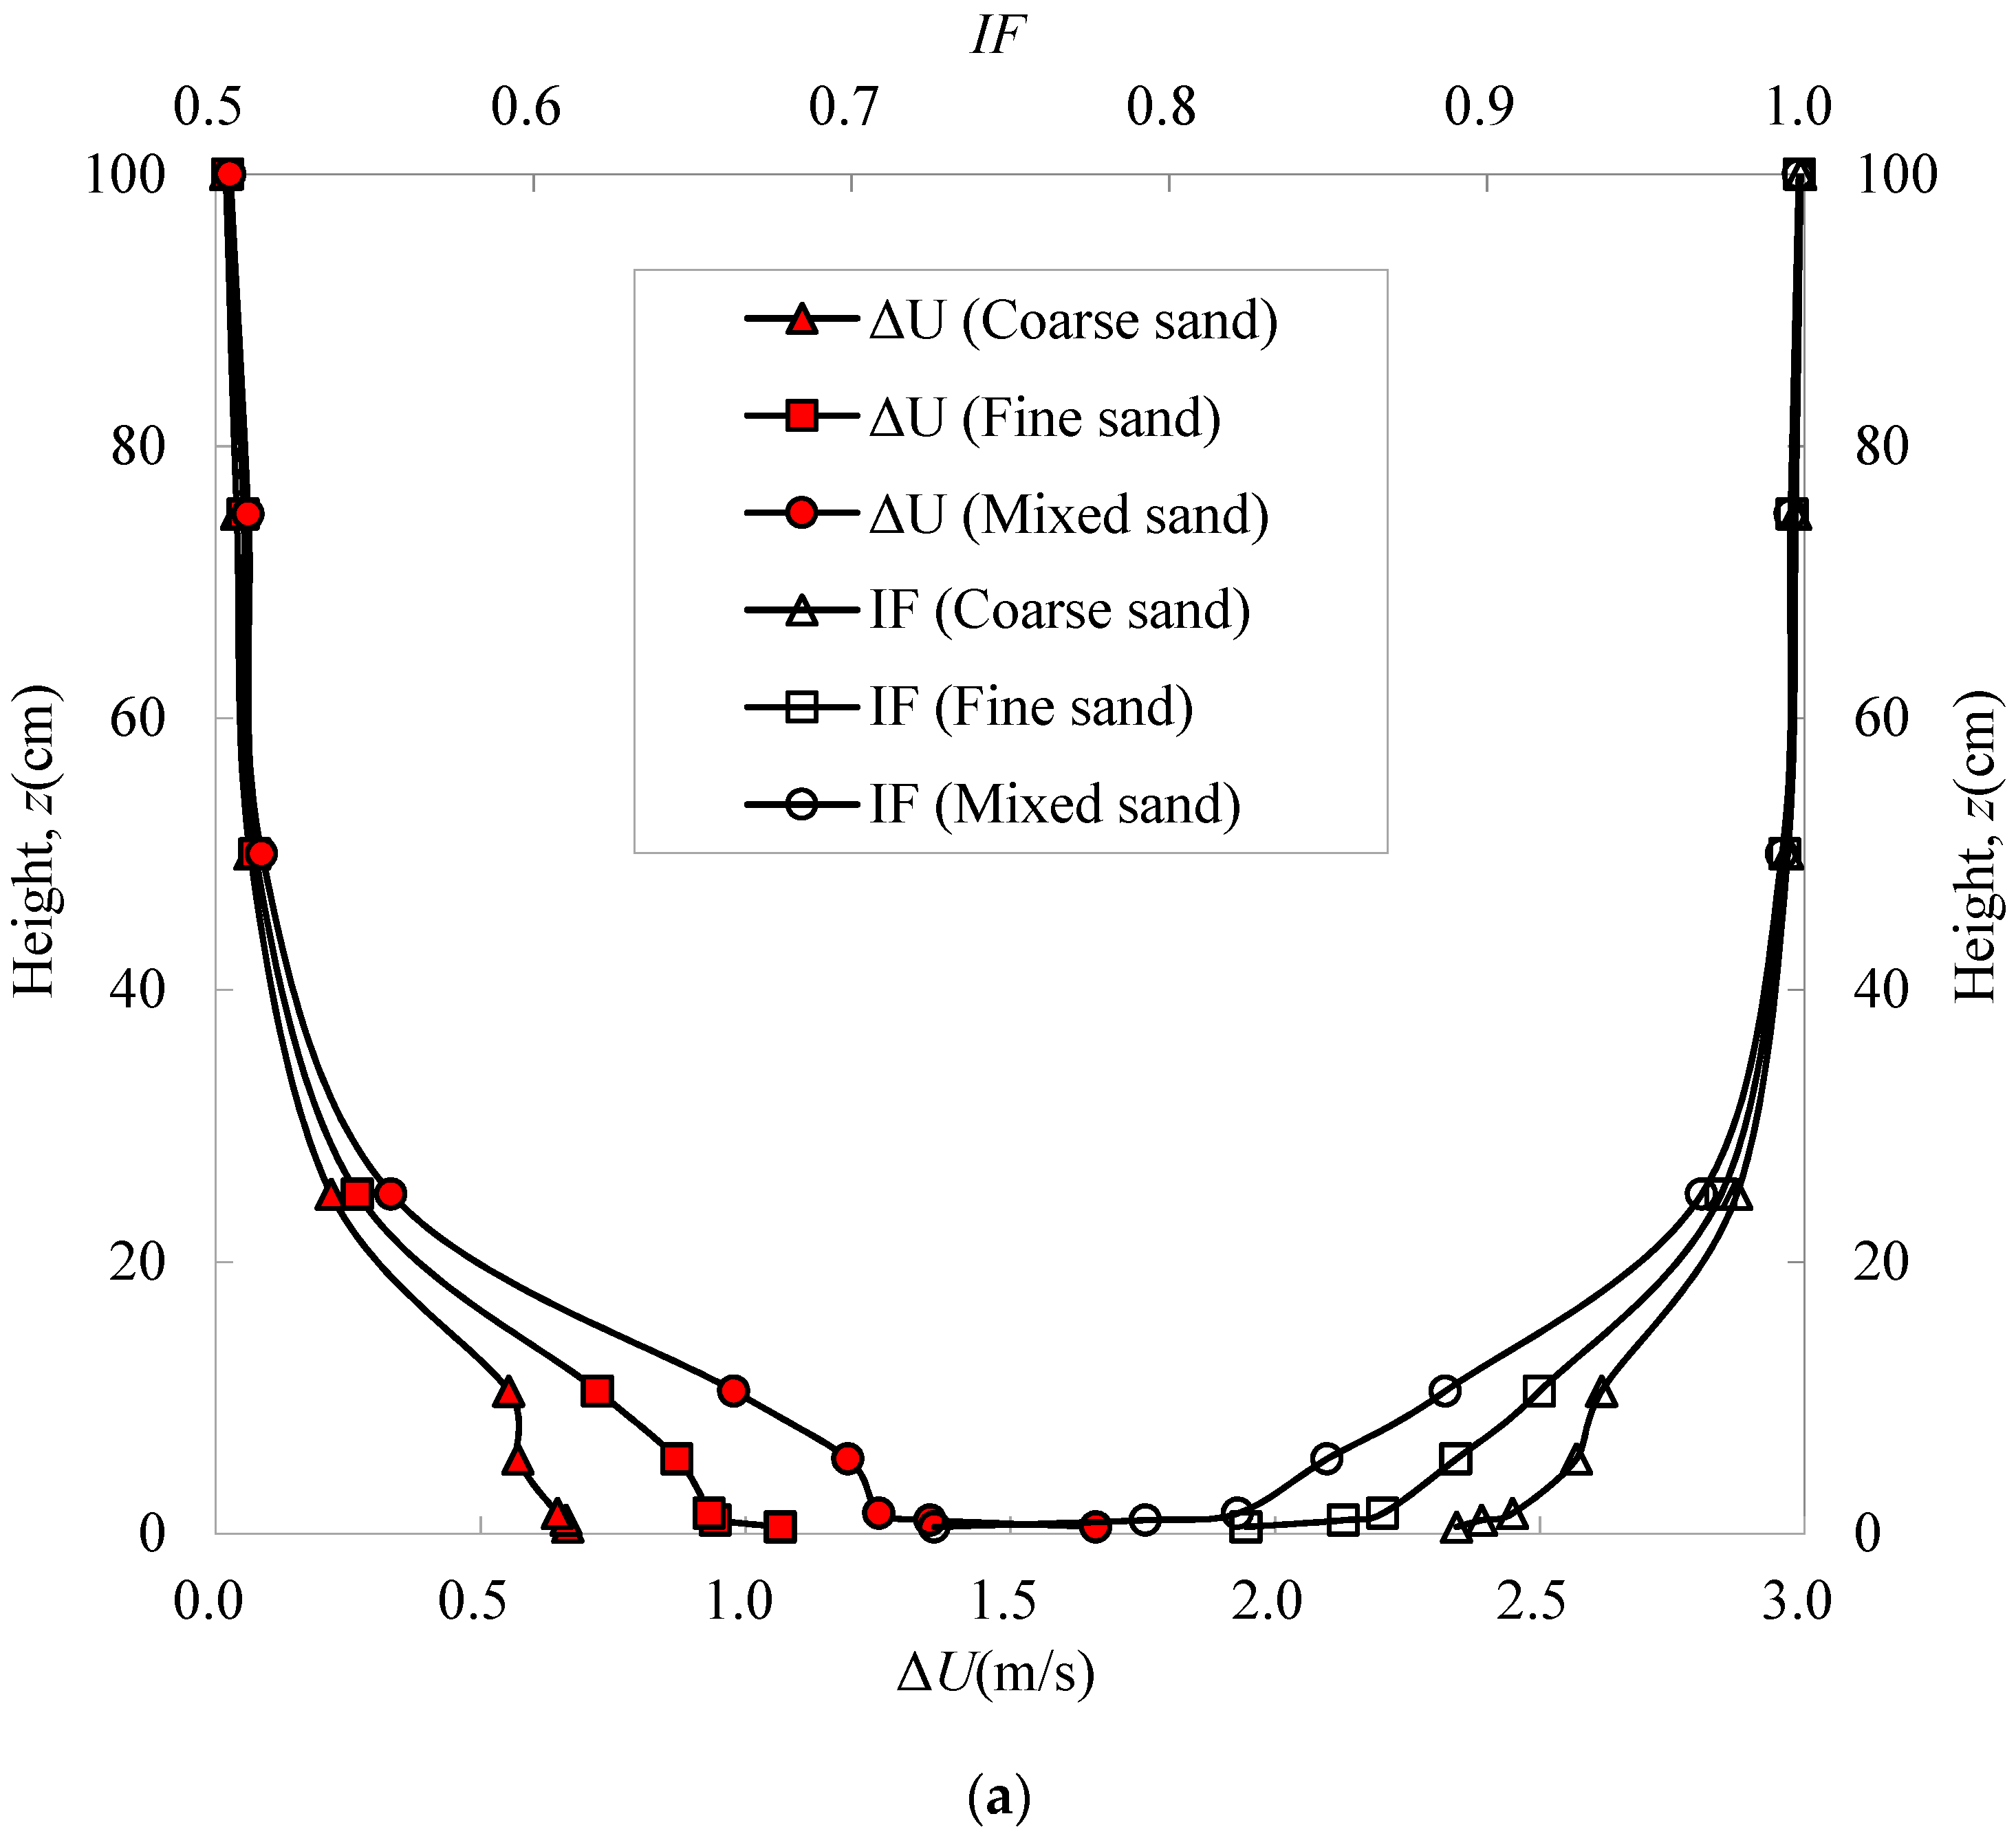
3.4. Wind Profile in the Windblown Sand Flow Field

To study the effect of concentration and bed surface with different particle sizes on the wind profile, Figure 10 represents wind profiles in the impurity-free wind and windblown sand flow field at three kinds of indicated wind speeds. The results show that the particle movement in the windblown sand flow field significantly reduces the wind speed below 0.3 m and has little effect on the wind speed when the height exceeds 0.3 m. The degree of influence of sand particles on the wind speed at different heights is directly related to the vertical distribution characteristics of the sand concentration shown in Figure 9. The higher the sand concentration is, the faster the wind speed decreases. In addition, at the same indicated wind speed, the degree of influence of coarse sand, fine sand and mixed sand on the wind profile increases, in turn.
To quantitatively analyze the influence of particle movement on the wind speeds at different heights, we introduce the wind speed impact value Δ U z and impact factor I F U z , respectively. The formula is as follows:
{ Δ U z = U z ( i f w ) U z ( w s ) I F U z = U z ( w s ) / U z ( i f w )
where U z ( i f w ) and U z ( w s ) are the speeds in the impurity-free wind and windblown sand flow field at a height z, respectively, in m/s.
Figure 11 represents the impact values and impact factors of wind speeds at different heights in the windblown sand flow field. The results show that the impact factors are all less than 1, further indicating that the sand particle movement in the windblown sand flow field reduces the wind speed. The sand particle movement has more influence on the wind speed as the indicated wind speed increases, and has less impact on the wind speed as the height increases. This is because the sand concentration increases with increasing wind speed, and decreases with increasing height. From Figure 9, only a few sand particles suspend in the air flow above 0.3 m, and the sand concentration is quite low. Therefore, the reduction of the wind speed is only 0.02 m/s to 0.13 m/s. According to the impact factors at 9 different heights, the average reduction of the wind profile by coarse sand, fine sand and mixed sand is 5.2–6.4%, 7.6–10.3% and 10.8–14.6%, respectively, which may be determined by the concentration of three kinds of sand particles. In conclusion, the windblown sand flow field can be divided into the flow field inside and outside the sand particle saltation layer. Within the saltation layer, the airflow at each height is directly affected by the sand particle movement, and then the wind profile is directly related to the sand concentration distribution; while outside the saltation layer, the wind profile is basically unaffected because the sand concentration in the airflow is quite low.

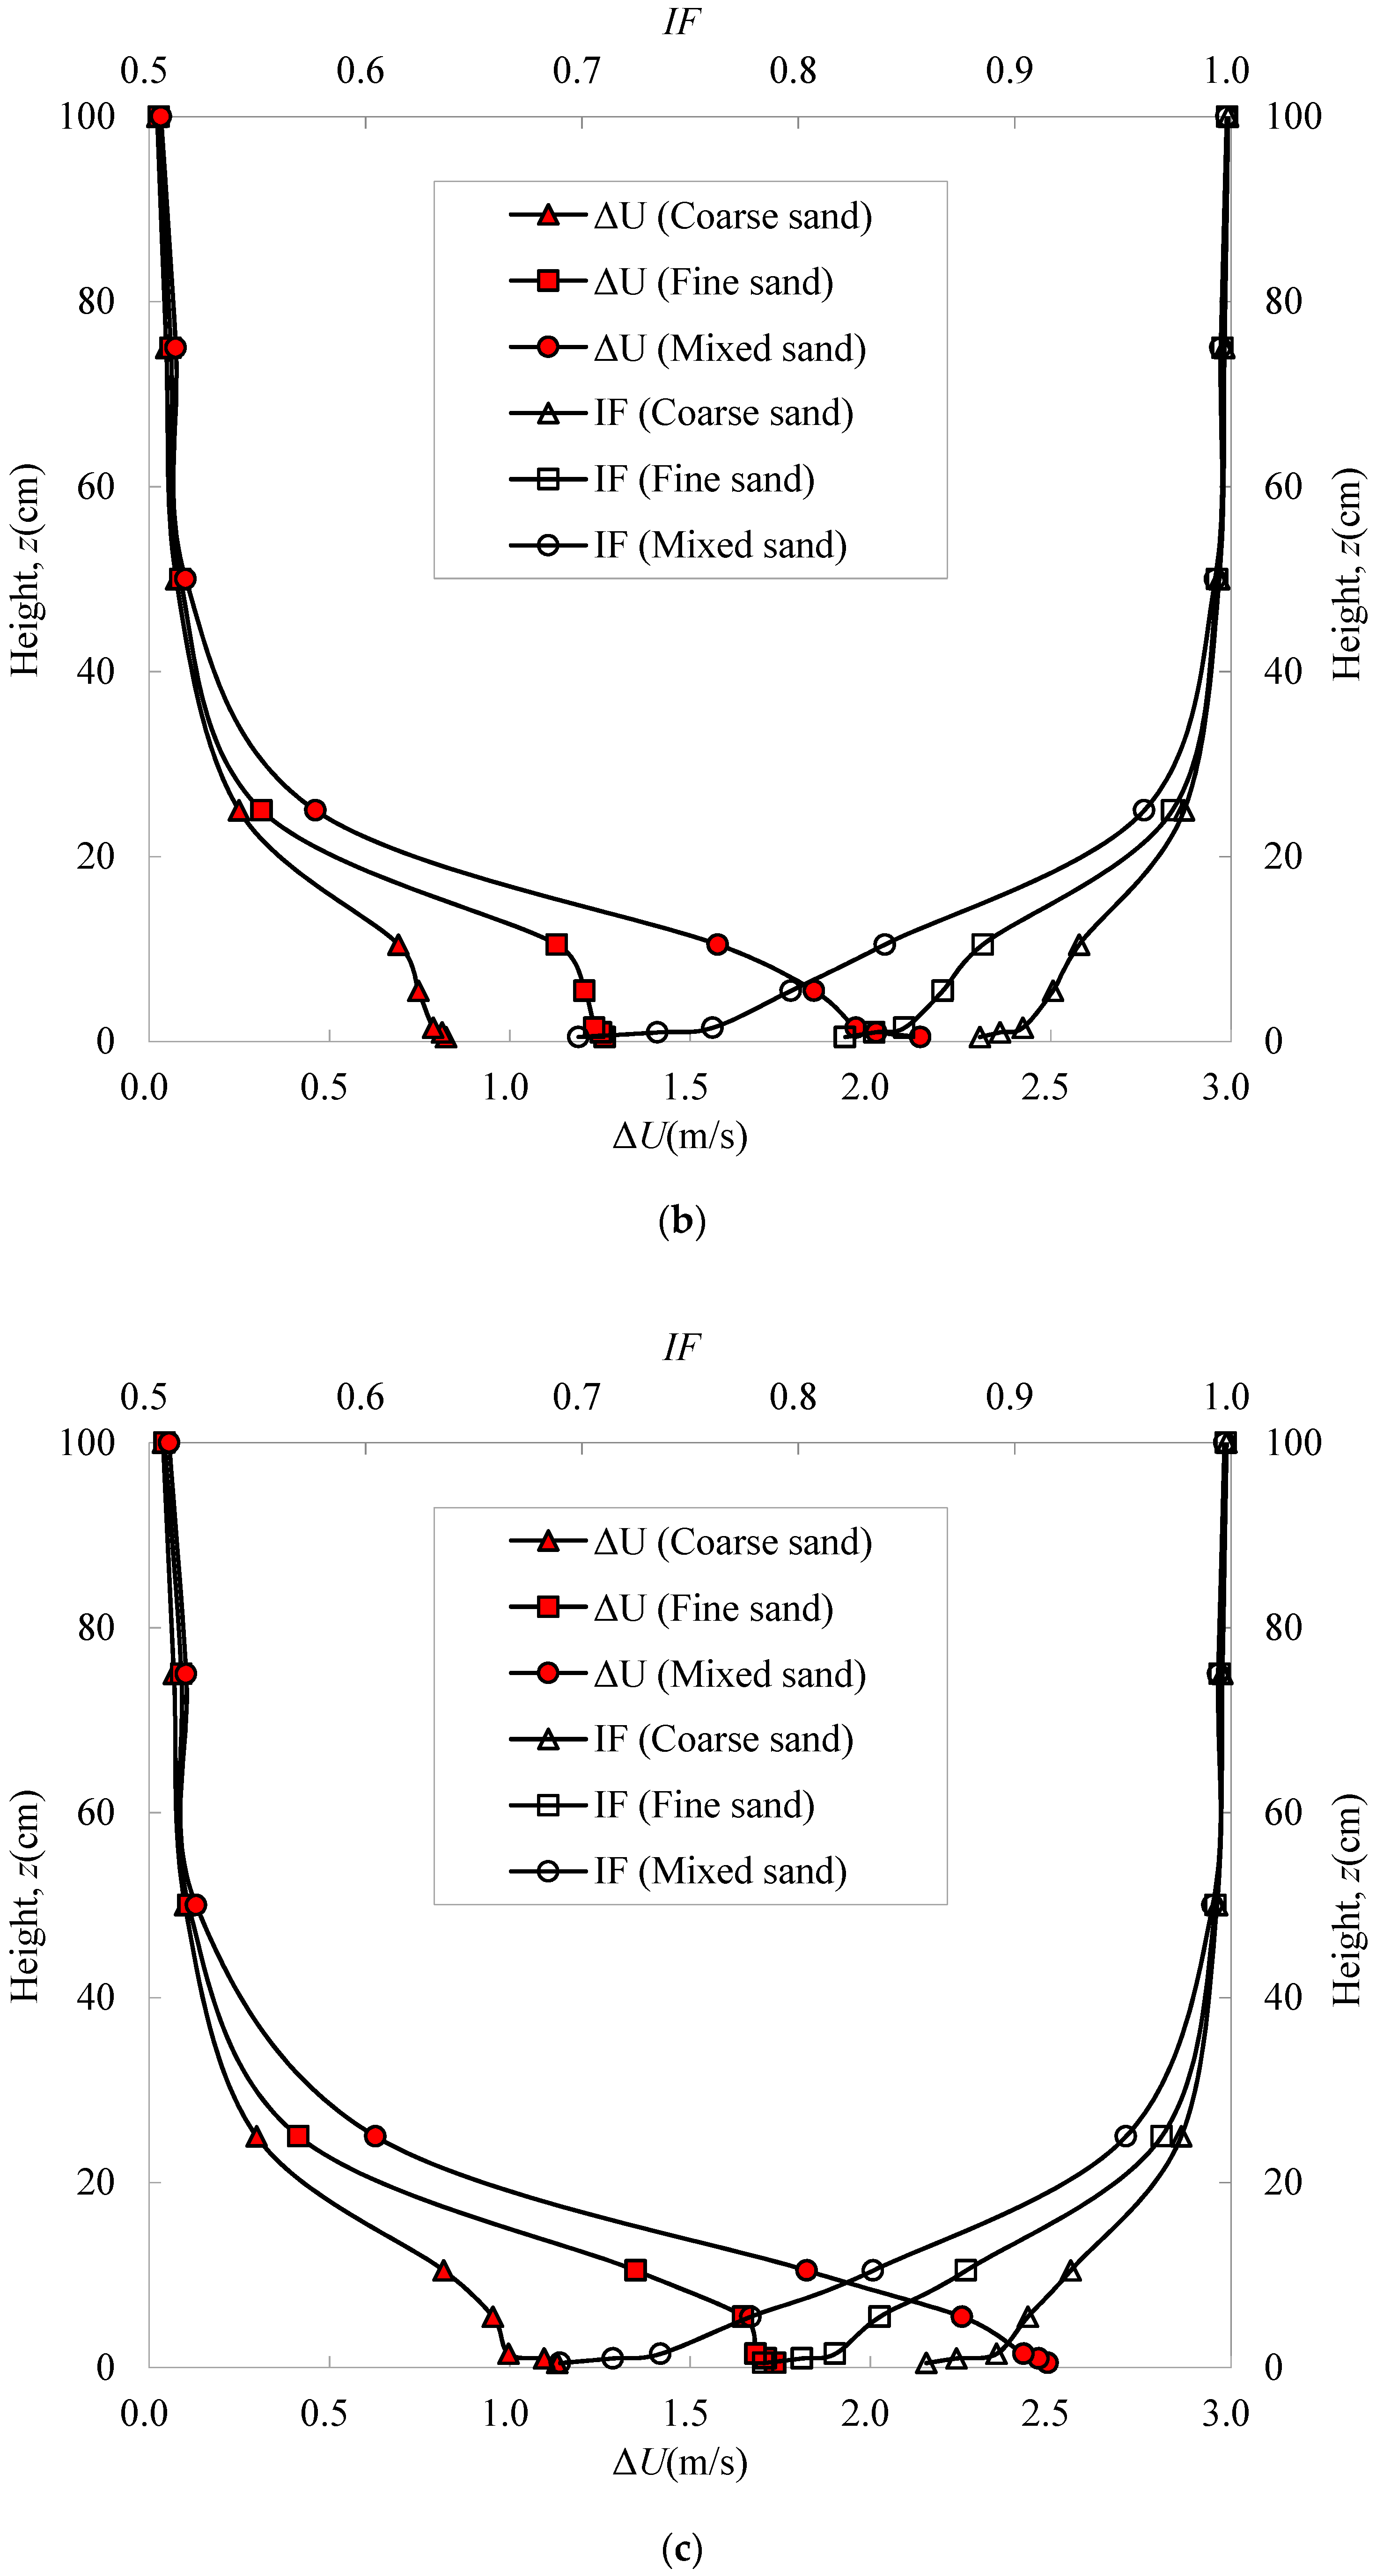
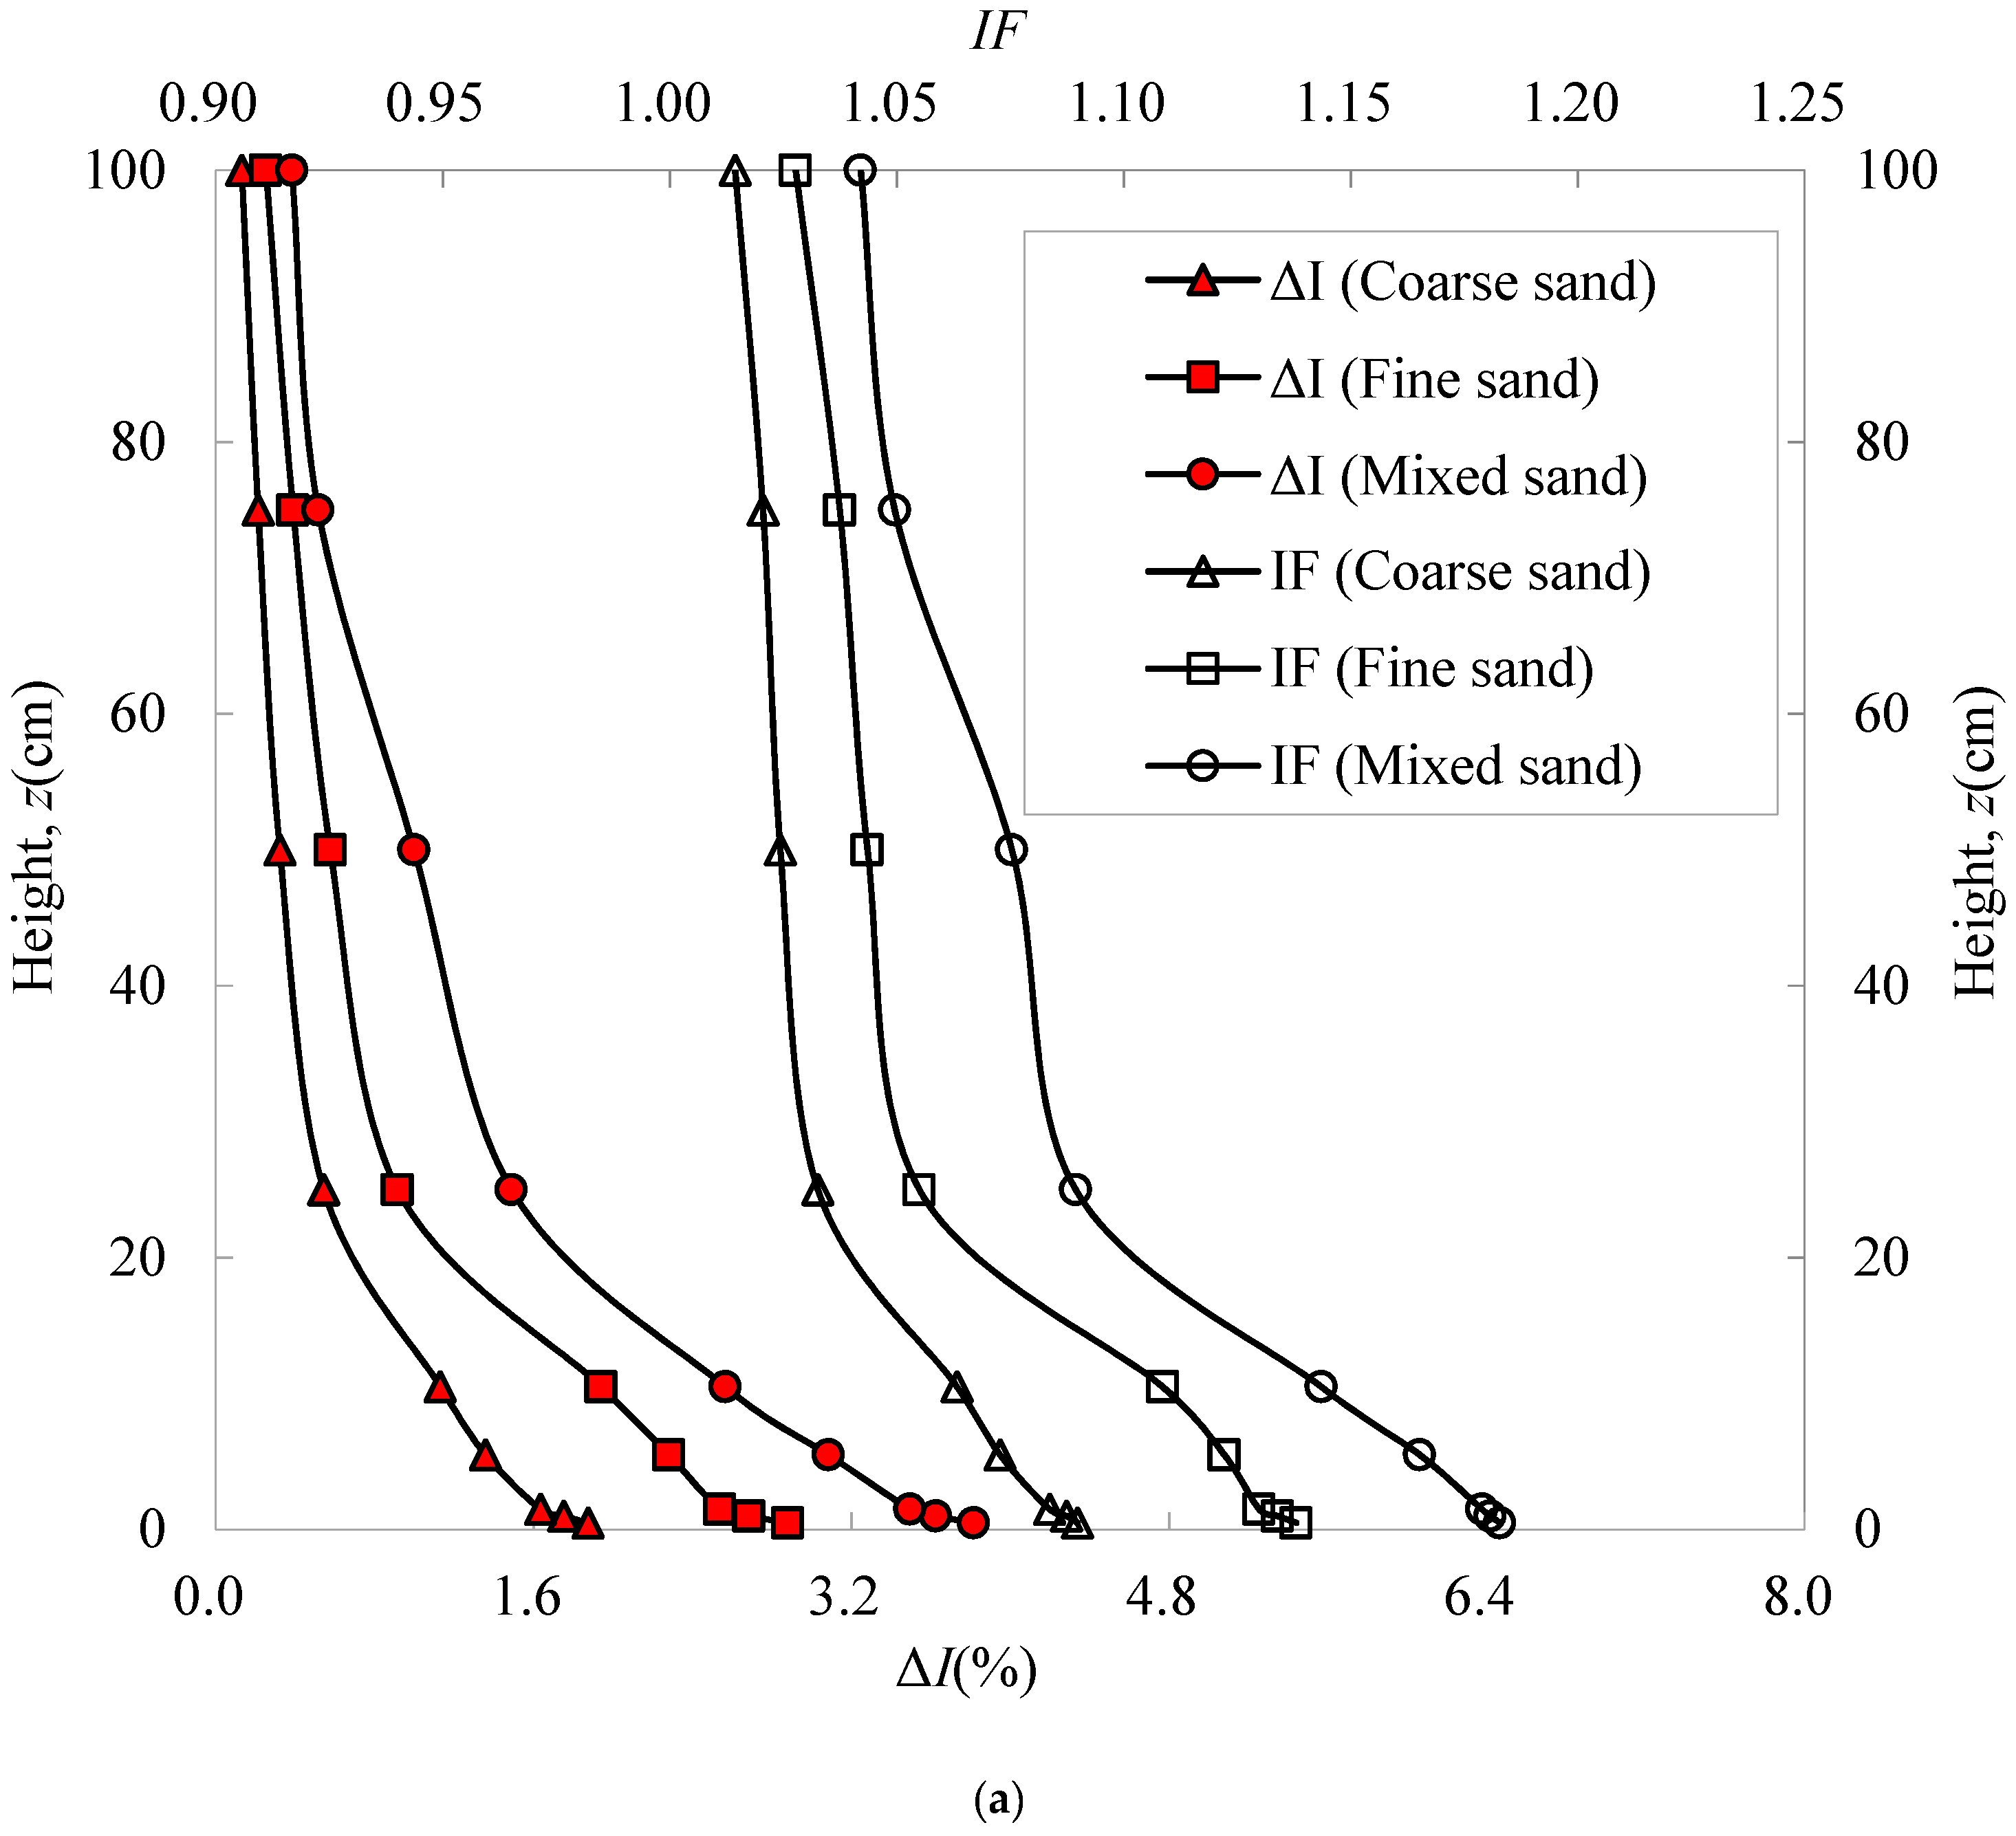
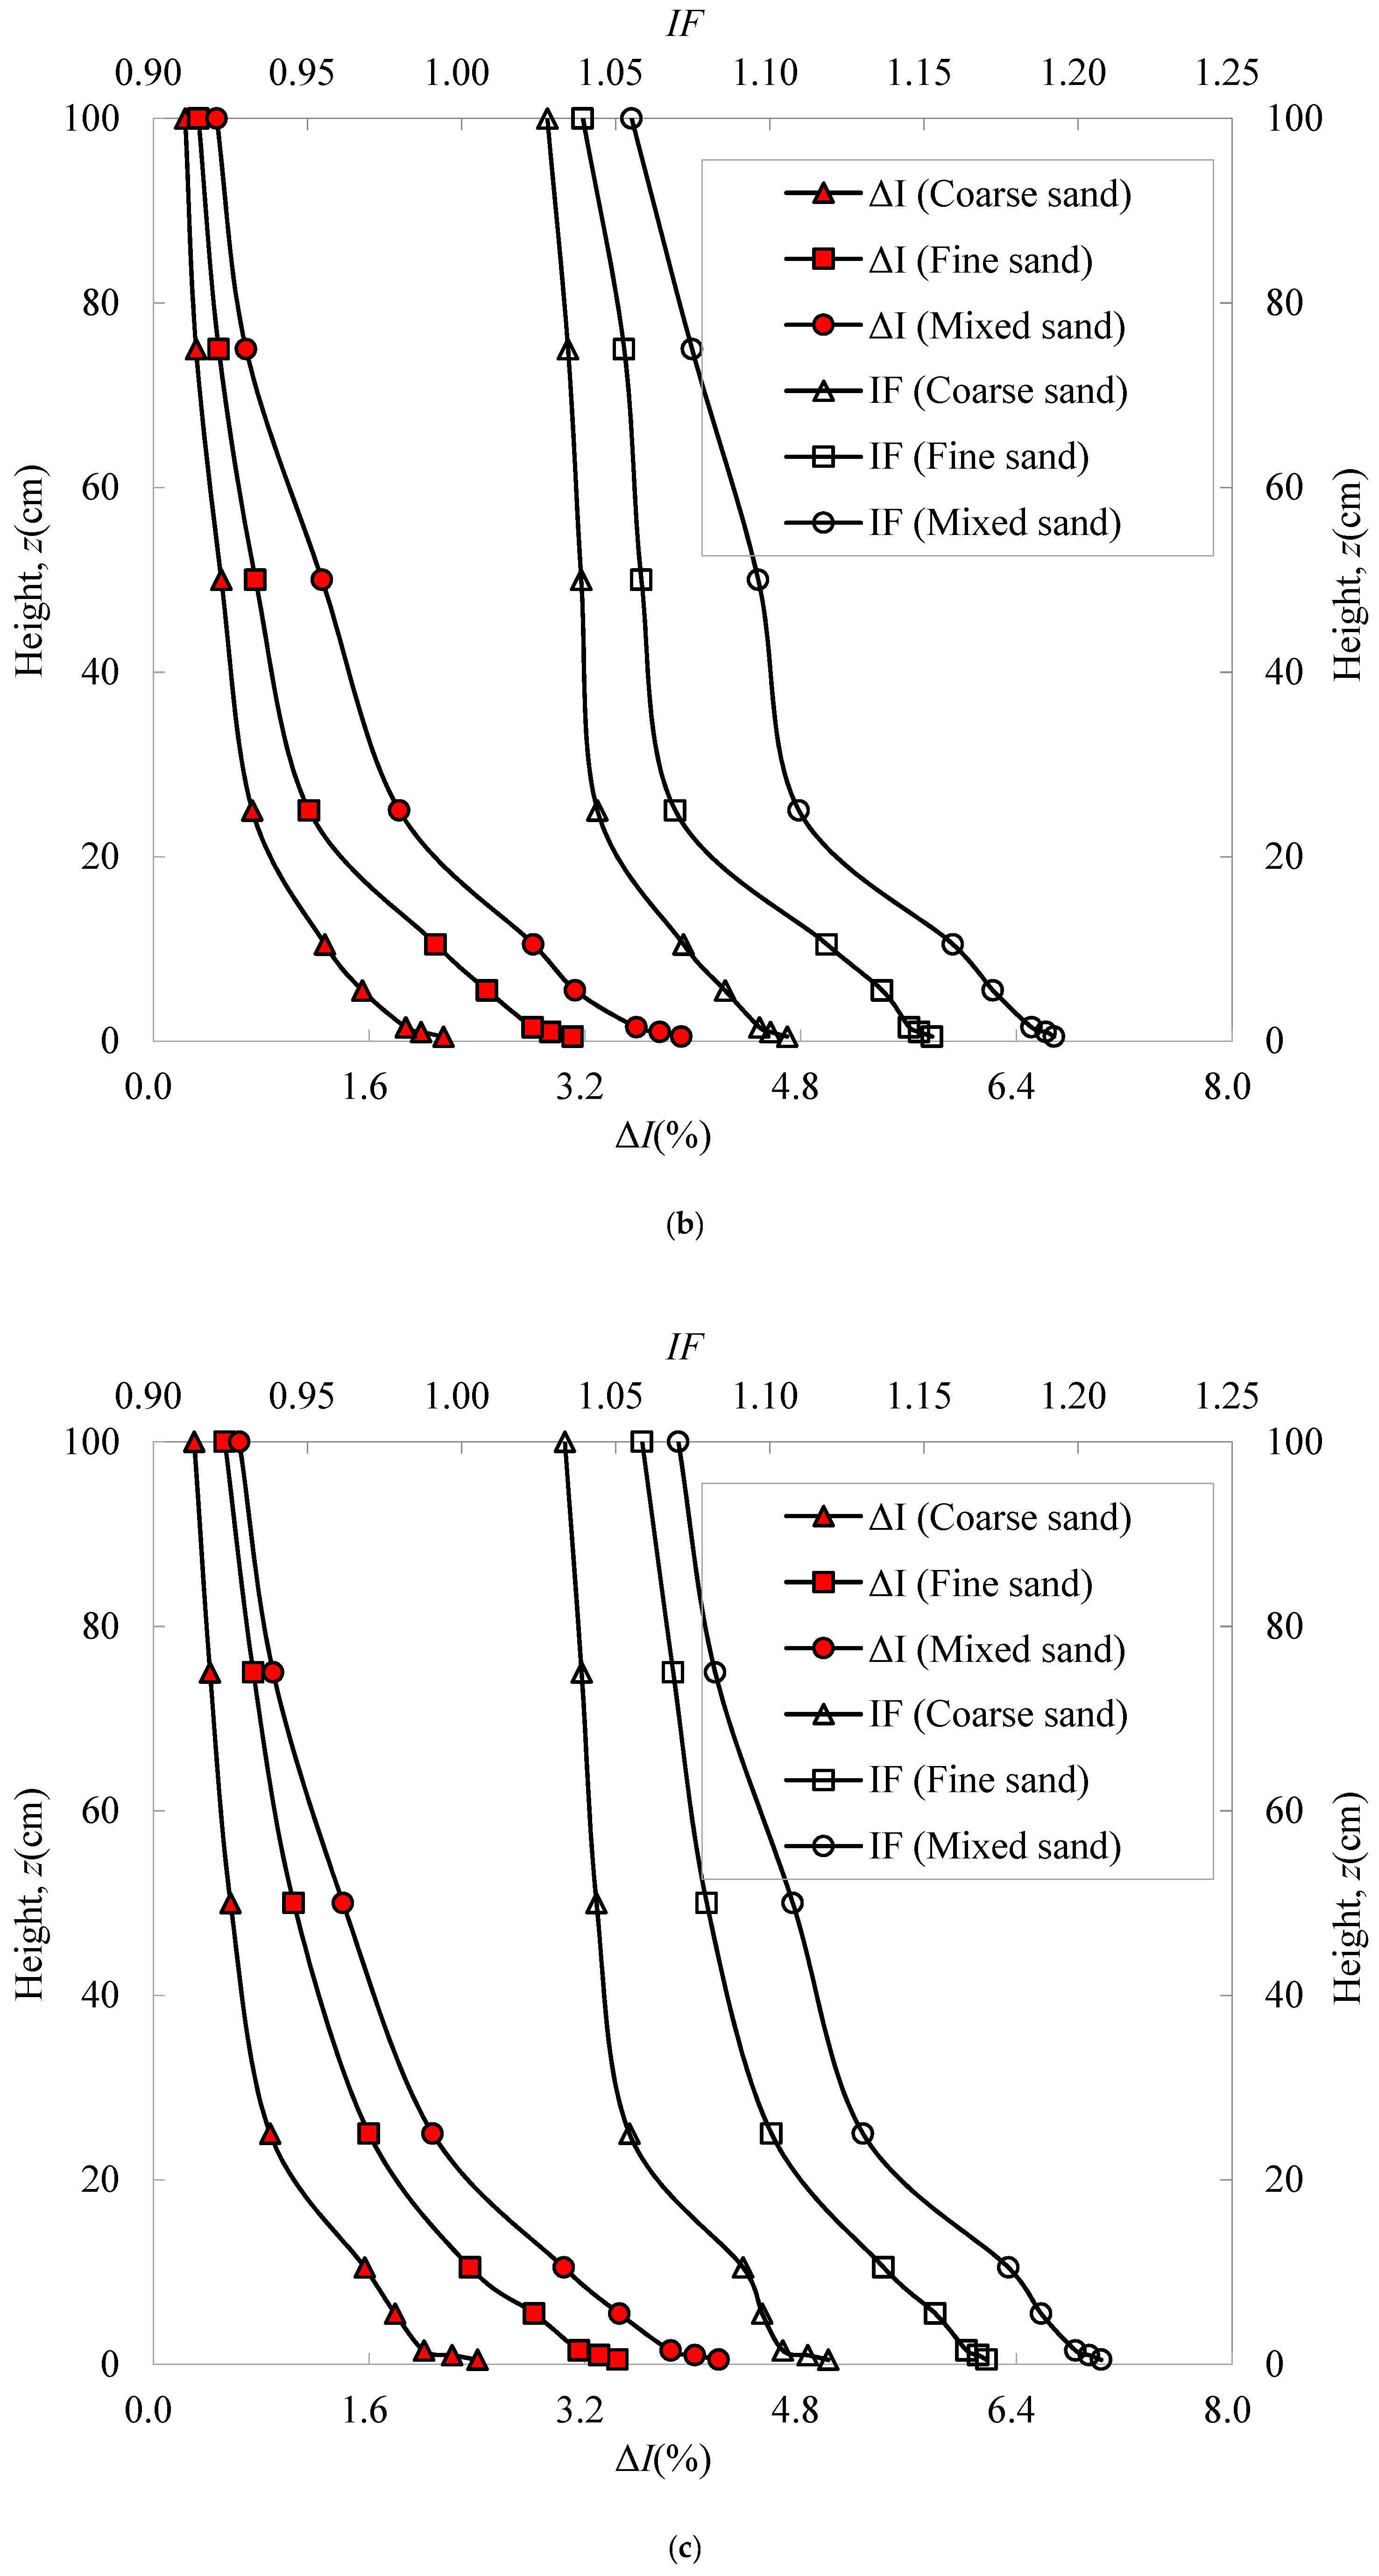
3.5. Turbulence Intensity in the Windblown Sand Flow Field

To study the effect of concentration and bed surface with different particle sizes on turbulence intensity, Figure 12 provides the relationship between the turbulence intensity and height at three different wind speeds in the impurity-free wind and windblown sand flow field. The results show that the turbulence intensity decreases with increasing height. The sand particle movement significantly enhances the turbulence intensity when the height is less than 0.3 m and has a small influence on the turbulence intensity when the height is over 0.3 m in the windblown sand flow field. Similar to the wind profile, the degree of influence of sand particles on the turbulence intensity at different heights is directly related to the vertical distribution characteristics of the sand concentration, as shown in Figure 9. The higher the sand concentration is, the faster the turbulence intensity increases. Moreover, at the same indicated wind speed, the degree of influence of coarse sand, fine sand and mixed sand on the turbulence intensity increase, in turn.
To quantitatively analyze the influence of particle movement on the turbulence intensities at different heights, we introduce turbulence intensity impact value Δ I z and impact factor I F I z , respectively. The formula is as follows:
{ Δ I z = I z ( w s ) I z ( i f w ) I F I z = I z ( w s ) / I z ( i f w )
where I z ( i f w ) and I z ( w s ) are the turbulence intensities in the impurity-free wind and windblown sand flow field at a height z, respectively, in %.
Figure 13 represents the impact values and impact factors of turbulence intensities at different heights in the windblown sand flow field. The results show that the impact factors of turbulence intensities are all greater than 1, which further indicate the sand particle movement can strengthen the turbulence intensity in the windblown sand flow field. Similar to the wind profile, the sand particle movement has more influence on the turbulence intensity as the indicated wind speed increases and has less impact on the turbulence intensity as the height increases. It is because the increase in wind speed leads to the increase in sand concentration, and then the sand particle movement has a greater influence on the turbulence intensity. Besides, the increase in the height causes lower sand concentration, smaller motion intensity and less influence on the turbulence intensity. From Figure 9, only a few sand particles suspend in the air flow above 0.3 m, and the sand concentration is quite low. Therefore, the increase in the turbulence intensity is only ranged from 0.13% to 1.41%. According to the impact factors at 9 different heights, the average increase in the turbulence intensity by coarse sand, fine sand and mixed sand is 5.4–7.7%, 8.8–2.2% and 12.3–15.2%, respectively, which may be determined by the concentration of three kinds of sand particles. The sand particle with a higher concentration has a more significant effect on the increase in turbulence intensity.
It is worth noting that turbulence characteristics of the flow field are significantly affected by the sand particle movement. Since the turbulence characteristics represent the intensity of fluctuating wind, the windblown sand flow can enhance the fluctuating wind loads on infrastructures and civil structures compared with the impurity-free wind flow. At the same time, the sand particle movement is significantly affected by the turbulence characteristics in the windblown sand flow field. The more disordered the flow field is, the more violently the sand particles move.

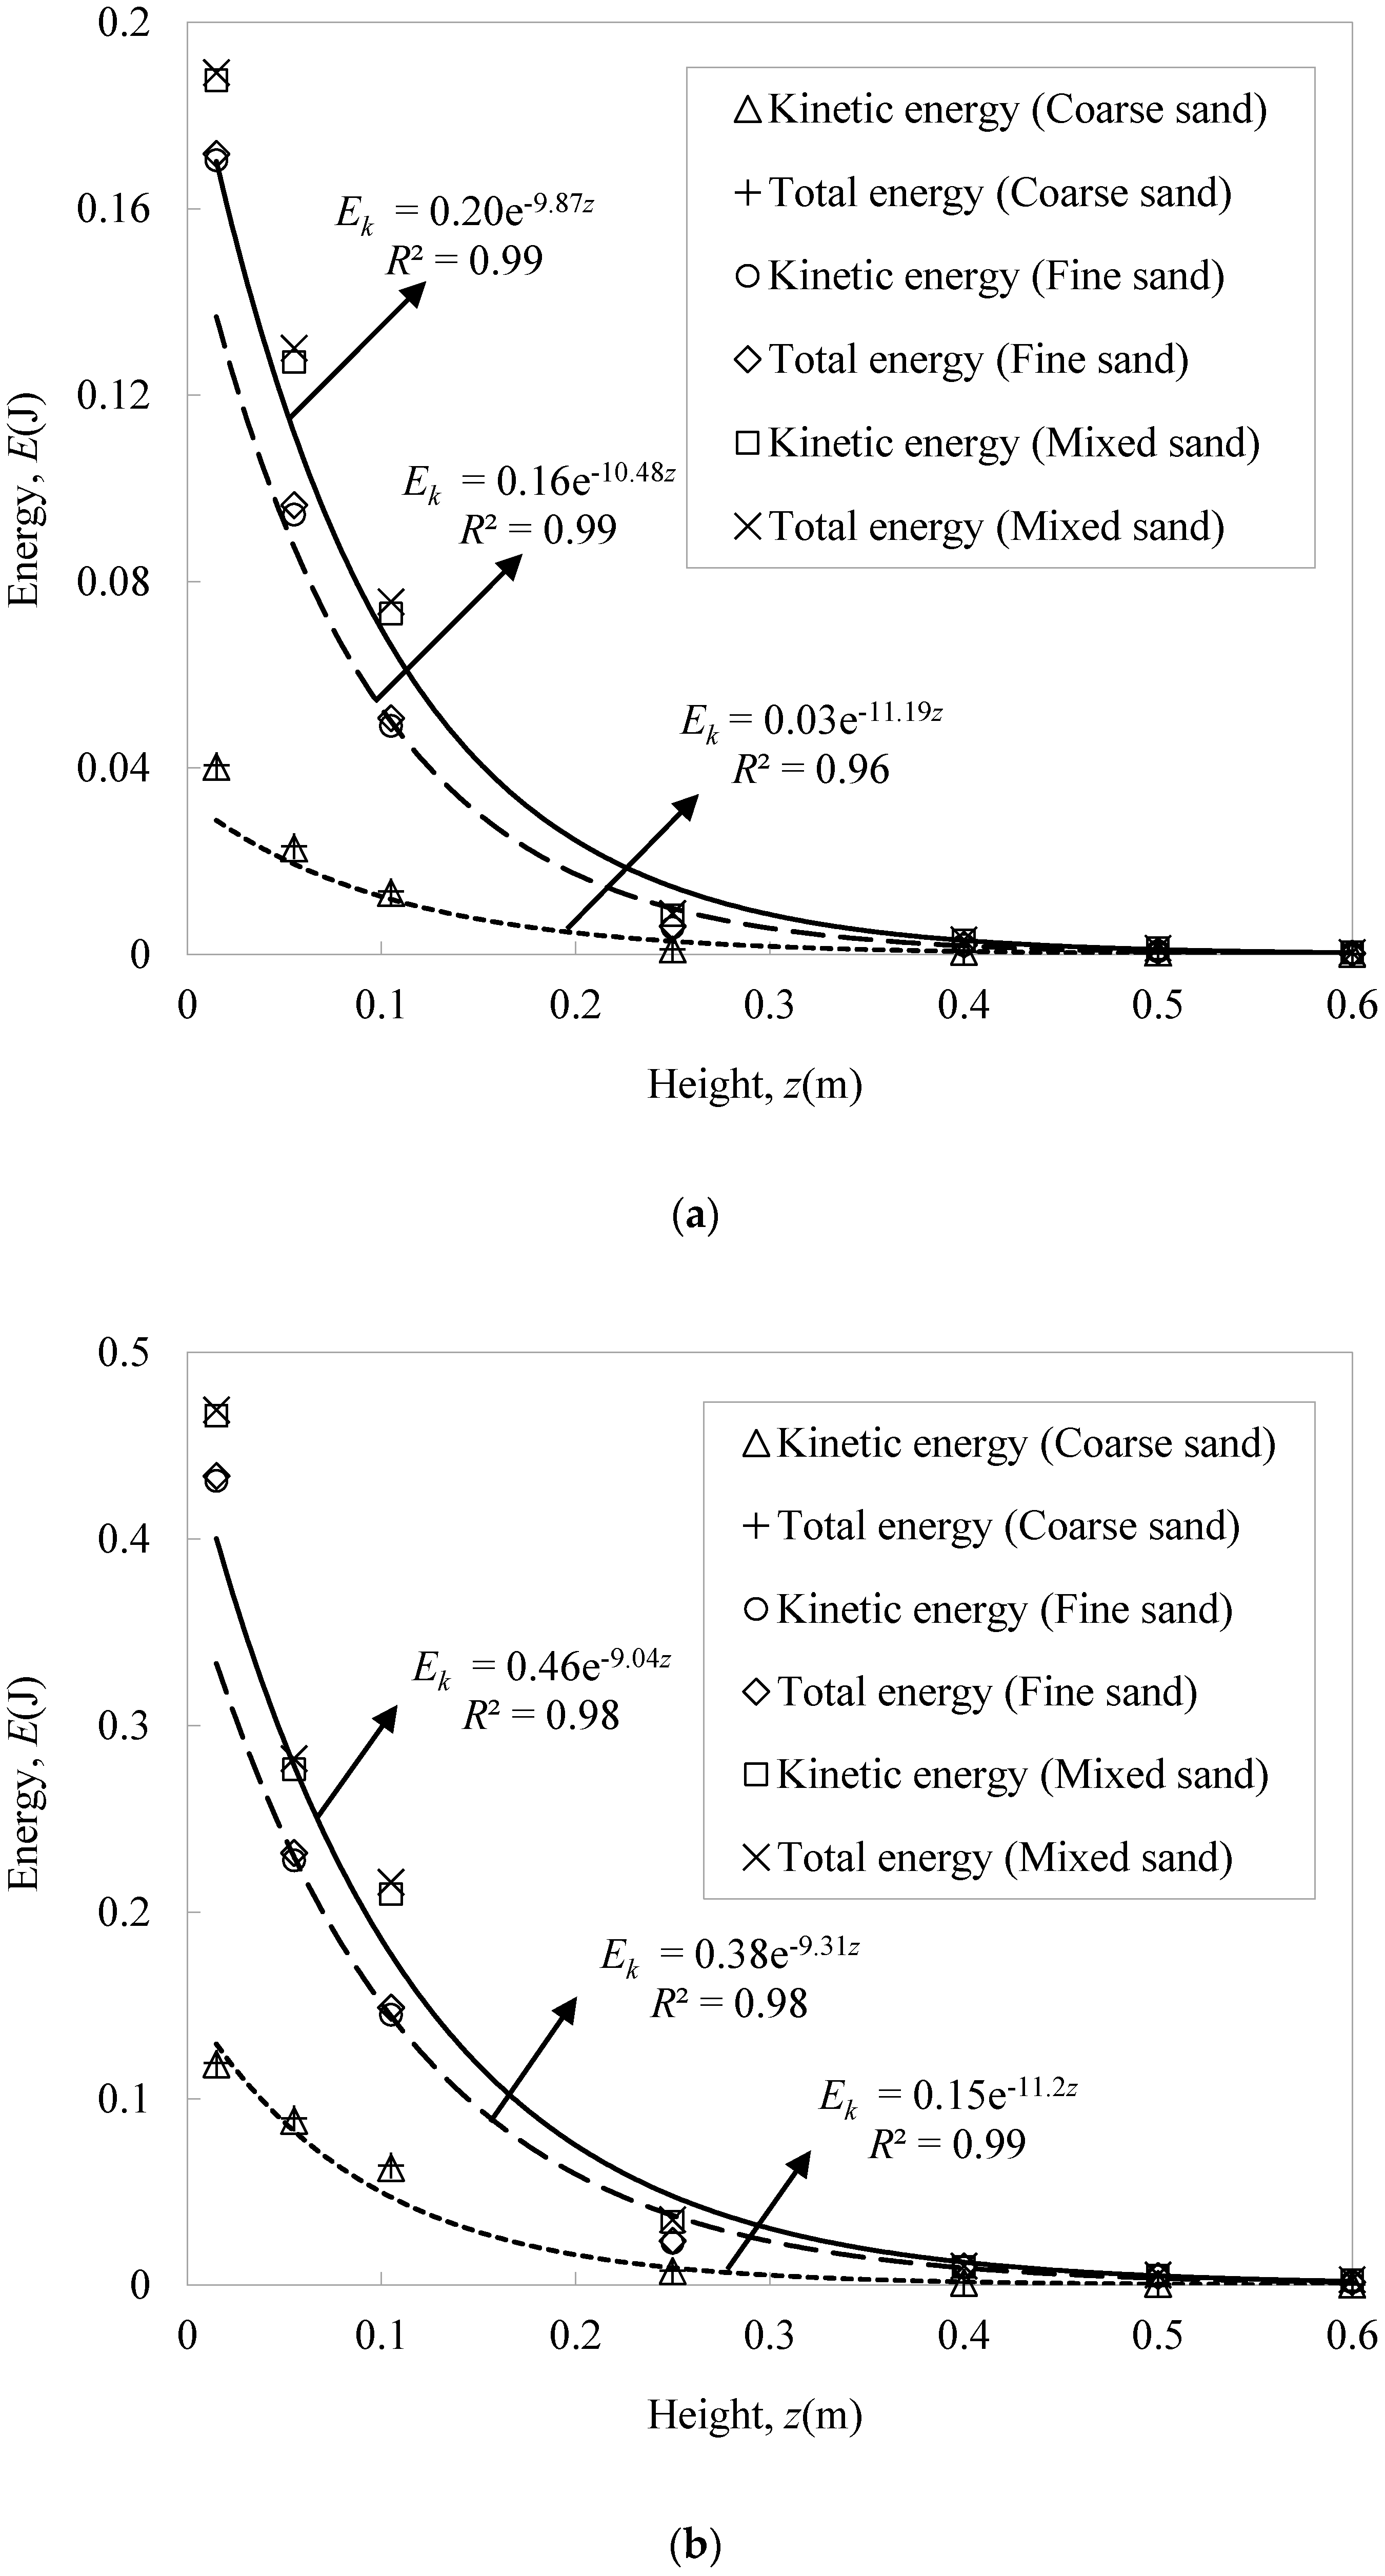
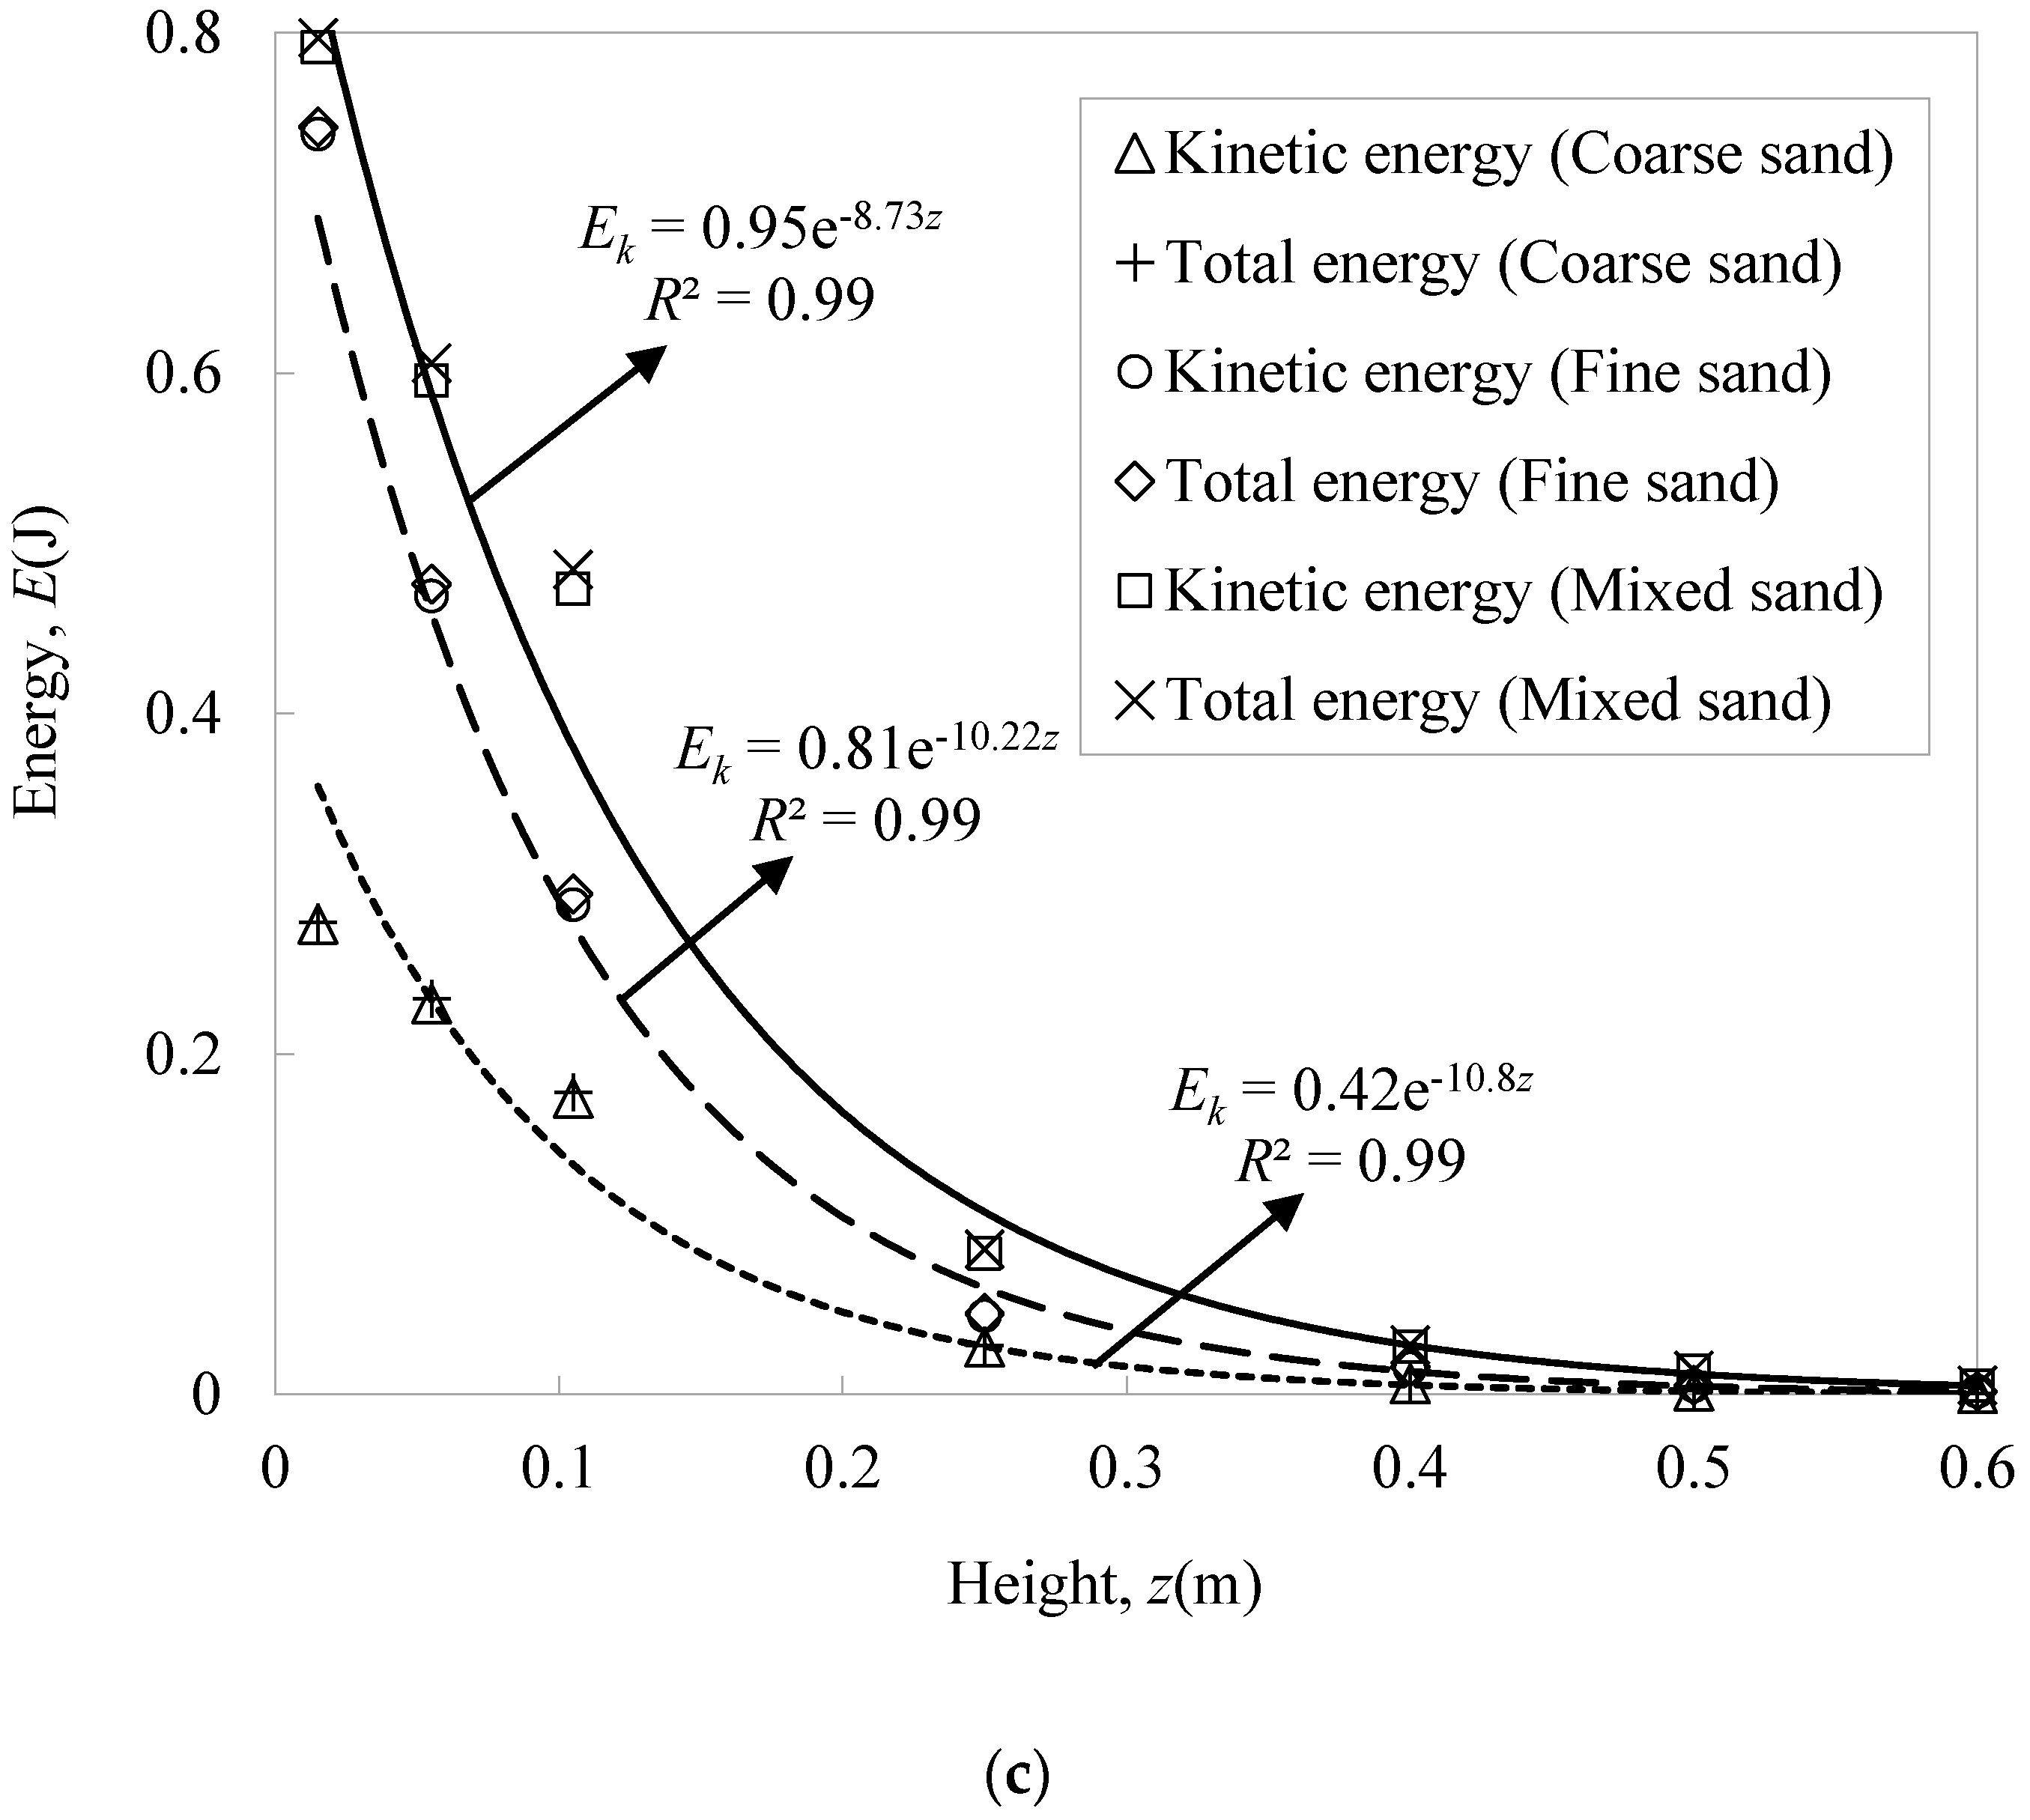
3.6. Energy Distribution of Sand Particles in the Windblown Sand Flow Field

The energy of sand particles in the windblown sand flow field, especially the kinetic energy of sand particles in the saltation layer, is an important parameter to study the characteristics of sand transport. It also determines the damage and destruction degree of the windblown sand to infrastructures and civil structures in the arid desert regions. However, there is little knowledge about the energy distribution of sand particles in the windblown sand flow field at present. To further understand the variation of particle energy with heights, we establish an energy distribution model of sand particles in the windblown sand flow field, according to the wind tunnel test data described above. To simplify the calculation for engineering applications, we assume that the speed of the sand particle is the same as the wind speed. The following formulas are used to calculate the energy of sand particles in the windblown sand flow field.
{ E k = 1 2 m U s 2 E p = m g z E t = E k + E p = 1 2 m U s 2 + m g z
where Ek, Ep and Et are the kinetic energy, potential energy and total energy of sand particles in the windblown sand flow field, respectively, in J, m is the mass of sand particles, in kg, U s and U a are the sand particle speed and the wind speed in the windblown sand flow field, respectively, in m/s, in this study, U s U a , z is the height, in m, g is the gravitational acceleration, in m/s2.
We can obtain the kinetic energy and total energy of sand particles at different heights through Formula (6), as shown in Figure 14. The results show that the energy of sand particles is related to wind speeds, heights and particle sizes. For sands with all particle sizes and wind speeds, the kinetic energy and total energy exponentially decay with increasing heights. However, the research conducted by Zou et al. showed that the variations in kinetic energy and total energy of sand particles with height accord with the pulse peak modified with power term law [39]. In other words, the maximum kinetic energy value occurs at about 6 cm above the surface; below 6 cm, the kinetic energy value increases rapidly with increasing height, while above 6 cm, it decreases slowly. The main possible reasons for different results are as follows: (1) The energy distribution of sand particles is closely related to the concentration distribution of sand particles. However, the sand concentration profile in the wind tunnel test conducted by Zou et al. deviates from our test results. (2) Based on the wind tunnel test data below 19 cm, Zou et al. fitted the energy distribution model of sand particles but with fewer test data for height below 6 cm [39]. While in this study, we fit the energy distribution model of sand particles based on the wind tunnel test data below 60 cm.
As can be seen from Figure 14, the energy above 0.6 m is quite small and could be ignored, which is mainly because the sand concentration above 0.6 m is quite small. At the same indicated wind speed, the energy in the mixed sand, fine sand, and coarse sand are successively reduced, as their energy is positively correlated with their mass. For the same sand particles, because the kinetic energy is proportional to the square of the speed, the energy increases with the increasing wind speed. The variation of total energy with height is similar to that of kinetic energy with height and the proportion of potential energy to total energy is very small. Therefore, when studying the energy distribution of sand particles, we should mainly take into account the influence of kinetic energy of sand particles.
For sands with all particle sizes and wind speeds, the kinetic energy can be fitted with the least-square method. Figure 14 shows that the relationship between kinetic energy and height can be expressed as the exponential function ( E k = m exp ( n z ) , where m and n are regression coefficients obtained by the least-square method). Table 3 indicates that the correlation between the kinetic energy and height is reasonably good. The correlation coefficient R2 is over 0.96 in any situation; the values of coefficients m and n at different conditions indicate that the decay curve of the kinetic energy is affected by the wind speed and the particle size at the same time. The coefficient m reflects the erosion ability of the sand particles on the surface to a certain extent. The coefficient m increases with the increase in the wind speed. At the same indicated wind speed, the coefficient m is the largest for mixed sand, followed by fine sand, and the smallest for coarse sand. The coefficient n represents the relative decay rate of the kinetic energy at different heights above ground level. The larger n is, the faster the kinetic energy decreases with height. At the same wind speed, the value of coefficient n is the largest for coarse sand, followed by fine sand, and the smallest for mixed sand.

3.7. Impact Pressure of Sand Particles in the Windblown Sand Flow Field

The loads acting on infrastructures and civil structures include wind loads and impact loads of sand particles in the windblown sand environment. However, the existing codes only consider the impact of wind load, which is not conducive to the efficient maintenance of infrastructures and civil structures in the windblown sand environment. To analyze the variation of impact pressure with wind speed, particle size, and height, a simplified impact pressure model of sand particles in a windblown sand flow field is established based on the assumption that the impact of sand particles on structures is an elastic collision.
Based on the momentum theorem, the impulse of sand particles in the windblown sand flow is obtained:
I = F t = 2 m U s 2 m U a
where I represents the impulse of sand particles, in N·s, F represents the impact force of sand particles, in N, t represents the impact time of sand particles colliding infrastructures and civil structures, in s.
Sand particles mass within an impact time:
m = ρ s A s U s t ρ s A s U a t
where As represents the impact area of sand particles colliding infrastructures and civil structures, in m2.
Substituting Formula (8) into Formula (7), the impact pressure of sand particles on infrastructures and civil structures is obtained:
P s = 2 ρ s U s 2 2 ρ s U a 2
where Ps represents the impact pressure of sand particles on infrastructures and civil structures, in Pa.
We could obtain the impact pressure profiles of structures in the windblown sand environment through Formula (9), as shown in Figure 15. Similar to the energy distribution law, the impact pressure of sand particles is related to wind speed, height and particle size. For sands with all particle sizes and wind speeds, the impact pressure exponentially decays with increasing heights. However, the research conducted by Huang et al. showed that the critical height of the impact pressure profile was approximately 20 cm [33]. In other words, the impact pressure increases above 20 cm and decreases below 20 cm with increasing height. It is mainly due to the different simulation methods adopted for the sand concentration profile in the wind tunnel. In this study, we simulate the common windblown sand environment by spreading sand on the floor of the wind tunnel. However, Huang et al. simulated the sandstorm environment by falling sand from the top of the wind tunnel [33]. Due to different research purposes, objectives, and test methods, the obtained sand concentration profiles, and impact pressure profiles, in the above two studies are also different.
As can be seen from Figure 15, the impact pressure above 0.6 m is quite small and could be ignored, which is mainly because the sand concentration above 0.6 m is quite small. At the same indicated wind speed, the impact pressure in the mixed sand, fine sand, and coarse sand are successively reduced, as their impact pressures are positively correlated with their mass. For the same sand particles, because the impact pressure is proportional to the square of the speed, the impact pressure increases with the increasing wind speed.
For sands with all particle sizes and wind speeds, the impact pressure can be fitted with the least-square method. Figure 15 shows that the relationship between impact pressure and height can be expressed as the exponential function ( P s = α exp ( β z ) , where α and β are regression coefficients obtained by the least-square method). Table 4 indicates that the correlation between the impact pressure and height is reasonably good. The correlation coefficient R2 is over 0.94 in any situation; the values of coefficients α and β at different conditions indicate that the decay curve of the impact pressure is affected by the wind speed and the particle size at the same time. The coefficient α also reflects the erosion ability of the sand particles on the surface to a certain extent. The coefficient α increases with the increase in the wind speed. At the same indicated wind speed, the value of coefficient α is the largest for mixed sand, followed by fine sand, and the smallest for coarse sand. The coefficient β represents the relative decay rate of the impact pressure at different heights above ground level. The larger β is, the faster the impact pressure decreases with height. At the same wind speed, the value of coefficient β is the largest for coarse sand, followed by fine sand, and the smallest for mixed sand.

4. Conclusions

In this study, we attempt to absorb the theory from Aeolian Physics into the research of structural wind engineering to obtain the characteristics of windblown sand flow fields. The research results would provide the reference for the improvement of windblown sand test technologies and methods, and also provide the theoretical basis for wind erosion control, wear resistance, windblown sand mitigation, and windblown sand resistance design of infrastructures and civil structures in arid desert regions. Significant conclusions are summarized as follows:
(1) Based on the measured wind characteristics in arid desert regions, windblown sand flow fields with three kinds of sand beds are simulated in the wind tunnel, respectively. The results indicate three kinds of sand particles in the flow field mainly move below 0.3 m. The characteristic saltation height of sand particles increases with increasing wind speed and particle size.
(2) The sand concentration increases as the wind speed increases, and decreases exponentially as the height increases and the exponential function ρ s = a exp ( z / b ) is applied. Coefficient 1/b is the relative decay rate, which decreases with the increase in wind speed for all particle sizes. At the same wind speed, the concentration value is the largest for mixed sand, followed by fine sand, and the smallest for coarse sand.
(3) Windblown sand flow field can be divided into the flow field inside and outside the sand particle saltation layer. Within the saltation layer, the particle movement significantly reduces wind speed and enhances turbulence intensity. The influence is directly related to the vertical distribution characteristics of sand concentration. Outside the saltation layer, the particle movement has little effect on wind profile and turbulence intensity.
(4) The energy and impact pressure of particles increase with increasing wind speed, and decays with exponential function as the height increases. At the same wind speed, the energy and impact pressure in the mixed sand, fine sand, and coarse sand are successively reduced. The variation of kinetic energy with height is similar to that of total energy with height and the proportion of potential energy to total energy is quite small.

Author Contributions

Conceptualization, B.H. and Z.L.; methodology, B.H. and Z.L.; software, Z.Z. (Zhefei Zhao); investigation, B.H., Z.L. and Z.Z. (Zhitian Zhang); formal analysis, B.H. and B.G.; resources, B.G.; writing—original draft preparation, B.H.; writing—review and editing, B.H. and Z.Z. (Zhefei Zhao); supervision, Z.L. and Z.Z. (Zhitian Zhang). All authors have read and agreed to the published version of the manuscript.

Funding

This research is supported by the Hainan Provincial Natural Science Foundation of China (No. 520QN231), the National Natural Science Foundation of China (No. 52068019), the Hainan University Research Start-up Foundation (No. KYQD(ZR)20005) and the Hainan Major Science and Technology Project (No. ZDKJ201803), which are greatly acknowledged.

Institutional Review Board Statement

Not applicable.

Informed Consent Statement

Not applicable.

Data Availability Statement

Not applicable.

Conflicts of Interest

The authors declare no conflict of interest.

References

  1. Dong, Z.B.; Chen, G.T.; He, X.D.; Han, Z.W.; Wang, X.M. Controlling blown sand along the highway crossing the Taklimakan Desert. J. Arid Environ. 2004, 57, 329–344. [Google Scholar] [CrossRef]
  2. Yao, Z.Y.; Xiao, J.H.; Jiang, F.Q. Characteristics of daily extreme-wind gusts along the Lanxin Railway in Xinjiang, China. Aeolian Res. 2012, 6, 31–40. [Google Scholar] [CrossRef]
  3. Cheng, J.-J.; Xue, C.-X. The sand-damage-prevention engineering system for the railway in the desert region of the Qinghai-Tibet plateau. J. Wind Eng. Ind. Aerodyn. 2014, 125, 30–37. [Google Scholar] [CrossRef]
  4. Cheng, J.-J.; Jiang, F.-Q.; Xue, C.-X.; Xin, G.-W.; Li, K.-C.; Yang, Y.-H. Characteristics of the disastrous wind-sand environment along railways in the Gobi area of Xinjiang, China. Atmos. Environ. 2015, 102, 344–354. [Google Scholar] [CrossRef]
  5. Bruno, L.; Horvat, M.; Raffaele, L. Windblown sand along railway infrastructures: A review of challenges and mitigation measures. J. Wind Eng. Ind. Aerodyn. 2018, 177, 340–365. [Google Scholar] [CrossRef]
  6. Kerr, R.; Nigra, J.O. Analysis of Aeolian Sand Control; Arabian American Oil Company: Dhahran, Saudi Arabia, 1951. [Google Scholar]
  7. Kerr, R.; Nigra, J.O. Eolian sand control. Bull. Am. Assoc. Pet. Geol. 1952, 36, 1541–1573. [Google Scholar]
  8. Alghamdi, A.A.A.; Al-Kahtani, N.S. Sand control measures and sand drift fences. J. Perform. Constr. Facil. 2005, 19, 295–299. [Google Scholar] [CrossRef]
  9. Wang, X.M.; Zhang, C.X.; Hasi, E.; Dong, Z.B. Has the Three Norths Forest Shelterbelt Program solved the desertification and dust storm problems in arid and semiarid China? J. Arid Environ. 2010, 74, 13–22. [Google Scholar] [CrossRef]
  10. Bofah, K.K.; Al-Hinai, K.G. Field tests of porous fences in the regime of sand-laden wind. J. Wind Eng. Ind. Aerodyn. 1986, 23, 309–319. [Google Scholar] [CrossRef]
  11. Zhang, M. Numerical Simulation of Wind-Blown-Sand Two Phase Flow Field around the Building Based on Fluent. Master’s Thesis, Harbin Institute of Technology, Harbin, China, December 2008. (In Chinese). [Google Scholar]
  12. Wang, Y.P.; Gong, Z.; Wang, Q.C. Solid-particle erosion of concrete bridge piers and protective material under blown sand environment. Bull. Chin. Ceram. Soc. 2015, 34, 1941–1946. [Google Scholar]
  13. Mejia, F.; Kleissl, J.; Bosch, J.L. The effect of dust on solar photovoltaic systems. Energy Procedia 2014, 49, 2370–2376. [Google Scholar] [CrossRef] [Green Version]
  14. Holze, C.; Brucks, A. Accelerated lifetime modeling on the basis of wind tunnel analysis and sand storm aging. Energy Procedia 2014, 49, 1692–1699. [Google Scholar] [CrossRef] [Green Version]
  15. Gong, B.; Wang, Z.; Wei, Z. Design wind and sandstorm loads on trough collectors in fields. In Proceedings of the SolarPACES: International Conference on Concentrating Solar Power & Chemical Energy Systems, Santiago, Chile, 26–29 September 2017. [Google Scholar]
  16. Ehrenberg, C.G. The sirocco dust that fell at Genoa on the 16th May 1846. Q. J. Geol. Soc. Lond. 1947, 3, 25–26. [Google Scholar]
  17. Bagnold, R.A. Journeys in the Libyan Desert 1929 and 1930. Geogr. J. 1931, 78, 13–39. [Google Scholar] [CrossRef]
  18. Bagnold, R.A. The movement of desert sand. Geogr. J. 1935, 85, 342–369. [Google Scholar] [CrossRef]
  19. Bagnold, R.A. The Size-Grading of Sand by Wind. Proc. R. Soc. A 1937, 163, 250–264. [Google Scholar]
  20. Bagnold, R.A. The Physics of Blown Sand and Desert Dunes; Methuen: London, UK, 1941; pp. 18–60. [Google Scholar]
  21. Pye, K.; Tsoar, H. Aeolian Sand and Sand Deposits; Unwin Hyman: London, UK, 1990; pp. 3–59. [Google Scholar]
  22. Lancaster, N. Geomorpholgy of Desert Dunes; Routledge: London, UK, 1995; pp. 15–38. [Google Scholar]
  23. Livingstone, I.; Warren, A. Aeolian Geomorphology: An Introduction; Addison Wesley Longman: Upper Saddle River, NJ, USA, 1996; pp. 1–25. [Google Scholar]
  24. Zhang, N.; Lee, S.J.; Chen, T.-G. Trajectories of saltating sand particles behind a porous fence. Geomorphology 2015, 228, 608–616. [Google Scholar] [CrossRef]
  25. Goossens, D.; Nolet, C.; Etyemezian, V.; Duarte-Campos, L.; Bakker, G.; Riksen, M. Field testing, comparison, and discussion of five aeolian sand transport measuring devices operating on different measuring principles. Aeolian Res. 2018, 32, 1–13. [Google Scholar] [CrossRef]
  26. He, J.Y.; He, Y.G.; Li, Q.S.; Chan, P.W.; Zhang, L.; Yang, H.L.; Li, L. Observational study of wind characteristics, wind speed and turbulence profiles during Super Typhoon Mangkhut. J. Wind Eng. Ind. Aerodyn. 2020, 206, 104362. [Google Scholar] [CrossRef]
  27. Wang, M.G.; Cao, S.Y.; Cao, J.X. Tornado-like-vortex-induced wind pressure on a low-rise building with opening in roof corner. J. Wind Eng. Ind. Aerodyn. 2020, 205, 104308. [Google Scholar] [CrossRef]
  28. Liu, J.Y.; Hui, Y.; Yang, Q.S.; Tamura, Y. Flow field investigation for aerodynamic effects of surface mounted ribs on square-sectioned high-rise buildings. J. Wind Eng. Ind. Aerodyn. 2021, 211, 104551. [Google Scholar] [CrossRef]
  29. Zhang, J.X.; Zhang, M.J.; Li, Y.L.; Jiang, F.Y.; Wu, L.H.; Guo, D.P. Comparison of wind characteristics in different directions of deep-cut gorges based on field measurements. J. Wind Eng. Ind. Aerodyn. 2021, 212, 104595. [Google Scholar] [CrossRef]
  30. Zobeck, T.M.; Scott, V.P.R. Wind induced dust generation and transport mechanics on a bare agriculture field. J. Hazard. Mater. 2006, 132, 26–38. [Google Scholar] [CrossRef] [PubMed]
  31. Shi, F.; Huang, N. Measurement and simulation of sand saltation movement under fluctuating wind in a natural field environment. Phys. A Stat. Mech. Appl. 2012, 391, 474–484. [Google Scholar] [CrossRef]
  32. Zhang, Z.C.; Dong, Z.B.; Zhao, A.G. The characteristics of aeolian sediment flux profiles in the south-eastern Tengger Desert. Sedimentology 2011, 58, 1884–1894. [Google Scholar] [CrossRef]
  33. Huang, B.; Li, Z.N.; Zhao, Z.F.; Wu, H.H.; Zhou, H.F.; Cong, S. Near-ground impurity-free wind and wind-driven sand of photovoltaic power stations in a desert area. J. Wind Eng. Ind. Aerodyn. 2018, 179, 483–502. [Google Scholar] [CrossRef]
  34. Dong, Z.B.; Liu, X.P.; Wang, H.T.; Zhao, A.G.; Wang, X.M. The flux profile of a blowing sand cloud: A wind tunnel investigation. Geomorphology 2002, 49, 219–230. [Google Scholar] [CrossRef]
  35. Liu, X.P.; Dong, Z.B.; Wang, X.M. Wind tunnel modeling and measurements of the flux of wind-blown sand. J. Arid Environ. 2006, 66, 657–672. [Google Scholar] [CrossRef]
  36. Ma, G.S.; Zheng, X.J. The fluctuation property of blown sand particles and the wind-sand flow evolution studied by numerical method. Eur. Phys. J. E 2011, 34, 54. [Google Scholar] [CrossRef]
  37. Hao, Y.H.; Feng, Y.J.; Fan, J.C. Experimental study into erosion damage mechanism of concrete materials in a wind-blown sand environment. Constr. Build. Mater. 2016, 111, 662–670. [Google Scholar] [CrossRef]
  38. Shi, Y.; Shi, Z.M. Ultrasonic surface treatment for improving wind-blown sand erosion resistance of cementitious materials. Wear 2020, 460–461, 203185. [Google Scholar] [CrossRef]
  39. Zou, X.-Y.; Wang, Z.-L.; Hao, Q.-Z.; Zhang, C.-L.; Liu, Y.-Z.; Dong, G.-R. The distribution of velocity and energy of saltating sand grains in a wind tunnel. Geomorphology 2001, 36, 155–165. [Google Scholar] [CrossRef]
  40. Dong, Z.B.; Wang, H.T.; Liu, X.P.; Wang, X.M. The blown sand flux over a sandy surface: A wind tunnel investigation on the fetch effect. Geomorphology 2004, 57, 117–127. [Google Scholar] [CrossRef]
  41. Zhang, K.; Zhao, P.W.; Zhao, J.C.; Zhang, X.X. Protective effect of multi-row HDPE board sand fences: A wind tunnel study. Int. Soil Water Conserv. Res. 2021, 9, 103–115. [Google Scholar] [CrossRef]
  42. Raffaele, L.; Bruno, L.; Fransos, D.; Pellerey, F. Incoming windblown sand drift to civil infrastructures: A probabilistic evaluation. J. Wind Eng. Ind. Aerodyn. 2017, 166, 37–47. [Google Scholar] [CrossRef] [Green Version]
  43. Dong, Z.B.; Liu, X.P.; Wang, X.M. Aerodynamic roughness of gravel surfaces. Geomorphology 2002, 43, 17–31. [Google Scholar] [CrossRef]
  44. Wang, X.S.; Zhang, C.L.; Huang, X.Q.; Shen, Y.P.; Zou, X.Y.; Li, J.; Cen, S.B. Wind tunnel tests of the dynamic processes that control wind erosion of a sand bed. Earth Surf. Process. Landf. 2019, 44, 614–623. [Google Scholar] [CrossRef]
  45. Miri, A.; Dragovich, D.; Dong, Z.B. Wind flow and sediment flux profiles for vegetated surfaces in a wind tunnel and field-scale windbreak. Catena 2021, 196, 104836. [Google Scholar] [CrossRef]
  46. Zhang, Z.C.; Dong, Z.B.; Wu, G.X. Field observations of sand transport over the crest of a transverse dune in northwestern China Tengger Desert. Soil Tillage Res. 2017, 166, 67–75. [Google Scholar] [CrossRef]
  47. Load Code for the Design of Building Structures; GB50009-2012; China Architecture & Building Press: Beijing, China, 2012.
  48. Architectural Institute of Japan. AIJ-2004 Recommendations for Loads on Buildings; AIJ: Tokyo, Japan, 2004. [Google Scholar]
  49. Eurocode 1: Actions on Structures: Part 1–4: General Actions: Wind Actions; EN1991-1-4; European Committee for Standardization: Brussels, Belgium, 2005.
  50. Dong, Z.B.; Liu, X.P.; Wang, H.T.; Wang, X.M. Aeolian sand transport: A wind tunnel model. Sediment. Geol. 2003, 161, 71–83. [Google Scholar] [CrossRef]
  51. Feng, D.J.; Ni, J.R.; Li, Z.S. Vertical Mass Flux Profiles of Different Grain Size Groups in Aeolian Sand Transport. Acta Geogr. Sin. 2007, 62, 1194–1203. [Google Scholar]
  52. Wu, Z. Wind-Sand Landform and Sand Control Engineering; Science Press: Beijing, China, 2003; pp. 315–352. [Google Scholar]
  53. Ni, J.R.; Li, Z.S. The Theory and Application of Wind-Blown Sand Flow; Science Press: Beijing, China, 2006; pp. 8–10. [Google Scholar]
  54. Zhang, P.; Sherman, D.J.; Li, B.L. Aeolian creep transport: A review. Aeolian Res. 2021, 51, 100711. [Google Scholar] [CrossRef]
  55. Williams, G. Some aspects of the eolian saltation load. Sedimentology 1964, 3, 257–287. [Google Scholar] [CrossRef]
Figure 1. Windblown sand tunnel test section and wind field layout.
Applsci 11 11349 g001
Figure 2. The sand sampler.
Applsci 11 11349 g002
Figure 3. The wind profiler.
Applsci 11 11349 g003
Figure 4. The observation site and the measuring system.
Applsci 11 11349 g004
Figure 5. Wind tunnel simulation: (a) Wind profiles; (b) Turbulence intensities.
Applsci 11 11349 g005aApplsci 11 11349 g005b
Figure 6. Movement form of sand particles in the windblown sand flow field.
Applsci 11 11349 g006
Figure 7. Cumulative mass percentage: (a) Coarse sand; (b) Fine sand; (c) Mixed sand.
Applsci 11 11349 g007aApplsci 11 11349 g007b
Figure 8. The relationship between Z90 and wind speed.
Applsci 11 11349 g008
Figure 9. The sand concentration: (a) At the indicated wind speed of 14.74 m/s; (b) At the indicated wind speed of 16.68 m/s; (c) At the indicated wind speed of 18.61 m/s.
Applsci 11 11349 g009aApplsci 11 11349 g009b
Figure 10. The wind profiles: (a) At the indicated wind speed of 14.74 m/s; (b) At the indicated wind speed of 16.68 m/s; (c) At the indicated wind speed of 18.61 m/s.
Applsci 11 11349 g010
Figure 11. The influence of particle movement on the wind speed: (a) At the indicated wind speed of 14.74 m/s; (b) At the indicated wind speed of 16.68 m/s; (c) At the indicated wind speed of 18.61 m/s.
Applsci 11 11349 g011aApplsci 11 11349 g011b
Figure 12. The turbulence intensity: (a) At the indicated wind speed of 14.74 m/s; (b) At the indicated wind speed of 16.68 m/s; (c) At the indicated wind speed of 18.61 m/s.
Applsci 11 11349 g012
Figure 13. The influence of particle movement on the turbulence intensity: (a) At the indicated wind speed of 14.74 m/s; (b) At the indicated wind speed of 16.68 m/s; (c) At the indicated wind speed of 18.61 m/s.
Applsci 11 11349 g013aApplsci 11 11349 g013b
Figure 14. The energy distribution: (a) At the indicated wind speed of 14.74 m/s; (b) At the indicated wind speed of 16.68 m/s; (c) At the indicated wind speed of 18.61 m/s.
Applsci 11 11349 g014aApplsci 11 11349 g014b
Figure 15. The impact pressure: (a) At the indicated wind speed of 14.74 m/s; (b) At the indicated wind speed of 16.68 m/s; (c) At the indicated wind speed of 18.61 m/s.
Applsci 11 11349 g015aApplsci 11 11349 g015b
Table 1. Some characteristic parameters of sand particle movement.
Particle SizeWind Speed (m/s)1Z90 (cm)2Fs (%)Mean Fs (%)
Coarse sand14.7412.20.81.0
16.6814.80.7
18.6116.21.6
Mixed sand14.7411.90.71.4
16.6814.51.6
18.6115.42.0
Fine sand14.7411.00.91.7
16.6813.21.8
18.6114.42.3
1Z90 is the height corresponding to the cumulative mass percentage of 90%; 2 Fs is the suspension percentage within the height of 0.3–0.6 m.
Table 2. The regression coefficients of the sand transport rate and sand concentration.
Particle SizeWind Speed (m/s)ρs (In This Study)q (In This Study)q (Dong et al., 2002)
a1/bR2A1/BA1/B
Coarse sand14.746.80816.390.98940.02000.16390.01510.0305
16.6816.23215.040.99810.05350.15040.05010.0351
18.6127.59513.270.99720.10200.13270.07840.0362
Mixed sand14.7423.94413.840.98040.07330.13840.11670.0632
16.6841.60711.740.97830.13840.11740.18960.0598
18.6166.32811.330.99120.24280.11330.27400.0588
Fine sand14.7416.11213.500.94980.04950.13500.50090.1742
16.6831.18212.360.95420.10570.12360.86530.1706
18.6144.63710.960.95440.16680.10961.20670.1499
Fitted function: { q = A exp ( z / B ) ρ s = a exp ( z / b ) ; 1/b or 1/B is the relative decay rate; R2 is the correlation coefficient at 0.05 significance level.
Table 3. The correlation between the kinetic energy of sand particles and height.
Particle SizeWind Speed (m/s)mnR2
Coarse sand14.740.0311.190.96
16.680.1511.200.99
18.610.4210.800.99
Fine sand14.740.1610.480.99
16.680.389.310.98
18.610.8110.220.99
Mixed sand14.740.209.870.99
16.680.469.040.98
18.610.958.730.99
Fitted function: E k = m exp ( n z ) ; R2 is the correlation coefficient at 0.05 significance level.
Table 4. The correlation between the impact pressure of sand particles and height.
Particle SizeWind Speed (m/s)αβR2
Coarse sand14.740.4411.390.94
16.682.5014.280.96
18.614.3910.940.99
Fine sand14.741.8311.310.99
16.683.909.300.99
18.617.7310.260.99
Mixed sand14.742.4811.180.99
16.685.029.090.99
18.619.438.780.99
Fitted function: P s = α exp ( β z ) ; R2 is the correlation coefficient at 0.05 significance level.
Publisher’s Note: MDPI stays neutral with regard to jurisdictional claims in published maps and institutional affiliations.

