Article

Enhancement of PV Panel Power Production by Passive Cooling Using Heat Sinks with Perforated Fins

by
Sebastian Valeriu Hudișteanu
*,
Florin Emilian Țurcanu
*,
Nelu Cristian Cherecheș
*,
Cătălin George Popovici
,
Marina Verdeș
and
Iuliana Huditeanu
Faculty of Civil Engineering and Building Services, Gheorghe Asachi Technical University of Iasi, 700050 Iași, Romania
*
Authors to whom correspondence should be addressed.
Appl. Sci. 2021, 11(23), 11323; https://doi.org/10.3390/app112311323
Submission received: 16 November 2021 / Revised: 23 November 2021 / Accepted: 24 November 2021 / Published: 30 November 2021
(This article belongs to the Special Issue Urban Sustainability and Resilience of the Built Environments)

Abstract

:
This paper presents a numerical model regarding the passive cooling of PV panels through perforated and non-perforated heat sinks. A typical PV panel was studied in a fixed position, tilted at 45 degrees from the horizontal with the wind direction towards its backside. A challenging approach was used in order to calibrate the base case of the numerical model according to the NOCT conditions. Further validation of the accuracy of the numerical simulation consisted of a comparison between the results obtained for the base case, or heat sink, with horizontal non-perforated fins and the experiments presented in the literature. Six types of heat sink attached to the backside of the PV panel were numerically studied. The analyzed configurations focused on heat sinks with both perforated and non-perforated fins that were distributed horizontally and vertically. The CFD simulation was also conducted by modeling the air volume around the PV panel in real wind conditions. The main output parameters were the average temperature and the convective heat transfer coefficient on the front and back of the PV panel. The most important effect of cooling was achieved in low wind conditions and high levels of solar radiation. For vair = 1 m/s, G = 1000 W/m2 and ambient temperature tair = 35 °C, the percentage of maximum power production achieved 83.33% for the base case, while in the best cooling scenario it reached 88.74%, assuring a rise in the power production of 6.49%.

1. Introduction

The current global energy context is characterized by the energy consumption of humanity, which has reached impressive values in recent years. Thus, in the current year (2021) the well-known Overshoot Day was “celebrated” on 29 July. This meant that humanity had already used up all of the restorable resources of 2021. From 30 July we started consuming more resources than the planet could regenerate in a year [1]. Therefore, by the end of the year 2021, the energy consumption is projected to reach about 1.73× Earth’s resource regeneration capacity. It is a global emergency and every small step in reducing this tendency to over consume energy will become decisive in this fight.
Solar energy is a clean and sustainable source of energy. It is involved directly or indirectly in the vast majority of other renewable energy sources, and it is also related to the conventional fuels—as most of them are the result of photosynthesis. The solar energy incident on the Earth could cover the annual energy demand for the entire world in only 1.5 h [2,3].
Regarding the conversion of solar radiation into electricity, this can be achieved by using photovoltaic (PV) cells or it can be generated through solar thermal technologies [1].
Photovoltaic conversion has important advantages: the energy source is renewable and free, and the processes of electricity production are environmentally friendly (in terms of CO2 and NOx emissions, waste, noise etc.). The generation of electricity is achieved without the use of moving parts, so the cost of maintenance is reduced. Furthermore, the energy produced is consumed locally, which results in reduced power losses.
By implementing efficient PV systems, the safety of the users of the electricity supply is increased [4,5]. These systems also reduce the vulnerability of European space and could eliminate future energy crises or the lack of an energy supply. Considering the long service life and the low CO2 emissions of PV systems, they represent a sustainable alternative to electricity production. In addition, the energy market in Europe, which lately has been affected by internal and external factors, could become more stable and competitive by increasing the power it produces and the number of users of photovoltaic systems [6].
The main environmental parameters, which are influencing the efficiency and the lifetime of PV panels are solar radiation, wind velocity and direction, dust, ambient temperature and their operating temperature. Most of these meteorological parameters are random and uncontrollable. From the point of view of the installation methods, the tilt angle, orientation and positioning are very difficult to manage in the case of typical PV systems [7,8]. However, the management of the operating temperature of PV cells has been demonstrated to be a good solution for enhancing their efficiency [9].
Almost 80% of the solar energy incident on the PV panel’s surface is converted into heat, and it is well known that the performance of PV panels is temperature-dependent [9,10]. Skoplaki, E. et al. [10] analyzed different methods and relations for calculating the dependence between conversion efficiency and photovoltaic cell temperature; a linear dependence between efficiency and temperature has been proved. The decrease in the efficiency of the produced power related to the increase in the temperature has values between −0.46–−0.50%/°C and −0.47–−0.50%/°C, respectively [11,12,13].
Taking into account that the power of a photovoltaic cell is influenced by the temperature and radiation levels, standard test condition (STC) parameters were defined: tPV = 25 °C, G = 1000 W/m2, AM1.5 [14]. In STCs the PV panels produce the watt peak power [Wp], but a real concern is that in regular operation, at 1000 W/m2, the photovoltaic panels can reach extreme temperatures of 70–80 °C [11,15,16], leading to a significant decrease in the efficiency.
Complementary cooling solutions are recommended in order to achieve high productivity [17,18,19,20,21]. The literature presents a large number of papers on different solutions for improving the conversion efficiency by decreasing the temperature of the photovoltaic panels [13,15,20,22,23,24,25,26,27].
Concepts frequently used in analyzing PV systems are the NOCT (nominal operating cell temperature) conditions. In contrast to STCs, the NOCT conditions are closer to reality, taking into account the following operating conditions: tilt of PV panel = 45°; G = 800 W/m2; tair = 20 °C; vair = 1 m/s towards the backside of PV panel [15]. According to these conditions, every producer must supply, via the data sheet, the average operating temperature of the PV panel—tNOCT.
The aim of this study was to overcome technological and conceptual barriers that were currently attributed implicitly to photovoltaic systems by improving their efficiency during months with maximum energy production but lower efficiencies due to high operating temperatures. For example, in hot summer days it turned out that the most important cause of the production potential not being reached, when the intensity of solar radiation had the highest values of the year, was the uncontrolled increase in the operating temperatures of the photovoltaic panels.
The improvement in the efficiency of PV panels when air-cooled heat sinks were used, was reasonable for the residential sector, urban areas and power plants [28,29].
The novelty of the present study consisted of analyzing the impact of longitudinal and transversal heat sinks with perforated and non-perforated fins on the performance of PV panels. The impact was analyzed using more realistic wind conditions and tilt of the panel, compared to existing studies in the literature.

2. Related Research

Experimental tests and numerical analyses on monocrystalline or polycrystalline photovoltaic panels show that the decrease in efficiency, as the operating temperature increases, and the necessity of cooling solutions are current concerns in the literature [11,12,13,16,30,31].
Different technologies to improve the efficiency of photovoltaic panels by passive cooling, using air, are studied in the literature [8,13,32,33,34,35,36,37,38,39]. Detailed studies on air cooling of photovoltaic panels are carried out in the following works [11,40]. Air cooling with heat sinks and perforated fins is studied both numerically [11,32] and experimentally [34]. The characteristic values for multiple photovoltaic panels cooled with aluminum and copper heat sinks were compared through experimental tests under different conditions [34]. The results of the simulation and from the experiment showed that the heat sink with perforated fins can significantly reduce the temperature of the panel and increase its performance; there was an increase in the heat extracted from the photovoltaic cell and a decrease in its temperature, with values between 7 °C and 10 °C [34].
Also, numerical simulations on a particular case of backside ventilation [11,16,41] revealed that the temperature was reduced by 10 °C below the value obtained in the base case. This aspect was favorable for conversion efficiency, determining a generation of approximately 90% of the maximum power produced in STCs [14], while the average power production of PV panels was about 70–80% of Pmp in STCs [42].

3. Materials and Methods

3.1. Problem Description

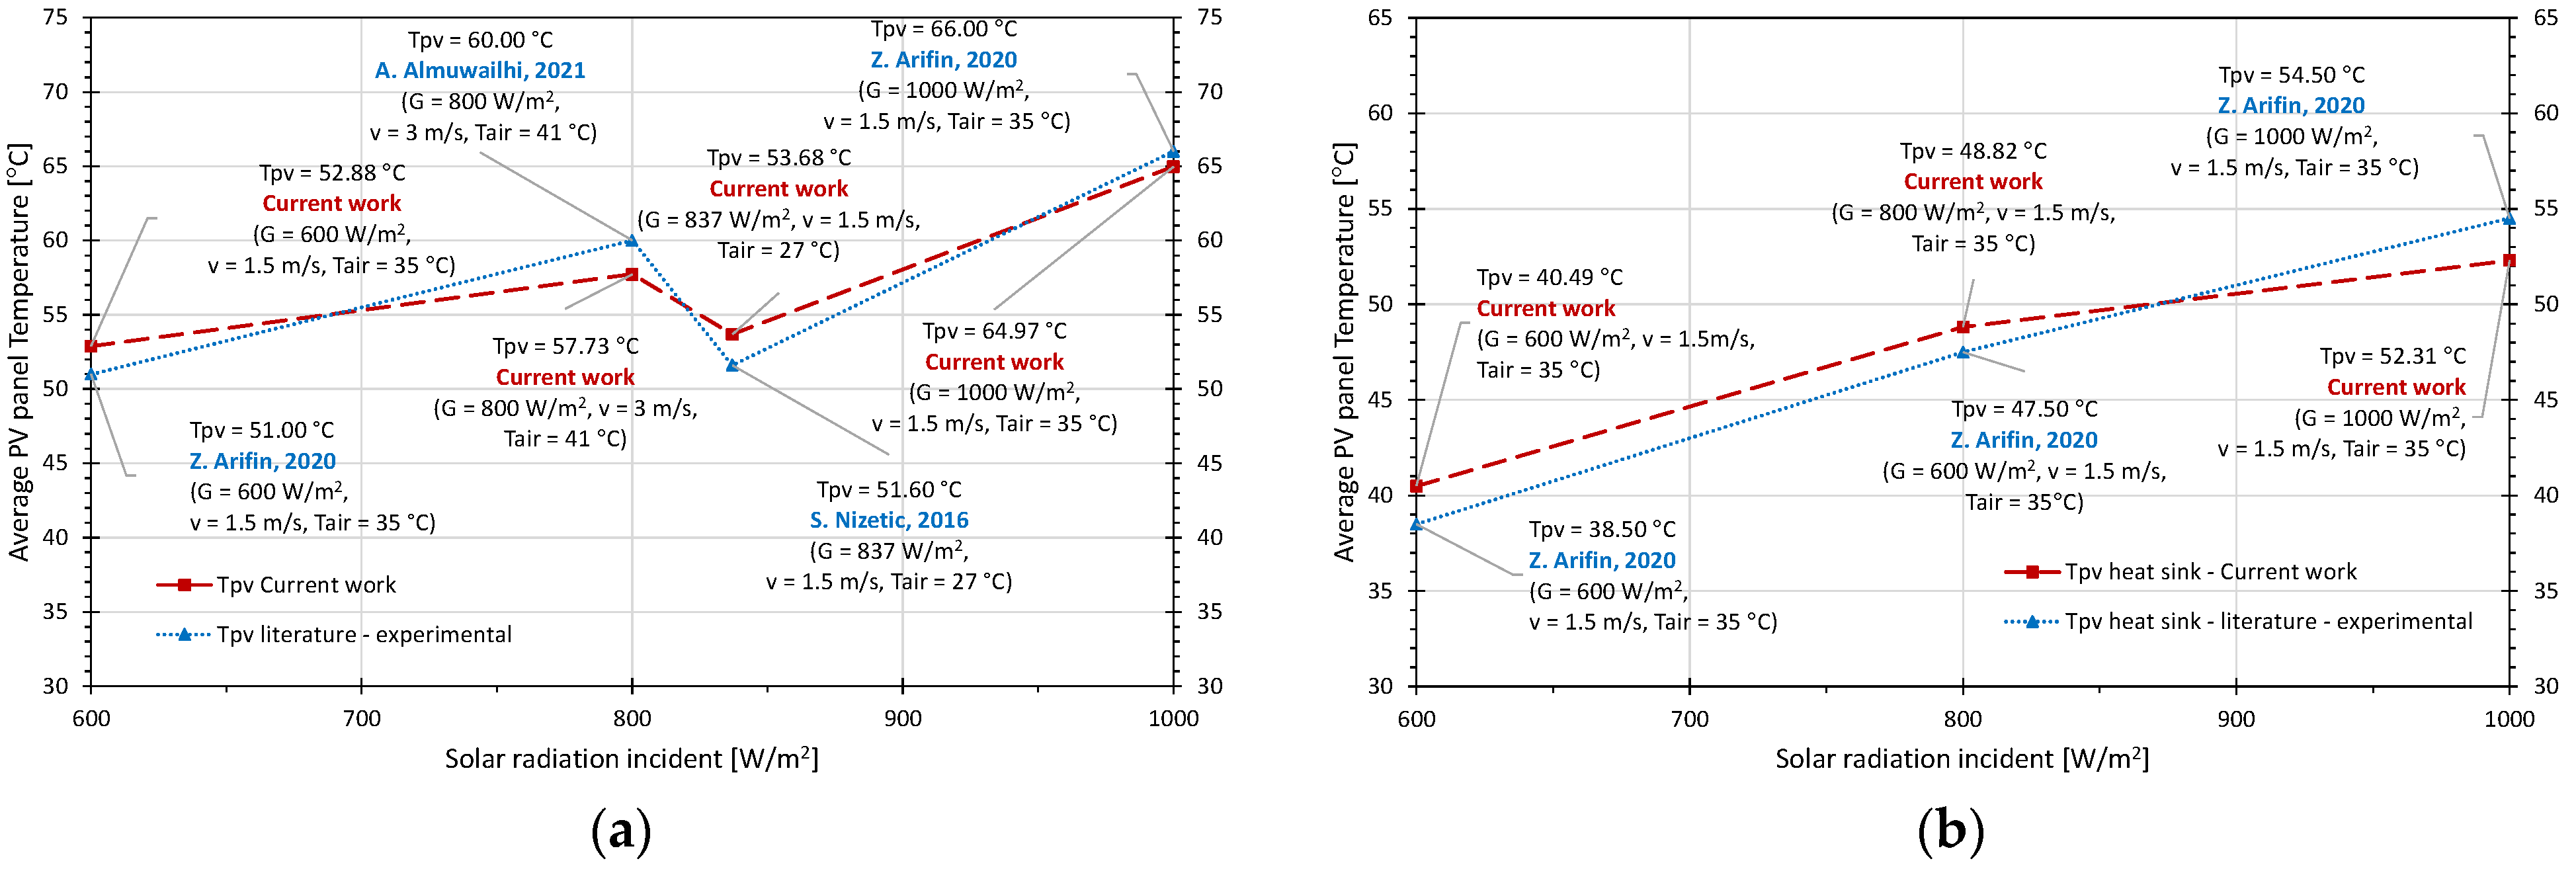
The goal of this work was to develop a numerical model regarding the passive cooling of the PV panels, through perforated and non-perforated heat sinks, and determine the enhancement of operating temperatures compared to the base case (without cooling). A photovoltaic panel with an area of approximately S = 1.6 m2 was studied in a fixed position and tilted at 45° from horizontal, as well as in variable solar radiation, wind velocity and ambient temperature. This setup, together with the wind direction towards the backside of the PV panel, was established according to NOCT conditions [14] in order to validate the model.
A common monocrystalline Si-based PV panel (AE Solar AE320HM6-60), with an advantageous position of the junction box, was analyzed with the following technical data (Table 1) [43].
A step-by-step analysis of heat sink usage for cooling PV panels was conducted. After the initial validation of the base case—PV panel without heat sink—a total of six photovoltaic panels with attached heat sinks were analyzed. Two of them were non-perforated, while the other four had perforated fins.
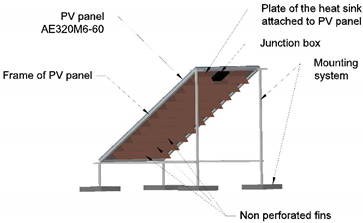
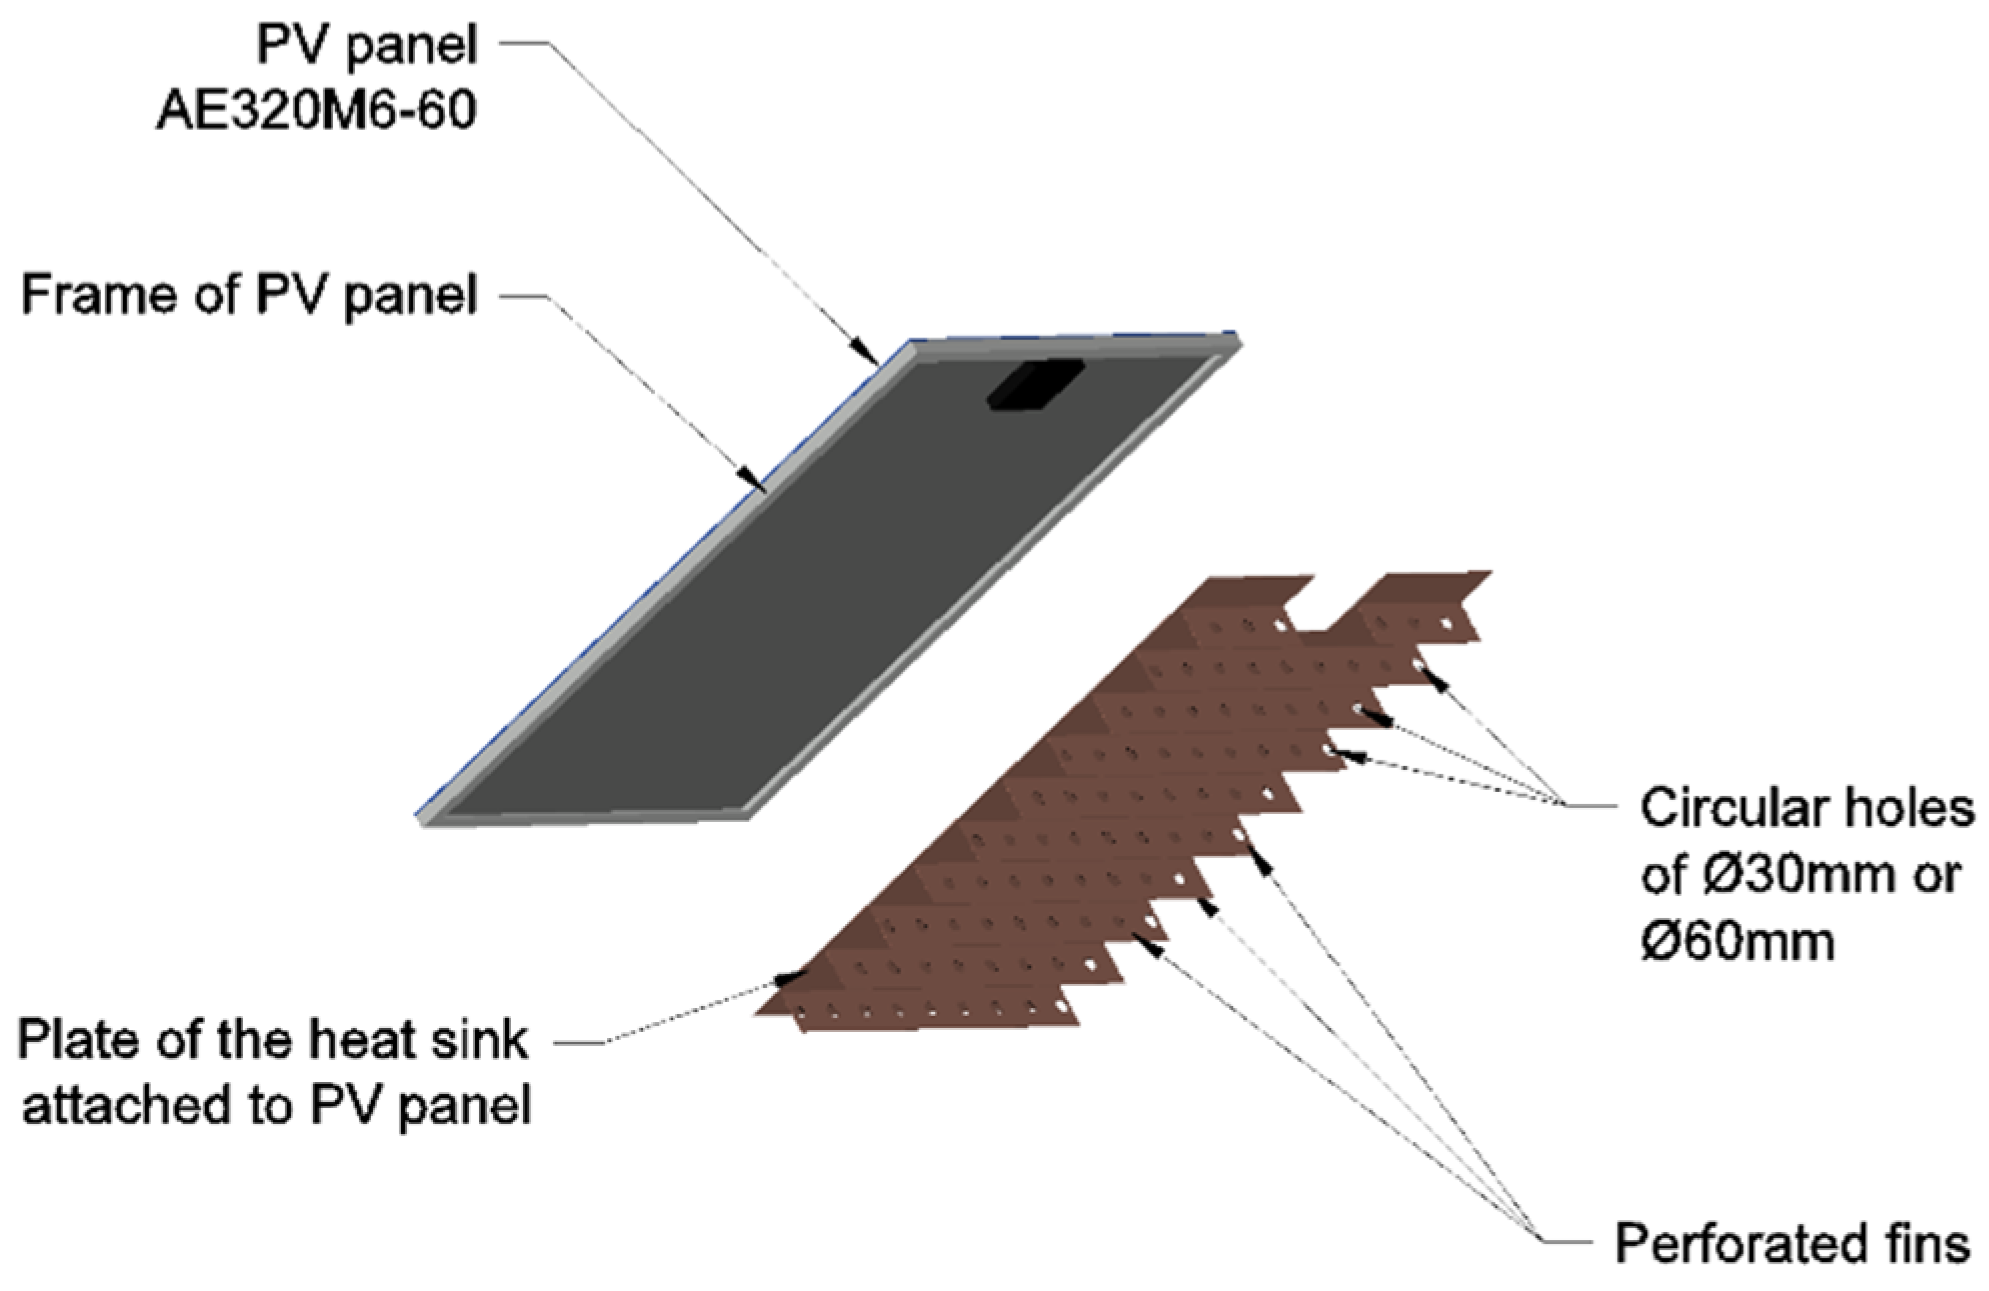
The heat sink consisted of a metal plate with copper attached to the photovoltaic panel and perforated or non-perforated metal fins, Figure 1. The role of the designed holes on the fins was assumed to be both quantitative (by reducing the amount of material necessary for device construction) and qualitative (by amplifying the turbulence and heat transfer in the immediate vicinity of the PV panel).
Due to preliminary analysis and the literature review [11,32,34,41], the 30 mm and 60 mm diameter circular perforations distributed on a single row turned out to be feasible. It emerged that other shapes, dimensions or multiple rows of perforations were heading towards lower performance of the heat sink (the operating temperatures were at least 2–3 °C higher). It must be specified that the literature comprises a diversity of heat sinks with different approaches of fins [42,44]. The present study is focused on using heat sinks with continuous fins.
Two types of heat sinks were analyzed:
Type 1—heat sinks with horizontal (transversal) fins of 100 mm height (with 3 subtypes: non-perforated, Φ = 30 mm perforations, Φ = 60 mm perforations);
Type 2—heat sinks with vertical (longitudinal) fins of 100 mm height (with 3 subtypes: non-perforated, Φ = 30 mm perforations, Φ = 60 mm perforations).

3.2. Numerical Simulation

The numerical simulation was performed using the ANSYS-Fluent 2021-R1 software. The geometry and discretization of the computing domain was performed within the platform using the Fluent-Meshing and SpaceClaim programs.
For simulation the control volume method, SIMPLE pressure–velocity coupling and second-order accuracy for equation solving were used, taking into account that the flow was not aligned with the mesh [45]. This method used a relationship between velocity and pressure corrections to enforce mass conservation and to obtain the pressure field. A fully implicit numerical scheme was employed, in which upwind differences were used for the convective terms and central differences for the diffusion terms [11]. The calculation was iterative, with a convergence criteria of 10−6 for the energy equation and 10−3 for the pressure, velocities, k, ε and continuity equations.
The simulation of solar radiation was realized using the Solar Ray Tracing model of the Fluent program. The absorption of solar radiation by the front of the PV panel was imposed as a global coefficient α = 0.7, taking into account all the layers of the PV panel [11,46].
The heat transfer balance was set in order to include the convection and radiation with the surroundings [46]. The numerical simulation was realized using the k–ε realizable model [45]. For all studied configurations, the distance between fins was set to 150 mm. The fins were perpendicular to the heat sink plate—Figure 1. For the case of perforated fins, they had circular holes of 30 mm or 60 mm diameter, which were placed at a distance of 100 mm to one to another [34]. Their role was to improve the air circulation near the heat sink and to extract more heat from the PV panel.
The accuracy and the solution time were both highly depend on the characteristic of the mesh. Computational fluid dynamics (CFDs) solvers depended on the highly orthogonal mesh that could be difficult to achieve on different types of geometries. For the present study, a polyhedral mesh was used for the surfaces and a poly-hex core for one of the volumes. The choice of these types of cells was made due to an increase in speed of simulation from 20 to 50% while maintaining the high level of accuracy. In addition, this approach in the simulation opened up the possibility of improving the solver speed and accuracy compared with the tetrahedral cells.
The mesh was realized with different refinements for the heat sink and air volume. The mesh quality achieved for the numerical analysis was as follows:
-
Aspect ratio was in the range 5–60;
-
Skewness was in the range 0.4–0.7;
-
Orthogonal quality was in the range 0.1–0.3.
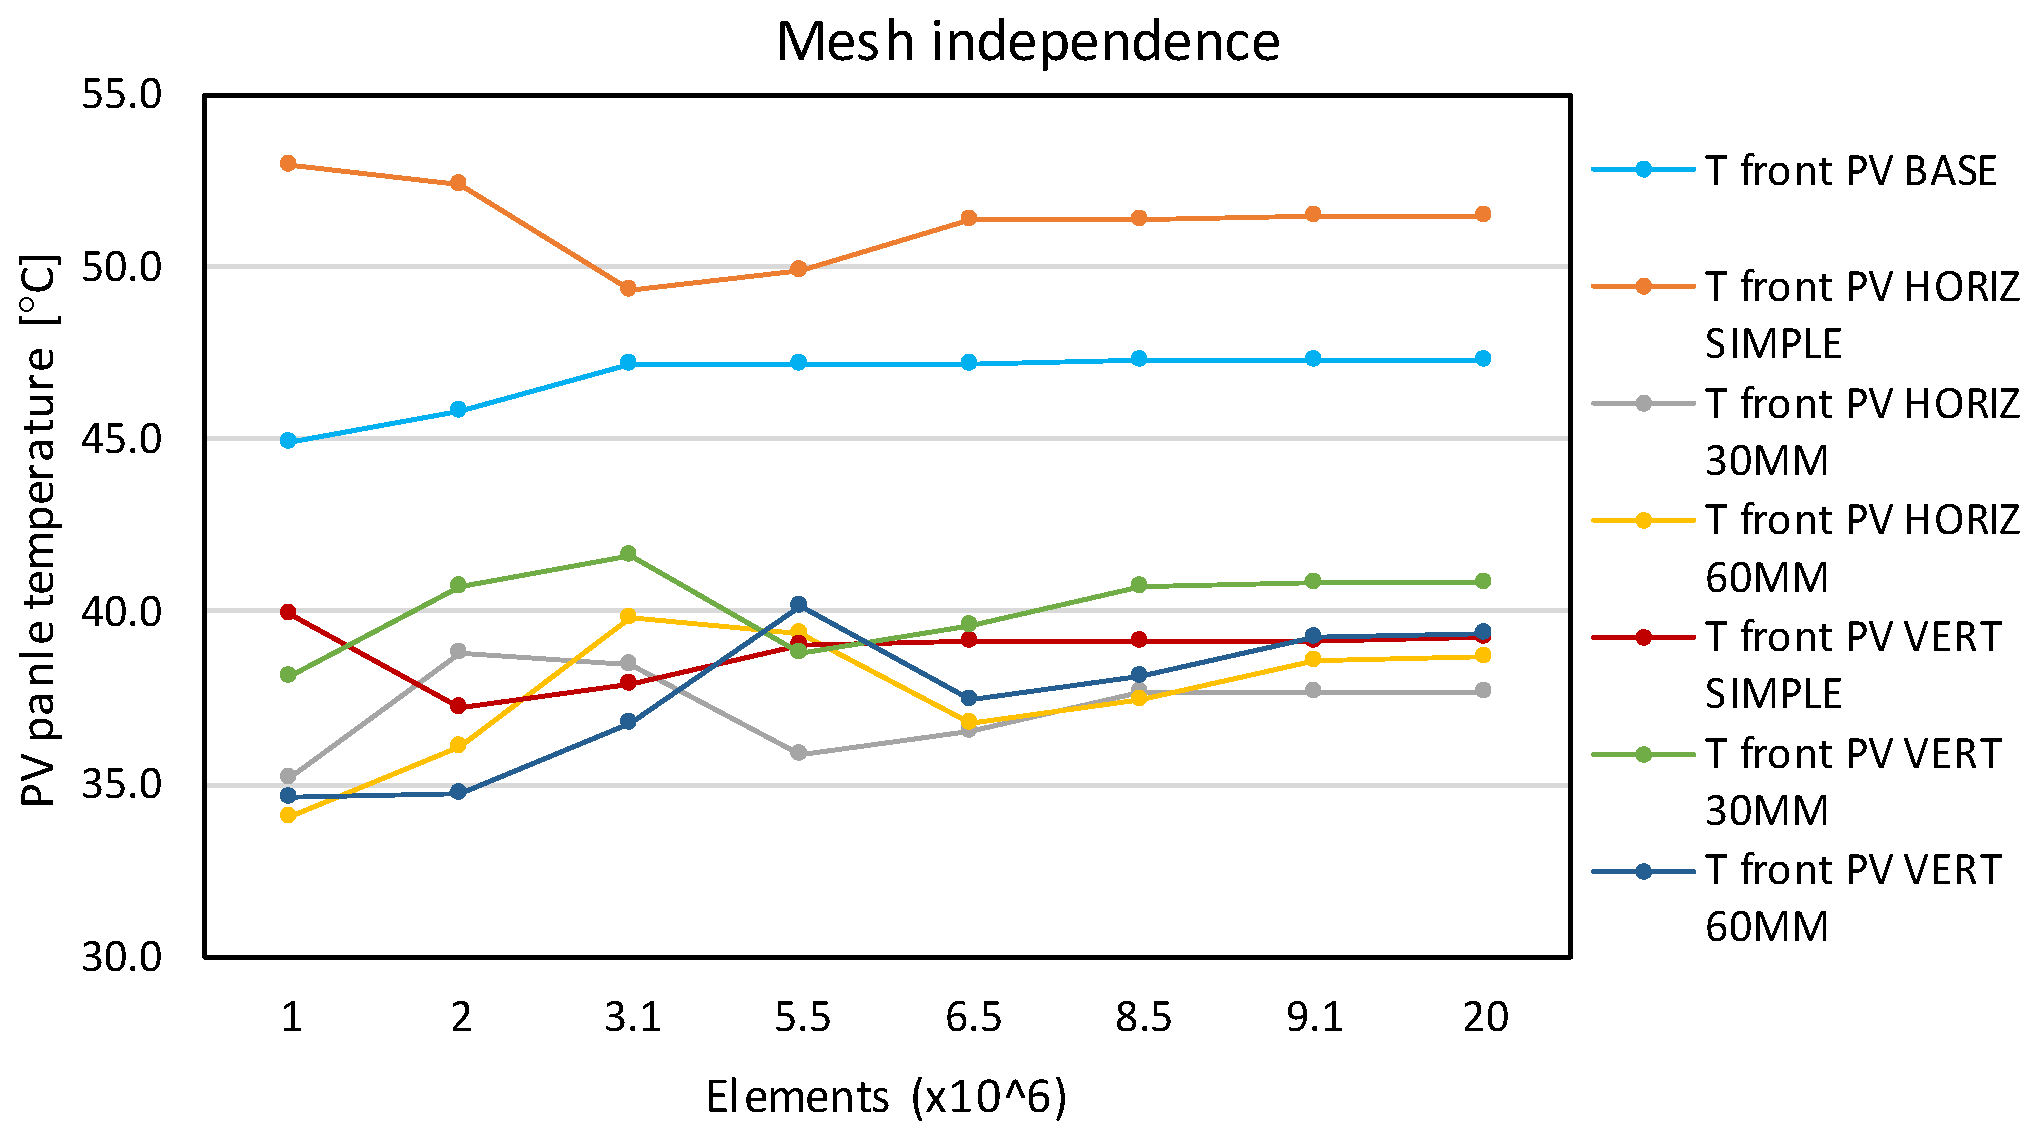
A mesh independence study was carried out, taking into account the large number of elements that resulted due to modeling the air volume that flowed over the PV panel and heat sinks. Figure 2 presents the mesh independence study, which was achieved for approximately 3 million cells in the base case and over 5.5 million cells for cases with heat sinks and perforated fins.
The numerical analysis was conducted on a workstation that had 48 cores, 256 GB of RAM and a graphical computing video card Nvidia Quadro P6000.
Typical approaches from the literature considered the position of the PV panel as either horizontal [31] or vertical [11,34], with a channel simulating the wind behind the PV panel. There were only a few studies on cooling tilted PV panels [16,40].
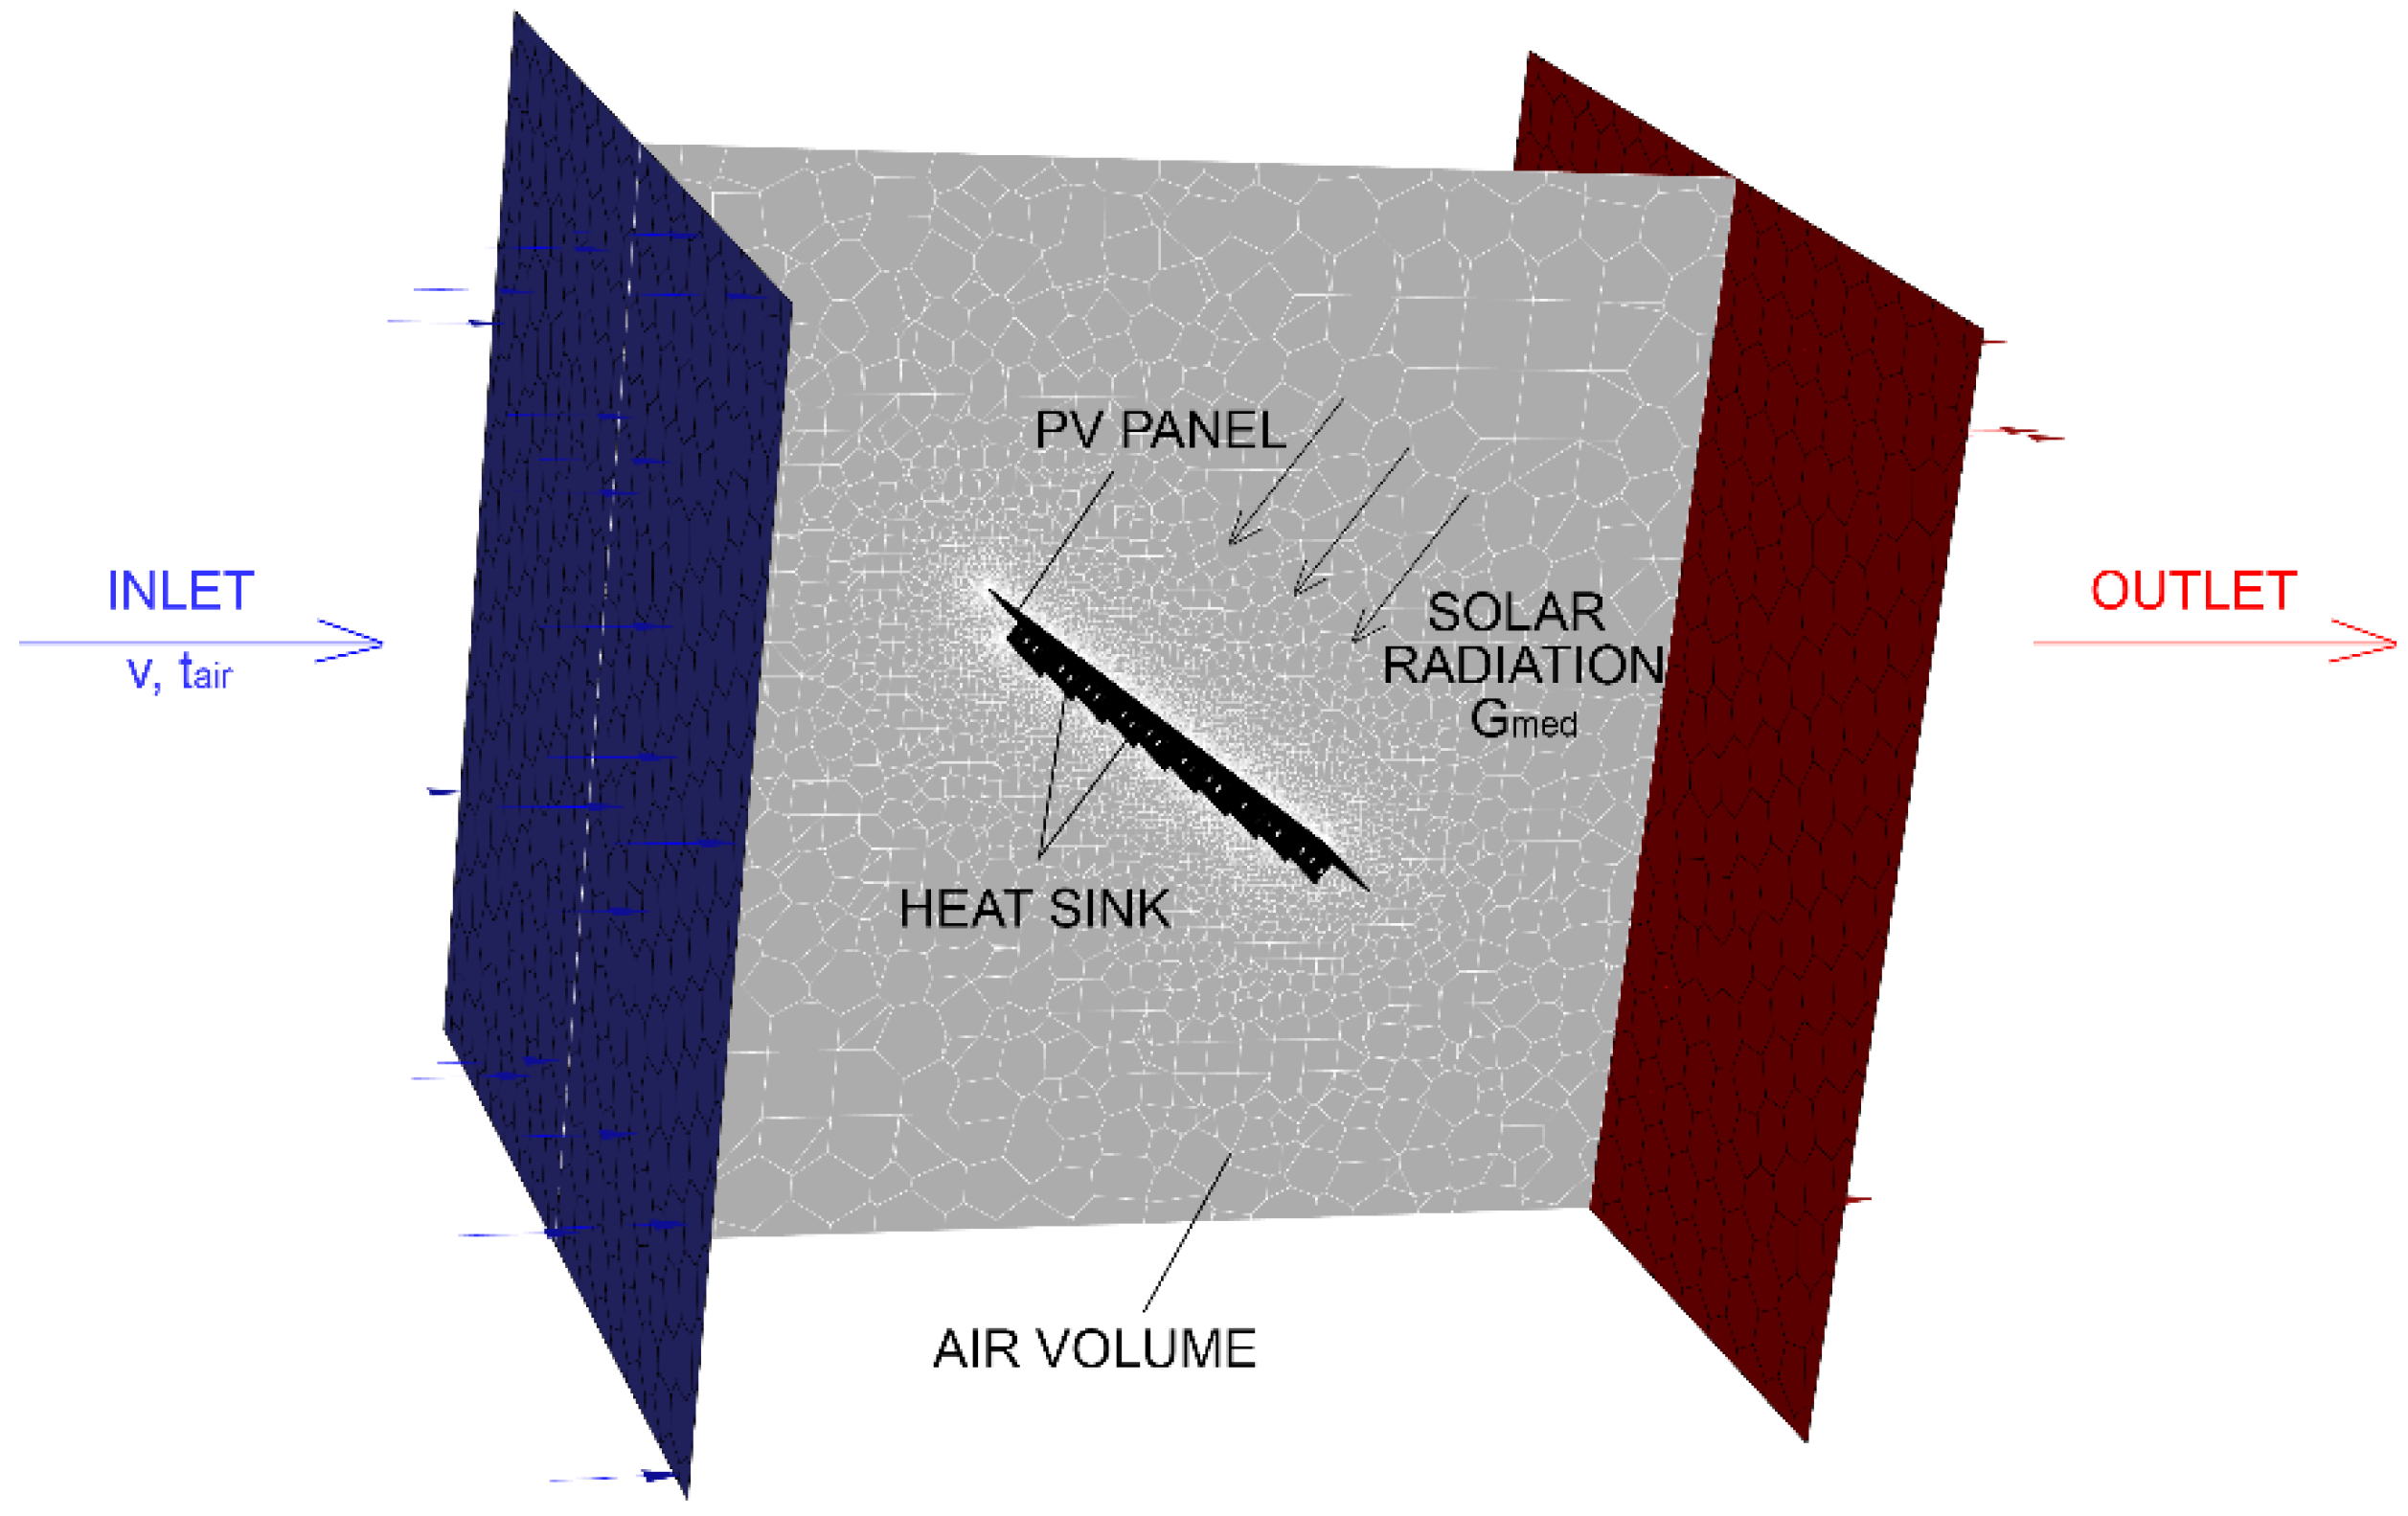
During this study the modelling was realized by taking into account the air circulation in the vicinity of a tilted PV panel cooled with heat sinks. In this way, by using an optimized resource consumer mesh, the airflow and the heat transfer were more realistic and easier to visualize and understand. The material properties used in the simulations are shown in Table 2, and the sketch of the model is presented in Figure 3.
During the study, the non-perforated heat sinks were compared with perforated heat sinks in order to determine the optimum configuration for implementation in NOCT conditions of wind.
Simulations were realized in steady state conditions with the following input parameters:
-
ambient temperature, tair = 20, 25, 30 and 35 °C;
-
velocity of the air towards the back of the photovoltaic panel, vair = 1–5 m/s;
-
the normal component of solar radiation varied between 200–1000 W/m2, assuming the typical conditions of operation for the PV panel.
It should be mentioned that heat sinks were studied on some of the worst scenarios of temperature operation for the base case. Therefore, some cases with low levels of solar radiation, low ambient temperatures or high wind velocities were excluded from the results presented during the paper.
The main outputs of the simulations were:
-
average temperature of the PV panel;
-
convective heat transfer coefficients, achieved for both the front and the back of the PV panel or heat sink.

Studied Cases

A total of six configurations of heat sinks were analyzed, plus the base case, these are shown in Table 3.
The position of the PV panel and air circulation was set according to NOCT conditions: the PV panel was tilted at 45° and wind direction toward the backside of the PV panel (Figure 4 and Figure 5).
Heat sinks consist of a metal plate and perforated or non-perforated longitudinal or transversal fins arranged at equal distances of 150 mm from each other (Table 4). Both the base plate and the fins were made of copper. The base plate was in direct contact with the back of the photovoltaic panel. The fins had circular perforations with a diameter of 30 or 60 mm (Table 4).
During the study, the fins were arranged longitudinally (vertically—parallel to the length of the PV panel) or transversally (horizontally—parallel to the width of the PV panel). The distance between fins was s = 150 mm, while their height was hfins = 100 mm.
The approximate length of the fins was Lfins = 1520 mm (for longitudinal ones) and Lfins = 860 mm (for transversal ones). The number of fins was 11 for the horizontal case and 5 for vertical case (Table 4).
The perforations had a circular shape and a diameter of Φ = 30 mm or Φ = 60 mm. The distance measured on the fins between the centers of the perforations was d = 100 mm. The perforations were staggered by 50 mm between two successive fins.
The back, side, top and bottom view of the heat sinks attached to the PV panel are presented in Table 4. In addition, the main components of the geometry conceptions of the photovoltaic panel, mounting system and heat sinks with perforated and non-perforated fins were easy to follow in 3D perspective views.

4. Validation of the Model

4.1. NOCT Calibration

The PV panel tilted at 45° was initially exposed to a direct solar radiation of 800 W/m2, air temperature of 20 °C and wind velocity of 1 m/s from behind, similar to the NOCT conditions. According to the PV panel data sheet [43], in this scenario, the tNOCT should be 45 ± 2 °C, while the operating temperature from simulation was 47.16 °C. Taking into account the good matching between results and expectation, further validation was conducted. Therefore, by comparing the results from modelling with those obtained by using the acknowledged Equation (1) [14,47], the following variation of the operating temperature was obtained (Figure 6).
t P V = t a i r + t N O C T 20 800 · G
The results showed that the values computed using the current work differed from those of Equation (1) within the range of 0.28–1.98%.

4.2. Base Case Validation

Nizetic et al. [16] experimentally studied the thermal performance of PV panels on different inclination angles. In Case 1 of their study (45° tilt, v = 1.5 m/s, G = 837 W/m2) the average temperature of the PV panel was 51.6 °C. For validation, the base case of the present work was set for the same parameters. The average temperature of the PV panel obtained in the current model was 53.68 °C, which represented a variation of 3.87%.
Also, experimental studies of Arifin et al. in 2020 [34], and Almuwailhi in 2021 [48], were examined and the correlations with the present work were presented together in Figure 7a.

4.3. Heat Sink Validation

An experimental study on heat sinks attached to a PV panel [34] were used in order to compare the results with the present model (Figure 7b).
A reasonable variation of the simulated PV panel average temperature compared to the literature for low and high ambient temperatures was recorded, in addition to different levels of radiation (Figure 7). The differences recorded were between −5.18% and +4.03%. According to the literature [49], this variation was acceptable so the study was considered consistent and the next step consisted of modelling the heat sinks with perforated fins (Cases 2–6) in the same conditions as those validated above.

5. Results and Discussion

Most simulations in the literature were realized by imposing a constant convective heat transfer coefficient (hc), which determined a quasi-uniform temperature distribution [50]. In the present work, the simulation of the airflow near the PV panel determined a more realistic temperature distribution on its surface compared with the typical approaches [42], while the convective heat transfer coefficient was varying on the PV panel’s surface.
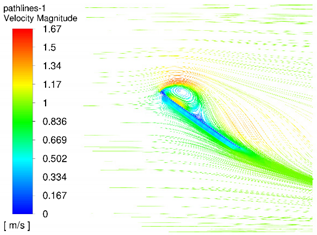
The results of the simulations consisted of the photovoltaic panel temperature and convective heat transfer coefficient variation, depending on the type of the heat sink. The spectra of the operating temperatures of the PV panels and velocity path lines on the cross-sectional plane were obtained (Table 5). The following images present the qualitative visualization of the results for cases simulated in NOCT configuration: tair = 20 °C, vair = 1 m/s, G = 800 W/m2 (Table 5).
The visual results clarify the temperature distribution achieved for each case analyzed, together with the air velocity field on the cross-sectional plane. The effect of the heat sinks was determining a decrease in maximum operating temperature of approximately 10 °C. In addition, from a qualitative point of view, for this particular wind direction (towards the backside of the PV panel), the air turbulence was increased compared to the base case, determining an improved heat transfer and a better cooling of the PV panel. In addition, each type of heat sink determined a slightly different distribution of wind velocities and recirculation areas. It can be remarked that the cooling effect was decreased in the zones with air recirculation in front of the PV panel compared to the rest of the area.
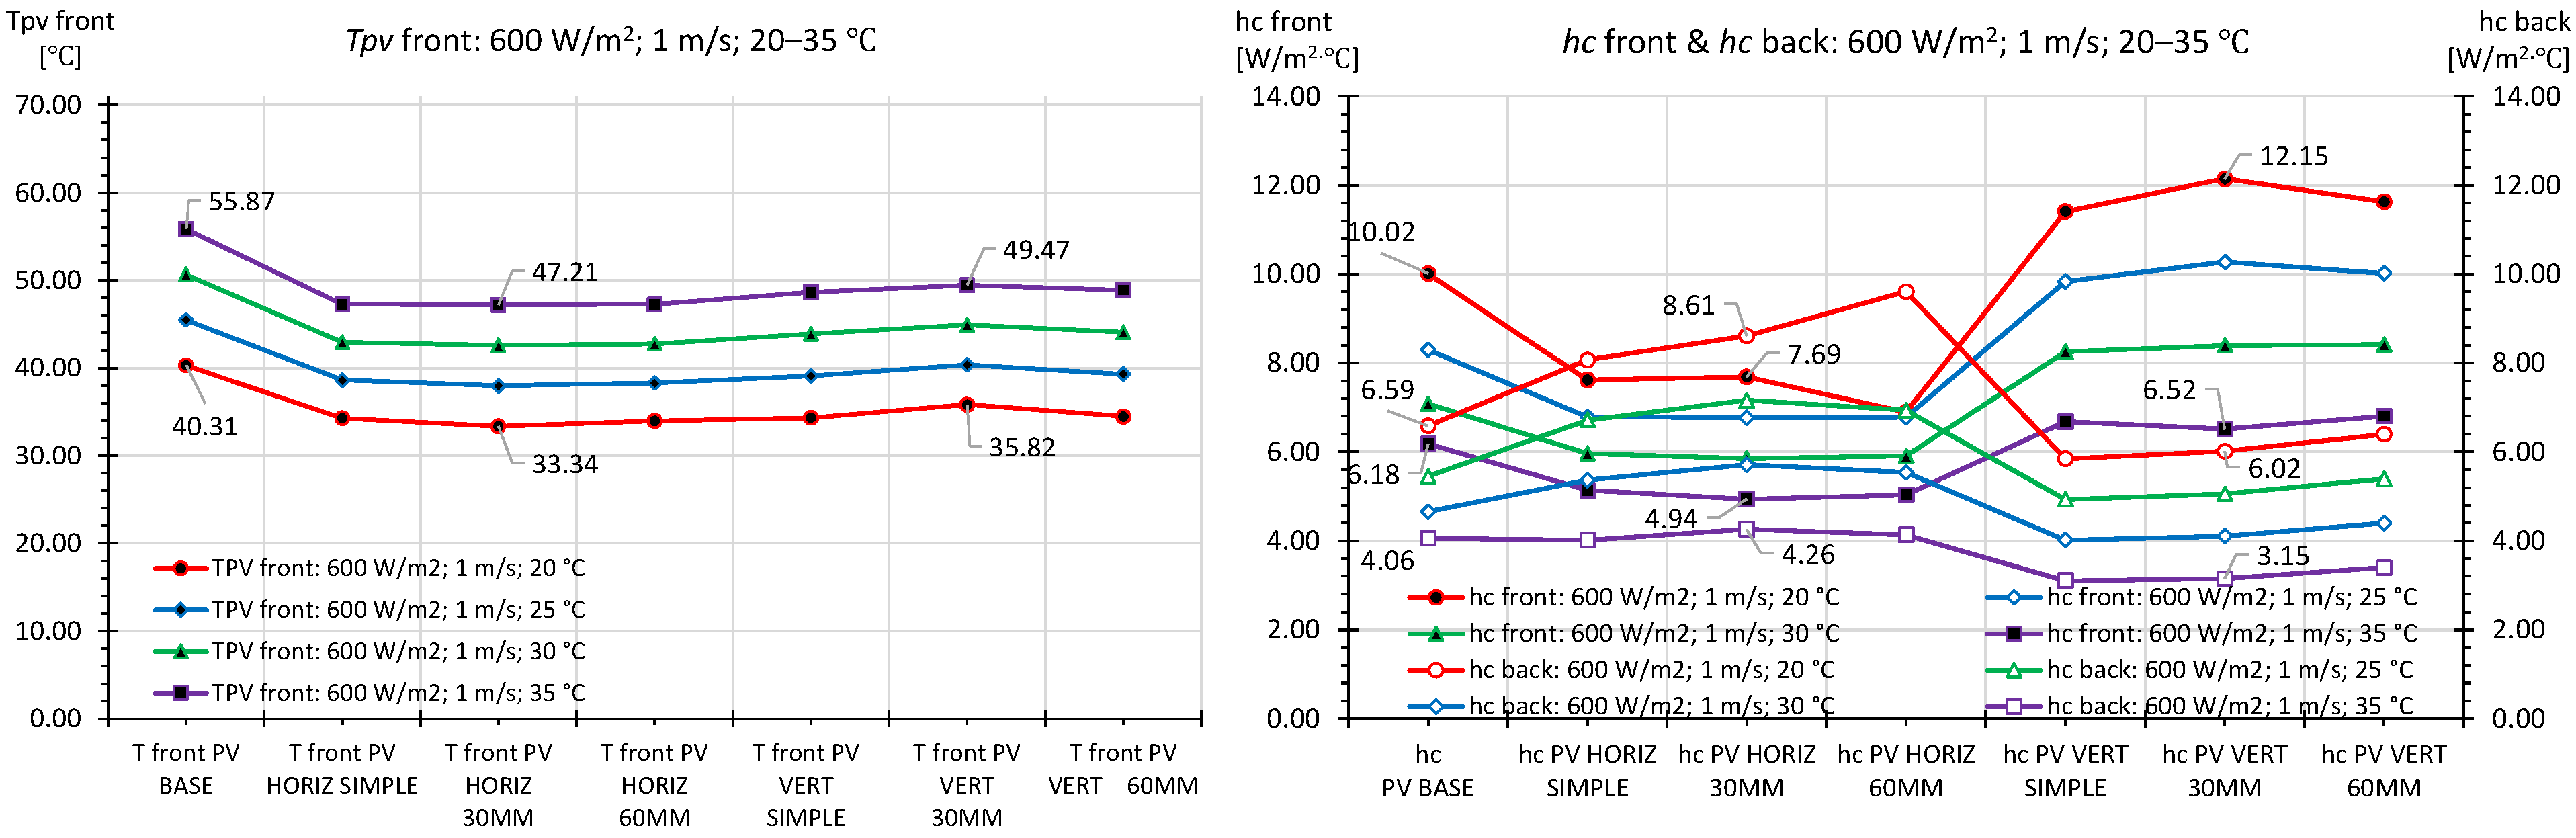
The results for vair = 1 m/s, various inlet temperatures (tair = 20–35 °C) and solar radiation (G = 600–1000 W/m2) were merged in the following plots: Figure 8, Figure 9 and Figure 10.
An interesting aspect was recorded on convective heat transfer coefficients. Therefore, for horizontal heat sinks the hc on the front of the PV panel were much closer to the hc on the back, compared to vertical ones, where an important difference was recorded. The ambient temperature variation did not seem to change the best configuration (Case 2—horizontal 30 mm). This configuration determined a drop of temperature as presented in Table 6.
The results showed that for the studied wind conditions, the perforations did not improve the temperature of the PV panel when the fins were vertical. In addition, in the case of vertical fins, the larger perforations (Φ = 60 mm) were better, while for the horizontal fins the smaller ones (Φ = 30 mm) were better.
In terms of efficiency and power production, according to the assumption that the efficiency dropped linearly with the rise in temperature of −0.37%/°C [43], the following power production could be achieved—Table 7.
The power production was calculated as the percentage of maximum power possible, by assuming that at 25 °C the ratio achieved was 100% (320 Wp in STCs). From here on, we considered that the rise of temperature determined a drop in power production for each degree over tSTC = 25 °C, according to the PV panel’s data sheet [43].
The most important effect of air cooling heat sinks was achieved in low wind conditions and high levels of solar radiation. It could be observed, Table 7, that for vair = 1 m/s, G = 1000 W/m2 and ambient temperature tair = 35 °C, the percentage of maximum power production achieved was 83.33% for the base case, while the best cooling scenario (Case 3—horizontal 30 mm) could reach 88.74%. This meant a rise in power production of 6.49% compared to the base case.
For the position of the PV panel and wind direction studied in the paper, the best solution of heat sink for various conditions was the following: Case 3—Horizontal 30 mm. For this type of heat sink, the enhancement of power production was also reached for higher wind velocities (2–5 m/s), but with lower impact: from 3.60–4.97%, compared to the base case.
When lower ambient temperatures were involved, the effect of the heat sinks was decreased, this was due to inferior operating temperatures of the PV panel that were reached for base case. Therefore, the improvement of the power production reached values in the range 3.31–4.99%.

6. Conclusions

The goal of this manuscript was to develop and use a numerical model regarding the passive cooling of PV panels through perforated and non-perforated heat sinks. The PV panel was studied in a fixed position and tilted at 45 degrees from the horizontal, with the wind direction towards its backside. The input parameters, such as solar radiation, ambient temperature and wind velocity, were varied during the study. A challenging approach was used in order to calibrate the base case of the numerical model according to the NOCT parameters of the studied PV panel. A second validation of the accuracy of the numerical simulation consisted of comparison between the results obtained for the case of the heat sink with horizontal non-perforated fins and the experiments presented in the literature. Six types of heat sinks attached to the backside of the PV panel were numerically studied. The analyzed configurations focused on heat sinks with both perforated and non-perforated fins that were distributed horizontally and vertically. The CFD simulation was also conducted by modeling the air volume around the PV panel in real wind conditions. The main output parameters were the average temperature and the convective heat transfer coefficient on the front and back of the PV panel. In the best scenario, the perforated heat sink could assure a rise of the photovoltaic panel power production of 6.49%, compared to the base case.

Author Contributions

Conceptualization, S.V.H., F.E.Ț. and N.C.C.; methodology, S.V.H., F.E.Ț. and N.C.C.; software, S.V.H. and F.E.Ț.; validation, S.V.H., F.E.Ț., N.C.C. and I.H.; formal analysis, S.V.H. and I.H.; investigation, S.V.H., F.E.Ț., N.C.C., C.G.P., M.V. and I.H.; resources, S.V.H., F.E.Ț. and C.G.P.; data curation, S.V.H., F.E.Ț. and I.H.; writing—original draft preparation, S.V.H., F.E.Ț., N.C.C., C.G.P., M.V. and I.H.; writing—review and editing, S.V.H., F.E.Ț., N.C.C., C.G.P., M.V. and I.H.; visualization, S.V.H. and I.H.; supervision, S.V.H. and M.V.; project administration, S.V.H.; funding acquisition, S.V.H. All authors have read and agreed to the published version of the manuscript.

Funding

This work was supported by a grant of the Romanian Ministry of Education and Research, CCCDI-UEFISCDI, project number PN-III-P2-2.1-PED-2019-1294, within PNCDI III.

Institutional Review Board Statement

Not applicable.

Informed Consent Statement

Not applicable.

Data Availability Statement

Not applicable.

Acknowledgments

We would like to acknowledge the invaluable support provided by the FCI-TUIASI infrastructure in writing this article.

Conflicts of Interest

The authors declare no conflict of interest.

Nomenclature

STCStandard test conditions
NOCTNominal operating cell temperature
AMAir mass
tPVCell temperature [°C]
GSolar irradiance [W/m2]
tairAmbient temperature [°C]
vairWind speed towards backside of PV panel [m/s]
tNOCTCell temperature in NOCT conditions [°C]
tSTCCell temperature in STC conditions [°C]
PmpMaximum power produced [Wp]
VmpVoltage at Pmp [V]
ImpCurrent at Pmp [A]
VocOpen circuit voltage [V]
IscShort-circuit current [A]
ηPV panel efficiency [%]
βPmp temperature coefficient [%/°C]
LLength of PV panel [m]
lWidth of PV panel [m]
hThickness of PV panel [m]
gThickness of the layers composing the PV panel [m]
λThermal conductivity of the layers composing the PV panel [W/m·K]
ρDensity of the layers composing the PV panel [kg/m3]
cpSpecific heat of the layers composing the PV panel [J/kg·K]
sDistance between the fins of PV panel [m]
LfinsLength of the fins [m]
hfinsHeight of the fins [m]
ΦDiameter of the perforations of the fins [m]
dDistance between the centers of the perforations [m]
hc,frontConvective heat transfer coefficient on the front of PV panel [W/m2·K]
hc,backConvective heat transfer coefficient on the back of PV panel [W/m2·K]

References

  1. 100 Days of Possibility. Available online: https://www.overshootday.org (accessed on 15 November 2021).
  2. AlAmri, F.; AlZohbi, G.; AlZahrani, M.; Aboulebdah, M. Analytical Modeling and Optimization of a Heat Sink Design for Passive Cooling of Solar PV Panel. Sustainability 2021, 13, 3490. [Google Scholar] [CrossRef]
  3. Taylor, M.; Ralon, P.; Ilas, A. The Power to Change: Solar and Wind Cost Reduction Potential to 2025. 2016. Available online: https://www.irena.org/publications/2016/Jun/The-Power-to-Change-Solar-and-Wind-Cost-Reduction-Potential-to-2025 (accessed on 15 November 2021).
  4. Kuznetsov, P.; Yuferev, L.; Voronin, D.; Panchenko, V.A.; Jasiński, M.; Najafi, A.; Leonowicz, Z.; Bolshev, V.; Martirano, L. Methods Improving Energy Efficiency of Photovoltaic Systems Operating under Partial Shading. Appl. Sci. 2021, 11, 10696. [Google Scholar] [CrossRef]
  5. Colarossi, D.; Principi, P. Indoor and Outdoor Performance of an Enhanced Photovoltaic Panel through Graphene/Fins/Phase Change Materials. Appl. Sci. 2021, 11, 8807. [Google Scholar] [CrossRef]
  6. Why Europe’s Energy Prices Are Soaring and Could Get Much Worse. Available online: https://www.euronews.com/2021/10/28/why-europe-s-energy-prices-are-soaring-and-could-get-much-worse (accessed on 15 November 2021).
  7. Kamuyu, W.C.L.; Lim, J.R.; Won, C.S.; Ahn, H.K. Prediction Model of Photovoltaic Module Temperature for Power Performance of Floating PVs. Energies 2018, 11, 447. [Google Scholar] [CrossRef] [Green Version]
  8. Idoko, L.; Anaya-Lara, O.; McDonald, A. Enhancing PV modules efficiency and power output using multi-concept cooling technique. Energy Rep. 2018, 4, 357–369. [Google Scholar] [CrossRef]
  9. Dubey, S.; Sarvaiya, J.N.; Seshadri, B. Temperature Dependent Photovoltaic (PV) Efficiency and Its Effect on PV Production in the World—A Review. Energy Procedia 2013, 33, 311–321. [Google Scholar] [CrossRef] [Green Version]
  10. Skoplaki, E.; Palyvos, J.A. On the temperature dependence of photovoltaic module electrical performance: A review of efficiency/power correlations. Sol. Energy 2009, 83, 614–624. [Google Scholar] [CrossRef]
  11. Popovici, C.G.; Hudisteanu, S.V.; Mateescu, T.D.; Chereches, N.C. Efficiency improvement of photovoltaic panels by using air cooled heat sinks. Energy Procedia 2016, 85, 425–432. [Google Scholar] [CrossRef] [Green Version]
  12. Berthod, C.; Strandberg, R.; Odden, J.O. Temperature coefficients of compensated silicon solar cells—Influence of ingot position and blend-in-ratio. Energy Procedia 2015, 77, 15–20. [Google Scholar] [CrossRef] [Green Version]
  13. Hernandez-Perez, J.G.; Carrillo, J.G.; Bassam, A.; Flota-Banuelos, M.; Patino-Lopez, L.D. A new passive PV heatsink design to reduce efficiency losses: A computational and experimental evaluation. Renew. Energy 2020, 147, 1209–1220. [Google Scholar] [CrossRef]
  14. Photovoltaic (PV) module performance testing and energy rating—Part 1: Irradiance and temperature performance measurements and power rating. In International Standard; IEC 61853-1; International Electrotechnical Commission: Geneva, Switzerland, 2011.
  15. Gomaa, M.R.; Hammad, W.; Al-Dhaifallah, M.; Rezk, H. Performance enhancement of grid-tied PV system through proposed design cooling techniques: An experimental study and comparative analysis. Sol. Energy 2020, 211, 1110–1127. [Google Scholar] [CrossRef]
  16. Nizetic, S.; Grubisic-Cabo, F.; Marinic-Kragic, I.; Papadopoulos, A.M. Experimental and numerical investigation of a backside convective cooling mechanism on photovoltaic panels. Energy 2016, 111, 211–225. [Google Scholar] [CrossRef]
  17. Haidar, Z.A.; Orfi, J.; Kaneesamkandi, Z. Experimental investigation of evaporative cooling for enhancing photovoltaic panels efficiency. Results Phys. 2018, 11, 690–697. [Google Scholar] [CrossRef]
  18. Herrando, M.; Pantaleo, A.M.; Wang, K.; Markides, C.N. Solar combined cooling, heating and power systems based on hybrid PVT, PV or solar-thermal collectors for building applications. Renew. Energy 2019, 143, 637–647. [Google Scholar] [CrossRef]
  19. Ibrahim, A.; Fudholi, A.; Sopian, K.; Othman, M.Y.; Ruslan, M.H. Efficiencies and improvement potential of building integrated photovoltaic thermal (BIPVT) system. Energy Convers. Manag. 2014, 77, 527–534. [Google Scholar] [CrossRef]
  20. Lamnatou, C.; Notton, G.; Chemisana, D.; Cristofari, C. Storage systems for building-integrated photovoltaic (BIPV) and building-integrated photovoltaic/thermal (BIPVT) installations: Environmental profile and other aspects. Sci. Total Environ. 2020, 699, 134269. [Google Scholar] [CrossRef]
  21. Albatayneh, A.; Jaradat, M.; Al-Omary, M.; Zaquot, M. Evaluation of Coupling PV and Air Conditioning vs. Solar Cooling Systems—Case Study from Jordan. Appl. Sci. 2021, 11, 511. [Google Scholar] [CrossRef]
  22. Hudișteanu, S.V.; Popovici, C.G. Numerical analysis of the efficiency and energy production of the building integrated photovoltaics for various configurations. In Proceedings of the CLIMA 2019 Congress, E3S Web of Conf., Bucharest, Romania, 26–29 May 2019; Volume 111, p. 03044. [Google Scholar]
  23. Hudișteanu, S.V.; Popovici, C.G. Experimental investigation of the wind direction influence on the cooling of photovoltaic panels integrated in double skin façades. In Proceedings of the CLIMA 2019 Congress, E3S Web of Conf., Bucharest, Romania, 26–29 May 2019; Volume 111, p. 03045. [Google Scholar]
  24. Bahaidarah, H.M.S. Experimental performance evaluation and modeling of jet impingement cooling for thermal management of photovoltaics. Sol. Energy 2016, 135, 605–617. [Google Scholar] [CrossRef]
  25. Bai, A.; Popp, J.; Balogh, P.; Gabnai, Z.; Palyi, B.; Farkas, I.; Pinter, G.; Zsiboracs, H. Technical and economic effects of cooling of monocrystalline photovoltaic modules under Hungarian conditions. Renew. Sustain. Energy Rev. 2016, 60, 1086–1099. [Google Scholar] [CrossRef] [Green Version]
  26. Ebrahimi, M.; Rahimi, M.; Rahimi, A. An experimental study on using natural vaporization for cooling of a photovoltaic solar cell. Int. Commun. Heat Mass Transf. 2015, 65, 22–30. [Google Scholar] [CrossRef]
  27. Eicker, U.; Pietruschka, D.; Schmitt, A.; Haag, M. Comparison of photovoltaic and solar thermal cooling systems for office buildings in different climates. Sol. Energy 2015, 118, 243–255. [Google Scholar] [CrossRef]
  28. Aelenei, L.; Pereira, R.; Ferreira, A.; Goncalves, H.; Joyce, A. Building Integrated Photovoltaic System with integral thermal storage: A case study. Energy Procedia 2014, 58, 172–178. [Google Scholar] [CrossRef] [Green Version]
  29. Hammami, M.; Torretti, S.; Grimaccia, F.; Grandi, G. Thermal and Performance Analysis of a Photovoltaic Module with an Integrated Energy Storage System. Appl. Sci. 2017, 7, 1107. [Google Scholar] [CrossRef] [Green Version]
  30. Bevilacqua, P.; Perrella, S.; Cirone, D.; Bruno, R.; Arcuri, N. Efficiency Improvement of Photovoltaic Modules via Back Surface Cooling. Energies 2021, 14, 895. [Google Scholar] [CrossRef]
  31. Arifin, Z.; Tjahjana, D.; Hadi, S.; Rachmanto, R.A.; Setyohandoko, G.; Sutanto, B. Numerical and Experimental Investigation of Air Cooling for Photovoltaic Panels Using Aluminum Heat Sinks. Int. J. Photoenergy 2020, 2020, 1574274. [Google Scholar] [CrossRef]
  32. Hudișteanu, S.V.; Mateescu, T.D.; Chereches, N.C.; Popovici, C.G. Numerical study of air cooling photovoltaic panels using heat sinks. Rom. J. Civ. Eng. 2015, 6, 11–20. [Google Scholar]
  33. Fatoni, E.K.A.; Taqwa, A.; Kusumanto, R.; Polytechn Sriwijaya, P.S.S.I. Solar Panel Performance Improvement using Heatsink Fan as the Cooling Effect. In Proceedings of the 2nd Forum in Research, Science, and Technology (FIRST), Palembang, Indonesia, 30–31 October 2018. [Google Scholar]
  34. Arifin, Z.; Suyitno, S.; Tjahjana, D.; Juwana, W.E.; Putra, M.R.A.; Prabowo, A.R. The Effect of Heat Sink Properties on Solar Cell Cooling Systems. Appl. Sci. 2020, 10, 7919. [Google Scholar] [CrossRef]
  35. Fahad, A.-A.; Taher, S.M.; Omar, F.A.-A.; Sajid, A.; Sadaqat, A.; Ijlal, S.A.; Richu, Z.; Tarek, S.K. Innovative technique for achieving uniform temperatures across solar panels using heat pipes and liquid immersion cooling in the harsh climate in the Kingdom of Saudi Arabia. Alex. Eng. J. 2021, 61, 1413–1424. [Google Scholar] [CrossRef]
  36. Duan, J. A novel heat sink for cooling concentrator photovoltaic system using PCM-porous system. Appl. Therm. Eng. 2021, 186, 116522. [Google Scholar] [CrossRef]
  37. Bayrak, F.; Oztop, H.F.; Selimefendigil, F. Effects of different fin parameters on temperature and efficiency for cooling of photovoltaic panels under natural convection. Sol. Energy 2019, 188, 484–494. [Google Scholar] [CrossRef]
  38. Johnston, E.; Szabo, P.S.B.; Bennett, N.S. Cooling silicon photovoltaic cells using finned heat sinks and the effect of inclination angle. Therm. Sci. Eng. Prog. 2021, 23, 100902. [Google Scholar] [CrossRef]
  39. Mojumder, J.C.; Chong, W.T.; Ong, H.C.; Leong, K.Y.; Abdullah Al, M. An experimental investigation on performance analysis of air type photovoltaic thermal collector system integrated with cooling fins design. Energy Build. 2016, 130, 272–285. [Google Scholar] [CrossRef]
  40. Amr, A.A.R.; Hassan, A.A.M.; Abdel-Salam, M.; El-Sayed, A.M. Enhancement of photovoltaic system performance via passive cooling: Theory versus experiment. Renew. Energy 2019, 140, 88–103. [Google Scholar] [CrossRef]
  41. Vittorini, D.; Cipollone, R. Fin-cooled photovoltaic module modeling—Performances mapping and electric efficiency assessment under real operating conditions. Energy 2019, 167, 159–167. [Google Scholar] [CrossRef]
  42. Pérez Escobar, B.L.; Pérez Hernández, G.; Ocampo Ramírez, A.; Rojas Blanco, L.; Díaz Flores, L.L.; Vidal Asencio, I.; Hernández Perez, J.G.; Ramírez Morales, E. Analysis of Thermomechanical Stresses of a Photovoltaic Panel Using a Passive System of Cooling. Appl. Sci. 2021, 11, 9806. [Google Scholar] [CrossRef]
  43. Available online: https://ae-solar.com/wp-content/uploads/2018/10/AE_Eclipse-Ultra-Black_HM6-60_310W-320W.pdf (accessed on 15 November 2021).
  44. Nizetic, S.; Papadopoulos, A.M.; Giama, E. Comprehensive analysis and general economic-environmental evaluation of cooling techniques for photovoltaic panels, Part I: Passive cooling techniques. Energy Convers. Manag. 2017, 149, 334–354. [Google Scholar] [CrossRef]
  45. Ansys Fluent Documentation, 2021-R1. Available online: https://www.ansys.com/products/fluids/ansys-fluent (accessed on 15 November 2021).
  46. El Fouas, C.; Hajji, B.; Gagliano, A.; Tina, G.M.; Aneli, S. Numerical model and experimental validation of the electrical and thermal performances of photovoltaic/thermal plant. Energy Convers. Manag. 2020, 220, 112939. [Google Scholar] [CrossRef]
  47. Nguyen, D.P.N.; Neyts, K.; Lauwaert, J. Proposed Models to Improve Predicting the Operating Temperature of Different Photovoltaic Module Technologies under Various Climatic Conditions. Appl. Sci. 2021, 11, 7064. [Google Scholar] [CrossRef]
  48. Almuwailhi, A.; Zeitoun, O. Investigating the cooling of solar photovoltaic modules under the conditions of Riyadh. J. King Saud Univ.-Eng. Sci. 2021, 186, 116522. [Google Scholar] [CrossRef]
  49. Mattar, S.J.; Kavian Nezhad, M.R.; Versteege, M.; Lange, C.F.; Fleck, B.A. Validation Process for Rooftop Wind Regime CFD Model in Complex Urban Environment Using an Experimental Measurement Campaign. Energies 2021, 14, 2497. [Google Scholar] [CrossRef]
  50. Alizadeh, H.; Nazari, M.A.; Ghasempour, R.; Shafii, M.B.; Akbarzadeh, A. Numerical analysis of photovoltaic solar panel cooling by a flat plate closed-loop pulsating heat pipe. Sol. Energy 2020, 206, 455–463. [Google Scholar] [CrossRef]
Figure 1. Overview of the components of the heat sink attached to the PV panel for cooling (case with perforated fins).
Applsci 11 11323 g001
Figure 2. Mesh independence study for each model.
Applsci 11 11323 g002
Figure 3. Main components of the numerical model.
Applsci 11 11323 g003
Figure 4. Position of the PV panel (fixed, tilted at 45°): (a) top view; (b) side view.
Applsci 11 11323 g004
Figure 5. Base case—PV panel without cooling—3D perspective view.
Applsci 11 11323 g005
Figure 6. Calibration of the model according to NOCT conditions variation.
Applsci 11 11323 g006
Figure 7. Validation of the model: (a) base case—without heat sink; (b) PV panel with heat sink.
Applsci 11 11323 g007
Figure 8. Variation of average operating temperature and convective heat transfer coefficient for studied cases. G = 1000 W/m2, vair = 1 m/s and tair = 20–35 °C.
Applsci 11 11323 g008
Figure 9. Variation of average operating temperature and convective heat transfer coefficient for studied cases (G = 800 W/m2, vair = 1 m/s and tair = 20–35 °C).
Applsci 11 11323 g009
Figure 10. Variation of average operating temperature and convective heat transfer coefficient for studied cases (G = 600 W/m2, vair = 1 m/s and tair = 20–35 °C).
Applsci 11 11323 g010
Table 1. General characteristic for the considered PV panel.
AE Solar AE320HM6-60 PV Panel
Pmp320 Wp
Vmp33.40 V
Imp9.59 A
Voc40.90 V
Isc10.15 A
η19.30%
β−0.37%/°C
tNOCT47 °C
Dimensions (L × l × h)1665 mm × 996 mm × 35 mm
Table 2. Material properties.
Materialg [mm]λ [W/m·K]ρ [kg/m3]cp [J/kg·K]
Glass3.001.0023000.50
PV cells0.3516823300.757
EVA0.500.359602.09
Tedlar0.200.2015001.20
Copper1.0038689600.376
Air-0.0251.201.005
Table 3. Studied configurations.
CaseNameMesh DetailDescription
0Base Applsci 11 11323 i001Pilot photovoltaic panel—normal installation—without cooling solution.
1Horiz Simple Applsci 11 11323 i002Air-cooled photovoltaic panel with heat sink and non-perforated horizontal (transversal) fins.
2Horiz 30 mm Applsci 11 11323 i003Air-cooled photovoltaic panel with heat sink and perforated horizontal (transversal) fins Φ = 30 mm.
3Horiz 60 mm Applsci 11 11323 i004Air-cooled photovoltaic panel with heat sink and perforated horizontal (transversal) fins Φ = 60 mm.
4Vert Simple Applsci 11 11323 i005Air-cooled photovoltaic panel with heat sink and non-perforated vertical (longitudinal) fins.
5Vert 30 mm Applsci 11 11323 i006Air-cooled photovoltaic panel with heat sink and perforated vertical (longitudinal) fins Φ = 30 mm.
6Vert 60 mm Applsci 11 11323 i007Air-cooled photovoltaic panel with heat sink and perforated vertical (longitudinal) fins Φ = 60 mm.
Table 4. Components of the model and overall dimensions of the heat sinks.
Case3D Perspective ViewOverall Dimensions of the Heat Sink
1 Applsci 11 11323 i008 Applsci 11 11323 i009
2, 3 Applsci 11 11323 i010 Applsci 11 11323 i011
4 Applsci 11 11323 i012 Applsci 11 11323 i013
5, 6 Applsci 11 11323 i014 Applsci 11 11323 i015
Table 5. Temperature distribution on the PV panel and air velocity profile for the NOCT configuration.
Front PV Temperature Distribution (tPV [°C])Wind Velocity Cross-Section Plane (vair [m/s])
Applsci 11 11323 i016 Applsci 11 11323 i017
Base case: (a)(b)
Applsci 11 11323 i018 Applsci 11 11323 i019
Horizontal simple: (a)(b)
Applsci 11 11323 i020 Applsci 11 11323 i021
Horizontal 30 mm: (a)(b)
Applsci 11 11323 i022 Applsci 11 11323 i023
Horizontal 60 mm: (a)(b)
Applsci 11 11323 i024 Applsci 11 11323 i025
Vertical simple: (a)(b)
Applsci 11 11323 i026 Applsci 11 11323 i027
Vertical 30 mm: (a)(b)
Applsci 11 11323 i028 Applsci 11 11323 i029
Vertical 60 mm: (a)(b)
Table 6. Drop of the PV panel operating temperature for ambient air temperatures, tair = 20–35 °C, wind velocity, vair = 1–5 m/s and solar radiation, G = 600–1000 W/m2.
CasevairG = 600 W/m2G = 800 W/m2G = 1000 W/m2
Drop of tPV Compared to Base Case, for tair = 20–35 °C
°C%°C%°C%
0. BASE CASE1 m/s40.3–55.9-47.2–62.9-54.1–70.1-
1. HORIZ SIMPLE−6.02–−8.59−14.9–−15.4−8.22–−11.54−17.4–−18.3−10.52–−14.46−19.4–−26.7
2. HORIZ 30MM−6.97–−8.66−17.3–−15.5−9.51–−11.63−20.2–−18.5−12.05–−14.61−22.3–−27
3. HORIZ 60MM−6.35–−8.62−15.8–−15.4−8.55–−10.05−18.1–−16−10.88–−14.54−20.1–−26.9
4. VERT SIMPLE−5.98–−7.2−14.8–−12.9−8.07–−9.76−17.1–−15.5−10.25–−12.4−18.9–−22.9
5. VERT 30MM−4.49–−6.4−11.1–−11.5−6.4–−8.61−13.6–−13.7−8.51–−10.93−15.7–−20.2
6. VERT 60MM−5.82–−6.97−14.4–−12.5−7.84–−8.59−16.6–−13.7−9.97–−10.87−18.4–−20.1
0. BASE CASE2 m/s34.5–49.9-39.4–54.9-44.3–59.9-
1. HORIZ SIMPLE−6.11–−6.18−17.7–−12.4−8.52–−8.6−21.6–−15.7−10.26–−10.88−23.2–−18.2
2. HORIZ 30MM−6.36–−6.79−18.4–−13.6−8.51–−9.32−21.6–−17−10.7–−11.7−24.2–−19.5
3. HORIZ 60MM−6–−6.37−17.4–−12.8−8.01–−8.73−20.3–−15.9−10.07–−10.68−22.7–−17.8
4. VERT SIMPLE−6.67–−6.17−19.3–−12.4−7.55–−8.26−19.2–−15−9.5–−10.38−21.5–−17.3
5. VERT 30MM−5.31–−6.21−15.4–−12.4−7.27–−8.3−18.5–−15.1−9.26–−10.42−20.9–−17.4
6. VERT 60MM−5.59–−4.48−16.2–−9−7.47–−8.14−19–−14.8−9.39–−10.13−21.2–−16.9
0. BASE CASE3 m/s31.4–46.8-35.2–50.7-39.1–54.7-
1. HORIZ SIMPLE−4.88–−5.24−15.5–−11.2−6.72–−7.15−19.1–−14.1−8.53–−9.33−21.8–−17.1
2. HORIZ 30MM−5.3–−5.77−16.9–−12.3−7.17–−7.73−20.3–−15.2−9–−9.7−23–−17.7
3. HORIZ 60MM−5.11–−5.49−16.3–−11.7−6.85–−7.56−19.4–−14.9−8.62–−9.2−22.1–−16.8
4. VERT SIMPLE−4.59–−5.16−14.6–−11−6.33–−6.92−18–−13.6−7.96–−8.69−20.4–−15.9
5. VERT 30MM−5–−5.38−15.9–−11.5−6.7–−7.21−19–−14.2−8.41–−9.04−21.5–−16.5
6. VERT 60MM−4.53–−5.06−14.4–−10.8−6.08–−6.54−17.2–−12.9−7.64–−8.21−19.5–−15
0. BASE CASE4 m/s29.2–44.6-32.4–47.8-35.5–51.1-
1. HORIZ SIMPLE−3.92–−4.07−13.4–−9.1−5.41–−5.68−16.7–−11.9−6.88–−7.57−19.4–−14.8
2. HORIZ 30MM−4.25–−4.75−14.5–−10.6−5.77–−5.87−17.8–−12.3−7.26–−7.94−20.5–−15.5
3. HORIZ 60MM−4.16–−4.53−14.2–−10.2−5.58–−5.76−17.2–−12−7.02–−7.58−19.8–−14.8
4. VERT SIMPLE−3.66–−4.05−12.5–−9.1−4.92–−5.41−15.2–−11.3−6.21–−6.8−17.5–−13.3
5. VERT 30MM−4.13–−4.49−14.1–−10.1−5.53–−6.02−17.1–−12.6−6.95–−7.56−19.6–−14.8
6. VERT 60MM−3.46–−3.72−11.8–−8.3−4.64–−4.98−14.3–−10.4−5.84–−6.24−16.5–−12.2
0. BASE CASE5 m/s27.7–43.1-30.4–45.8-33–48.5-
1. HORIZ SIMPLE−3.15–−3.54−11.4–−8.2−4.38–−4.87−14.4–−10.6−5.56–−6.15−16.9–−12.7
2. HORIZ 30MM−3.64–−3.82−13.1–−8.9−4.87–−5.11−16.1–−11.2−6.1–−6.41−18.5–−13.2
3. HORIZ 60MM−3.41–−3.73−12.3–−8.7−4.57–−4.9−15.1–−10.7−5.76–−6.21−17.5–−12.8
4. VERT SIMPLE−2.95–−3.25−10.6–−7.6−3.95–−4.36−13–−9.5−4.98–−5.47−15.1–−11.3
5. VERT 30MM−3.42–−3.73−12.3–−8.7−4.59–−4.99−15.1–−10.9−5.75–−6.26−17.4–−12.9
6. VERT 60MM−2.62–−2.73−9.4–−6.3−3.52–−3.68−11.6–−8−4.42–−4.61−13.4–−9.5
Table 7. Percentage of maximum power production achieved by the PV panel for each studied case.
CasevairG = 600 W/m2G = 800 W/m2G = 1000 W/m2
of Pm at 25 °C, for tair = 20–35 °C
%%%
0. BASE CASE1 m/s94.33–88.5891.8–85.9889.23–83.33
1. HORIZ SIMPLE96.56–91.7694.84–90.2593.12–88.68
2. HORIZ 30MM96.91–91.7895.32–90.2893.69–88.74
3. HORIZ 60MM96.68–91.7794.96–89.793.25–88.71
4. VERT SIMPLE96.55–91.2494.79–89.5993.02–87.92
5. VERT 30MM96–90.9594.17–89.1692.38–87.37
6. VERT 60MM96.49–91.1694.7–89.1692.92–87.35
0. BASE CASE2 m/s96.48–90.7994.68–88.9592.87–87.09
1. HORIZ SIMPLE98.74–93.0897.84–92.1396.67–91.11
2. HORIZ 30MM98.83–93.397.83–92.3996.83–91.42
3. HORIZ 60MM98.7–93.1597.65–92.1896.6–91.04
4. VERT SIMPLE98.95–93.0797.47–9296.39–90.93
5. VERT 30MM98.44–93.0997.37–92.0296.3–90.94
6. VERT 60MM98.55–92.4597.45–91.9696.35–90.83
0. BASE CASE3 m/s97.63–91.9595.71–89.1994.79–89.01
1. HORIZ SIMPLE99.44–93.8898.53–92.297.95–92.46
2. HORIZ 30MM99.59–94.0898.71–92.4498.12–92.6
3. HORIZ 60MM99.52–93.9898.58–92.3797.98–92.41
4. VERT SIMPLE99.33–93.8598.36–92.197.74–92.23
5. VERT 30MM99.48–93.9398.52–92.2297.91–92.36
6. VERT 60MM99.31–93.8298.26–91.9497.62–92.05
0. BASE CASE4 m/s98.43–92.7496.54–89.2696.12–90.35
1. HORIZ SIMPLE99.88–94.2599.09–91.9498.67–93.15
2. HORIZ 30MM100–94.599.25–92.0298.81–93.29
3. HORIZ 60MM99.97–94.4299.16–91.9798.72–93.15
4. VERT SIMPLE99.79–94.2498.85–91.8198.42–92.86
5. VERT 30MM99.96–94.4199.14–92.0998.69–93.14
6. VERT 60MM99.71–94.1298.72–91.6198.28–92.66
0. BASE CASE5 m/s98.98–93.3297.22–89.2196.12–90.35
1. HORIZ SIMPLE100.15–94.6399.5–91.7499.11–93.59
2. HORIZ 30MM100.33–94.7499.75–91.8699.31–93.69
3. HORIZ 60MM100.25–94.799.6–91.7699.18–93.61
4. VERT SIMPLE100.07–94.5299.27–91.4798.9–93.34
5. VERT 30MM100.25–94.799.6–91.899.18–93.63
6. VERT 60MM99.95–94.3399.05–91.1298.69–93.02
Publisher’s Note: MDPI stays neutral with regard to jurisdictional claims in published maps and institutional affiliations.

