Article

Reduced Graphene Oxide-Metalloporphyrin Sensors for Human Breath Screening

1
Department of Computer Science and Genome Center, University of California, Davis, CA 95616, USA
2
USDA/NSF AI Institute for Next Generation Food Systems, AIFS, University of California, Davis, CA 95616, USA
*
Author to whom correspondence should be addressed.
Appl. Sci. 2021, 11(23), 11290; https://doi.org/10.3390/app112311290
Submission received: 19 October 2021 / Revised: 17 November 2021 / Accepted: 20 November 2021 / Published: 29 November 2021
(This article belongs to the Special Issue Practical Application of Functionalized Carbon-Based Nanomaterials)

Abstract

:
The objective of this study is to validate reduced graphene oxide (RGO)-based volatile organic compounds (VOC) sensors, assembled by simple and low-cost manufacturing, for the detection of disease-related VOCs in human breath using machine learning (ML) algorithms. RGO films were functionalized by four different metalloporphryins to assemble cross-sensitive chemiresistive sensors with different sensing properties. This work demonstrated how different ML algorithms affect the discrimination capabilities of RGO–based VOC sensors. In addition, an ML-based disease classifier was derived to discriminate healthy vs. unhealthy individuals based on breath sample data. The results show that our ML models could predict the presence of disease-related VOC compounds of interest with a minimum accuracy and F1-score of 91.7% and 83.3%, respectively, and discriminate chronic kidney disease breath with a high accuracy, 91.7%.

1. Introduction

Exhaled breath contains a number of volatile organic compounds (VOC) as gaseous molecules that are products of physiological and pathophysiological metabolic processes. As many as 872 VOCs can be detected in human breath, including compounds that are based on nitrogen, oxygen, sulfur, and hydrocarbons [1]. The concentrations of VOCs in human breath may be altered due to infectious and metabolic diseases, genetic disorders, and various cancers [2,3,4,5,6,7]. Therefore, VOC analysis can be used for health diagnosis as a non-invasive, painless, inexpensive, and ubiquitous alternative to regular screenings for the detection of disease onset and evaluation of therapeutic efficacy [8,9].
Several techniques have been applied for measuring breath biomarker VOCs, including gas chromatography and mass spectrometry (GC–MS) [10], selected ion flow tube mass spectrometry (SIFT–MS) [11], proton-transfer-reaction mass spectrometry (PTR–MS) [12], ion mobility spectrometry–mass spectrometry (IMS–MS) [13], and Fourier transform–ion cyclotron resonance mass spectrometry (FT–ICT MS) [14]. For example, Phillips et al. collected breath samples of approximately one hundred pulmonary tuberculosis (TB) patients and healthy controls in sorbent traps, analyzed them using GC–MS, and identified seven VOC biomarkers that were differentially present between the two groups [3]. Fu et al. employed FT-ICR MS to detect lung cancer in exhaled breath, using four VOCs (2-butanone, 2-hydroxyacetaldehyde, 3-hydroxy-2-butanone, and 4-hydroxyhexenal) that were over-represented in the exhaled breath of lung cancer patients [14]. Kumar et al. used SIFT–MS and showed higher concentrations of twelve VOCs in the exhaled breath of esophagogastric cancer patients [11]. These techniques are difficult to deploy in clinical settings due to challenges such as their need for equipment infrastructure, sample preparation, and trained personnel [15].
To tackle these challenges, nanomaterial-based VOC breath sensors have been developed [9]. Based on their characteristics, nanomaterial-based VOC sensors can be categorized as colorimetric [16], acoustic [17], and electrochemical [18,19,20]. They can either be specific to a single VOC or cross-sensitive to multiple VOCs [21]. Wu et al. used a cross-sensitive colorimetric sensor array that was assembled with nanoporous dimeric metalloporphyrins to detect eight VOCs in the exhaled breath of lung cancer patients, with a response time of 3 min [22]. In another study, Penza et al. coated a single-walled carbon nanotube-based thin film on a quartz crystal microbalance (QCM) device to create an array of cross-sensitive QCM sensors [17]. Their acoustic VOC sensors were able to discriminate six different VOCs (ethanol, methanol, isopropanol, acetone, ethyl acetate, and toluene) of public health relevance [17]. Electrochemical sensors, including metal oxide semiconductors (MOS) and chemiresistive sensors, measure electrical property changes in the sensing material under the exposure of sensing VOC analytes. Machado et al. used an array of carbon black-based chemiresistive sensors for detecting lung cancer with 71.4% sensitivity and 91.9% specificity [20]. Zhou et al. assembled a selective MOS sensor using copper oxide (CuO2)-functionalized graphene sheets (FGS) for hydrogen sulfide (H2S) detection [19]. The CuO2-FGS sensor detected a low H2S concentration (5 ppb) with a sensor sensitivity of 11%. Nanomaterial-based VOC sensors have been successfully used for disease detection in breath samples for lung cancer [23,24], breast cancer [25], liver cirrhosis [26], head and neck cancer [27], diabetes [28], Clostridium difficile infection [29], chronic kidney disease [30], Alzheimer’s disease, and Parkinson’s disease [31], among others.
Current challenges in nanomaterial VOC sensors include miniaturization, large-scale production, operation at room temperature, accuracy, sensitivity, and specificity [32,33]. Each sensor type may have different advantages and limitations: colorimetric sensors are low cost but can only be used once due to the irreversible color change [34]; acoustic sensors may be sensitive and lose accuracy due to an undesirable frequency shift [35]; electrochemical MOS sensors have shown high sensitivity to VOC detection [19], but they require a high operating temperature (T > 300 °C) and have high power consumption [33,36]. Some of these challenges can be addressed using carbon nanomaterials, such as carbon nanotubes, carbon black, graphene, and reduced graphene oxide, due to their low power consumption, high surface-volume ratio, high electron mobility, and high capability of gas adsorption [33,37]. The complexity of fabrication methods and insufficient detection accuracy of VOC sensors remain outstanding challenges that hinder their clinical utility [33].
Here, we present a carbon nanomaterial VOC sensor, based on reduced graphene-oxide (RGO)/metalloporphyrin, that is easy and inexpensive to manufacture, and which can accurately detect VOCs related to a variety of diseases that are usually present in human breath. We fabricated an RGO–metalloporphyrin-sensing array using a drop casting method and characterized it using scanning electron microscopy (SEM) and energy dispersive spectra (EDS). The sensing array was then exposed to three disease-related breath VOCs (acetone, ammonia, and isopropanol) and carbon monoxide. Further analysis and integration of the results through machine learning (ML) models led to a method that can predict the presence of the above compounds with an accuracy and F1-score of 91.7% and 83.3%, respectively, and discriminate between healthy and chronic kidney disease samples with 91.7% accuracy.

2. Materials and Methods

2.1. Materials

Graphene oxide aqueous dispersion was purchased from MSE supplies. L-ascorbic acid (L-AA), acetone, 5, 10, 15, 20-Tetraphenylporphyrin-21H, 23H-cobalt (II) (CoTPP), 5, 10, 15, 20-Tetraphenyl porphyrin-21H, 23H-porphine zinc (ZnTPP), 5, 10, 15, 20-Tetraphenylporphyrin-21H,23H-porphine iron (III) chloride (FeTPP), and 5, 10, 15, 20- Tetraphenylporphyrin-21H,23H-porphine manganese (III) chloride (MnTPP) were all acquired from Sigma-Aldrich. Chloroform and isopropanol were purchased from EMD Millipore (Burlington, MA, USA) and Fisher Scientific (Hampton, NH, USA), respectively. The interdigitated electrodes were acquired from Newvision1981.

2.2. Sensor Fabrication

The RGO–based sensor fabrication started with the GO thin film assembly (Figure 1). First, 5 mg/mL GO aqueous solution was diluted with deionized (DI) water to create a 2 mg/mL GO aqueous solution. A total of 100 μL of 2 mg/mL GO solution was pipetted on the interdigitated electrodes and dried in an oven for 2 h at 50 °C. It should be noted that, before coating, the interdigitated electrodes were cleaned with DI water, acetone, and isopropyl alcohol to remove any residue. The interdigitated electrodes consisted of 10 finger pairs with 80 μm of spacing and electrode width and metal layers of Ti/Cu/Ni/Au. Figure S1 describes the electrode dimensions in detail. Interdigitated electrodes increase the signal-to-noise ratio and the contact area between the electrodes and the conductive RGO film [38]. The GO thin film was then chemically reduced by L-AA solution, which is a green reductant (i.e., eco-friendly and non-toxic), at 80 °C for 90 min [39]. Next, four different types of metalloporphyrin solution were prepared by dissolving four different metalloporphyrin powders (CoTPP, FeTPP, MnTPP, and ZnTPP) in chloroform for 90 min of bath ultrasonication (80 W, 40 kHz) to create a 2 mg/mL concentration. RGO thin film samples were noncovalently functionalized by pipetting 15 μL metalloporphyrin solution onto the RGO thin film. The samples were left to air-dry in a fume hood for 12 h. Finally, two electrodes were established by soldering two single-strand wires to the electrodes (Figure 2).

2.3. Material Characterization

The morphologies and chemical compositions of the as-prepared materials were characterized by scanning electron microscopy (SEM) and energy dispersive spectroscopy (EDS), respectively. An FEI Scios DualBeam SEM, equipped with Oxford X-max energy dispersive X-ray spectroscopy detector, was used. Microstructures of RGO thin film and GO thin film were investigated using SEM images and EDS spectra. An accelerating voltage of 10 kV and a secondary electron detector were used.

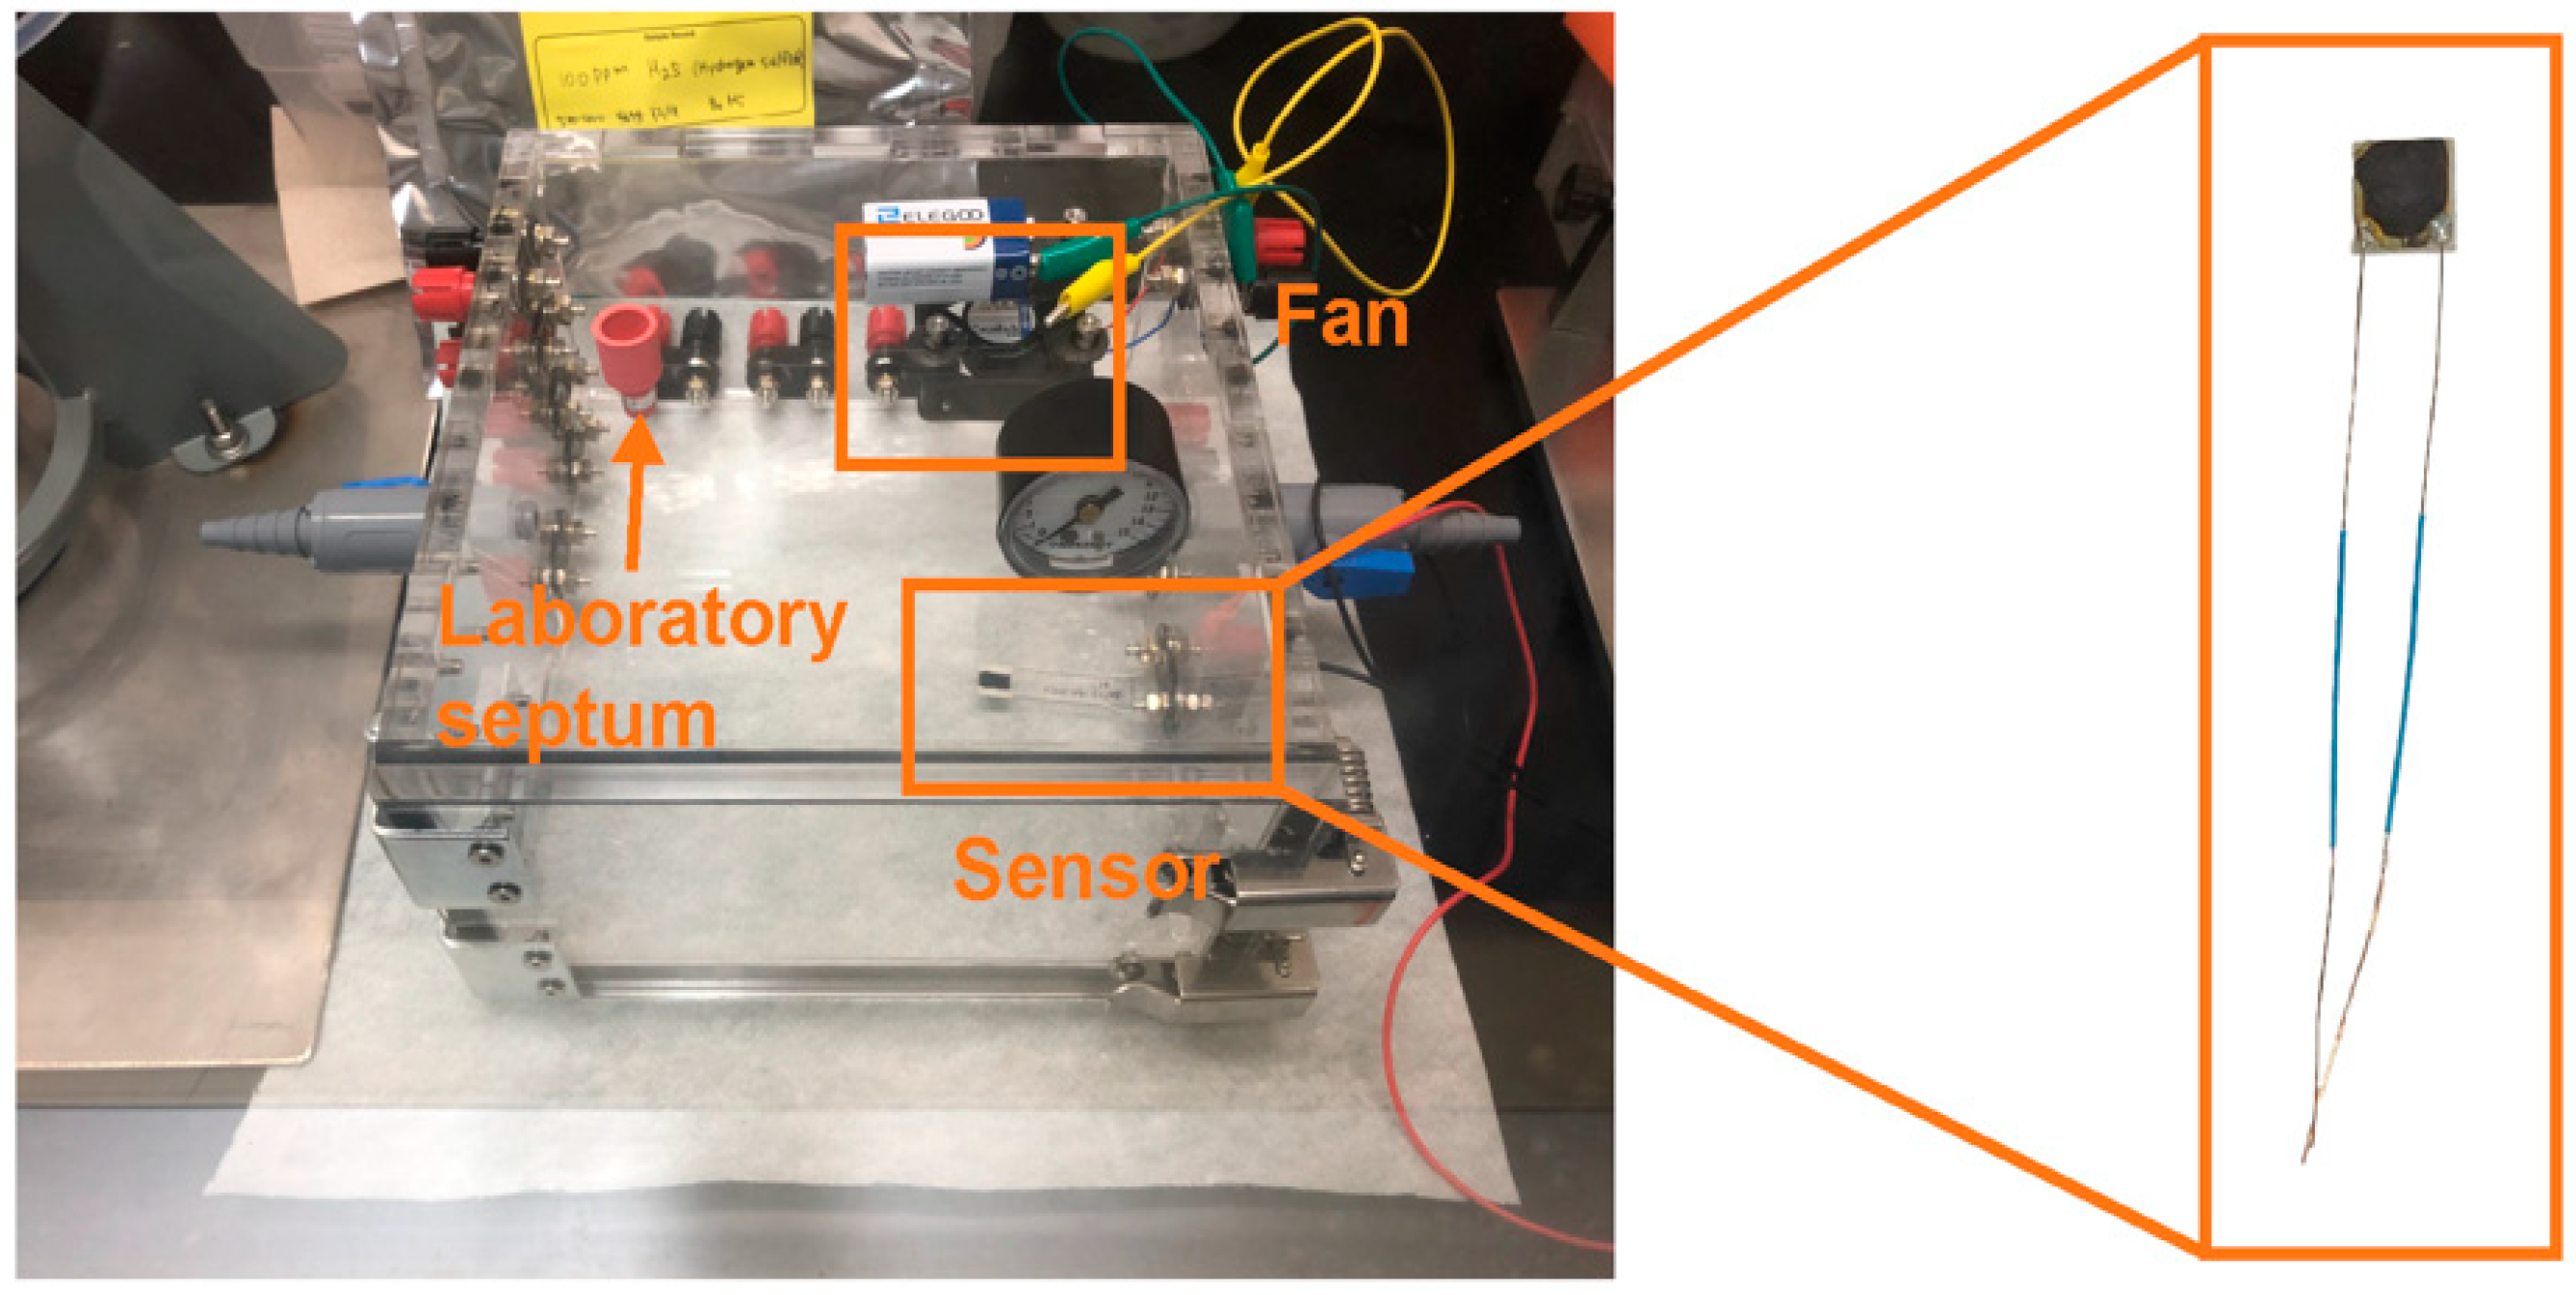
2.4. VOC-Sensing Characterization

The gas-sensing properties of the RGO–metalloporphyrin sensors were investigated by subjecting sensors to three VOCs (ammonia, acetone, and isopropanol) and carbon monoxide gas, while simultaneously measuring the change in electrical resistance of the sensors. In this study, a static gas-sensing testing method was used (Figure 2). First, a sensor was positioned inside a test chamber (4 L in volume). When the electrical resistances of the sensors were stabilized, a pre-determined amount of gas analyte was then introduced into the test chamber using a gas-tight micro-syringe through a laboratory septum. Next, the gas concentration was determined by the volume ratio of the injected gas to air under standard atmospheric pressure [40]. Throughout the entire test, an Agilent 34401A digital multimeter was used to record the electrical resistance of the RGO–metalloporphyrin sensors. In addition, an electric fan was installed in the test chamber to distribute the gas analyte and have a homogeneous diffusion of gas inside the chamber. RGO–metalloporphyrin sensors were then subjected to four different VOCs to simulate breath with disease states. It should be noted that the temperature inside the chamber was maintained at ~21 °C. The gas-sensing performance of the RGO sensors was investigated using the normalized change in resistance as follows:
R n o r m [ % ] = Δ R R i × 100
where Ri is the initial baseline resistance under ambient air condition, and ∆R is the change in resistance between the bulk film resistance of the RGO–metalloporphyrin film at a certain gas analyte condition with respect to its baseline resistance (Ri).

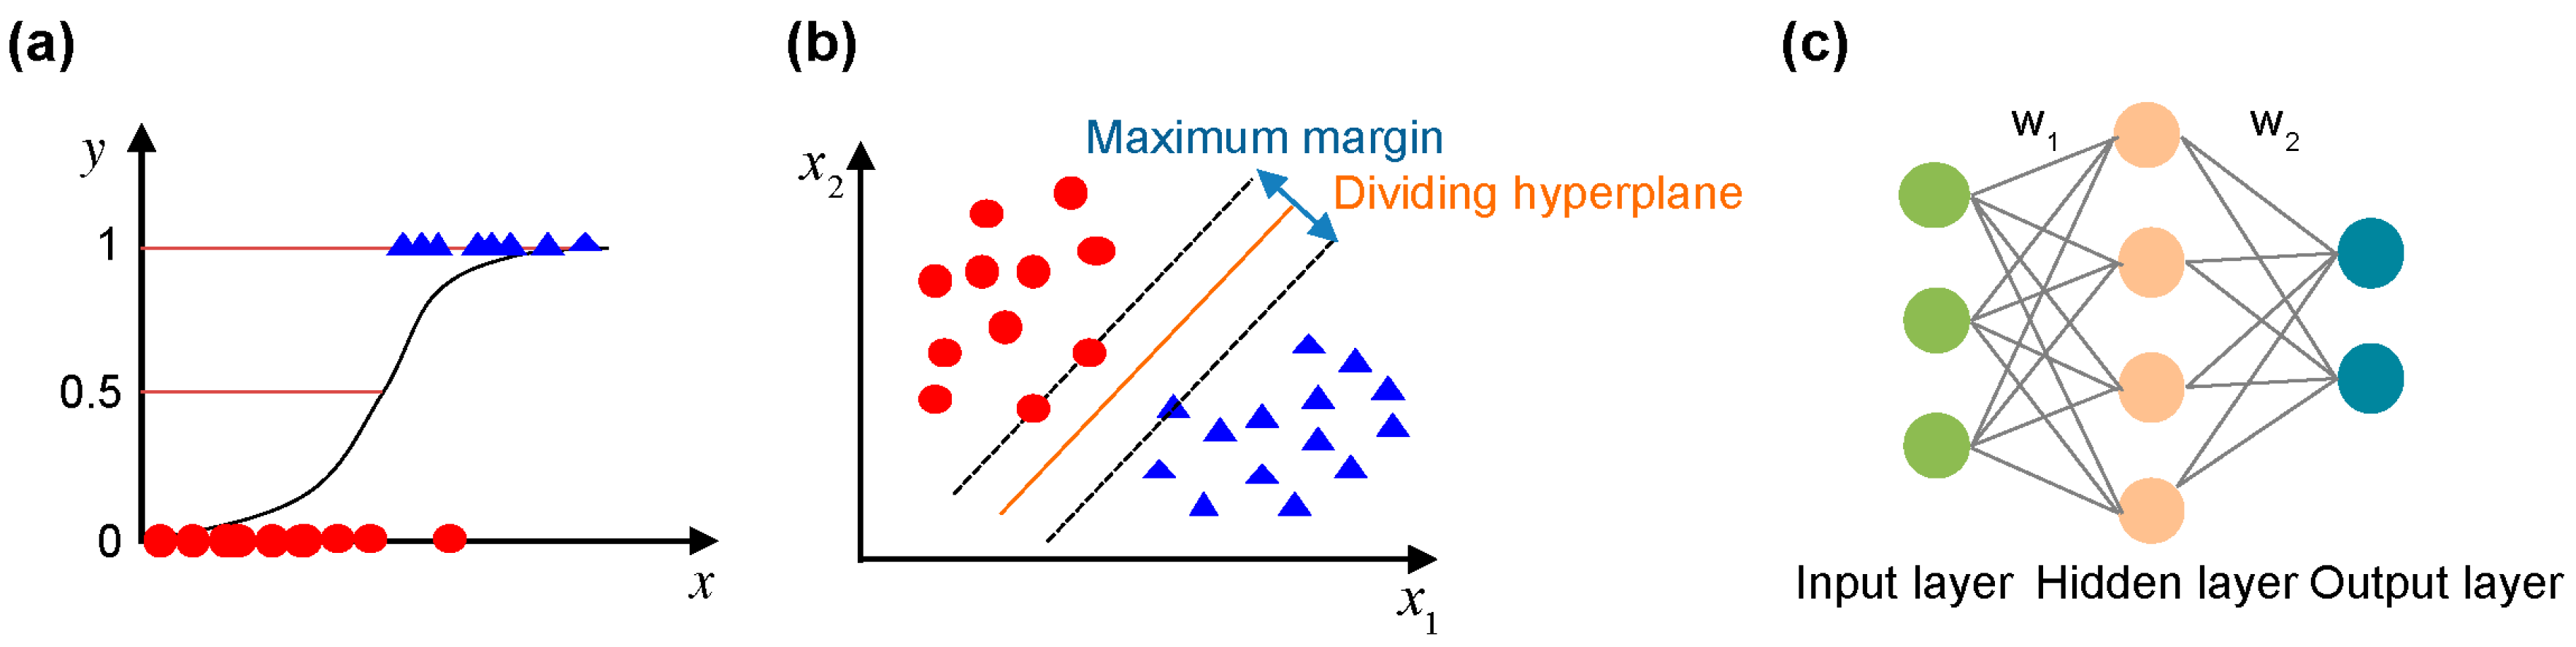
2.5. VOC-Sensing Pattern Recognition

The gas-sensing responses of the assembled RGO–metalloporphyrin sensors were statistically analyzed to evaluate their discriminative capabilities. First, the dimensions of the original data obtained from RGO–metalloporphyrin sensors were reduced using principal component analysis (PCA) to visualize and explore the sensing data (in MATLAB). Rnorm and the integral area under the curve (Area) from a sensing response curve were used as variables for PCA. A PCA data matrix (n × p) consisted of the experimental measurements (n = 24) and the measured feature values (Rnorm and Area) of each sensor (p = 8).
VOC classification analysis was then conducted using three ML algorithms, namely logistic regression (LR) [41], support vector machine (SVM) [42], and artificial neural network (ANN) [43], and their performances were compared (Figure 3). MATLAB, Scikit-learn, and TensorFlow were used to implement LR, SVM, and ANN, respectively. LR is a classification technique that assigns a probability to the relationship between input features and a particular outcome using a sigmoid function (Figure 3a). SVM constructs a hyperplane in high-dimensional feature space with the largest margin to separate different classes (Figure 3b). Finally, ANNs are widely used to capture non-linear patterns in the data through training of the weights carrying information from one node to another (Figure 3c). The algorithms predicted the gas identity (output) using Rnorm and Area (input). A one-vs.-rest multi-class classification was used, where a single classifier for each class was trained considering the samples in the target class as positive and all other classes as negative samples. The classification performance was evaluated using 3-fold cross-validation, where the dataset was randomly partitioned into 3 equally sized bins. The first bin was then used for the validation, while the remaining 2 bins were used for training to generate the models. This process was repeated 3 times until all bins were used for the validation. The performance of the classifier model was evaluated using the aggregate of all predictions of the test datasets. LR with L1 regularization was used to prevent model overfitting. A linear kernel was used for SVM. For ANN, 200 epochs with the learning rate of 0.001, the rectified linear unit activation function and the sparse categorical cross-entropy loss function were used. Here, the number of epochs defines the number of times that ANN worked through the entire training dataset. The number of hidden layers and nodes were the result of a trial-and-error procedure; the optimal architecture had one hidden layer with three nodes. To evaluate the predictive performance of the classification methods, accuracy, precision, recall, and F1-score metrics were calculated using a confusion matrix [44].

2.6. Healthy and Unhealthy Discrimination

An ML-based chronic kidney disease classifier was developed using gas sensor signal intensities (Rnorm) as input (i.e., four numbers, one for each sensor), to discriminate between healthy and unhealthy individuals based on their breath sample. A balanced realistic synthetic dataset (n = 2004) was generated based on: (a) the reported distribution of breath ammonia concentration in healthy (mean = 0.356 ppm, SD = 0.300) and unhealthy individuals (mean = 3.863 ppm, SD = 2.6855) [45] and (b) the distribution of signal intensities from four sensors given the ammonia concentrations that we tested. Normal distributions were assumed for ammonia concentration and signal intensities. An SVM classifier was then trained with linear kernel to discriminate between healthy and unhealthy subjects.

3. Results

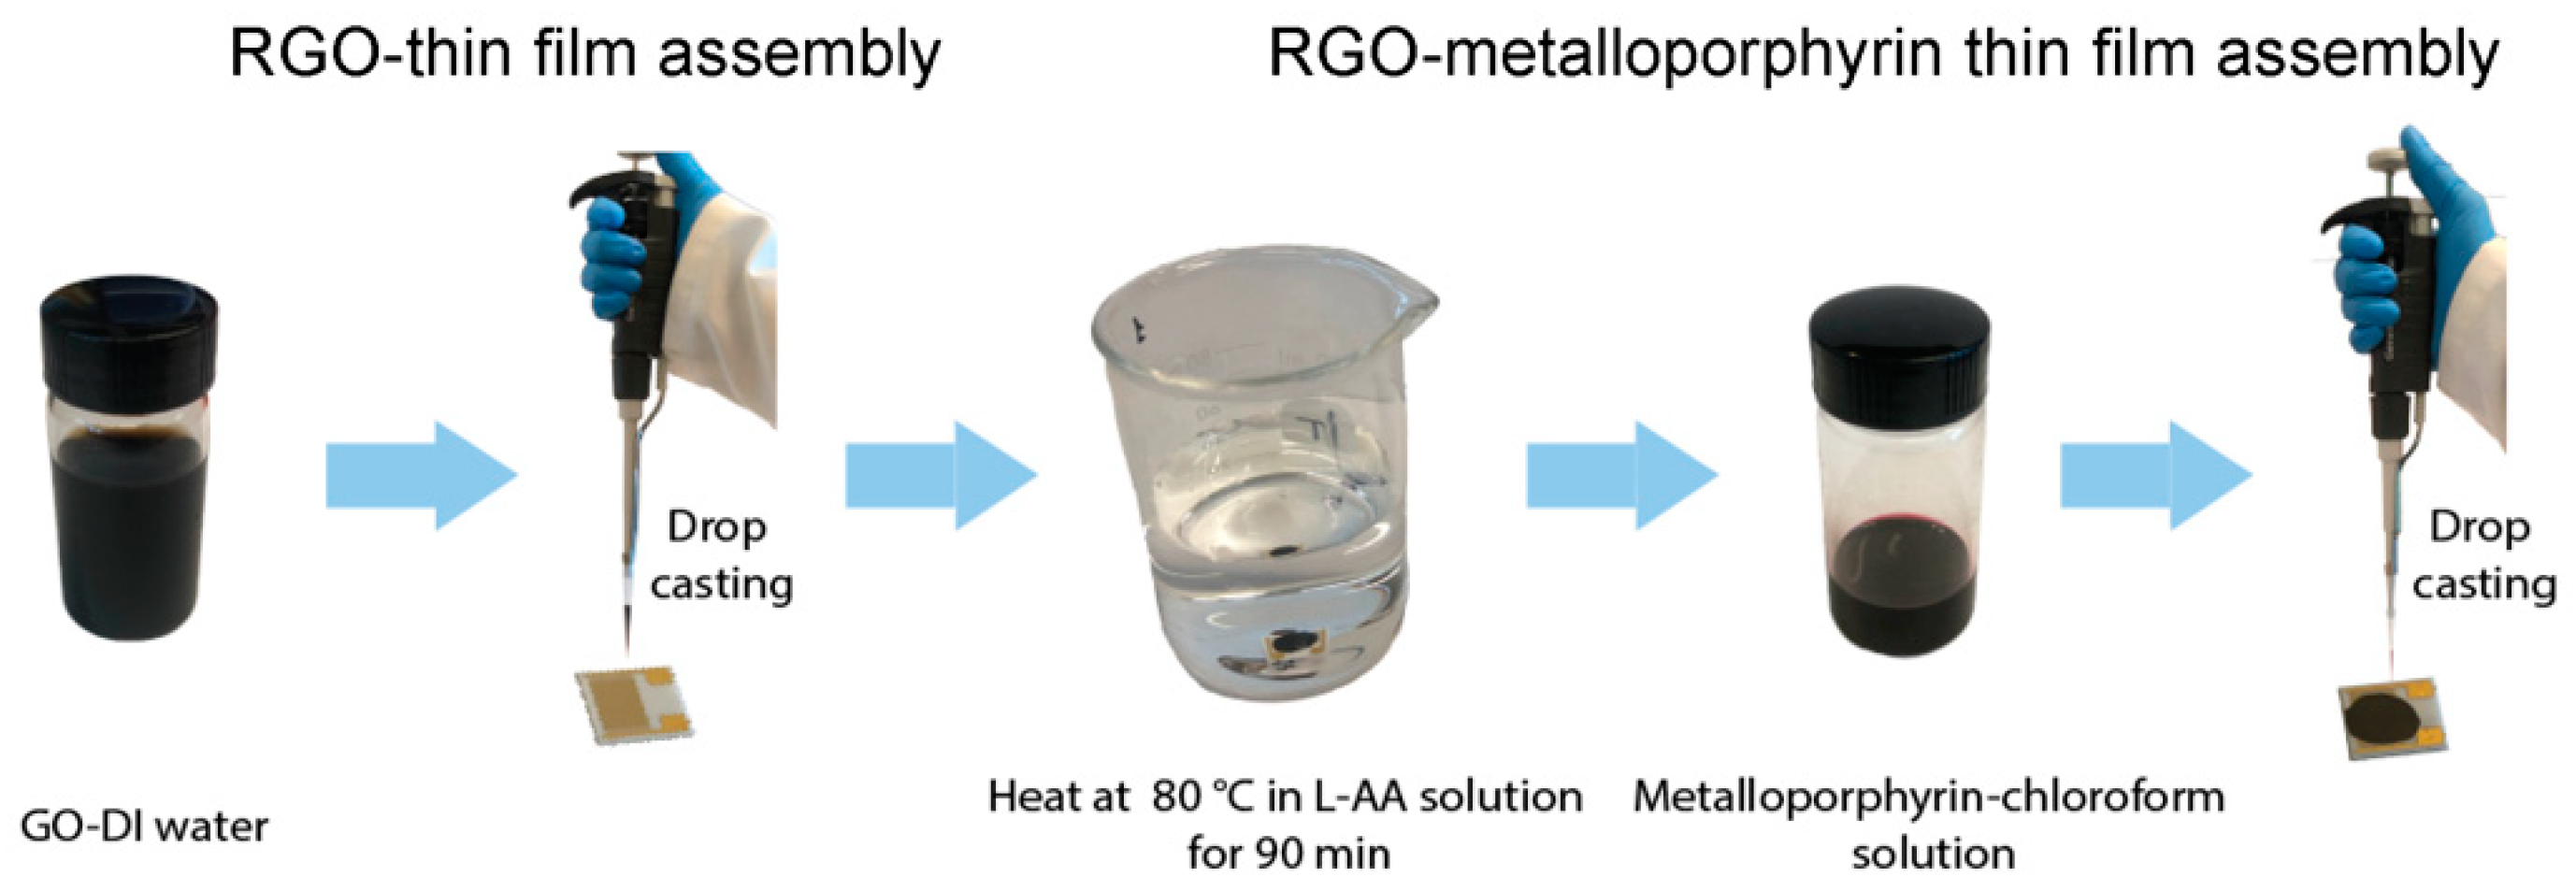
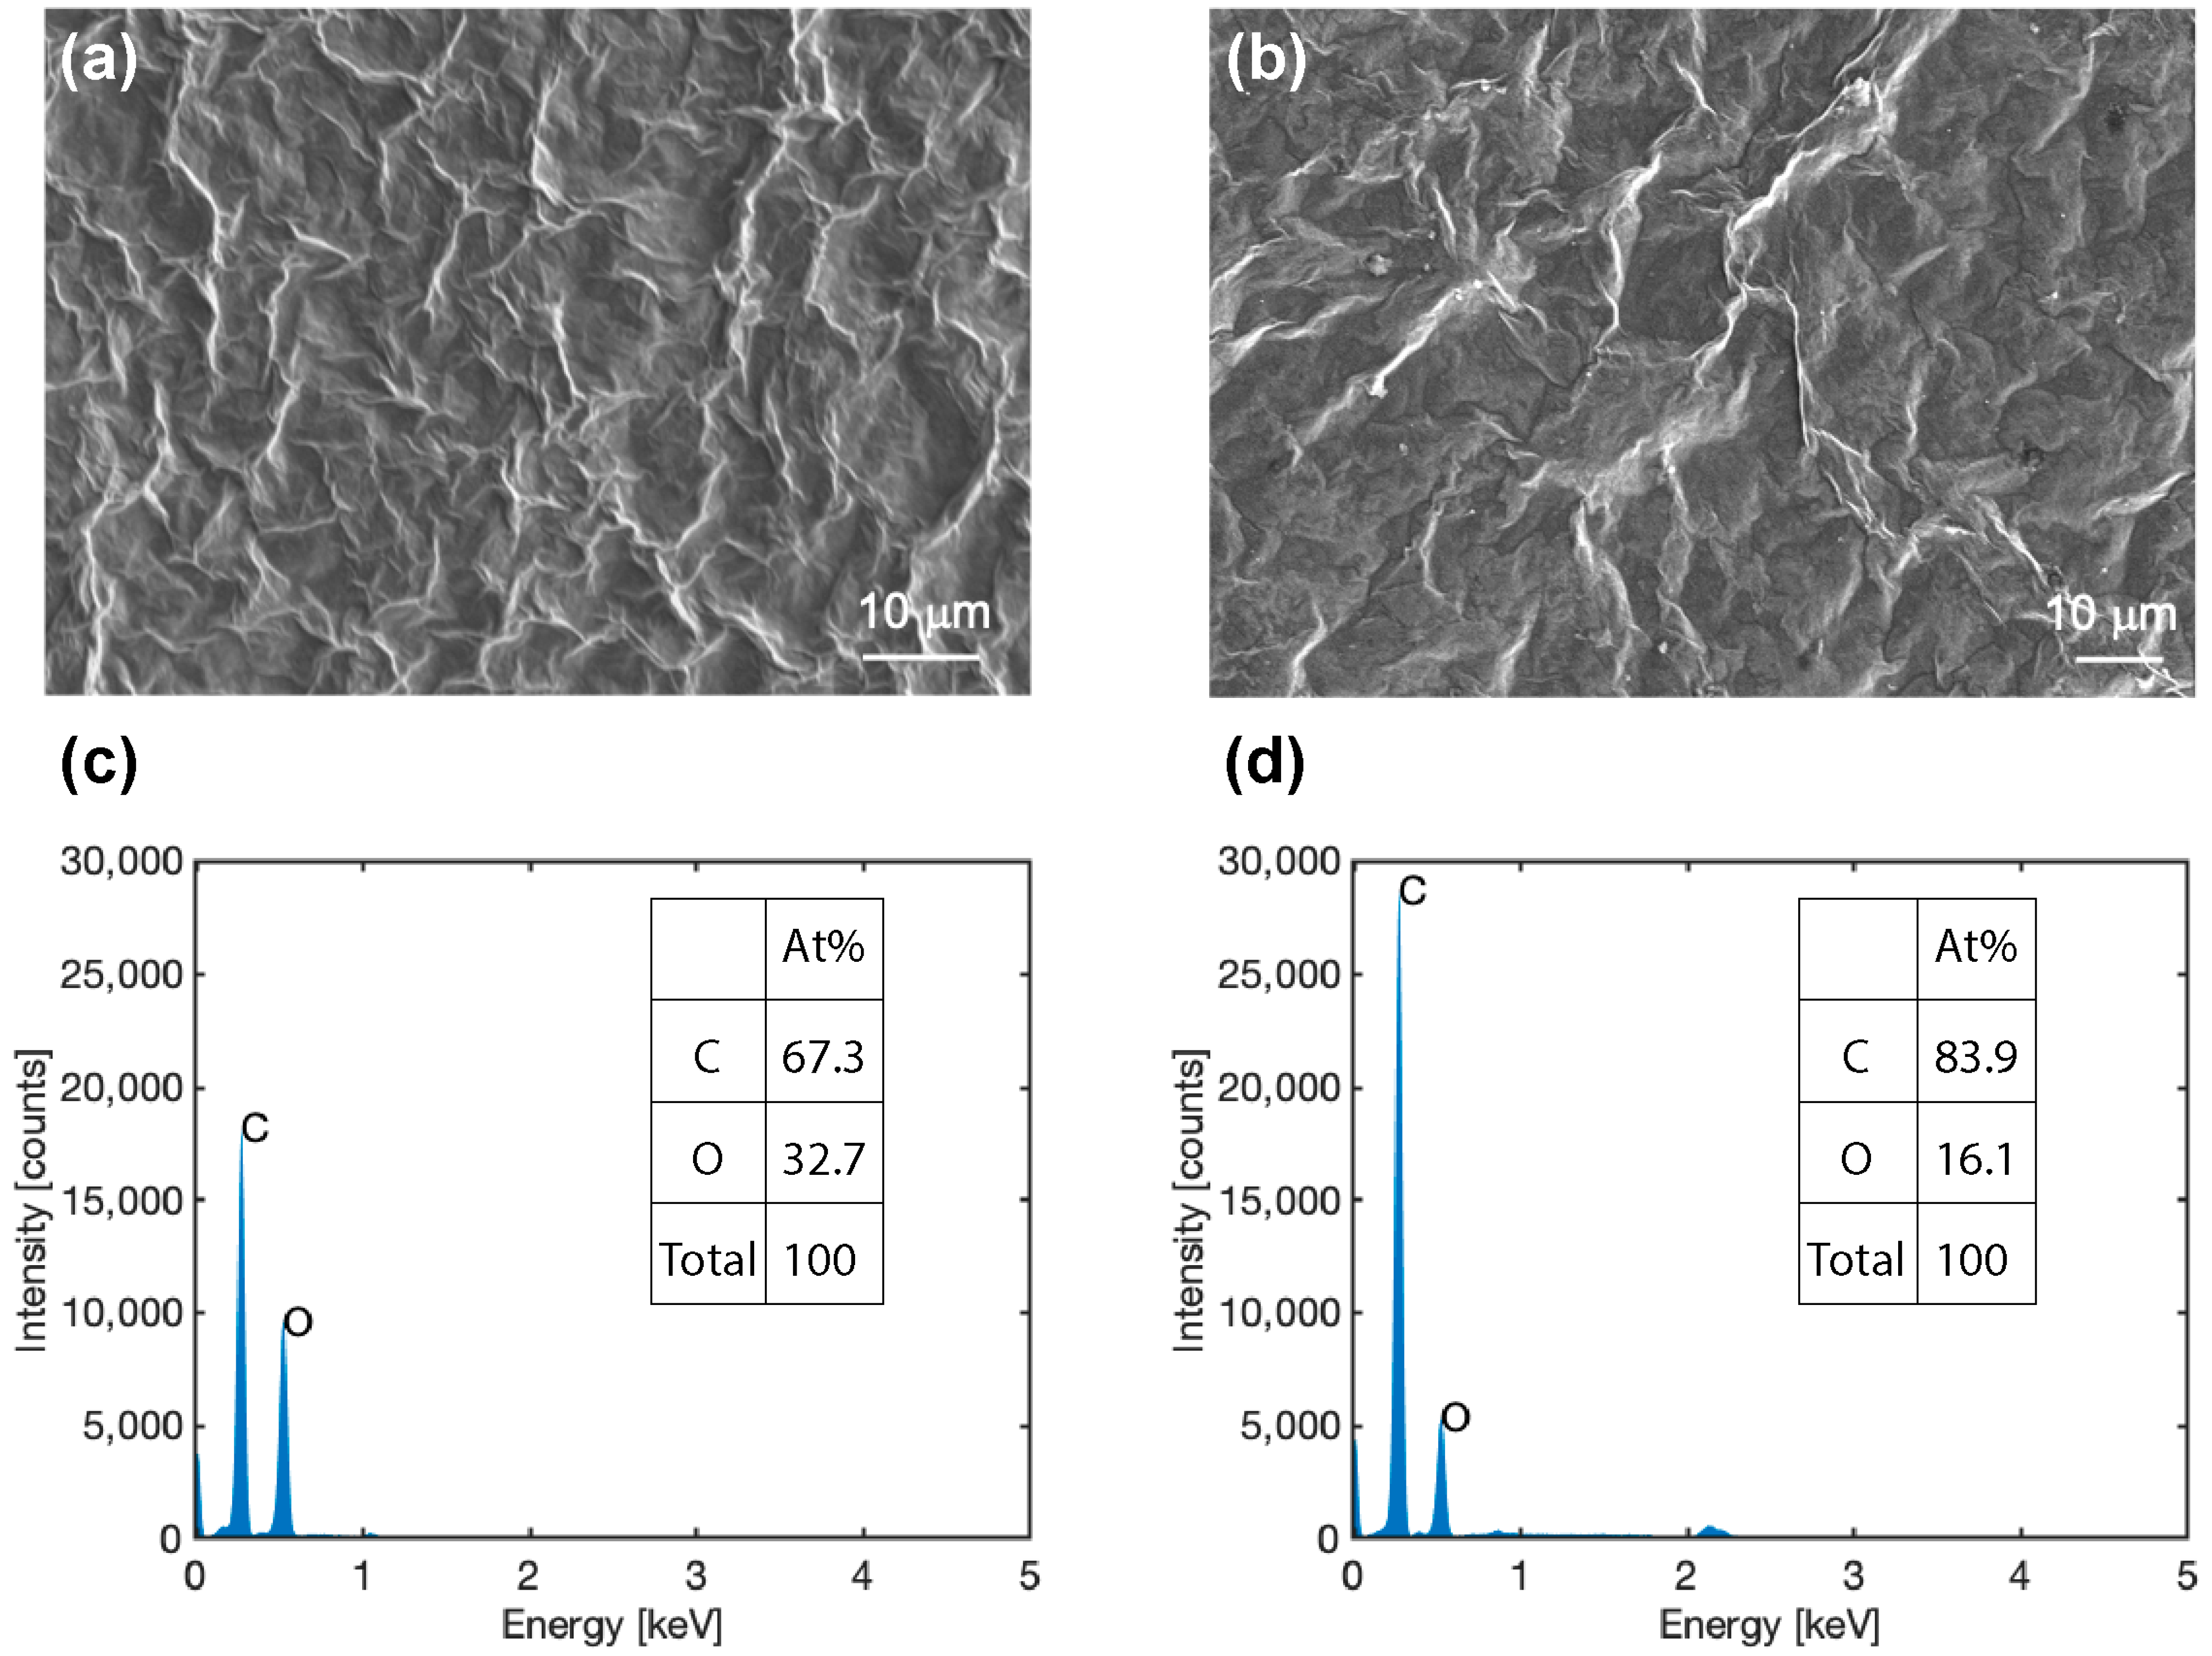
3.1. A GO Thin Film Was Chemically Reduced to Form an RGO Thin Film Using L-AA

As shown in the SEM images of the GO and RGO thin films (Figure 4a,b), the sheets were uniformly distributed without agglomeration and completely covered the interdigitated electrodes. Several wrinkles can be found in both thin films, although the reduction process does not affect the topology of the samples. The EDS results can be seen in Figure 4c,d. The atomic concentration of oxygen content in an RGO-film sample decreased from 32.7% to 16.1%, and the atomic concentration of the carbon content increased from 67.3% to 83.9%, showing the oxygen content was effectively reduced. This supports the theory that an insulating GO film will become a conductive RGO film by partially restoring double-bond conjunction and removing oxygen simultaneously [46].

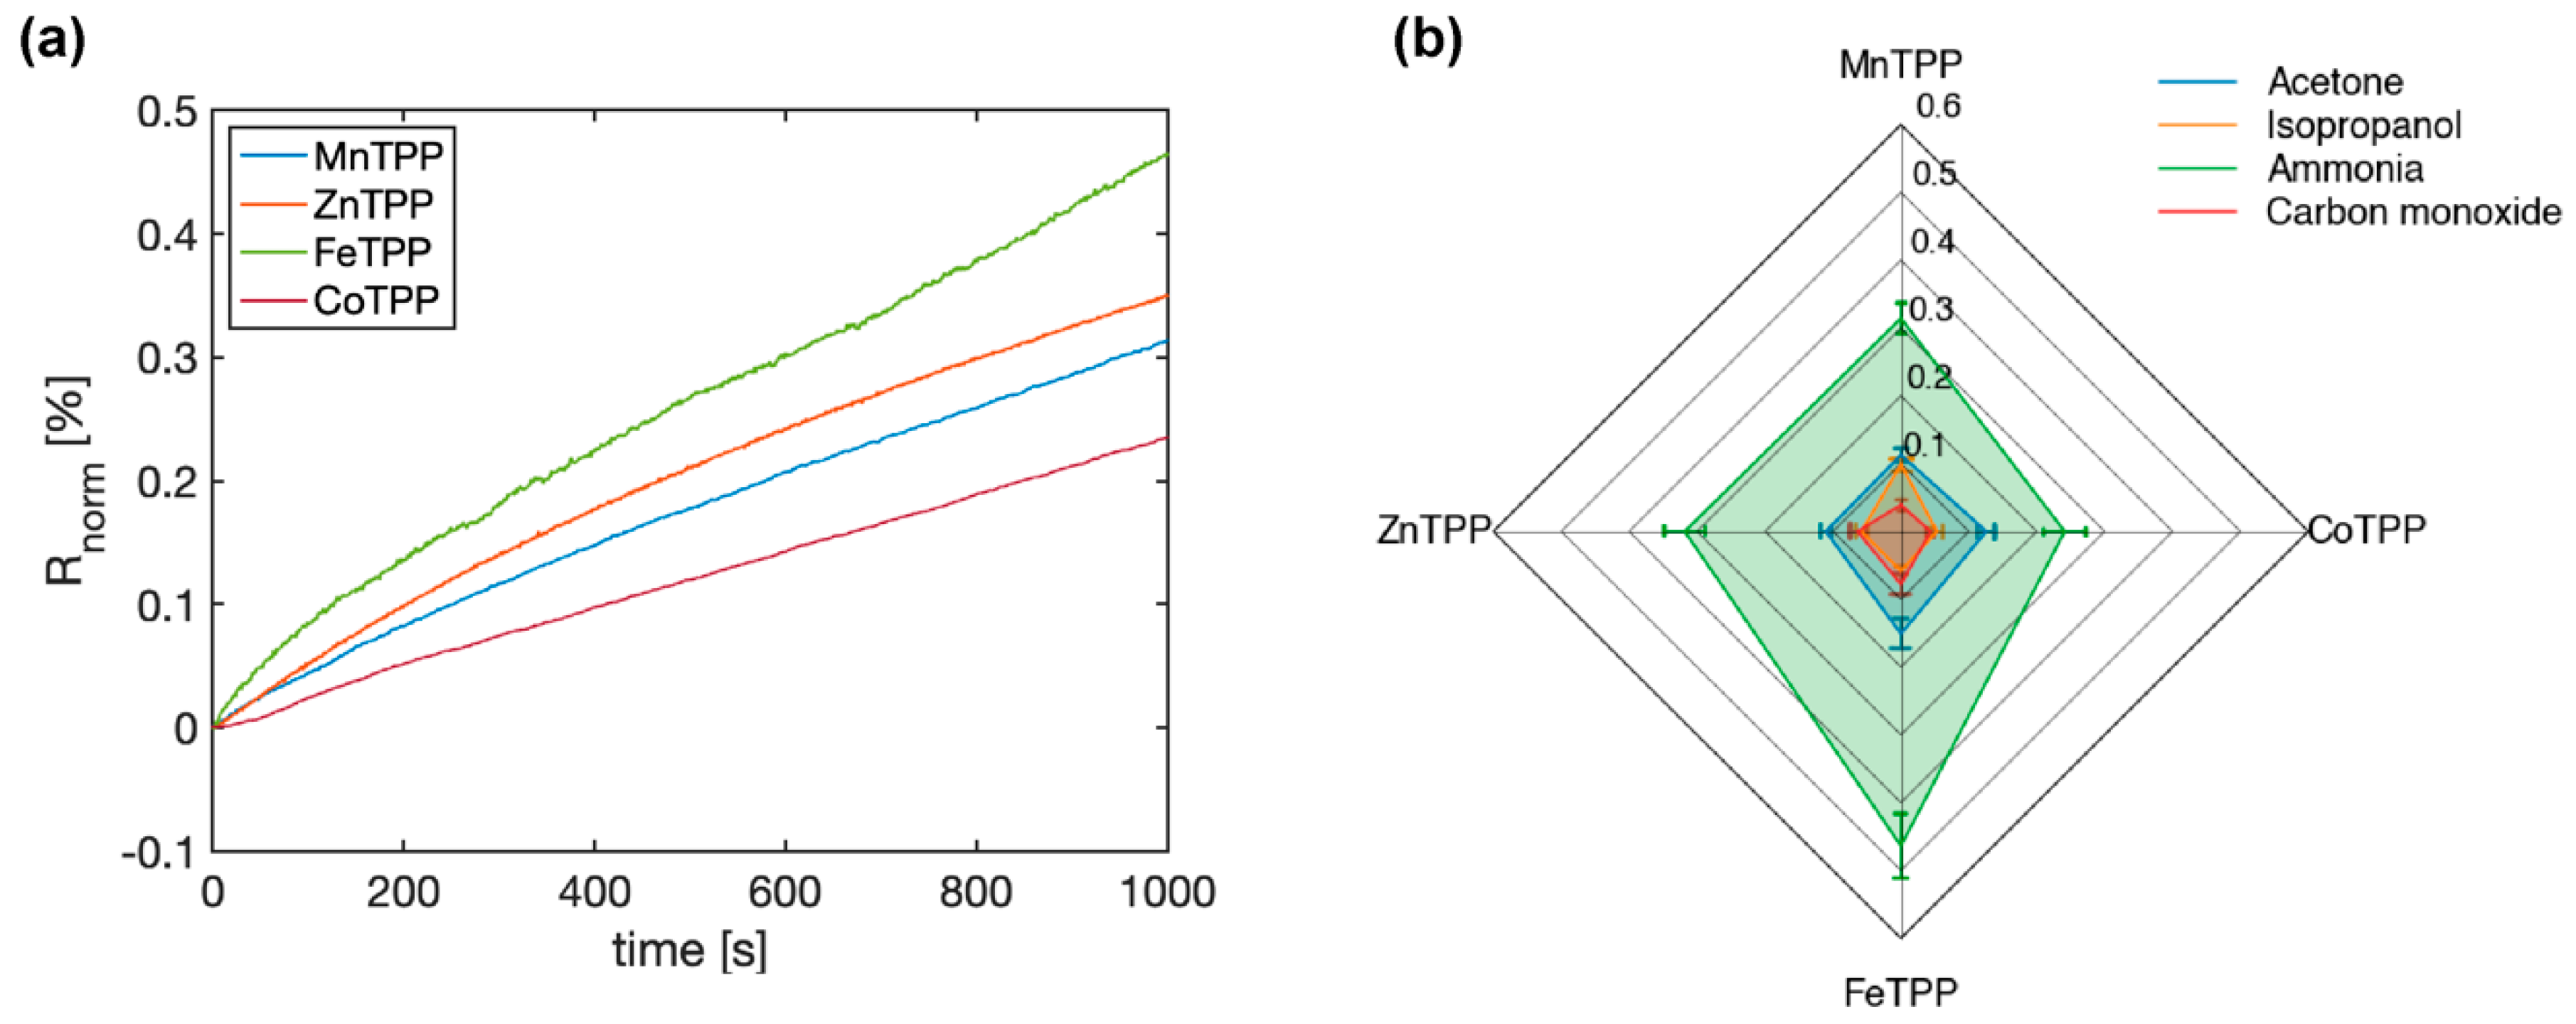
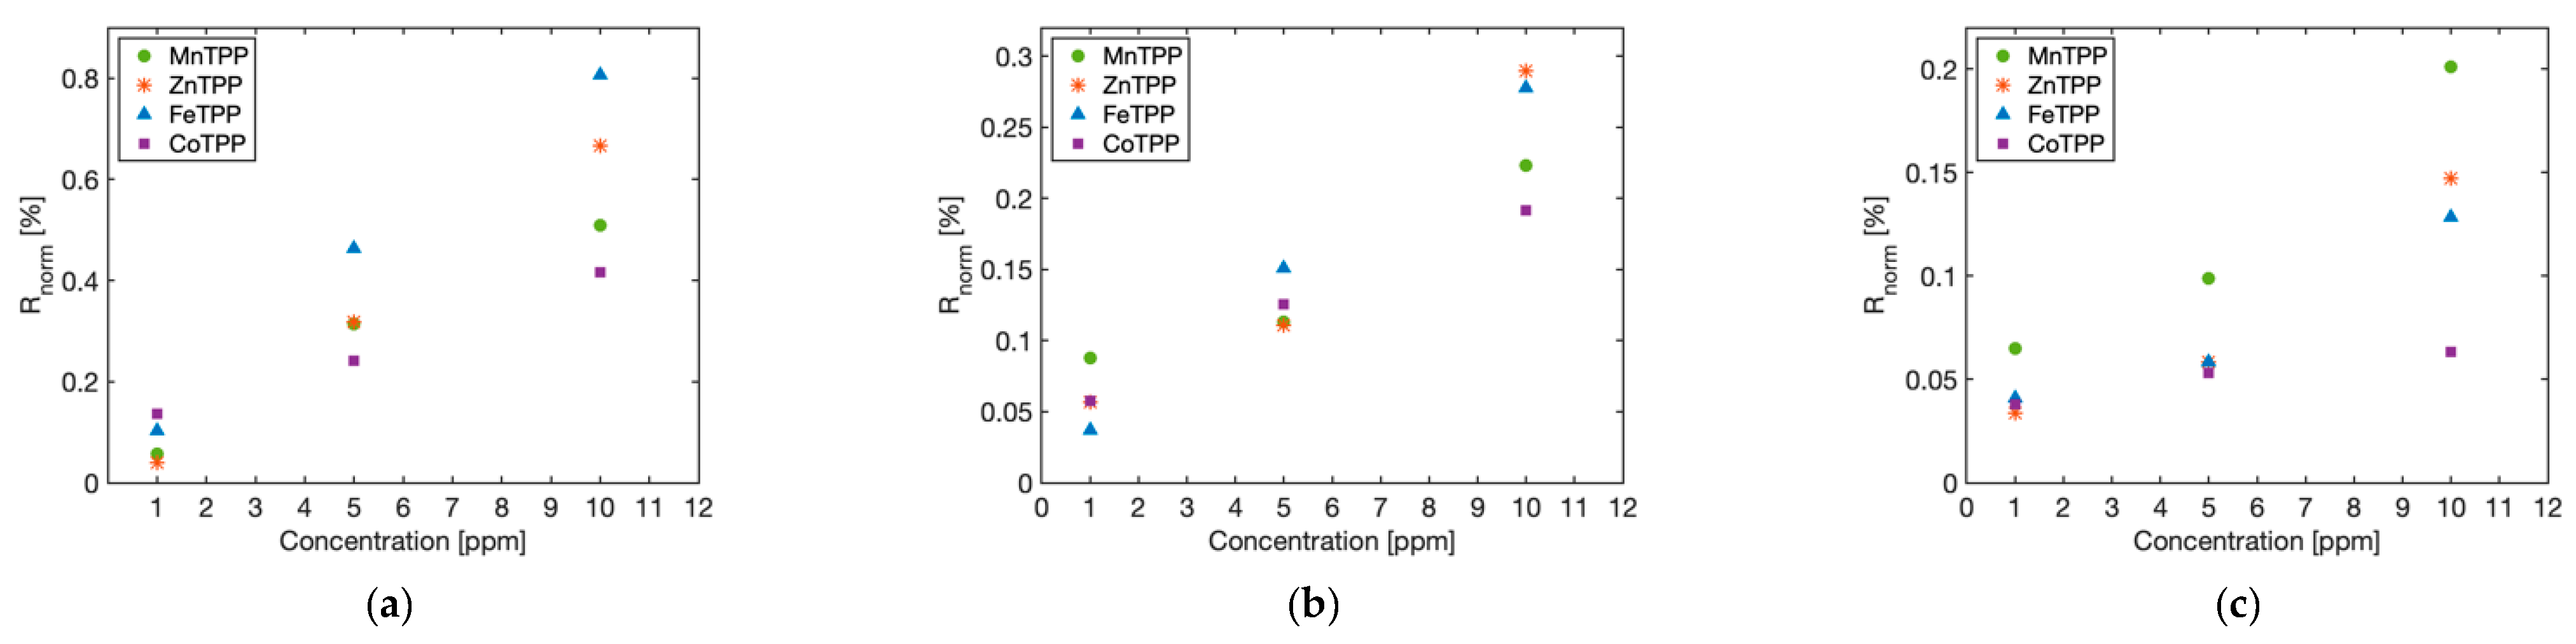
3.2. RGO–Metalloporphyrin Sensors Showed Unique Sensing Responses upon Exposure to VOCs

The VOC-sensing performance of RGO-based sensors was investigated by measuring the electrical resistance response when the sensors were exposed to four different gas analytes. As mentioned in Section 2.4., three different VOCs of acetone, isopropanol, and ammonia, and carbon monoxide were considered. Concentrations of breath biomarkers are summarized in Table 1. Acetone and isopropanol have been reported as VOC biomarkers for diabetes. High levels of acetone exhalation have been reported in type 1 diabetes (2200–21,000 ppb) when compared with healthy individuals (500–2000 ppb) [2,47]. Isopropanol is a byproduct of acetone metabolism which is induced upon excess ketone production that can occur due to reduced glucose levels in the liver of diabetic patients with insulin deficiency or insulin resistance [48,49]. Ammonia in the exhaled breath of chronic kidney disease patients is associated with high levels of blood urea nitrogen [50]. In a healthy liver, ammonia and ammonium ions are converted into urea. On the other hand, urea is unable to be removed in renal patients, resulting in excessive ammonia buildup. Carbon monoxide has been reported as an indicator of chronic obstructive pulmonary disease [51]. In addition, healthy smokers had higher carbon monoxide concentrations (17.13 ± 8.5 ppm) compared with healthy non-smokers (3.61 ± 2.15 ppm) [52].
Figure 5a shows a representative sensing response of four different RGO–metalloporphyrin films subjected to 5 ppm of ammonia. Rnorm increased as all sensors were exposed to ammonia. The slope of the transient response curve varied among the four different sensors indicating different ammonia sensitivities. The Rnorm values (t~1000 s) of RGO–metalloporphyrin sensors in four different gas analytes are shown in a radar plot (Figure 5b) indicating the unique sensing responses of the sensors to different gaseous compounds. Figure 6 shows the sensing responses of four different RGO–metalloporphyrin sensors under three different concentrations of gas analytes. A monotonic increase in Rnorm was observed upon exposure of each sensor to higher gas analyte concentrations. The correlation coefficients (CC) of Rnorm and VOC concentration were calculated to measure the strength of their linear relationship. The CCs of all four sensors were > 0.97, showing a linear relationship between Rnorm and VOC concentration.

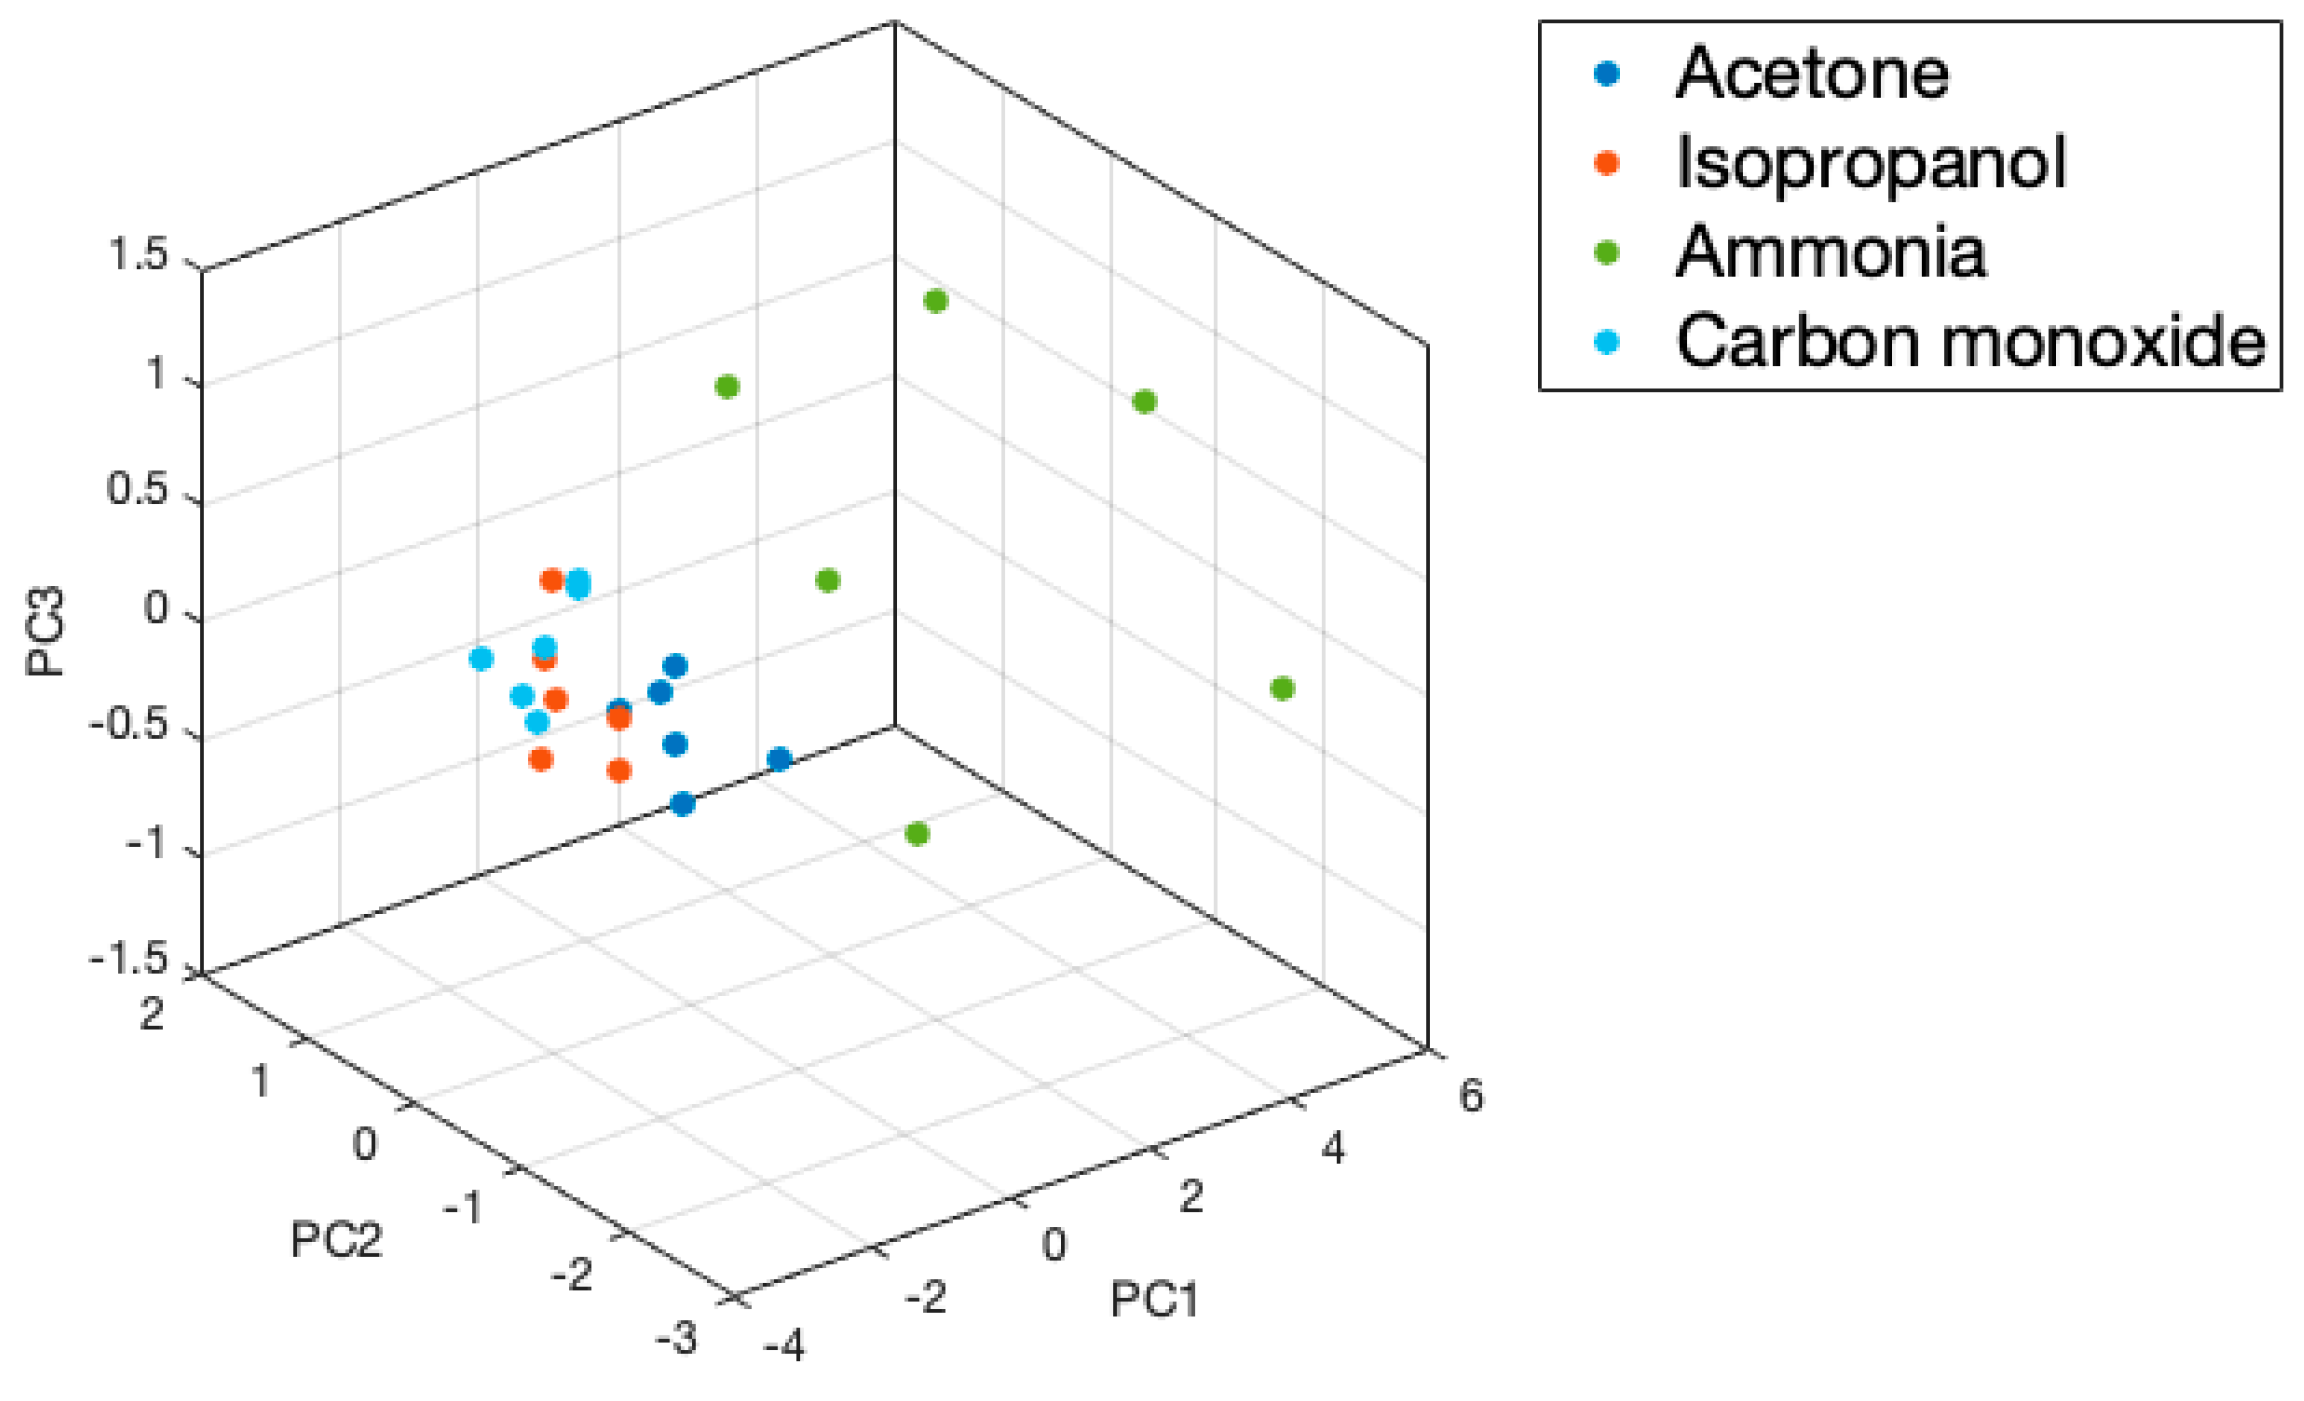
3.3. RGO Sensors Enabled Accurate VOC Classification Using Machine Learning

The sensing response curves (Figure 5a) from each sensor were used to calculate two different features for pattern recognition analysis: Rnorm at t ~ 1000 s and the integral area under the curve (Area) from gas injection to t ~ 1000 s. Four different sensors in the sensor array were tested with 5 ppm of acetone, isopropanol, and ammonia, and 17 ppm of carbon monoxide, which are within the concentration ranges of disease breath (Table 1), and six data points were collected for each gas analyte. PCA plots are shown in Figure 7. PC 1, PC2, and PC 3 explained 88.83%, 7.48%, and 2.35% of the variance, respectively. It should be noted that, before the dimension reduction, z-score normalization was conducted to remove the scale differences between different features.
After the sensing data visualization, three different ML algorithms (LR, SVM, and ANN) were applied for gas classification. The classification performance results of the LR, SVM, and ANN using 3-fold cross-validation are summarized in Table 2. All ML models showed great performance for distinguishing ammonia, with accuracies and an F1-score both of 1.0. This is due to the overall high sensitivity of the RGO–metalloporphyrin sensors to ammonia, as mentioned in Section 3.2. The classification performance for the other three gas analytes was varied among different classification methods. In general, the SVM and ANN models outperformed the LR model. The SVM distinguished acetone better than the others with an accuracy and F1-score both of 1.0, although it is expected that its performance will drop when more data closer to boundary conditions will be collected. The SVM and ANN models showed comparable performance for isopropanol and carbon monoxide detection with an F1-score > 0.83.
Since the number of datasets was limited, the F1-score classification performance was evaluated on bootstrapped samples to improve the robustness of the classification models [54]. First, the dataset was randomly split into 3 folds. Then, 1000 training datasets of equal sizes (n = 16) were generated through sampling by replacement. A classification model was built from each training dataset with F1-score results summarized in Figure S2. Consistent results with the 3-fold cross-validation can be found; for example, SVM performed better than the other two classification methods for acetone detection, with a mean F1-score of 1. All three classification models were able to successfully classify ammonia with a mean F1-score of 1. For isopropanol and carbon monoxide detection, SVM showed great performance with a mean F1-score of 1, but a considerable variation can be seen.

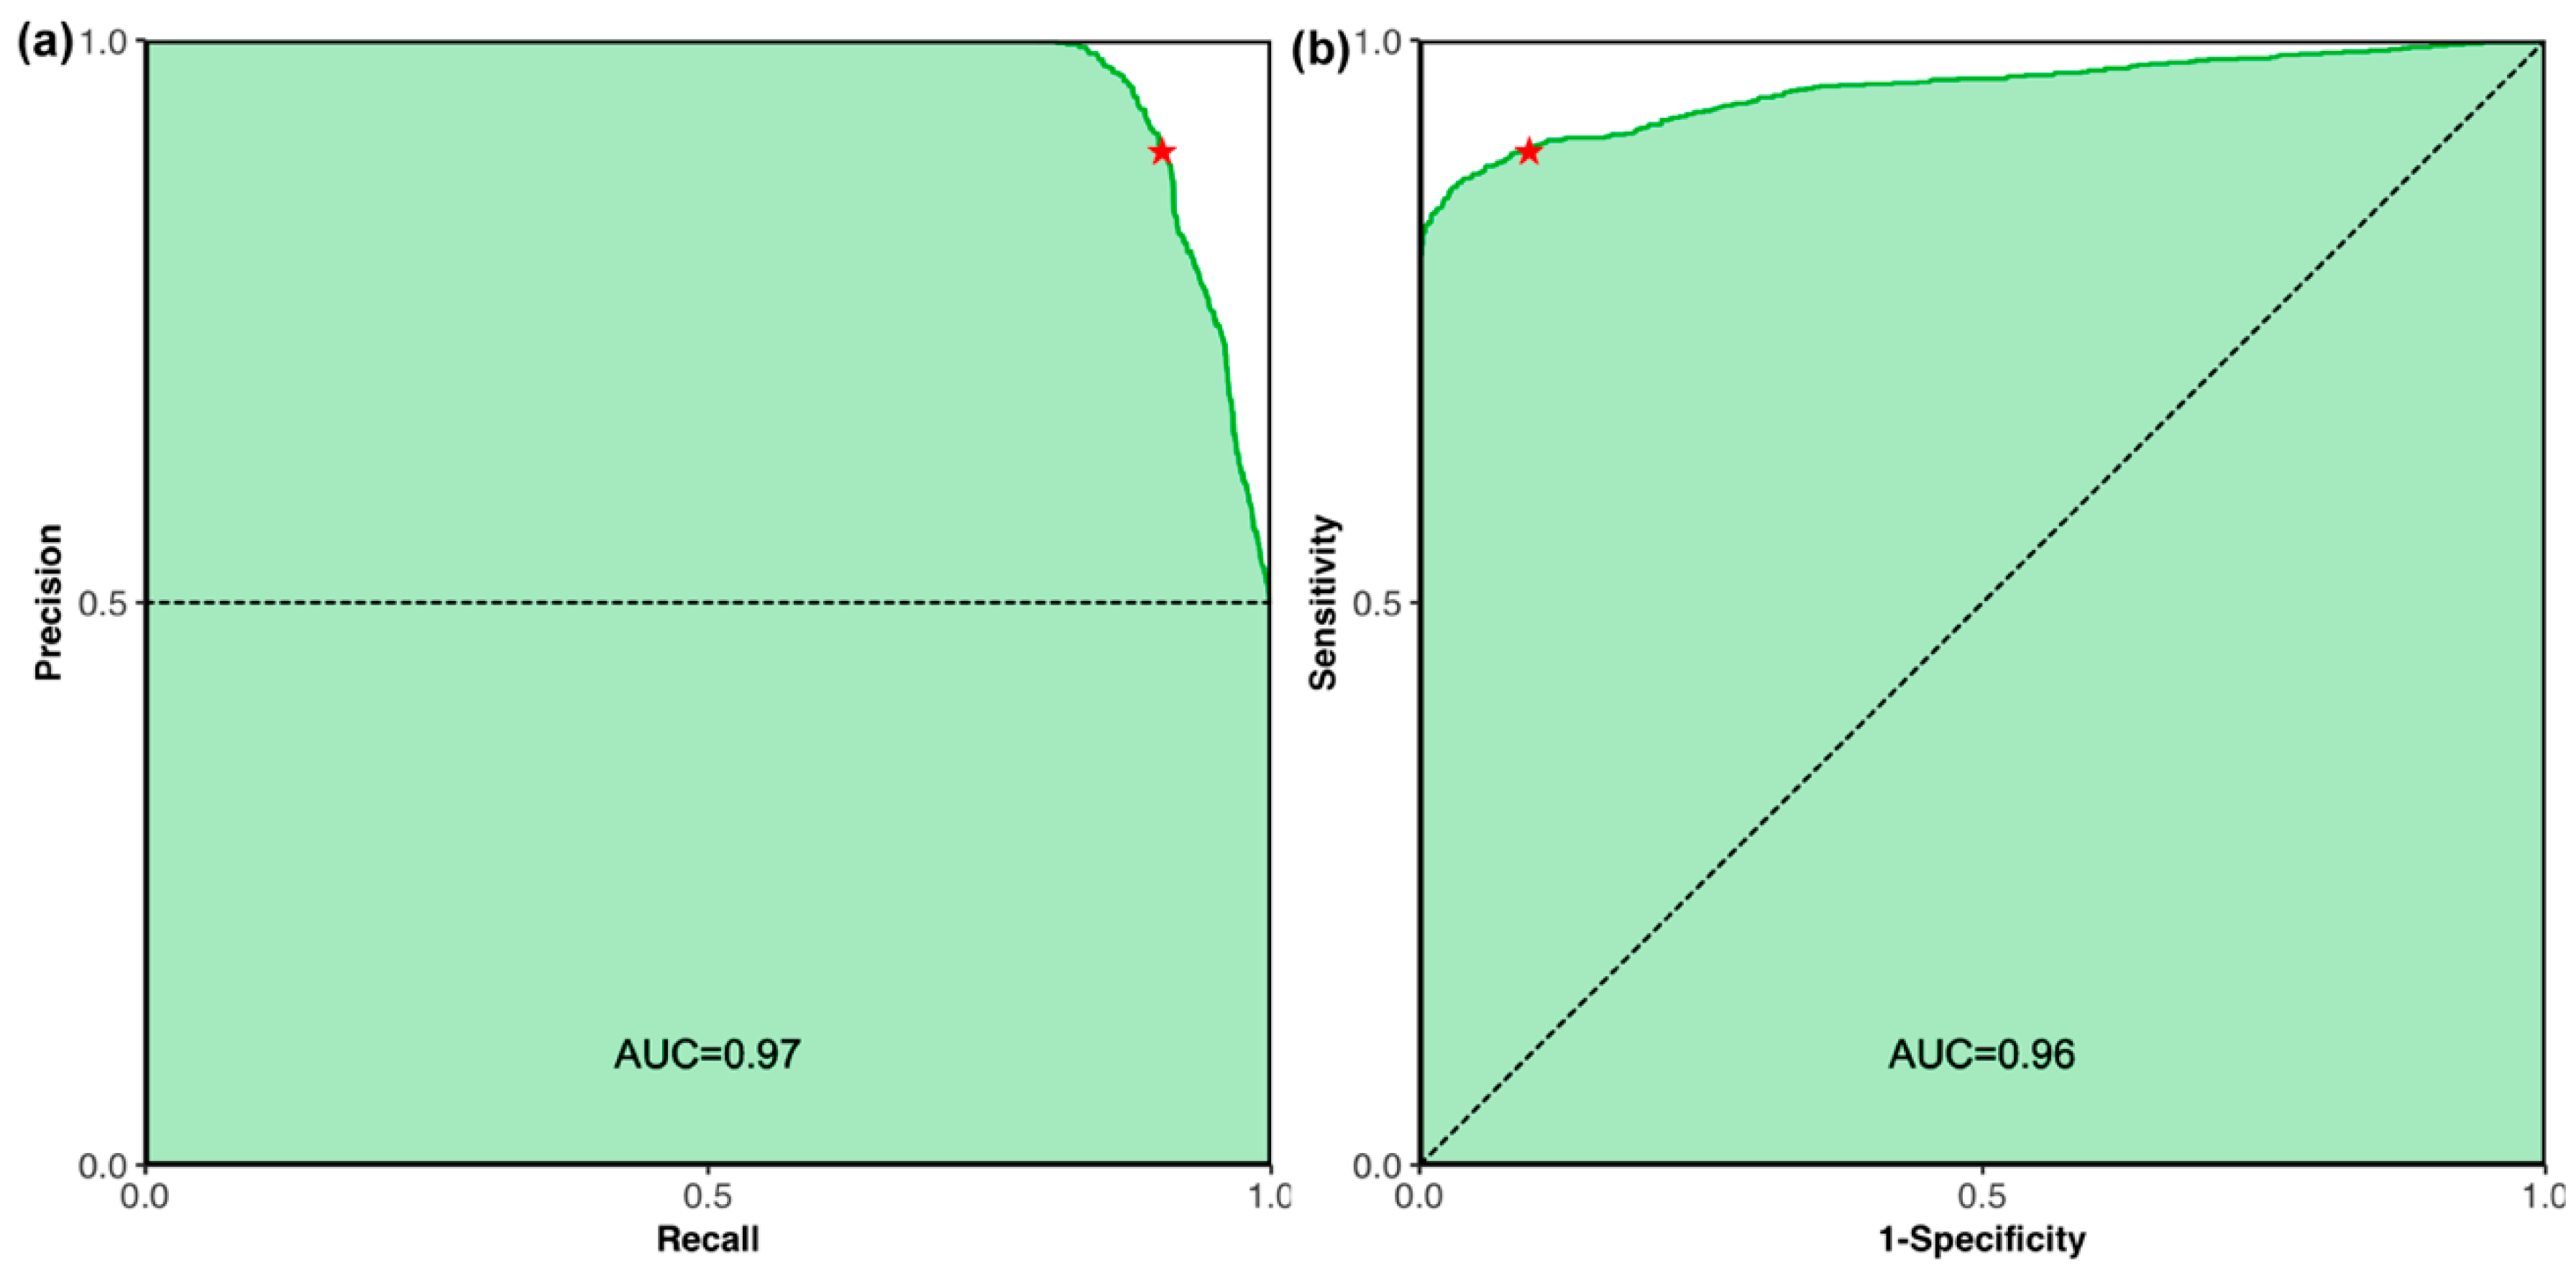
3.4. RGO Sensors with ML Algorithms Can Discriminate the Healthy and Unhealthy Samples with 91.7% Accuracy

An ML-based chronic kidney disease classifier was derived for discriminating healthy and unhealthy groups. First, ammonia concentrations were generated for 334 healthy and 334 unhealthy samples given the mean and SD of normal distributions (healthy: mean = 0.356 ppm, SD = 0.300; unhealthy: mean = 3.863 ppm, SD = 2.6855). Next, the Rnorm values of the sensors at each ammonia concentration were generated using a regressor for each sensor trained based on our experiments (Table S2). Finally, white noise was added to generate three samples for each Rnorm, given the average SD of sensor signal at the same concentration in the lab.
Based on this dataset, an SVM classifier was trained with a linear kernel that successfully discriminated healthy vs. unhealthy individuals using the sensor signal intensities (Rnorm) with a 91.7% accuracy under 5-fold cross-validation settings. Figure 8 illustrates the corresponding Precision-Recall and Receiver Operating Characteristic (ROC) curves with 0.97 and 0.96 as the areas under the curves (AUC) and an F1-score of 0.92.

4. Discussion

In this study, room-temperature-operating RGO–metalloporphyrin VOC sensors were assembled using a simple and low-cost fabrication method. The RGO thin films were noncovalently functionalized by metalloporphyrin molecules via π–π stacking (Figure 9a). We showed the cross-sensing behavior of RGO–metalloporphyrin sensors when exposed to the disease-related VOCs in human breath. Different sensing properties of the RGO–metalloporphyrin sensors were enabled by different metalloporphyrin molecules (Figure 9b). To be specific, metalloporphyrin with different transition metals at the center of the porphyrin ring provided different sensitivity and selectivity to different gas molecules through various interaction mechanisms of hydrogen bonds, polarization, and polarity interaction [55]. The sensors′ higher sensitivity to ammonia can be explained by the synergistic sensing behavior of RGO and metalloporphyrin. The RGO contains oxygen functional groups, including carboxyl, epoxides, and hydroxyl groups on the graphene sheets (Figure 9a). It was demonstrated that the oxygen functional groups effectively improve ammonia absorption on RGO films [56]. It should be mentioned that recovery response measurements were difficult with our static-sensing test setup because mechanical openings of the chamber door affected the electrical measurements. Future work will use a dynamic gas-sensing system, with mass flow controllers, to precisely control the gas flow for sensor recovery tests. The thickness of RGO thin films was ~10 μm. The thickness variation in μm-thick films is not expected to affect the sensing response because only the outer surface of the RGO films becomes active for gas detection reactions [57].
Unlike a selective VOC sensor, a cross-sensitive-type VOC sensor responds to multiple gaseous compounds, and selectivity is achieved through pattern recognition methods [21,58,59]. Therefore, finding an appropriate pattern recognition method is a crucial process to detect and discriminate gas analytes of interest [60]. Despite the importance of pattern recognition and classification analysis, many studies on nanomaterial-based cross-sensitive VOC sensors focused on designing the VOC sensors and visualizing the sensing data (mainly using PCA) [17,37,61,62,63], and integration with classification algorithms was limited. This study provided a set of processes that can be applied to develop VOC sensors and improve their VOC discrimination performance through a comparative study on different ML methods.
For pattern recognition analysis, we applied two different features (Rnorm and Area) from the sensing response curves of each sensor (eight features in total). Rnorm reflects the reaction degree change in sensors to gas, and Area describes a transient response feature that might represent the cumulative total of the reaction degree [64,65]. By considering different features (Rnorm and Area) from the response curve, information about different aspects of the reactions can be obtained [64]. PCA analysis showed that all eight features have comparable importance for explaining variability (see PC1 weights in Table S1), while Rnorm and Area of MnTPP showed slightly higher importance with PC1 weights of ~0.36. This implies that all four sensors and their features played an important role in explaining variance, and a single feature cannot be used solely for VOC discrimination [66].
ML algorithms of LR, SVM, and ANN were applied to detect three different VOCs and carbon monoxides, and their performance was compared. Three ML algorithms showed varied predictive performances suggesting the detection and discrimination capabilities of VOC sensors are affected by classification analysis, which should be carefully investigated for VOC sensor implementation. With the bootstrapped samples, SVM showed great performance distinguishing isopropanol and carbon monoxide with an F1-score of 1. However, considerable variation was observed, and the performance is clearly higher than what is expected due to the insufficient sample size and overfitting, despite using the necessary techniques (cross-validation and bootstrapping) to avoid it as much as possible [67]. More sample collection and the addition of sensing elements with different gas-sensing properties could improve the discrimination capabilities of the models [68]. We also derived an ML-based chronic kidney disease classifier to discriminate healthy vs. unhealthy groups. The results show that an SVM classifier with linear kernel could successfully distinguish healthy vs. unhealthy individuals with a 91.7% accuracy. Future work will build on the presented preliminary results to test our RGO–metalloporphyrin sensors with real human breath.

Supplementary Materials

The following are available online at https://www.mdpi.com/article/10.3390/app112311290/s1: Figure S1: Dimensions of the interdigitated electrode; Table S1: PCA weights; Figure S2: F1-score results of bootstrapped samples for (a) acetone, (b) isopropanol, (c) ammonia, and (d) carbon monoxide classification; Table S2: Rnorm (%) of four different RGO–metalloporphyrin films at different ammonia concentrations.

Author Contributions

B.M.L.: methodology, sensor development, experimental validation, data analysis (sensing property characterization, ML algorithms), writing—original draft preparation, writing—review and editing, visualization. A.E.: data analysis (ML algorithms), writing—review and editing. I.T.: project administration, conceptualization, writing—review and editing. All authors have read and agreed to the published version of the manuscript.

Funding

This work was supported by the NSF-NIFA/NSF AI Institute for Next Generation Food Systems, United States Department of Agriculture (USDA), National Institute of Food and Agriculture (NIFA) award number 2020-67021-32855 and NSF award 1743101 to I.T.

Institutional Review Board Statement

Not applicable.

Informed Consent Statement

Not applicable.

Data Availability Statement

The data presented in this study are available within the article or Supplementary Materials.

Conflicts of Interest

The authors declare no conflict of interest.

References

  1. de Lacy Costello, B.; Amann, A.; Al-Kateb, H.; Flynn, C.; Filipiak, W.; Khalid, T.; Osborne, D.; Ratcliffe, N.M. A review of the volatiles from the healthy human body. J. Breath Res. 2014, 8, 014001. [Google Scholar] [CrossRef]
  2. Das, S.; Pal, S.; Mitra, M. Significance of exhaled breath test in clinical diagnosis: A special focus on the detection of diabetes mellitus. J. Med. Biol. Eng. 2016, 36, 605–624. [Google Scholar] [CrossRef] [Green Version]
  3. Phillips, M.; Cataneo, R.N.; Condos, R.; Erickson, G.A.R.; Greenberg, J.; La Bombardi, V.; Munawar, M.I.; Tietje, O. Volatile biomarkers of pulmonary tuberculosis in the breath. Tuberculosis 2007, 87, 44–52. [Google Scholar] [CrossRef] [PubMed]
  4. Shigeyama, H.; Wang, T.; Ichinose, M.; Ansai, T.; Lee, S.-W. Identification of volatile metabolites in human saliva from patients with oral squamous cell carcinoma via zeolite-based thin-film microextraction coupled with GC–MS. J. Chromatogr. B 2019, 1104, 49–58. [Google Scholar] [CrossRef]
  5. Yan, Y.; Wang, Q.; Li, W.; Zhao, Z.; Yuan, X.; Huang, Y.; Duan, Y. Discovery of potential biomarkers in exhaled breath for diagnosis of type 2 diabetes mellitus based on GC-MS with metabolomics. RSC Adv. 2014, 4, 25430–25439. [Google Scholar] [CrossRef]
  6. Karl, T.; Prazeller, P.; Mayr, D.; Jordan, A.; Rieder, J.; Fall, R.; Lindinger, W. Human breath isoprene and its relation to blood cholesterol levels: New measurements and modeling. J. Appl. Physiol. 2001, 91, 762–770. [Google Scholar] [CrossRef] [PubMed] [Green Version]
  7. Smolinska, A.; Bodelier, A.G.L.; Dallinga, J.W.; Masclee, A.A.M.; Jonkers, D.M.; Van Schooten, F.-J.; Pierik, M.J. The potential of volatile organic compounds for the detection of active disease in patients with ulcerative colitis. Aliment. Pharmacol. Ther. 2017, 45, 1244–1254. [Google Scholar] [CrossRef] [PubMed]
  8. Kim, I.-D.; Choi, S.-J.; Kim, S.-J.; Jang, J.-S. Exhaled Breath Sensors. In KAIST Research Series; Springer: Singapore, 2015; pp. 19–49. [Google Scholar]
  9. Amal, H.; Haick, H. Chapter 14-Point of care breath analysis systems. In Advanced Nanomaterials for Inexpensive Gas Microsensors; Llobet, E., Ed.; Elsevier: Amsterdam, The Netherlands, 2020; pp. 315–334. [Google Scholar]
  10. El Manouni el Hassani, S.; Berkhout, D.J.C.; Bosch, S.; Benninga, M.A.; De Boer, N.K.H.; De Meij, T.G.J. Application of fecal volatile organic compound analysis in clinical practice: Current state and future perspectives. Chemosensors 2018, 6, 29. [Google Scholar] [CrossRef] [Green Version]
  11. Kumar, S.; Huang, J.; Abbassi-Ghadi, N.; Spanel, P.; Smith, D.; Hanna, G.B. Selected ion flow tube mass spectrometry analysis of exhaled breath for volatile organic compound profiling of esophago-gastric cancer. Anal. Chem. 2013, 85, 6121–6128. [Google Scholar] [CrossRef]
  12. Fedrigo, M.; Hoeschen, C.; Oeh, U. Multidimensional statistical analysis of PTR-MS breath samples: A test study on irradiation detection. Int. J. Mass Spectrom. 2010, 295, 13–20. [Google Scholar] [CrossRef]
  13. Lapthorn, C.; Pullen, F.; Chowdhry, B.Z. Ion mobility spectrometry-mass spectrometry (IMS-MS) of small molecules: Separating and assigning structures to ions. Mass Spectrom. Rev. 2013, 32, 43–71. [Google Scholar] [CrossRef] [PubMed] [Green Version]
  14. Fu, X.-A.; Li, M.; Knipp, R.J.; Nantz, M.H.; Bousamra, M. Noninvasive detection of lung cancer using exhaled breath. Cancer Med. 2014, 3, 174–181. [Google Scholar] [CrossRef] [PubMed]
  15. Paolesse, R.; Nardis, S.; Monti, D.; Stefanelli, M.; Di Natale, C. Porphyrinoids for chemical sensor applications. Chem. Rev. 2017, 117, 2517–2583. [Google Scholar] [CrossRef] [Green Version]
  16. Lin, H.; Jang, M.; Suslick, K.S. Preoxidation for Colorimetric sensor array detection of VOCs. J. Am. Chem. Soc. 2011, 133, 16786–16789. [Google Scholar] [CrossRef] [Green Version]
  17. Penza, M.; Cassano, G.; Aversa, P.; Cusano, A.; Cutolo, A.; Giordano, M.; Nicolais, L. Carbon nanotube acoustic and optical sensors for volatile organic compound detection. Nanotechnology 2005, 16, 2536–2547. [Google Scholar] [CrossRef]
  18. Nazemi, H.; Joseph, A.; Park, J.; Emadi, A. Advanced micro- and nano-gas sensor technology: A Review. Sensors 2019, 19, 1285. [Google Scholar] [CrossRef] [PubMed] [Green Version]
  19. Zhou, L.; Shen, F.; Tian, X.; Wang, D.; Zhang, T.; Chen, W. Stable Cu2O nanocrystals grown on functionalized graphene sheets and room temperature H2S gas sensing with ultrahigh sensitivity. Nanoscale 2013, 5, 1564–1569. [Google Scholar] [CrossRef]
  20. Machado, R.; Laskowski, D.; Deffenderfer, O.; Burch, T.; Zheng, S.; Mazzone, P.J.; Mekhail, T.; Jennings, C.; Stoller, J.K.; Pyle, J.; et al. Detection of lung cancer by sensor array analyses of exhaled breath. Am. J. Respir. Crit. Care Med. 2005, 171, 1286–1291. [Google Scholar] [CrossRef] [PubMed] [Green Version]
  21. Vishinkin, R.; Haick, H. Nanoscale sensor technologies for disease detection via volatolomics. Small 2015, 11, 6142–6164. [Google Scholar] [CrossRef] [PubMed]
  22. Wu, Y.; Huo, D.; Hou, C.; Fa, H.; Yang, M.; Luo, X. Colorimetric artificial nose for identification of breath volatile organic compounds of patients with lung cancer. Chem. Res. Chin. Univ. 2014, 30, 572–577. [Google Scholar] [CrossRef]
  23. Shlomi, D.; Abud, M.; Liran, O.; Bar, J.; Gai-Mor, N.; Ilouze, M.; Onn, A.; Ben-Nun, A.; Haick, H.; Peled, N. Detection of lung cancer and EGFR mutation by electronic nose system. J. Thorac. Oncol. 2017, 12, 1544–1551. [Google Scholar] [CrossRef] [Green Version]
  24. Barash, O.; Peled, N.; Tisch, U.; Bunn, P.A.; Hirsch, F.R.; Haick, H. Classification of lung cancer histology by gold nanoparticle sensors. Nanomed. Nanotechnol. Biol. Med. 2012, 8, 580–589. [Google Scholar] [CrossRef] [PubMed] [Green Version]
  25. Xu, Y.; Lee, H.; Hu, Y.; Huang, J.; Kim, S.; Yun, M. Detection and identification of breast cancer volatile organic compounds biomarkers using highly-sensitive single nanowire array on a chip. J. Biomed. Nanotechnol. 2013, 9, 1164–1172. [Google Scholar] [CrossRef] [Green Version]
  26. Srimathi, U.; Nagarajan, V.; Chandiramouli, R. Germanane nanosheet as a novel biosensor for liver cirrhosis based on adsorption of biomarker volatiles–A DFT study. Appl. Surf. Sci. 2019, 475, 990–998. [Google Scholar] [CrossRef]
  27. Hakim, M.; Billan, S.; Tisch, U.; Peng, G.; Dvrokind, I.; Marom, O.; Abdah-Bortnyak, R.; Kuten, A.; Haick, H. Diagnosis of head-and-neck cancer from exhaled breath. Br. J. Cancer 2011, 104, 1649–1655. [Google Scholar] [CrossRef] [PubMed] [Green Version]
  28. Salehi, S.; Nikan, E.; Khodadadi, A.A.; Mortazavi, Y. Highly sensitive carbon nanotubes–SnO2 nanocomposite sensor for acetone detection in diabetes mellitus breath. Sens. Actuators B Chem. 2014, 205, 261–267. [Google Scholar] [CrossRef]
  29. Arasaradnam, R.P.; Covington, J.; Harmston, C.; Nwokolo, C.U. Review article: Next generation diagnostic modalities in gastroenterology-gas phase volatile compound biomarker detection. Aliment. Pharmacol. Ther. 2014, 39, 780–789. [Google Scholar] [CrossRef] [PubMed]
  30. Marom, O.; Nakhoul, F.; Tisch, U.; Shiban, A.; Abassi, Z.; Haick, H. Gold nanoparticle sensors for detecting chronic kidney disease and disease progression. Nanomedicine 2012, 7, 639–650. [Google Scholar] [CrossRef] [PubMed]
  31. Tisch, U.; Schlesinger, I.; Ionescu, R.; Nassar, M.; Axelrod, N.; Robertman, D.; Tessler, Y.; Azar, F.; Marmur, A.; Aharon-Peretz, J.; et al. Detection of Alzheimer’s and Parkinson’s disease from exhaled breath using nanomaterial-based sensors. Nanomedicine 2013, 8, 43–56. [Google Scholar] [CrossRef]
  32. Zhou, X.; Xue, Z.; Chen, X.-Y.; Huang, C.; Bai, W.; Lu, Z.; Wang, T. Nanomaterial-based gas sensors used for breath diagnosis. J. Mater. Chem. B 2020, 8, 3231–3248. [Google Scholar] [CrossRef]
  33. Feng, S.; Farha, F.; Li, Q.; Wan, Y.; Xu, Y.; Zhang, T.; Ning, H. Review on smart gas sensing technology. Sensors 2019, 19, 3760. [Google Scholar] [CrossRef] [Green Version]
  34. Lim, S.H.; Feng, L.; Kemling, J.W.; Musto, C.J.; Suslick, K.S. An optoelectronic nose for the detection of toxic gases. Nat. Chem. 2009, 1, 562–567. [Google Scholar] [CrossRef] [Green Version]
  35. Buff, W. SAW sensors. Sens. Actuator A Phys. 1992, 30, 117–121. [Google Scholar] [CrossRef]
  36. Kim, B.-Y.; Yoon, J.-W.; Kim, J.K.; Kang, Y.C.; Lee, J.-H. Dual role of multiroom-structured Sn-doped NiO microspheres for ultrasensitive and highly selective detection of xylene. ACS Appl. Mater. Interfaces 2018, 10, 16605–16612. [Google Scholar] [CrossRef] [PubMed]
  37. Liu, S.F.; Moh, L.C.H.; Swager, T.M. Single-Walled Carbon Nanotube–Metalloporphyrin chemiresistive gas sensor arrays for volatile organic compounds. Chem. Mater. 2015, 27, 3560–3563. [Google Scholar] [CrossRef] [Green Version]
  38. Güder, F.; Ainla, A.; Redston, J.; Mosadegh, B.; Glavan, A.; Martin, T.J.; Whitesides, G.M. Paper-based electrical respiration sensor. Angew. Chem. Int. Ed. 2016, 55, 5727–5732. [Google Scholar] [CrossRef] [Green Version]
  39. De Silva, K.K.H.; Huang, H.-H.; Yoshimura, M. Progress of reduction of graphene oxide by ascorbic acid. Appl. Surf. Sci. 2018, 447, 338–346. [Google Scholar] [CrossRef]
  40. Mirzaei, A.; Kim, S.S.; Kim, H.W. Resistance-based H2S gas sensors using metal oxide nanostructures: A review of recent advances. J. Hazard Mater. 2018, 357, 314–331. [Google Scholar] [CrossRef] [PubMed]
  41. Kleinbaum, D.G.; Klein, M. Logistic Regression; Springer: New York, NY, USA, 2010. [Google Scholar]
  42. Schlkopf, B.; Smola, A.J. Learning with Kernels: Support. Vector Machines, Regularization, Optimization, and Beyond; The MIT Press: London, UK, 2002. [Google Scholar]
  43. Aggarwal, C.C. Neural Networks and Deep Learning; Springer: New York, NY, USA, 2018; Volume 10. [Google Scholar]
  44. Ting, K.M. Confusion Matrix. In Encyclopedia of Machine Learning; Sammut, C., Webb, G.I., Eds.; Springer: Boston, MA, USA, 2010; p. 209. [Google Scholar]
  45. Schönermarck, U.; Dengler, C.; Gmeinwieser, A.; Praun, S.; Schelling, G.; Fischereder, M.; Boulesteix, A.-L.; Dolch, M.E. Exhaled breath volatile organic and inorganic compound composition in end-stage renal disease. Clin. Nephrol. 2016, 86, 132–140. [Google Scholar] [CrossRef]
  46. Wang, M.; Wang, Q.; Zhu, W.; Yang, Y.; Zhou, H.; Zhang, F.; Zhou, L.; Razal, J.M.; Wallace, G.; Chen, J. Metal porphyrin intercalated reduced graphene oxide nanocomposite utilized for electrocatalytic oxygen reduction. Green Energy Environ. 2017, 2, 285–293. [Google Scholar] [CrossRef]
  47. Anderson, J.C.; Lamm, W.J.E.; Hlastala, M.P. Measuring airway exchange of endogenous acetone using a single-exhalation breathing maneuver. J. Appl. Physiol. 2006, 100, 880–889. [Google Scholar] [CrossRef] [PubMed] [Green Version]
  48. Li, W.; Liu, Y.; Liu, Y.; Cheng, S.; Duan, Y. Exhaled isopropanol: New potential biomarker in diabetic breathomics and its metabolic correlations with acetone. RSC Adv. 2017, 7, 17480–17488. [Google Scholar] [CrossRef] [Green Version]
  49. E Jones, A.; Summers, R.L. Detection of isopropyl alcohol in a patient with diabetic ketoacidosis. J. Emerg. Med. 2000, 19, 165–168. [Google Scholar] [CrossRef]
  50. Krishnan, S.T.; Devadhasan, J.P.; Kim, S. Recent analytical approaches to detect exhaled breath ammonia with special reference to renal patients. Anal. Bioanal. Chem. 2016, 409, 21–31. [Google Scholar] [CrossRef] [PubMed]
  51. Ryter, S.W.; Sethi, J.M. Exhaled carbon monoxide as a biomarker of inflammatory lung disease. J. Breath Res. 2007, 1, 026004. [Google Scholar] [CrossRef]
  52. Deveci, S.; Deveci, F.; Açik, Y.; Ozan, A. The measurement of exhaled carbon monoxide in healthy smokers and non-smokers. Respir. Med. 2004, 98, 551–556. [Google Scholar] [CrossRef] [Green Version]
  53. Trefz, P.; Obermeier, J.; Lehbrink, R.; Schubert, J.K.; Miekisch, W.; Fischer, D.-C. Exhaled volatile substances in children suffering from type 1 diabetes mellitus: Results from a cross-sectional study. Sci. Rep. 2019, 9, 15707. [Google Scholar] [CrossRef] [PubMed]
  54. Balasubramanian, S.; Panigrahi, S.; Logue, C.M.; Marchello, M.; Doetkott, C.; Gu, H.; Sherwood, J.; Nolan, L. Spoilage identification of beef using an electronic nose system. Trans. ASAE 2004, 47, 1625–1633. [Google Scholar] [CrossRef]
  55. Di Natale, C.; Paolesse, R.; Damico, A. Metalloporphyrins based artificial olfactory receptors. Sens. Actuators B Chem. 2007, 121, 238–246. [Google Scholar] [CrossRef]
  56. Minitha, C.R.; Anithaa, V.S.; Subramaniam, V.; Kumar, R.T.R. Impact of oxygen functional groups on reduced graphene oxide-based sensors for ammonia and toluene detection at room temperature. ACS Omega 2018, 3, 4105–4112. [Google Scholar] [CrossRef]
  57. Becker, T.; Ahlers, S.; Bosch-V.Braunmühl, C.; Müller, G.; Kiesewetter, O. Gas sensing properties of thin- and thick-film tin-oxide materials. Sens. Actuators B Chem. 2001, 77, 55–61. [Google Scholar] [CrossRef]
  58. Albert, K.J.; Lewis, N.S.; Schauer, C.L.; Sotzing, G.A.; Stitzel, S.E.; Vaid, T.; Walt, D.R. Cross-reactive chemical sensor arrays. Chem. Rev. 2000, 100, 2595–2626. [Google Scholar] [CrossRef] [PubMed]
  59. Nasiri, N.; Clarke, C. Nanostructured chemiresistive gas sensors for medical applications. Sensors 2019, 19, 462. [Google Scholar] [CrossRef] [PubMed] [Green Version]
  60. Fu, J.; Li, G.; Qin, Y.; Freeman, W.J. A pattern recognition method for electronic noses based on an olfactory neural network. Sens. Actuators B Chem. 2007, 125, 489–497. [Google Scholar] [CrossRef] [Green Version]
  61. Kim, S.-J.; Choi, S.-J.; Jang, J.-S.; Cho, H.-J.; Kim, I.-D. Innovative nanosensor for disease diagnosis. Acc. Chem. Res. 2017, 50, 1587–1596. [Google Scholar] [CrossRef] [PubMed]
  62. Cho, B.; Lee, K.; Pyo, S.; Kim, J. Fabrication and characterization of VOC sensor array based on SnO2 and ZnO nanoparticles functionalized by metalloporphyrins. Micro Nano Syst. Lett. 2018, 6, 10. [Google Scholar] [CrossRef]
  63. Liu, Z.; Yang, T.; Dong, Y.; Wang, X. A room temperature VOCs gas sensor based on a layer by layer multi-walled carbon nanotubes/poly-ethylene glycol composite. Sensors 2018, 18, 3113. [Google Scholar] [CrossRef] [Green Version]
  64. Yan, J.; Guo, X.; Duan, S.; Jia, P.; Wang, L.; Peng, C.; Zhang, S. Electronic nose feature extraction methods: A review. Sensors 2015, 15, 27804–27831. [Google Scholar] [CrossRef] [PubMed]
  65. Wei, Z.; Wang, J.; Zhang, W. Detecting internal quality of peanuts during storage using electronic nose responses combined with physicochemical methods. Food Chem. 2015, 177, 89–96. [Google Scholar] [CrossRef]
  66. Schroeder, V.; Evans, E.D.; Wu, Y.-C.M.; Voll, C.-C.A.; McDonald, B.R.; Savagatrup, S.; Swager, T.M. Chemiresistive sensor array and machine learning classification of food. ACS Sen. 2019, 4, 2101–2108. [Google Scholar] [CrossRef]
  67. Chen, D.-R.; Kuo, W.-J.; Chang, R.-F.; Moon, W.K.; Lee, C.C. Use of the bootstrap technique with small training sets for computer-aided diagnosis in breast ultrasound. Ultrasound Med. Biol. 2002, 28, 897–902. [Google Scholar] [CrossRef]
  68. Sun, H.; Tian, F.; Liang, Z.; Sun, T.; Yu, B.; Yang, S.X.; He, Q.; Zhang, L.; Liu, X. Sensor array optimization of electronic nose for detection of bacteria in wound infection. IEEE Trans. Ind. Electron. 2017, 64, 7350–7358. [Google Scholar] [CrossRef]
Figure 1. The fabrication process of an RGO–metalloporphyrin thin film is illustrated.
Applsci 11 11290 g001
Figure 2. An experimental setup and an RGO-based sensor are shown.
Applsci 11 11290 g002
Figure 3. Machine learning (ML) models of (a) logistic regression (LR), (b) support vector machine (SVM), and (c) artificial neural networks (ANN) are described.
Applsci 11 11290 g003
Figure 4. The SEM images describe the morphology of (a) a GO film and (b) an RGO film. The EDS spectra of (c) a GO film and (d) an RGO film are shown.
Applsci 11 11290 g004
Figure 5. (a) Transient responses of RGO–MnTPP, –ZnTPP, –FeTPP, and –CoTPP were plotted when subjected to 5 ppm of ammonia. (b) A radar plot shows the sensing responses of the RGO–metalloporphyrin-sensing array for acetone, isopropanol, ammonia, and carbon monoxide.
Applsci 11 11290 g005
Figure 6. Sensing responses of the RGO–metalloporphyrin-sensor array were plotted as a function of different concentrations of (a) ammonia, (b) acetone, and (c) isopropanol.
Applsci 11 11290 g006
Figure 7. Principal component analysis (PCA) plot of RGO–metalloporphyrin-sensing response was obtained.
Applsci 11 11290 g007
Figure 8. ML-based identification of kidney health using the signal intensity of the developed sensors. (a,b) illustrate the Precision-Recall and ROC curves with corresponding areas under the curves (AUC) of 0.97 and 0.96 when a SVM with linear kernel is used as the ML method under 5-fold cross-validation settings.
Applsci 11 11290 g008
Figure 9. (a) RGO thin film samples were noncovalently functionalized by metalloporphyrin molecules (here, CoTPP), (b) RGO–metalloporphyrin sensors with different metalloporphyrins showed varying sensing responses.
Applsci 11 11290 g009
Table 1. Exhaled breath biomarkers for different health conditions.
Exhaled BiomarkersHealthy (ppb)Disease (ppb)
Type 1 diabetesAcetone500–2000 [2]2200–21,000 [2]
Isopropanol784 (287–8963) [53]1223 (481–15,011) [53]
Chronic kidney diseaseAmmonia356 (290–412) [45]3863 (828–11,570) [45]
Smoking statusCarbon monoxide3610 ± 2150 (healthy non-smoker) [52]17,130 ± 8500 (healthy smoker) [52]
Table 2. Classification performance evaluations using 3-fold cross-validation.
AcetoneIsopropanolAmmoniaCarbon Monoxide
LRSVMNNLRSVMNNLRSVMNNLRSVMNN
Recall0.8131.01.00.8020.8330.8891.01.01.00.9520.8571.0
Accuracy0.7920.9580.750.750.9170.8331.01.01.00.9170.9580.875
F10.8711.00.8570.8370.8330.8891.01.01.00.9440.8570.923
Precision0.9441.00.750.8890.8330.8891.01.01.00.9440.8570.857
Publisher’s Note: MDPI stays neutral with regard to jurisdictional claims in published maps and institutional affiliations.

