Abstract
Corneal biomechanics aims to establish the physico-mathematical bases that allow for predicting the corneal response to physiological and pathological situations by creating models of tissue behavior. Determining the characteristic parameters of these models is a formidable challenge in the biomechanical modeling process. To contribute to corneal tissue characterization, an experimental set-up was designed, built and tested to study corneal behavior by applying changes in pressure. The elastic constants of porcine corneas were determined, and a Young’s modulus of 0.188 MPa and 26.22% hysteresis were obtained. A computational cornea model was developed to analyze the influence of different factors. Minor variations in the applied conditions were found for apical displacement and pachymetry, and the corneal behavior was reproduced. However, the optical power behavior was affected by variations in the applied conditions, and the experimentally obtained data could not be reproduced. Despite its importance, this parameter has not been analyzed in-depth by other studies, which shows that the quality of a biomechanical cornea model should not be evaluated only by apical displacement.
1. Introduction
Nowadays, there is a growing interest in knowing the biomechanics of biological soft tissues because these materials perform nonlinear behavior that depends on the time and state of the previous load [1]. However, the complexity and diversity of its structure at both the macroscopic and microscopic levels present a challenge in developing numerical simulation models, given the desire to simulate a real structure to improve accuracy.
In clinical practice, in silico mechanical models have been developed to simulate surgical procedures in ocular tissues [2,3], muscles [4,5,6] or arteries and veins [7,8]. In all these models, the properties of materials are obtained from experimental adjustment data. All these studies coincide with the need to simplify these models while maintaining a certain level of complexity to reduce computational costs [9].
The human cornea is a transparent structure that acts as a convergent lens. Its refractive power represents about two thirds of the optical power needed to focus light on the retina. This is why different techniques seek to modify its curvature to obtain a new refractive state that would ideally remain stable over time [10].
In order to predict corneal behavior, it is extremely important to develop a numerical model capable of simulating this tissue and being personalized to patients’ specific characteristics. To develop this model, it is not only important to measure the real corneal geometry, but it is also necessary to know both the boundary conditions and corneal material elastic properties.
Nowadays, it is possible to very accurately determine both the geometry and boundary conditions from regular clinical measurements, but establishing the material properties is a harder task.
Truly representative corneal properties should take into account the inhomogeneity and viscoelastic characteristics of this tissue. However, variations in these properties are found not only among individuals but also due to changes in age, temperature, humidity, some diseases, nourishment and many other factors [11].
The need for such measurements and lack of modern equipment were the motivation to build an experimental set-up to measure the mechanical properties of a cornea submitted to different pressures and to simultaneously determine its geometry by an anterior segment scanner (Pentacam). The results of these measurements were used by a biophysical model of the human eye to predict its mechanico-optical responses [12,13,14,15]. The main limitation of this set-up is that it only works with ex vivo corneas.
2. Materials and Methods
In order to carry out inflation tests, it was necessary to design and build an experimental facility to be used in future human cornea tests.
2.1. Experimental Set-up Description
The main set-up’s components are shown in Scheme 1. The previously prepared corneal sample (1) was placed inside a pressurization chamber (2), which was kept motionless by a fixation instrument (3) in the right position to obtain the corneal topography with a Pentacam (Pentacam Scheimpflug imaging system, Oculus) (4). One of the ducts (5) from the pressurization chamber was connected to a syringe (6), which was used to control the applied pressure, while the other (7) was connected to a pressure sensor (8). The pressure sensor was connected to an Arduino UNO (9), which was controlled by a laptop (10) that also registered pressure changes.
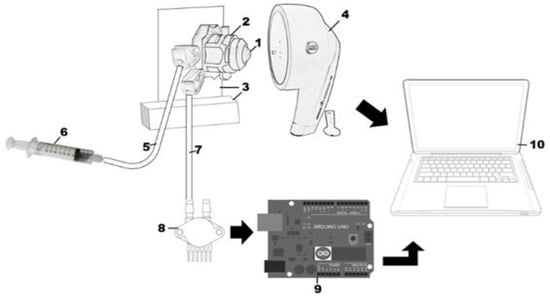
Scheme 1.
1 = Corneal sample. 2 = pressurization chamber; 3 = chamber fixing instrument; 4 = Pentacam; 5 = duct that connects the pressurization chamber and the syringe; 6 = syringe; 7 = duct that connects the pressure chamber and the pressure sensor; 8 = pressure sensor; 9 = Arduino; 10 = computer.
2.1.1. Sample Collection and Preservation
Seven porcine corneas were used in the experiments. They were taken from a local slaughterhouse immediately after the animals’ deaths and preserved in a cold solution of sodium chloride (1%) for 10 h until the tests began. An ophthalmologist surgeon checked for tissue abnormalities and extracted the corneas using a section ring. The selected corneas were left at room temperature for 30 min to thermally stabilize them. Then, the corneas were fixed inside the pressurization chamber, and the tests began. The corneas were submitted to a preconditioning process of three increasing and lowering pressure cycles. The pressure was gradually built up to the maximum value to be used in the experiments. The initial pressure to start testing was maintained for 10 min in the last cycle.
2.1.2. Pressure Control
A 2.5-mL syringe was used to manually increase and decrease the pressure. To control the pressure, a differential pressure sensor (MPX 5010, 10-kPa maximum pressure value) was connected to an Arduino UNO, which was programmed to save the measurements every second on a laptop.
2.1.3. Corneal Geometry Measurements
For each deformed state corresponding to an applied pressure, geometrical data (e.g., curvature radius and pachymetry) were taken by the Pentacam system.
2.2. Biomechanical Modeling
2.2.1. Geometry
Spherical and biconical surfaces were used to model both the anterior and posterior corneal surfaces by keeping the same central thickness for each type of model employed. The Pentacam data obtained directly from the tests were used.
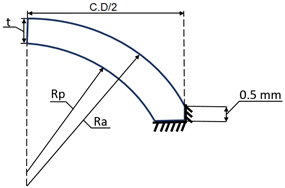
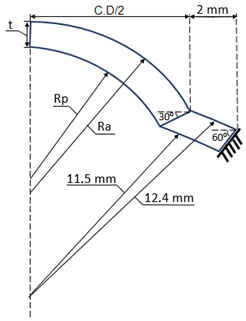
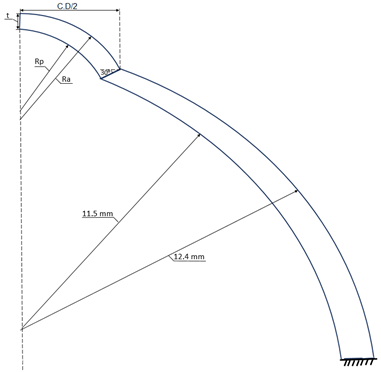
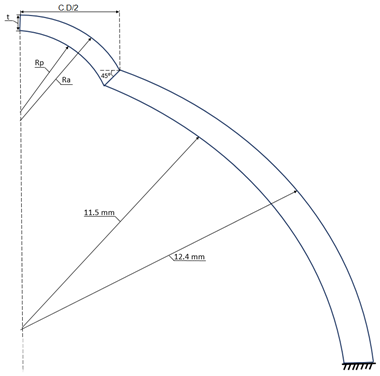
2.2.2. Boundary Conditions
A normal constant pressure was applied to the posterior corneal surface. Different kinds of supports were analyzed in the limbus zone, which are shown in Table 1.

Table 1.
Boundary conditions.
The scleral ring and globe radii, as well as the material assigned to the sclera, were obtained from a previous study [15]. The aim of these applied conditions was to show the influence of the constraints and geometric models on the system’s behavior. A very wide variety of options can be studied that depend on the model to be reproduced.
2.2.3. Material Model Selection and Parameter Determination
Previous works [12,15] have shown that, for hyperelastic models, a 5-parameter Mooney–Rivlin model better reproduces experimental results. The viscoelastic and anisotropic cornea properties were not analyzed because additional experimental data were lacking. However, hyperelastic models have shown good results in reproducing experimental tests [15,16,17,18].
The Mooney–Rivlin model is based on deformation invariants, and its general expression is as follows [12]:
where Cij represents the specific material parameters, I1 and I2 are the Cauchy tensor invariants, dk is a Lagrange multiplier that represents material incompressibility and J is the elastic deformation gradient determinant.
The 5-parameter Mooney–Rivlin model could be obtained using Equation (1) by having N = 2. The model parameters could be obtained by fitting the stress-strain curves in Ansys 18.1.
2.3. Parameter Definitions
2.3.1. Optical Power
The corneal optical power is one of the most important parameters of the eye functioning as an optical system. However, its behavior has not been discussed in most of the consulted references. The average optical power can be determined according to Equation (2) [19]:
where Pm ant and Pm post are the average powers of the anterior and posterior corneal surfaces, respectively, t is corneal thickness (given in meters) and ncornea (1.376) is the corneal refraction index.
The average powers of the anterior and posterior corneal surfaces can be determined according to [19]:
where nair (1.000) and naqueous (1.336) are the refractive indices of air and the aqueous humor, respectively, and Rm ant and Rm post are the mean curvature radii of the anterior and posterior corneal surfaces, respectively (given in meters).
2.3.2. Apical Displacement
Corneal vertex displacement has been one of the most studied parameters of corneal deformation in both experimental and biomechanical modeling terms. In this work, its direct determination was not possible, which was why the shell theory was applied [20].
For a spherical shell of radius r and thickness h subjected to pressure p, it was possible to calculate the surface normal displacement w using Equation (5) [20]:
where E is Young’s modulus and μ is Poisson’s ratio.
2.3.3. Stress-Strain
Stress-strain relations were obtained from the shell theory [20] and applied to the experimental results:
where p is the applied pressure, t is the corneal thickness and r and r′ are the mean corneal radii before and after each pressure increment, respectively.
3. Results and Discussion
Different parameters were tested to compare the experimental and modeling results. Experimental data can be found in Supplementary materials (Tables S1–S7).
3.1. Experimental Results
3.1.1. Curvature Radii
The principal meridian radii of the anterior and posterior corneal surfaces were obtained from the Pentacam data. The variations in the average radius of each meridian on both corneal surfaces with the changes in pressure are shown in Figure 1. The variations were taken from an initial common pressure of 2.47 kPa.
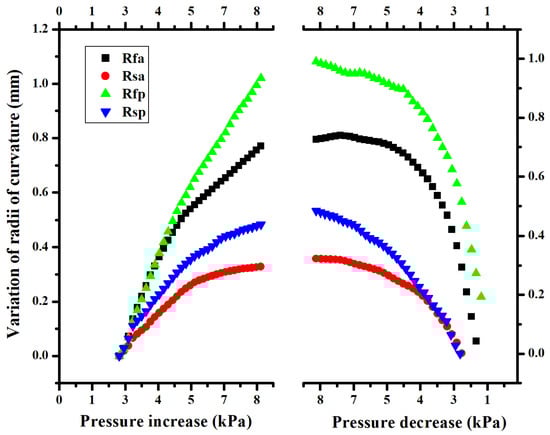
Figure 1.
Variations in the average meridian radii for both corneal surfaces with changes in pressure. Rfa = flattest radius of the anterior corneal surface; Rsa = steepest radius of the anterior corneal surface; Rfp = flattest radius of the posterior corneal surface; Rsp = steepest radius of the posterior corneal surface.
Increases in pressure led to higher radii values, and the cornea became flatter with each increment in pressure and steeper with the lowering pressure values. One important fact is that the final average anterior surface radius approximately equaled the initial one, while the posterior surface had a smaller final average radius compared with the initial one. This had consequences for the optical power of the entire cornea.
Apical displacement (corneal vertex displacement) is normally used as a corneal deformation measure [21,22,23,24,25]. The authors of these papers calculated the curvature radius from the apical displacement measures and geometric simplifications and obtained lower values when the pressure increased and higher values when the pressure dropped. However, the studies that applied the Scheimpflug technology for inflation tests [26,27,28] reported similar results to those obtained herein.
3.1.2. Pachymetry
The mean pachymetry value obtained for the initially applied pressure was 885 μm (σ = 158 μm). Figure 2 shows that the pachymetry value lowered for both increasing and decreasing pressures. This behavior was not found in those studies that employed apical displacement as a corneal deformation measure, where the pachymetry was calculated with the corneal incompressibility and curvature radii (determined as previously explained). This was why those authors obtained lower corneal thickness values when the pressure increased and higher values when the applied pressure dropped.
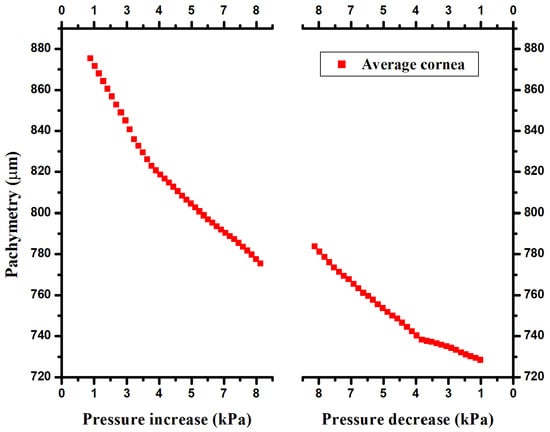
Figure 2.
Variations in pachymetry versus pressure changes.
The data pachymetry found in experiments using the Scheimpflug technology indicated two different behaviors. Lombardo et al. (2014) [27] reported narrowing pachymetry variations for both increasing and decreasing pressure values, which is similar to what we found. Kling et al. [26,28] revealed a different behavior. Changes in pachymetry were significantly less marked, with a slight increase in pachymetry when the pressure dropped, and the pachymetry had even higher values than the initial ones. Although this behavior is not completely clear, it might be related to the previous treatment to which the corneal samples were submitted. Further experiments must be carried out on this subject.
3.1.3. Optical Power
Figure 3 shows the variations in the mean corneal optical power versus the changes in pressure obtained from the experimental results. We can see how the optical power decreased when the pressure rose and increased when the pressure dropped. This value was not reported in the consulted bibliography.
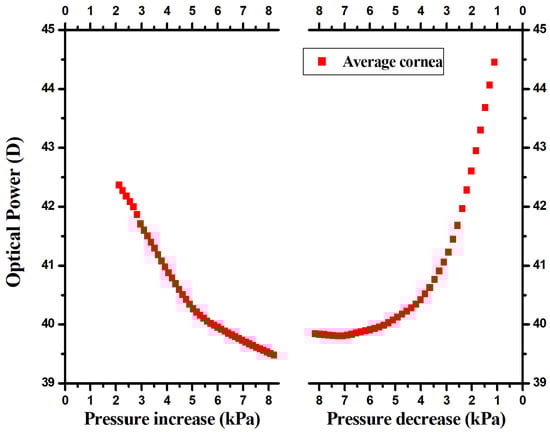
Figure 3.
Optical power behavior versus pressure for the experimental results.
The observed behavior was directly related to the changes observed in the pachymetry and the curvature radii of both the anterior and posterior corneal surfaces, as discussed above. Obviously, the changes in the hydration state and other internal changes that could affect the corneal refraction index were not considered in this model and will be studied in a future work.
3.1.4. Apical Displacement
Given the difficulties in achieving a common initial pressure for all the taken measurements, only the corneas to which it was possible to apply an average initial pressure of 1.61 kPa (12.09 mmHg) (with a 0.06-kPa standard deviation) were taken into account to obtain the pressure versus apical displacement and stress-strain relations (Corneas 1–5). Figure 4 depicts the behavior of the average obtained cornea. This behavior presented an approximately linear region between 2.6 and 5.0 kPa. In accordance with this value, the cornea rigidity slightly increased.
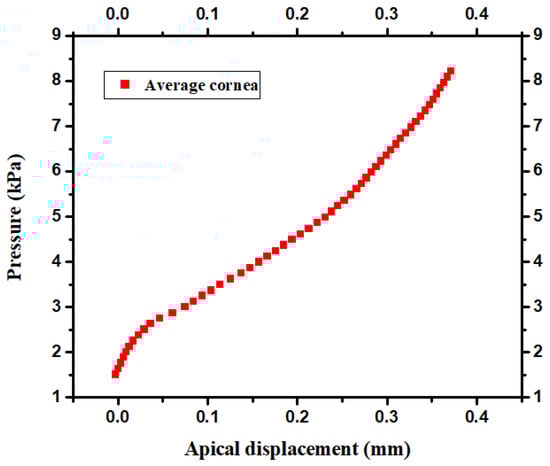
Figure 4.
Apical displacements versus applied pressure for the experimental and biomechanical modeling results.
A wide range of reported results has been observed for this parameter [13,22,24,25,28] using porcine corneas extracted from eyeballs. The results obtained in our experiments fell within the range of the results reported in the consulted bibliography.
3.1.5. Stress-Strain
Figure 5 shows the stress-strain relations for each analyzed cornea, calculated from the average radius of each one. The stress-strain curves obtained for an increasing pressure are depicted by the solid colored lines, and those corresponding to a decreasing pressure are represented by dashed lines. For Cornea 3, only the increase is shown, as the drop in pressure could not be carried out. In all cases, greater deformation was observed with increasing stress, but it lowered when the internal pressure decreased.
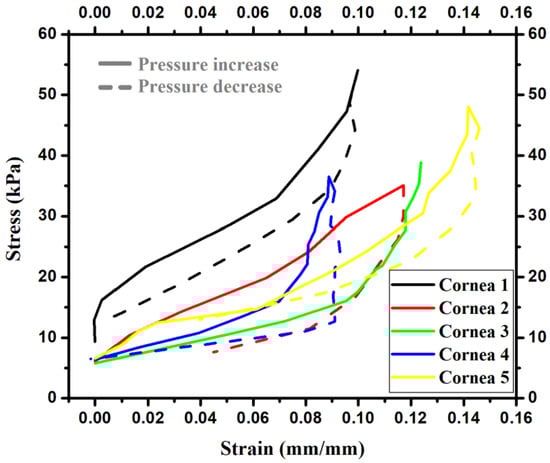
Figure 5.
Stress-strain relations of the studied corneas calculated from the mean radius.
The area enclosed between both curves is related to the energy lost during the experimental process, which confirmed the corneal viscoelastic character and provided us with a tissue hysteresis measure.
Figure 6 depicts the stress-strain curves obtained from the average curvature radii when the applied pressure was increased. These curves show a linear behavior between approximately 6 and 15 kPa (this range corresponds to pressures between approximately 1.60 and 3.33 kPa). The stiffness increased up to 50 kPa, and the anterior corneal surface was stiffer than the posterior one. Different authors have reported similar behavior [20,21,22,23,24].
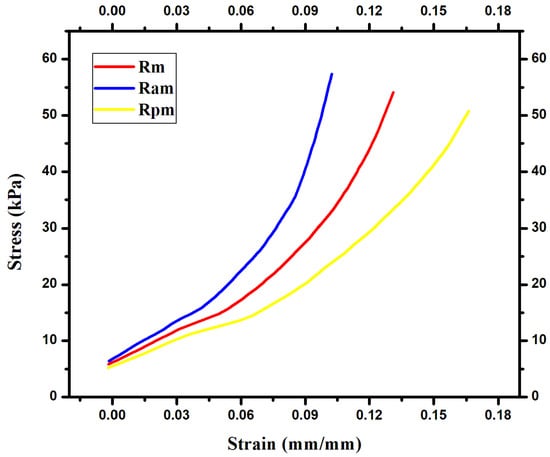
Figure 6.
The average corneal stress-strain curves obtained for the increasing pressure data calculated for Rm (the mean curvature radius of the cornea), Ram (the mean curvature radius of the anterior cornea surface) and Rpm (the mean curvature radius of the posterior cornea surface).
3.1.6. Young’s Modulus Determination
Young’s modulus characterizes the material stiffness by relating the strains and stresses with Hooke’s law [20]. Although we could not use a Young’s modulus value to describe the nonlinear behavior of the corneal material, it was possible to fit the linear region of each curve shown in Figure 6 (obtained for stresses under 15 kPa) to determine this parameter for the selected range. The fitted values are found in Table 2. They are the mean values calculated to estimate the average material stiffness of the studied corneas for pressures between approximately 1.60 and 3.33 kPa.
Table 2.
Young’s modulus values for the anterior, posterior and mean corneal surfaces.
The regression coefficients were above 0.99, which means that the linear model adequately reproduced the experimental data. The anterior surface was around 37% stiffer than the posterior one.
A wide range of Young’s modulus values have been reported, which can be explained by considering the different experimental techniques used to measure it. These results also depend on the corneal origin (e.g., human or porcine), donors’ ages, applied strain ranges, method followed to determine Young’s modulus and experimental conditions, among other factors.
Table 3 shows the Young’s modulus values reported for the inflation tests with porcine corneas, which were calculated with the physiological pressure values. The variations were significantly narrower than those indicated in other experiments. The results obtained in this work fell within the range of the values reported for similar tests.
Table 3.
The Young’s modulus values reported for the inflation tests with porcine corneas.
3.1.7. Corneal Hysteresis
Viscoelastic corneal hysteresis is characterized by different behaviors under load and unload conditions. It is a measure of the energy absorbed during the cycle and represents a combination of this tissue’s elastic and viscous properties. It is useful for understanding corneal resistance to intraocular pressure [31].
Hysteresis can be determined as the ratio of the area contained in the cycle divided by the area under the load curve. The corneal hysteresis values obtained in this work varied between 15.64% and 44.21%, with an average value of 26.22% and a standard deviation of 13.36%.
3.2. Biomechanical Modeling
The geometric and material corneal computational model characteristics were obtained from the experimental results as explained before. The used data can be found in Appendix A and Appendix B (Table A1 and Table A2). The geometry influence and comparisons between the experimental and computational results are shown for several parameters.
3.2.1. Pachymetry
Influence of the Geometry
In Figure 7, a reduction in the pachymetry is observed when the applied pressure was increased in both models (spherical and biconical geometries). This behavior corresponded to that obtained experimentally. There is a coincidence in the values of these models, except in the points closest to the maximum pressure (8.00 kPa), but they were still similar.

Figure 7.
Pachymetry versus pressure for the spherical and biconical geometries.
Influence of the Boundary Conditions
The pachymetry variation versus the pressure for the different applied boundary conditions is shown in Figure 8.

Figure 8.
Pachymetry versus pressure for the different boundary conditions.
Small differences were observed in the results obtained among the used models, and the bigger ones were less than 10 μm. Pachymetry is a parameter that is barely affected by both the use of different geometric models and the analyzed boundary conditions.
Model–Experiment Comparison
It was necessary to obtain a stress-free cornea configuration [12] to compare the experimental and computational results, in which the displacements could be measured by starting at the initially applied pressure (corresponding to the initial geometry). The results are provided in Figure 9. Similar behaviors were noted, and the differences were less than 10 μm, representing <1.5%.
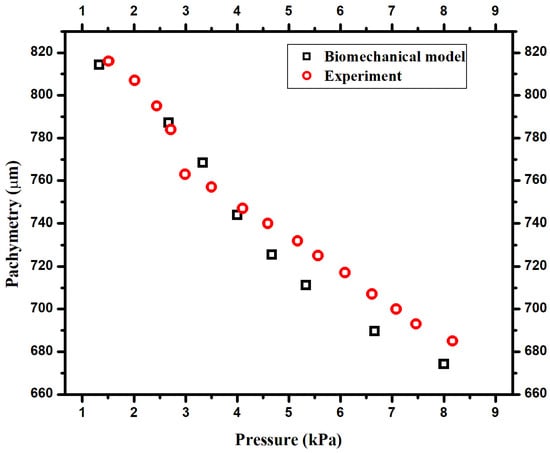
Figure 9.
Pachymetry versus pressure for the experimental and modeling results.
3.2.2. Apical Displacement
Influence of the Geometry
Figure 10 shows the apical displacements obtained for the two geometric models. Increasing the applied pressure led to greater apical displacement, as observed in the experiments. A complete coincidence between both models occurred, which means that the geometry used in these cases did not seem to affect this parameter’s behavior.
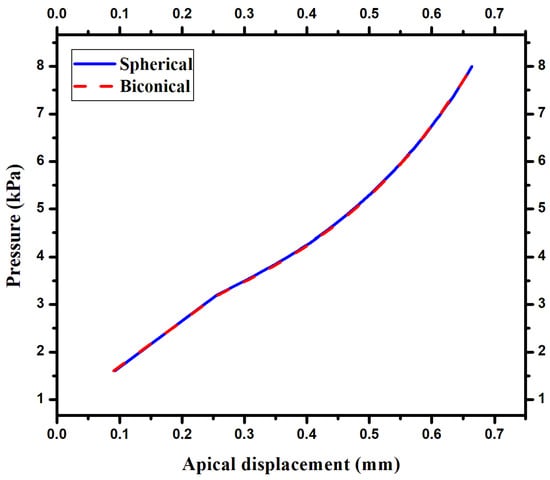
Figure 10.
Apical displacement due to increased pressure for the employed spherical and biconical geometries.
Influence of the Boundary Conditions
Figure 11 shows the apical displacement behavior due to increases in pressure for different supports.
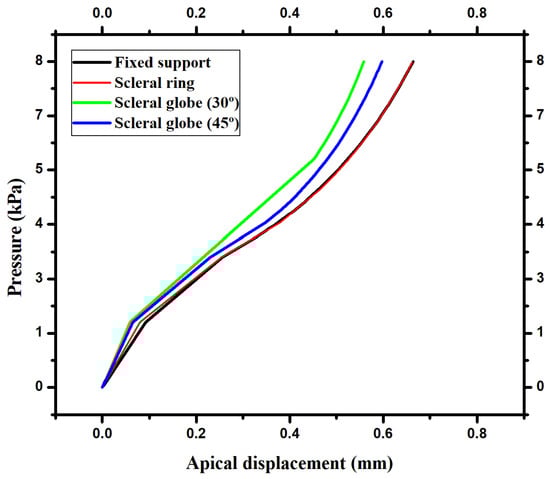
Figure 11.
Apical displacement due to increased pressure for different boundary conditions.
No differences were observed between the model with a fixed border and the scleral ring one, but the results differed for the other conditions. The scleral globe model had the smallest apical displacements. This could be due to the sclera assuming part of the deformation caused by the applied pressure. The scleral globe model with a 30° inclination on the surface that separated the cornea and sclera presented fewer deformations than the scleral globe model at 45°. This means that employing such a model requires analyzing the interaction between both tissues if the intention is to model corneal behavior inside the eyeball.
Model–Experiment Comparison
Figure 12 illustrates the apical displacements obtained for the computational model (black squares) and the experimental results (red circles).
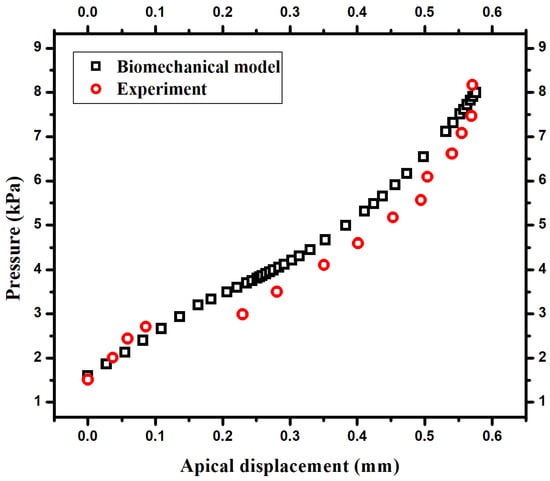
Figure 12.
Apical displacements versus applied pressure for the experimental and biomechanical modeling results.
Although real experimental conditions are hard to reproduce with a numerical model, the obtained results indicated a marked resemblance. Studying the different boundary conditions and material properties could lead to a model that accurately reproduced reality.
3.2.3. Optical Power
Influence of the Geometry
The optical power variations with pressure are shown in Figure 13 for the models that employed spherical and biconical surfaces.

Figure 13.
Optical power versus pressure for the spherical and biconical geometries.
The optical power behavior obtained from computational modeling presented significant differences compared with the experimental results (see Figure 3). In the former, an increase in optical power for the pressures took place, which rose to 4.00 kPa, plus lower values for an ulterior pressure increase. In the latter, a decreasing monotone behavior was noted.
Major differences were observed between the spherical and biconical models, which were around 2 D within the studied pressure range.
Influence of the Boundary Conditions
Figure 14 shows the optical power variation with the pressure for the different employed boundary conditions.
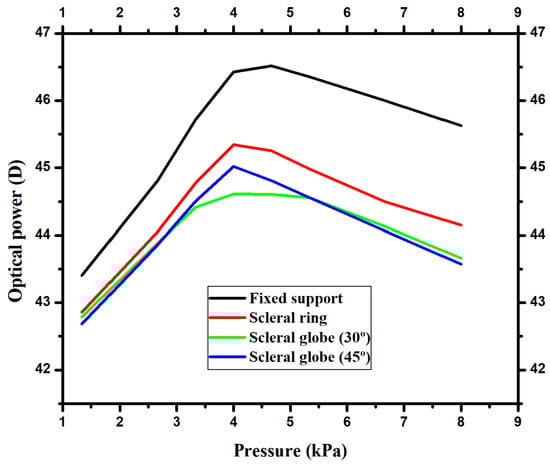
Figure 14.
Optical power behavior versus pressure for the employed boundary conditions.
Similar behavior occurred to that obtained in Figure 13. The maximum optical power value obtained was at 4.67 kPa in the model with a fixed border and 4.00 kPa in the remaining cases. The biggest differences were observed for 4.00 kPa. The models that used the eyeball came closer to one another and presented bigger differences, falling between 3.33 and 4.67 kPa. The fixed border model presented the highest optical power values and the widest variations, which was related to the applied support, and forced the material to undergo more marked deformations. These two deformation types were lesser for the scleral ring model and the eyeball model.
In these cases, an optical power analysis showed that the differences found among the models led to a much more in-depth study of the real cornea conditions, which was essential if the cornea behavior was to be reproduced. It was also very interesting to see how the used models very accurately reproduced the experimental behavior of some parameters, such as apical displacement and pachymetry, but that of the optical power of the cornea differed. This result indicates that determining the apical displacement or pachymetry is insufficient to verify the quality with which a computational model reproduces the experimental results.
Reported Results
The optical power variation from computational modeling has only been reported in five of the consulted references [32,33,34,35,36]. Their authors employed the material and geometrical parameters taken from the experimental results reported by other authors and did not directly determine the curvature radii. According to these results, the change in the optical power monotony versus the pressure curves obtained in our simulations would be the expected result, but the causes of this behavior and the conditions that could influence it were unclear. A more in-depth study into the influence of mathematical modeling is necessary to characterize the material properties and to analyze different boundary conditions. To better understand this tissue behavior, more experimental results are necessary, in which the curvature radii could be measured for each pressure increment.
Our laboratory lacks an automatic pump with the appropriate characteristics to carry out such tests, which is why we resorted to manual insertion. However, tests were carried out on numerous occasions to establish a robust sensitive protocol with the experiment to be run.
4. Conclusions
This study obtained the elastic properties of porcine corneas from an experimental set-up designed and built to be used together with topographic equipment. Geometric cornea characterization was performed under controlled pressure conditions. The Young’s modulus (0.188 MPa) and hysteresis (26.22%) were determined, as was a five-parameter material Mooney–Rivlin model. Variations in pachymetry, apical displacement and optical power were analyzed for both the experimental and modeling results. The effect of the different types of geometries and boundary conditions were studied, with very little influence on the variation in the pachymetry and apical displacement but significant differences in optical power. Although the pachymetry and apical displacement results were similar in both the experimental and computational cases, the optical power showed significant differences in them. Very little data about optical power have been reported, and those that exist all show a similar behavior to that obtained from the modeling in the present work. A more in-depth study about the conditions that influence this parameter’s behavior is necessary. We conclude that apical displacement and pachymetry determination are not enough to test the quality of a computational model for reproducing the experimental results.
For future research, more complex material models and other optical and mechanical parameters can be analyzed for greater accuracy to help surgeons in their clinical practice.
Supplementary Materials
The following are available online at https://www.mdpi.com/article/10.3390/app112311292/s1, Tables S1–S7: The experimental data obtained for each studied cornea.
Author Contributions
Conceptualization, C.M.-V. and A.J.B.-L.; data curation, C.M.-V. and T.C.-D.; formal analysis, C.M.-V., O.d.l.C.N.-C., T.C.-D., A.J.B.-L. and F.C.-M.; funding acquisition, F.C.-M.; investigation, C.M.-V., O.d.l.C.N.-C. and T.C.-D.; methodology, C.M.-V. and A.J.B.-L.; project administration, T.C.-D. and A.J.B.-L.; resources, C.M.-V., O.d.l.C.N.-C. and T.C.-D.; software, C.M.-V.; supervision, A.J.B.-L.; validation, C.M.-V., A.J.B.-L. and F.C.-M.; visualization, C.M.-V., O.d.l.C.N.-C. and F.C.-M.; writing—original draft, C.M.-V., A.J.B.-L. and F.C.-M.; writing—review and editing, C.M.-V., O.d.l.C.N.-C., T.C.-D., A.J.B.-L. and F.C.-M. All authors have read and agreed to the published version of the manuscript.
Funding
This work was supported for publication by the “Conselleria de Innovación, Universidades, Ciencia y Sociedad Digital” of the “Generalitat Valenciana”. The authors wish to also thank the INGEGRAF Association.
Institutional Review Board Statement
Not applicable.
Informed Consent Statement
Not applicable.
Data Availability Statement
The data presented in this study are available in this article.
Acknowledgments
The research work herein reported was possible thanks to the contribution of Yoslay Hernández Baez. We also wish to thank the Cuban Institute of Ophthalmology “Ramón Pando Ferrer” and David Fernández Rivas for his collaboration.
Conflicts of Interest
The authors declare no conflict of interest.
Appendix A
Corneal Geometric Parameters Used
Cornea 5 was selected for model–experiment comparisons, as its geometry was the closest to the average cornea. Its geometrical parameters were obtained from the Pentacam and appear in Table A1.
Table A1.
Corneal geometrical parameters.
Table A1.
Corneal geometrical parameters.
| Type of Surfaces | Rfa (mm) | Rsa (mm) | Qfa | Qsa | Rfp (mm) | Rsp (mm) | t (µm) | C.D (mm) |
|---|---|---|---|---|---|---|---|---|
| Biconic | 8.03 | 7.49 | 0 | −0.36 | 6.71 | 6.02 | 816 | 12.43 |
| Spheric | 7.76 | 0 | 6.37 | 816 | 12.43 | |||
Rfa = flattest radius of the anterior corneal surface; Rsa = steepest radius of the anterior corneal surface; Qfa = flattest asphericity parameter of the anterior corneal surface; Qsa = steepest asphericity parameter of the anterior corneal surface; Rsp = steepest radius of the posterior corneal surface; Rfp = flattest radius of the posterior corneal surface; t = corneal thickness; C.D = corneal diameter; The Pentacam provides only the asphericity parameters of the anterior corneal surface.
The spherical radii were calculated as an average from the flattest and the steepest radii for each surface.
Appendix B
The employed material model parameters.
Table A2.
The applied Mooney–Rivlin material model parameters.
Table A2.
The applied Mooney–Rivlin material model parameters.
| Structure | C10 (MPa) | C01 (MPa) | C20 (MPa) | C11 (MPa) | C02 (MPa) |
|---|---|---|---|---|---|
| Cornea | 1.19 | −1.11 | 17.84 | −26.83 | 10.59 |
| Sclera | 34.73 | −32.43 | 75,029 | −153,636 | 78,853 |
References
- Chagnon, G.; Rebouah, M.; Favier, D. Hyperelastic Energy Densities for Soft Biological Tissues: A Review. J. Elast. 2015, 120, 129–160. [Google Scholar] [CrossRef] [Green Version]
- Kling, S.; Hafezi, F. Corneal biomechanics—A review. Ophthalmic Physiol. Opt. 2017, 37, 240–252. [Google Scholar] [CrossRef] [PubMed] [Green Version]
- Nguyen, B.A.; Roberts, C.J.; Reilly, M.A. Biomechanical Impact of the Sclera on Corneal Deformation Response to an Air-Puff: A Finite-Element Study. Front. Bioeng. Biotechnol. 2019, 6, 210. [Google Scholar] [CrossRef]
- Yousefi, A.-A.K.; Nazari, M.A.; Perrier, P.; Panahi, M.S.; Payan, Y. A visco-hyperelastic constitutive model and its application in bovine tongue tissue. J. Biomech. 2018, 71, 190–198. [Google Scholar] [CrossRef] [PubMed] [Green Version]
- Martynenko, A.; Zozulya, V.V. Mathematical modeling of the cardiac tissue. Mech. Adv. Mater. Struct. 2021, 28, 1–17. [Google Scholar] [CrossRef]
- Hurtado, D.E.; Zavala, P. Accelerating cardiac and vessel mechanics simulations: An energy-transform variational formulation for soft-tissue hyperelasticity. Comput. Methods Appl. Mech. Eng. 2021, 379, 113764. [Google Scholar] [CrossRef]
- Veselý, J.; Horný, L.; Chlup, H.; Adámek, T.; Krajíček, M.; Žitný, R. Constitutive modeling of human saphenous veins at over loading pressures. J. Mech. Behav. Biomed. Mater. 2015, 45, 101–108. [Google Scholar]
- Balzani, D.; Brinkhues, S.; Holzapfel, G.A. Constitutive framework for the modeling of damage in collagenous soft tissues with application to arterial walls. Comput. Methods Appl. Mech. Eng. 2012, 213–216, 139–151. [Google Scholar] [CrossRef]
- Jiang, Y.; Wang, Y.; Peng, X. A Visco-Hyperelastic Constitutive Model for Human Spine Ligaments. Cell Biophys. 2014, 71, 1147–1156. [Google Scholar] [CrossRef]
- Guarnieri, F.A. Introduction: Corneal Biomechanics and Refractive Surgery; Springer: New York, NY, USA, 2014; pp. 1–6. [Google Scholar]
- Fratzl, P. Collagen: Structure and Mechanics; Springer: Berlin/Heidelberg, Germany, 2008; pp. 359–393. [Google Scholar]
- Muñoz Villaescusa, C. Modelo biofísico del ojo Humano: Su Aplicación en Cirugía Lasek. Diploma Thesis, Higher Institute of Applied Technologies and Sciences, Havana, Cuba, July 2014. [Google Scholar]
- Muñoz Villaescusa, C.; Núñez Chongo, O.; Batista Leyva, A. Optical Model of the Unaccommodated Human Eye. Rev. Cub. Fis. 2014, 31, 35–37. [Google Scholar]
- Cruz-Rodríguez, R.C.; Batista-Planas, A.L.; Núñez-Chongo, O.; Muñoz-Villaescusa, C.; Batista-Leyva, A. Ray Paths Through a Grin Lens: The Crystalline Case. Rev. Cub. Fis. 2015, 32, 96–100. [Google Scholar]
- Núñez-Chongo, O.; Muñoz-Villaescusa, C.; Batista-Leyva, A. A biomechanical model of the human cornea. Rev. Cub. Fis. 2018, 35, 44–49. [Google Scholar]
- Elsheikh, A.; Kassem, W.; Jones, S. Strain-rate sensitivity of porcine and ovine corneas. Acta Bioeng. Biomech. 2011, 13, 25–36. [Google Scholar]
- Whitford, C.; Joda, A.; Jones, S.; Bao, F.; Rama, P.; Elsheikh, A. Ex vivo testing of intact eye globes under inflation conditions to determine regional variation of mechanical stiffness. Eye Vis. 2016, 3, 21. [Google Scholar] [CrossRef] [Green Version]
- Yu, A.; Bao, F.; Feng, Y.; Whitford, C.; Ye, T.; Huang, Y.; Wang, Q.; Elsheikh, A. Assessment of Corneal Biomechanical Behavior Under Posterior and Anterior Pressure. J. Refract. Surg. 2013, 29, 64–70. [Google Scholar] [CrossRef] [PubMed]
- Puell Marín, M.C. Óptica Fisiológica: El Sistema Óptico del ojo y la Visión Binocular; Universidad Complutense de Madrid: Madrid, Spain, 2006; pp. 271–287. [Google Scholar]
- Pisarenko, G.S.; Yákovlev, A.P.; Matvéev, V.V. Materials Resistance Manual; MIR: Moscow, Russia, 1979. [Google Scholar]
- Anderson, K.; El-Sheikh, A.; Newson, T. Application of structural analysis to the mechanical behaviour of the cornea. J. R. Soc. Interface 2004, 1, 3–15. [Google Scholar] [CrossRef] [Green Version]
- Boschetti, F.; Triacca, V.; Spinelli, L.; Pandolfi, A. Mechanical Characterization of Porcine Corneas. J. Biomech. Eng. 2012, 134, 031003. [Google Scholar] [CrossRef]
- Elsheikh, A.; Alhasso, D.; Rama, P. Biomechanical properties of human and porcine corneas. Exp. Eye Res. 2008, 86, 783–790. [Google Scholar] [CrossRef]
- Elsheikh, A.; Anderson, K. Comparative study of corneal strip extensometry and inflation tests. J. R. Soc. Interface 2005, 2, 177–185. [Google Scholar] [CrossRef] [Green Version]
- Bao, F.; Jiang, L.; Wang, X.; Zhang, D.; Wang, Q.; Zeng, Y. Assessment of the ex vivo biomechanical properties of porcine cornea with inflation test for corneal xenotransplantation. J. Med. Eng. Technol. 2012, 36, 17–21. [Google Scholar] [CrossRef] [PubMed]
- Kling, S.; Marcos, S. Effect of Hydration State and Storage media on Corneal Biomechanical Response from in vitro Inflation Tests. J. Refract. Surg. 2013, 29, 490–497. [Google Scholar] [CrossRef] [PubMed] [Green Version]
- Lombardo, G.; Serrao, S.; Rosati, M.; Lombardo, M. Analysis of the Viscoelastic Properties of the Human Cornea Using Scheimpflug Imaging in Inflation Experiment of Eye Globes. PLoS ONE 2014, 9, e112169. [Google Scholar] [CrossRef]
- Kling, L.; Remon, S.; Pe, A.; Marcos, S. Corneal Biomechanical Changes after Collagen Cross- Linking from Porcine Eye Inflation Experiments. IOVS 2010, 51, 3961–3968. [Google Scholar] [CrossRef] [Green Version]
- Asejczyk-Widlicka, M.; Pierscionek, B.K. The elasticity and rigidity of the outer coats of the eye. Br. J. Ophthalmol. 2008, 92, 1415–1418. [Google Scholar] [CrossRef]
- Matteoli, S.; Virga, A.; Paladini, I.; Mencucci, R.; Corvi, A. Investigation into the elastic properties of ex vivo porcine corneas subjected to inflation test after cross-linking treatment. J. Appl. Biomater. Funct. Mater. 2016, 14, 163–170. [Google Scholar] [CrossRef]
- Kotecha, A.; Elsheikh, A.; Roberts, C.R.; Zhu, H.; Garway-Heath, D.F. Corneal-Thickness and Age-Related Biomechanical Properties of the Cornea Measured with the Ocular Response Analyzer. Investig. Ophthalmol. Vis. Sci. 2006, 47, 5337–5347. [Google Scholar] [CrossRef] [Green Version]
- Pandolfi, A.; Holzapfel, G.A. Three-Dimensional Modeling and Computational Analysis of the Human Cornea Considering Distributed Collagen Fibril Orientation. J. Biomech. Eng. 2008, 130, 061006. [Google Scholar] [CrossRef] [Green Version]
- Pandolfi, A.; Fotia, G.; Manganiello, F. Finite element simulations of laser refractive corneal surgery. Eng. Comput. 2009, 25, 15–24. [Google Scholar] [CrossRef]
- Sánchez, P.; Moutsouris, K.; Pandolfi, A. Biomechanical and optical behavior of human corneas before and after photorefractive keratectomy. J. Cataract Refract. Surg. 2014, 40, 905–917. [Google Scholar] [CrossRef] [PubMed]
- Simonini, I.; Pandolfi, A. Customized Finite Element Modelling of the Human Cornea. PLoS ONE 2015, 10, e0130426. [Google Scholar] [CrossRef] [PubMed] [Green Version]
- Pandolfi, A. Cornea modelling. Eye Vis. 2020, 7, 2. [Google Scholar] [CrossRef] [PubMed] [Green Version]
Publisher’s Note: MDPI stays neutral with regard to jurisdictional claims in published maps and institutional affiliations. |
© 2021 by the authors. Licensee MDPI, Basel, Switzerland. This article is an open access article distributed under the terms and conditions of the Creative Commons Attribution (CC BY) license (https://creativecommons.org/licenses/by/4.0/).