Article

Comparison of the Physicochemical Properties of Chitin Extracted from Cicada orni Sloughs Harvested in Three Different Years and Characterization of the Resulting Chitosan

1
Institut Jean Lamour, University of Lorraine, F-54000 Nancy, France
2
LiBio Laboratory, University of Lorraine, F-54000 Vandoeuvre-les-Nancy, France
3
Department of Chemistry, CICECO—Aveiro Institute of Materials, University of Aveiro, 3810-193 Aveiro, Portugal
*
Author to whom correspondence should be addressed.
Appl. Sci. 2021, 11(23), 11278; https://doi.org/10.3390/app112311278
Submission received: 2 November 2021 / Revised: 19 November 2021 / Accepted: 22 November 2021 / Published: 29 November 2021
(This article belongs to the Special Issue Polysaccharides: From Extraction to Applications)

Abstract

:
Chitin and its derivative chitosan are among the most used polysaccharides for biomedical and pharmaceutical applications. Most of the commercially available chitin is obtained from seafood wastes. However, the interest in alternative renewable sources of chitin and chitosan, such as insects, is growing. When new sources are identified, their stability over time has to be evaluated to allow for their commercialization. The aim of this study is to compare the physicochemical properties of chitin extracted from Cicada orni sloughs harvested in three different years (2017, 2019 and 2020) in order to assess the stability of the source and the repeatability of the extraction process. Chitin and its derivative chitosan were characterized by simple techniques such as Fourier transform infrared spectroscopy (FTIR) and X-ray diffraction (XRD). Results suggest that the physicochemical properties of the extracted chitin varied from year to year, and that these differences are not due to the extraction process, but rather to intrinsic differences within the source. We showed that these differences could already be detected by analyzing the raw material (i.e., cicada sloughs) using the above-mentioned simple methods. The chitosan obtained from deacetylation of chitin had a low degree of deacetylation ( 66.2 ± 1.6 %). This low degree of deacetylation can be attributed to the deacetylation process, which is probably not appropriate for this source of chitin.

1. Introduction

Chitin is a linear polymer composed of units of N-acetyl-d-glucosamine (acetylated unit) and D-glucosamine (deacetylated unit), found in natural sources (i.e., the exoskeleton of arthropods, cell walls of fungi) in association with proteins, minerals and pigments. The removal of these elements, in order to obtain pure chitin, is realized in three steps: the demineralization of the raw material, its deproteinization and its decolorization [1]. Through a process of deacetylation, which consists in the removal of acetyl groups, chitin can be transformed into its derivative chitosan. The amount of acetylated units remaining reveals the efficiency of the transformation of chitin into chitosan and determines their so-called degree of acetylation (DA—usually employed for chitin) or degree of deacetylation (DD—usually employed for chitosan). If the product resulting from this transformation contains more than 50% of acetylated units (DA > 50% and DD < to 50%), it is called chitin, while if it contains more than 50% of deacetylated units (DA < 50% and DD > to 50%) it is called chitosan [1]. Within a source, chitin can be found in three different polymorphs: α , β and γ , depending on the parallel, antiparallel or alternated orientation of the fibers, respectively [2]. α -chitin is the most abundant polymorph and if found in fungi, insect exoskeleton and shells of crustaceans, while β - and γ -chitin are uncommon and are found in squid pens and in beetles (family Lucanidae), respectively [3]. Both chitin and chitosan, due to their biodegradability, biocompatibility and low toxicity, are widely studied in the biomedical and pharmaceutical research fields. However due to the high number of acetyl groups, which form strong hydrogen bonds, chitin is insoluble in water and in most of the common organic solvents such as acetic acid [2]. As a consequence, the use of chitin is limited, and it is often converted to its derivative chitosan. Chitosan has a pKa value of 6.2, meaning that when the pH is above this value, its amino groups (NH 2 ) are protonated (NH 3 + ) and chitosan becomes cationic and soluble. The cationic nature of chitosan is rather special, since most of the natural polysaccharide are either neutral or negatively charged when dissolved in acidic environment. This property allows chitosan to form electrostatic complexes with negatively charged polymers [4]. Furthermore, chitosan presents a high number of reactive amino (NH 2 ) and hydroxyl (OH) groups, which can be easily chemically modified to produce chitosan derivatives [5]. Commercially, chitin is mainly extracted from crustaceans and, in a minor part, from fungi. However, the interest in insects as an alternative source of chitin and chitosan is growing [6]. The investigation of alternative renewable sources is an active field of research that could not only lead to their commercialization, but also the identification of products with different properties and applications. When new sources are identified, it is necessary to characterize the physicochemical properties of the resulting product chitin and investigate its stability over the years. In fact, all the sources (i.e., the exoskeleton of arthropods) are usually composed of the same elements (i.e., chitin, proteins, minerals and pigments), whose relative abundance is usually source-specific. However, the precise amounts can vary due to environmental causes and lead to chitin with different physicochemical properties. Green et al. [7], for example, reported that within the same source (in this case crustacean shells), the content in minerals, proteins and chitin, as well as the physicochemical properties of the latter, can differ based on the season when the shells are collected. In another study, Youn et al. [8] compared the chitosan obtained from shells of crabs harvested in three different years and seasons showing that their physicochemical characteristics slightly differed depending on the harvest year. Among the physicochemical characteristics, the DA/DD and the crystallinity index (CrI) are the ones that mostly show the physical, chemical and biological properties of chitin and its derivative chitosan. In a previous study, we extracted chitin from Cicada orni sloughs harvested in the south-eastern French Mediterranean basin in 2017, and we characterized its physicochemical properties (i.e., its DA and CrI) using two simple techniques such as Fourier-transform infrared spectroscopy (FTIR) and X-ray diffraction (XRD) [9]. For the first time to our knowledge, we used the same techniques to analyze the raw material (i.e., cicada sloughs) and the intermediary products of the extraction process (i.e., demineralized and deproteinized products) to assess the efficiency of the extraction process. We suggested that these analyses could be used to compare different extractions among them [9]. Here, we compare the physicochemical properties of chitin extracted from cicada sloughs harvested in two different years (2019 and 2020) in order to evaluate the repeatability of the extraction process and the stability of the source. We found that the physicochemical properties of the chitin obtained varied from year to year, and that these differences are not due to the extraction process, but rather to intrinsic variations within the source. Furthermore, we found that these differences could already be detected by analyzing the raw material (i.e., cicada sloughs) using the above-mentioned simple methods. Subsequently, we deacetylated the chitin extracted from cicada sloughs harvested in 2020, to obtain chitosan, and compared it to three commercially available chitosan, in order to assess the effectiveness of the deacetylation process. We found that it has a low degree of deacetylation, which can be attributed to the extraction process, which is probably not appropriate for the deacetylation of this source.

2. Materials and Methods

2.1. Materials

Cicada orni sloughs were harvested during the summer of 2017, 2019 and 2020 in the south-eastern French Mediterranean basin (PinRolland—La Seyne sur Mer). Chitosan 80/200 (ref. 23405), chitosan 90/10 (ref. 23601), and chitosan 95/500 (ref. 23706) were obtained from Heppe Medical Chitosan GmbH (Halle (Saale), Germany). Chitin (ref. C7170), Acetic acid (ref. 33209) and Hydrochloric acid (HCl) (ref. 30721) were obtained from Sigma-Aldrich (St. Louis, MO, USA). Sodium hypochlorite (NaClO) (ref. 33369) was purchased from Alfa Aesar. Sodium hydroxide (NaOH) (ref. 28244) was purchased from VWR Chemicals (Radnor, PA, USA).

2.2. Extraction of Chitin

Chitin was extracted from Cicada orni sloughs, as previously described [9]. Briefly, cicada sloughs were washed with distilled water, dried at 50 °C for 24 h in a drying oven and then mechanically ground in a mortar. The powder (raw material) was then demineralized using 1M HCl aqueous solution under agitation at 30 °C at 200 rpm for 2 h. The sample was then filtered and washed with deionized water until neutral pH was detected. Subsequently, the demineralized sample was treated with a solution 1M NaOH heated at 90 °C under reflux for 2 h to remove proteins. Again, the sample was filtered and washed extensively with deionized water until neutral pH was reached and dried in a drying oven at 50 °C for 24 h. Finally, the deproteinized sample was treated with a solution 1% of sodium hypochlorite (NaClO) for 30 min at 25 °C, filtered, washed with distilled water, and treated two additional times with 1% NaClO for 10 min, until the solution was transparent. After this last step, the decolorized sample (chitin) was extensively washed to reach neutral pH and remove any residual chemicals and dried again in a drying oven at 50 °C for 24 h.

2.3. Deacetylation to Obtain Chitosan

The deacetylation process was performed according to Luo et al. [10]. Briefly, the chitin extracted from cicada sloughs harvested in 2020 has been treated with a 60% NaOH solution at 100 °C (oil bath) for 8 h under continuous stirring. The sample was then filtered, washed with deionized water until neutral pH was reached, and placed in a drying oven at 50 °C for 24 h.

2.4. Fourier Transformed Infrared Spectroscopy (FTIR)

Powdered samples (demineralized and deproteinized products and chitin obtained from the extractions performed on cicada sloughs harvested in 2019 and 2020, commercial chitin, as well as extracted and commercial chitosan) were used for the preparation of KBr pellets (1 mg of the sample with 100 mg KBr). FTIR spectra were collected in a range of 400 to 4000 cm 1 with a Nicolet 6700 Spectrophotometer, by the accumulation of 64 scans, with a resolution of 4 cm 1 . However, only peaks from 400 to 2000 cm 1 are shown in the results, since they are important for the calculation of the degree of deacetylation (DD) and for the investigation of the differences among the samples.
The DD was calculated according to the following equation:
D D ( % ) = 100 D A %
where DA is the degree of acetylation. DA was calculated as proposed by Brugnerotto et al. [11] as follows:
D A ( % ) = A 1320 A 1420 0.3822 0.03133 · 100
where A1320 and A1420 are the absorbance values at 1320 and 1420 cm 1 obtained by the FTIR spectra. For each type of chitin and chitosan were produced three KBr pellets and the results were presented as mean ± standard deviation of three measurements.

2.5. X-ray Diffraction (XRD)

Powdered samples (demineralized and deproteinized products and chitin obtained from the extractions performed on cicada sloughs harvested in 2019 and 2020, commercial chitin, as well as extracted and commercial chitosan) were used to collect X-ray diffraction (XRD) spectra. Data were collected at a scan rate of 1°/min and a scan angle from 5 to 40°, using a D8 Advance (Bruker, Billerica, MA, USA) equipped with a monochromatic copper radiation (K α = 0.154060 nm). The Crystallinity Index (CrI) was determined using the formula:
C r I ( % ) = I 110 I a m I 110 · 100
where I 110 is is the maximum intensity the (110) diffraction peak in the crystalline region at 20° and I a m is the maximum intensity of amorphous diffraction at 16°.

2.6. Scanning Electron Microscopy (SEM)

The morphology of the samples (demineralized and deproteinized products and chitin obtained from the extractions performed on cicada sloughs harvested in 2019 and 2020) were imaged using a Quanta 650-FEG (FEI, Hillsboro, OR, USA) scanning electron microscope. The samples in form of powder were dried in a drying oven at 50 °C for 24 h, fixed on an adhesive tape, gold sputter-coated (≈5–10 nm of thickness) and then imaged using an acceleration voltage of 5 kV (and a magnification of ≈4000×).

2.7. Abbreviations

Through the text, the samples will be abbreviated as shown in Table 1.

3. Results

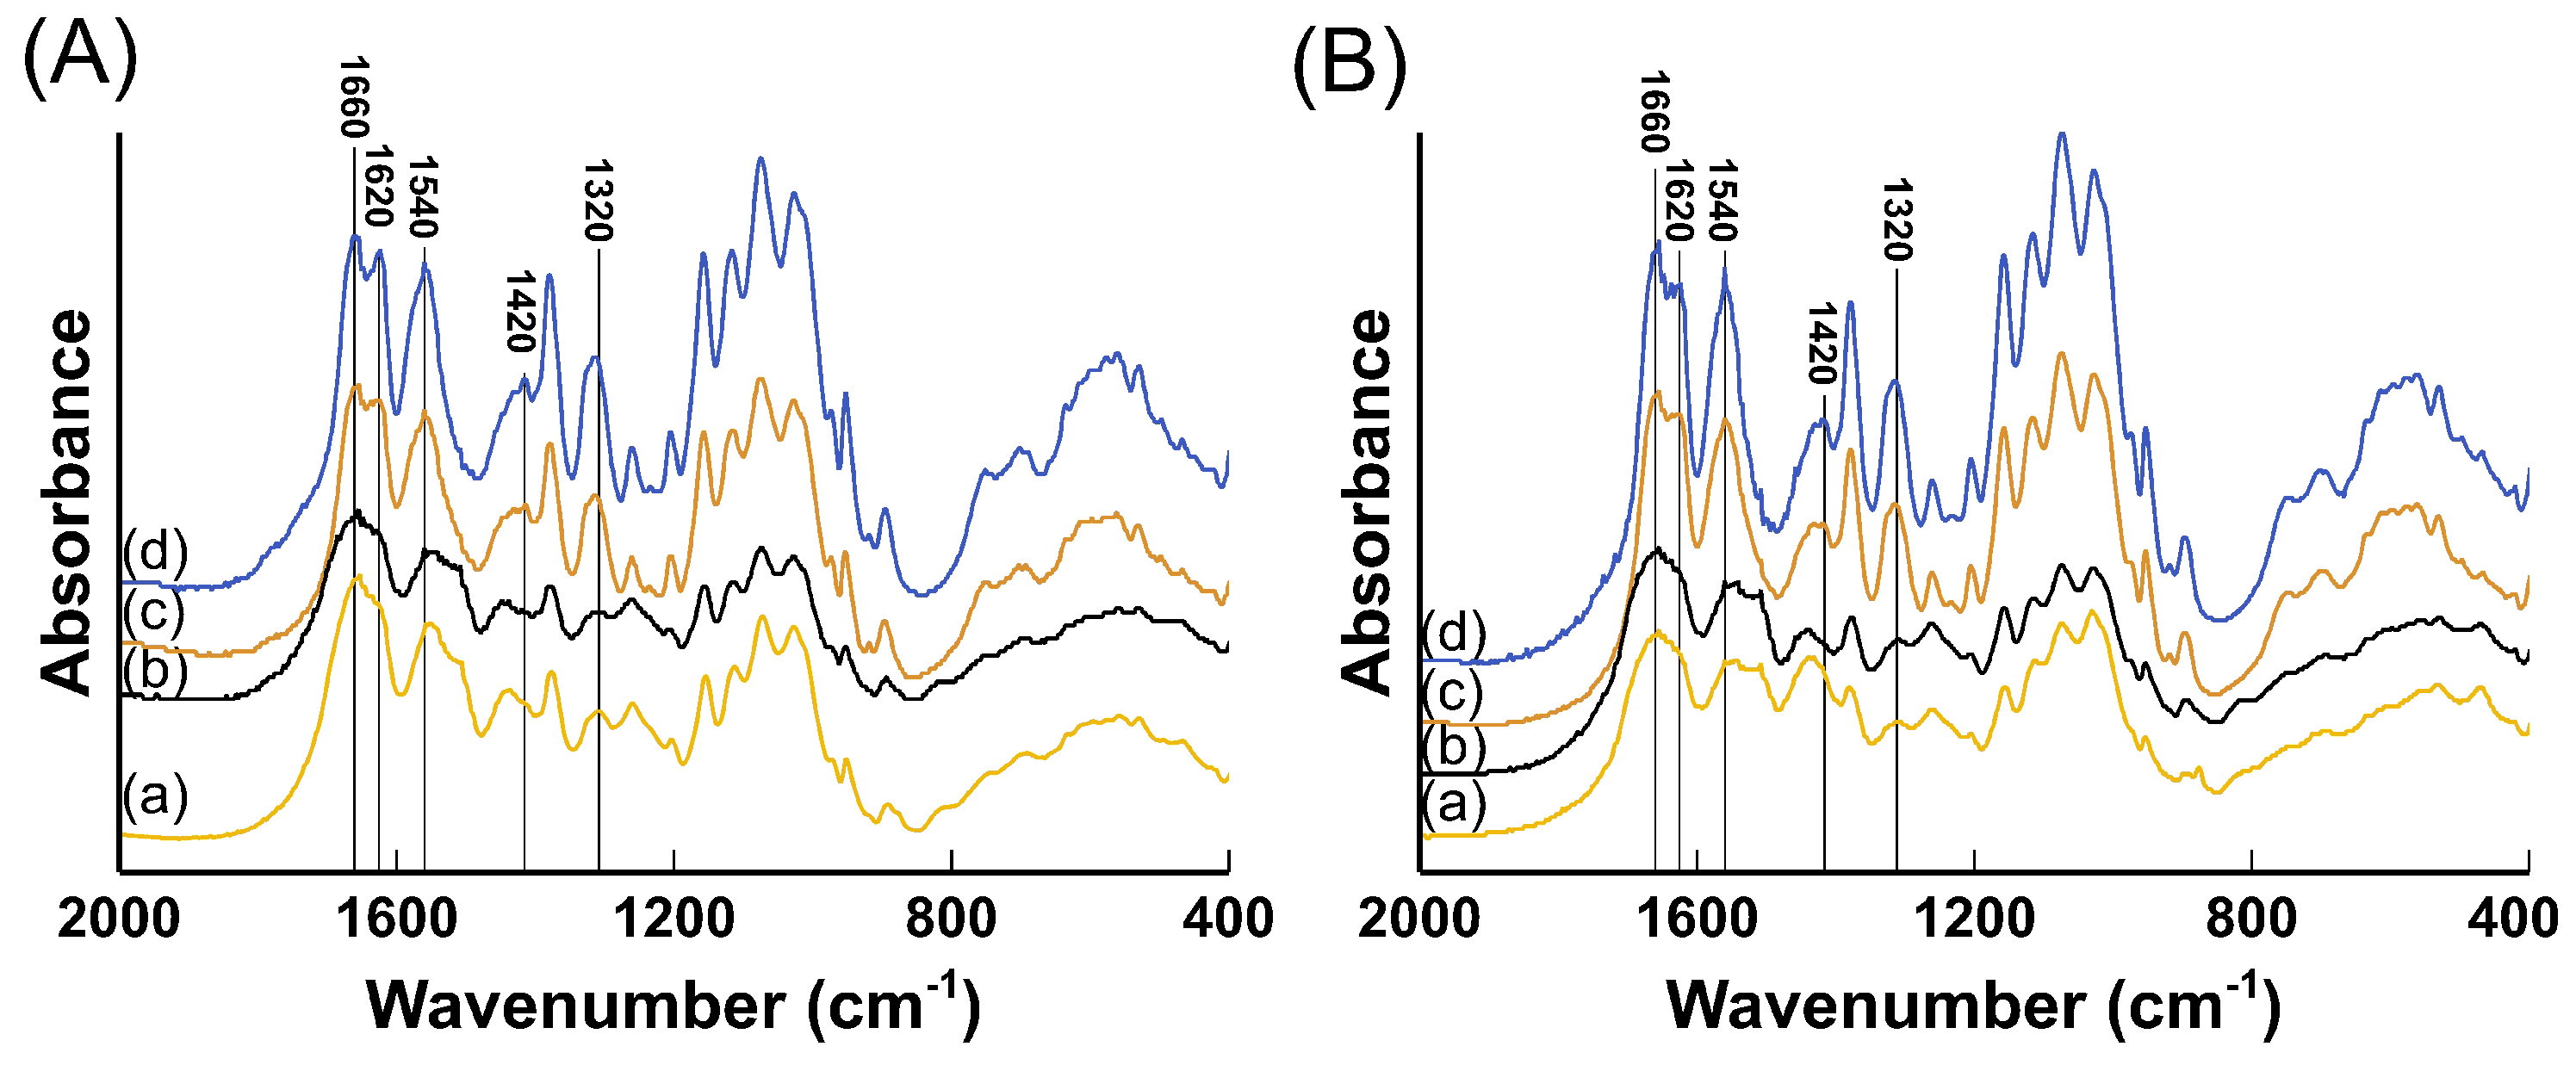
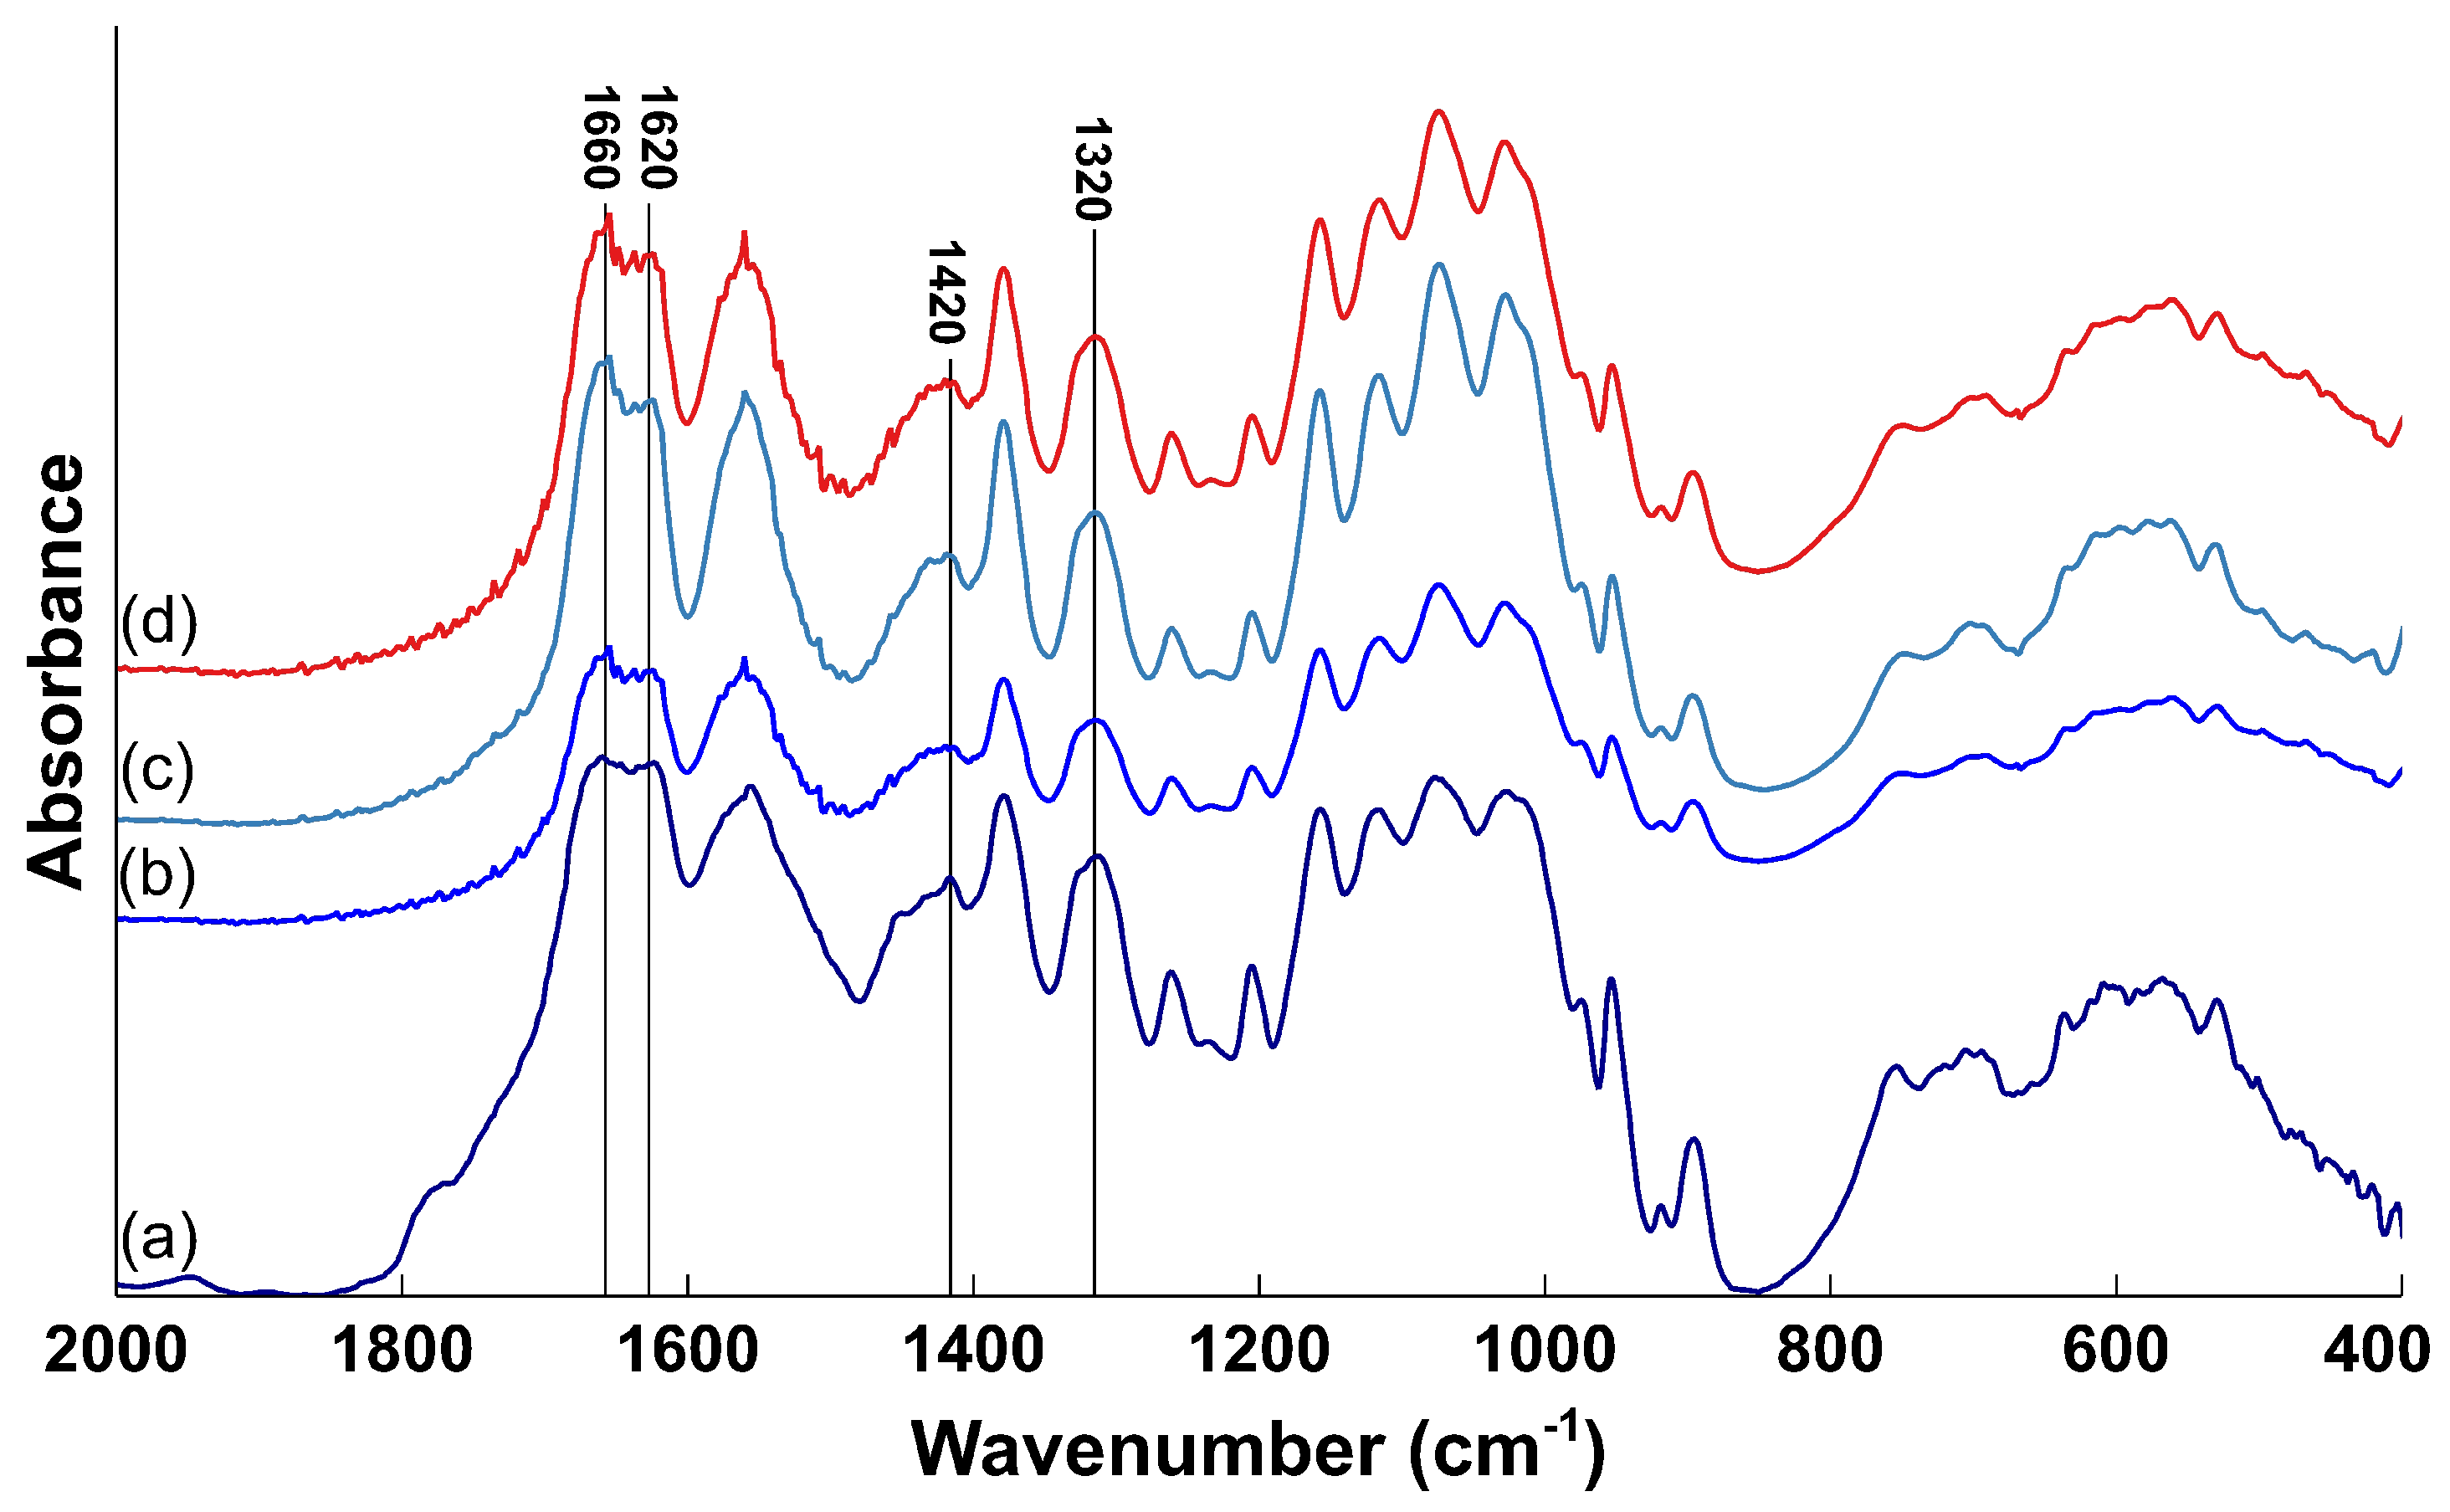
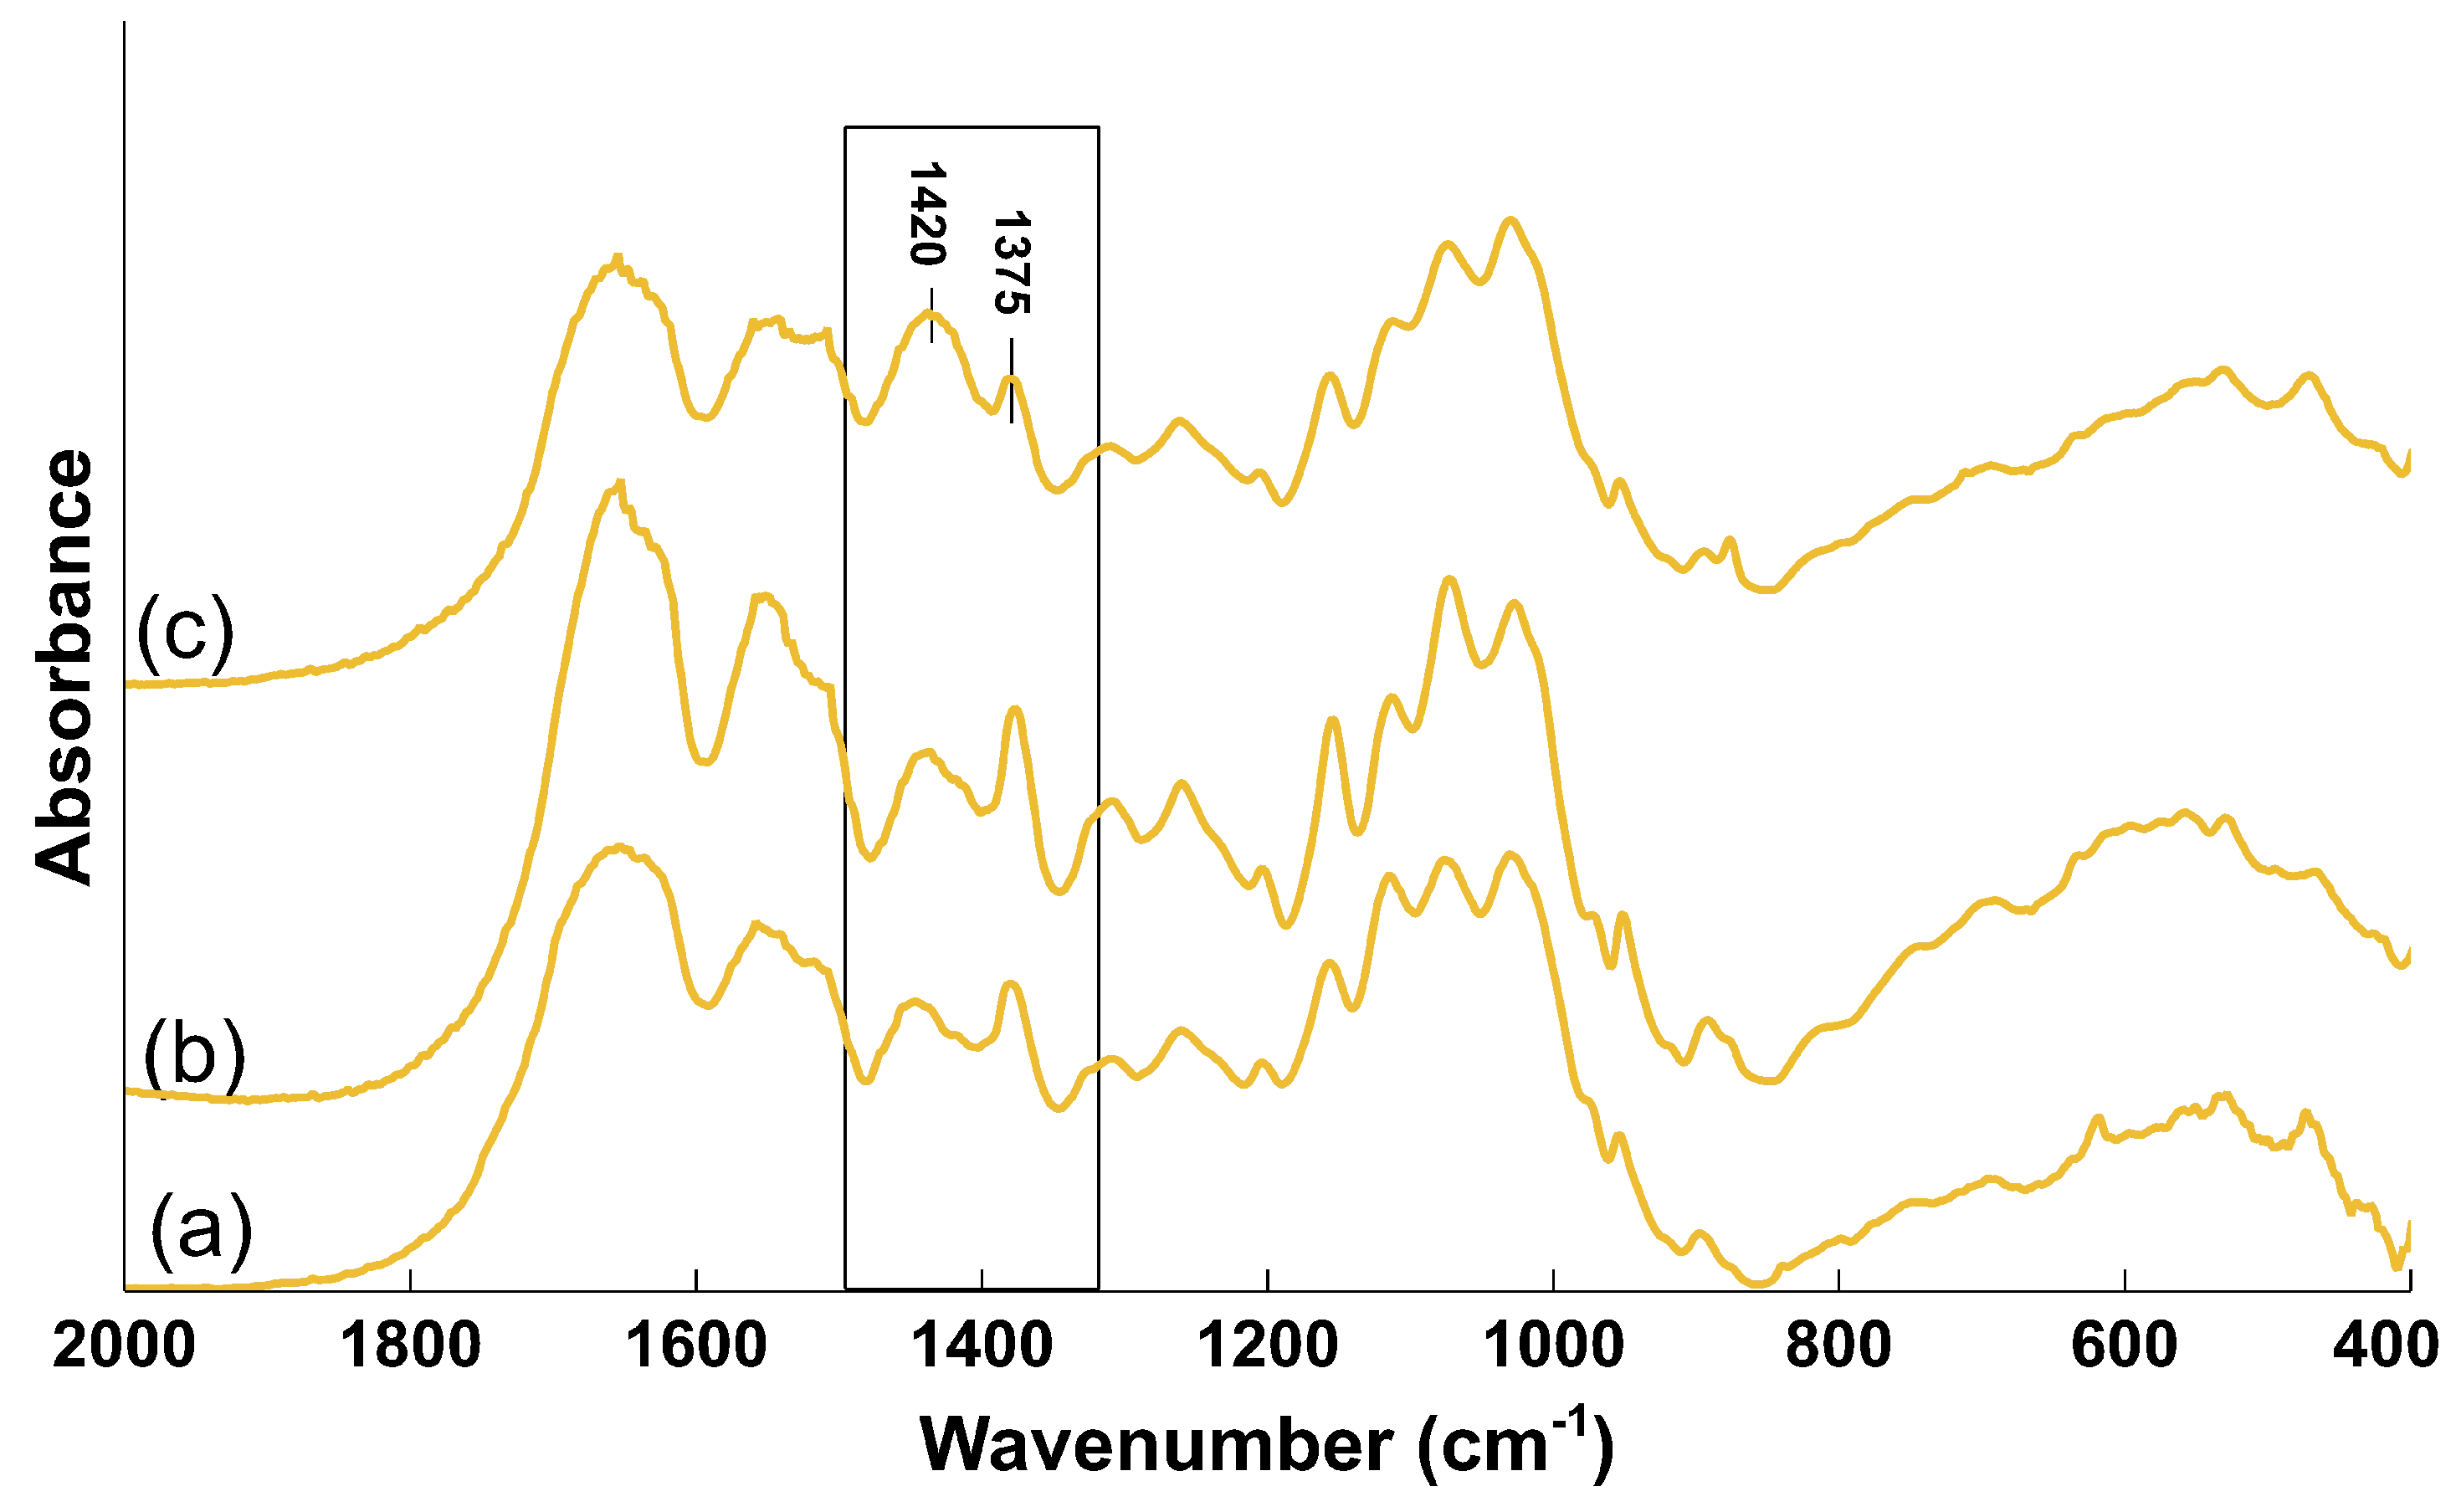
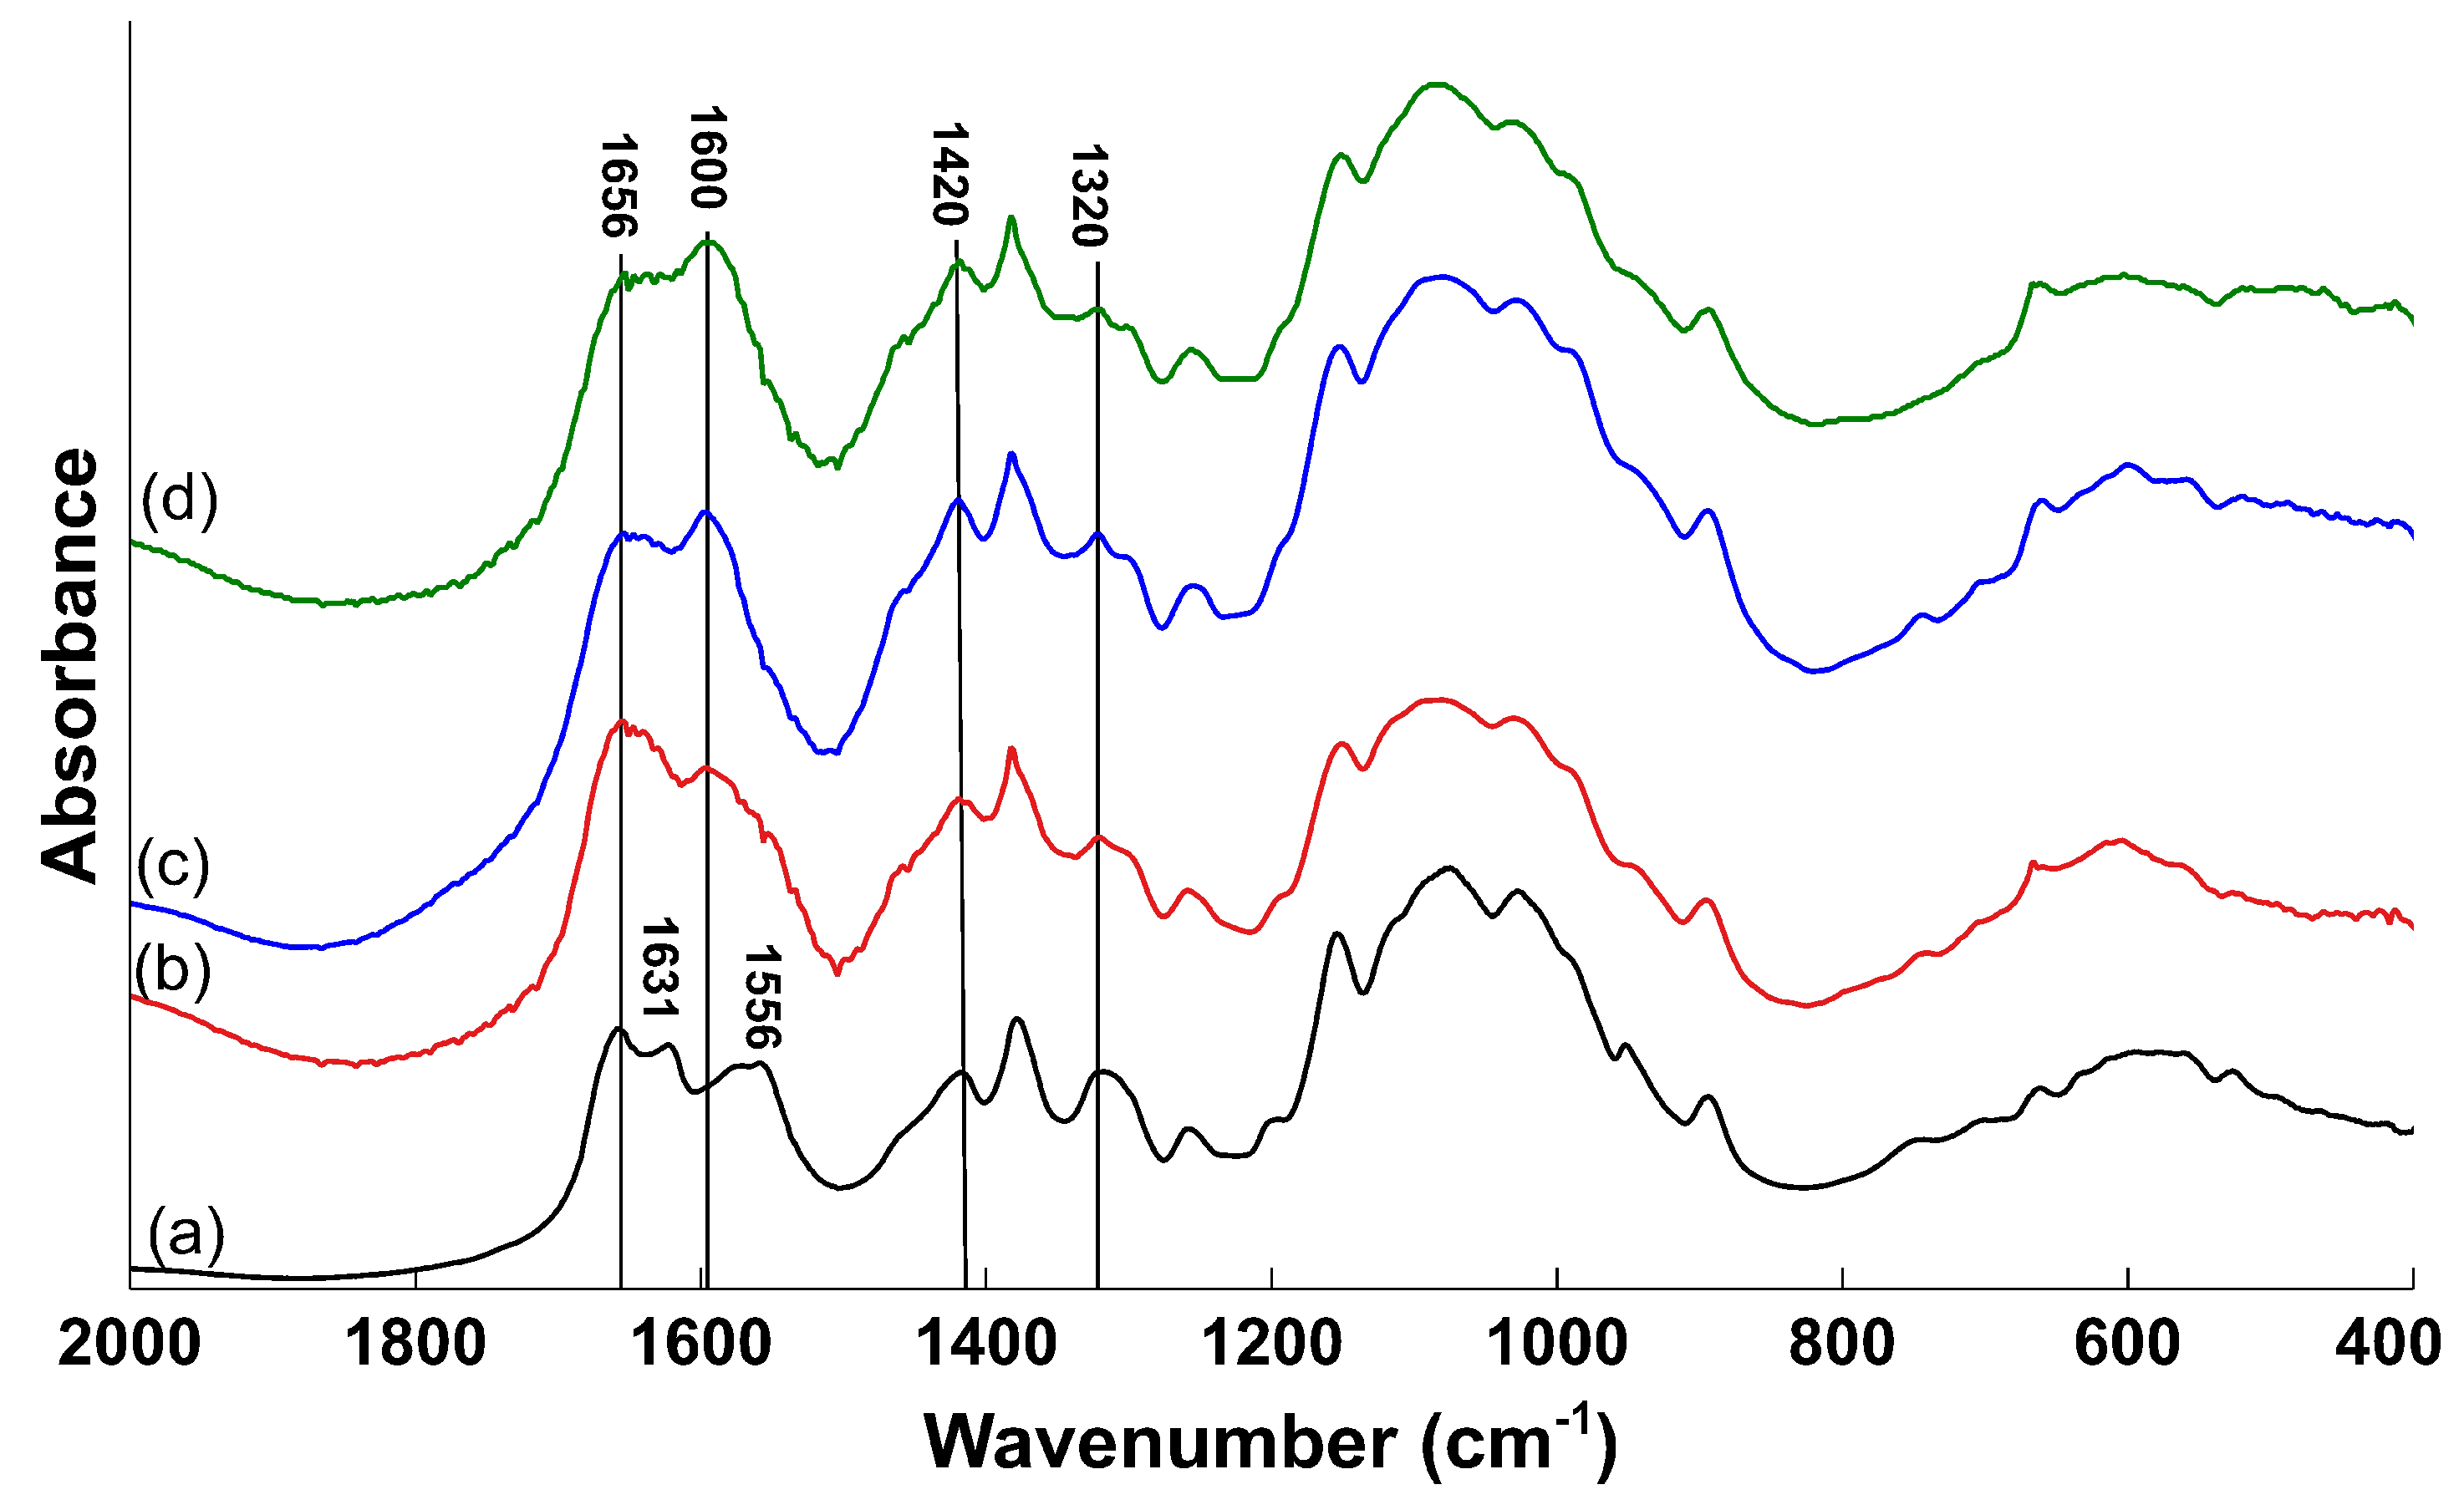
3.1. FTIR Spectra of Chitin and Degree of Acetylation

In a previous study [9], we analyzed the different steps of the extraction process (i.e., demineralization, deproteinization and decolorization) from cicada sloughs collected in 2017. The FTIR characterization showed that the raw material and the demineralized sample presented a single peak at approximately 1660 cm 1 , while after the deproteinization two individual peaks appeared at 1620 cm 1 and 1660 cm 1 . This phenomenon was attributed to the removal of proteins since the peak at 1660 cm 1 might be assigned to the amide I vibrational modes [12]. Furthermore, the presence of two individual peaks also suggested that the extracted chitin was the α -polymorph, while the presence of a single peak is attributed to the β -polymorph [13]. In order to validate these observations, we collected the FTIR spectra of the raw material and of the intermediary products of the extraction of chitin from cicada sloughs harvested in 2019 and 2020—see Figure A1. We found that the FTIR spectra for the extractions performed on cicada sloughs harvested in 2019 and 2020 are very similar to each other. In both the extraction processes, the raw material and the demineralized product present only one peak at 1660 cm 1 while two peaks appear at 1620 cm 1 and 1660 cm 1 for the deproteinized and decolorized products, confirming that proteins were efficiently removed, and that chitin is in its α -polymorph.
According to Jang et al. [3] α -chitin has two types of hydrogen bonding: intra-sheet and inter-sheet. The absorption band at 1660 cm 1 correspond to hydrogen bonding between the carbonyl groups (C=O) of amide I and amide II (NH) while the absorption band at 1620 cm 1 correspond to the hydrogen bonding between the CH 2 OH side chain and the carbonyl group (C=O). Since the amide I of proteins absorbs at wavelengths comprised between 1600 and 1700 cm 1 , the presence of proteins and the interactions of the latter with chitin, lead to the appearance of a single peak, at wavelengths comprised between 1620 and 1660 cm 1 , in the samples before deproteinization (i.e., raw material and demineralized sample). Here, in order to evaluate the quality of the final product (i.e., chitin extracted from cicada sloughs harvested in three different years), we compare the FTIR spectra (shown in Figure 1) of the samples CH-17, CH-19, and CH-20 among them and with a commercial chitin. The three extracted chitin present similar spectra and, in particular, very similar to the spectrum of the commercial chitin.
The FTIR spectra were used for the measurements of the degree of acetylation (DA). In Table 2 are presented the average DA of CH-17, CH-19 and CH-20. The results show that chitin extracted from cicada sloughs collected in three different years had a different degree of acetylation. In particular, CH-17 and CH-19 were more acetylated than CH-20, suggesting that chitin extracted from cicada sloughs harvested in 2020 was different from the others.
To better understand if the difference in the DA is due to the extraction process or to an intrinsic difference within the source, we compared the FTIR spectra of the raw materials (cicada sloughs) harvested in 2017, 2019 and 2020. Results (shown in Figure 2) evidence a major difference in the peaks at 1420 cm 1 and 1375 cm 1 . In fact, these two peaks show an opposite conformation in the three spectra with the peak at 1375 cm 1 being less intense than the peak at 1420 cm 1 for CH-20 compared to CH-17 and CH-19. The peak at 1375 cm 1 can be attributed to CH 3 deformations typical of chitin (in particular, typical of the acetyl group), while the peak at 1420 cm 1 can be attributed to the CH 2 bending. Since the amount of CH 2 groups does not change according to the degree of acetylation, we can suppose that the different conformation of these two peaks is only given by a change in the amount of CH 3 groups and, consequently, in the amount of acetyl groups, which is lower in CH-20 compared to CH-17 and CH-19. As a result, the DA of the final product, chitin, is lower for CH-20 compared to CH-17 and CH-19.

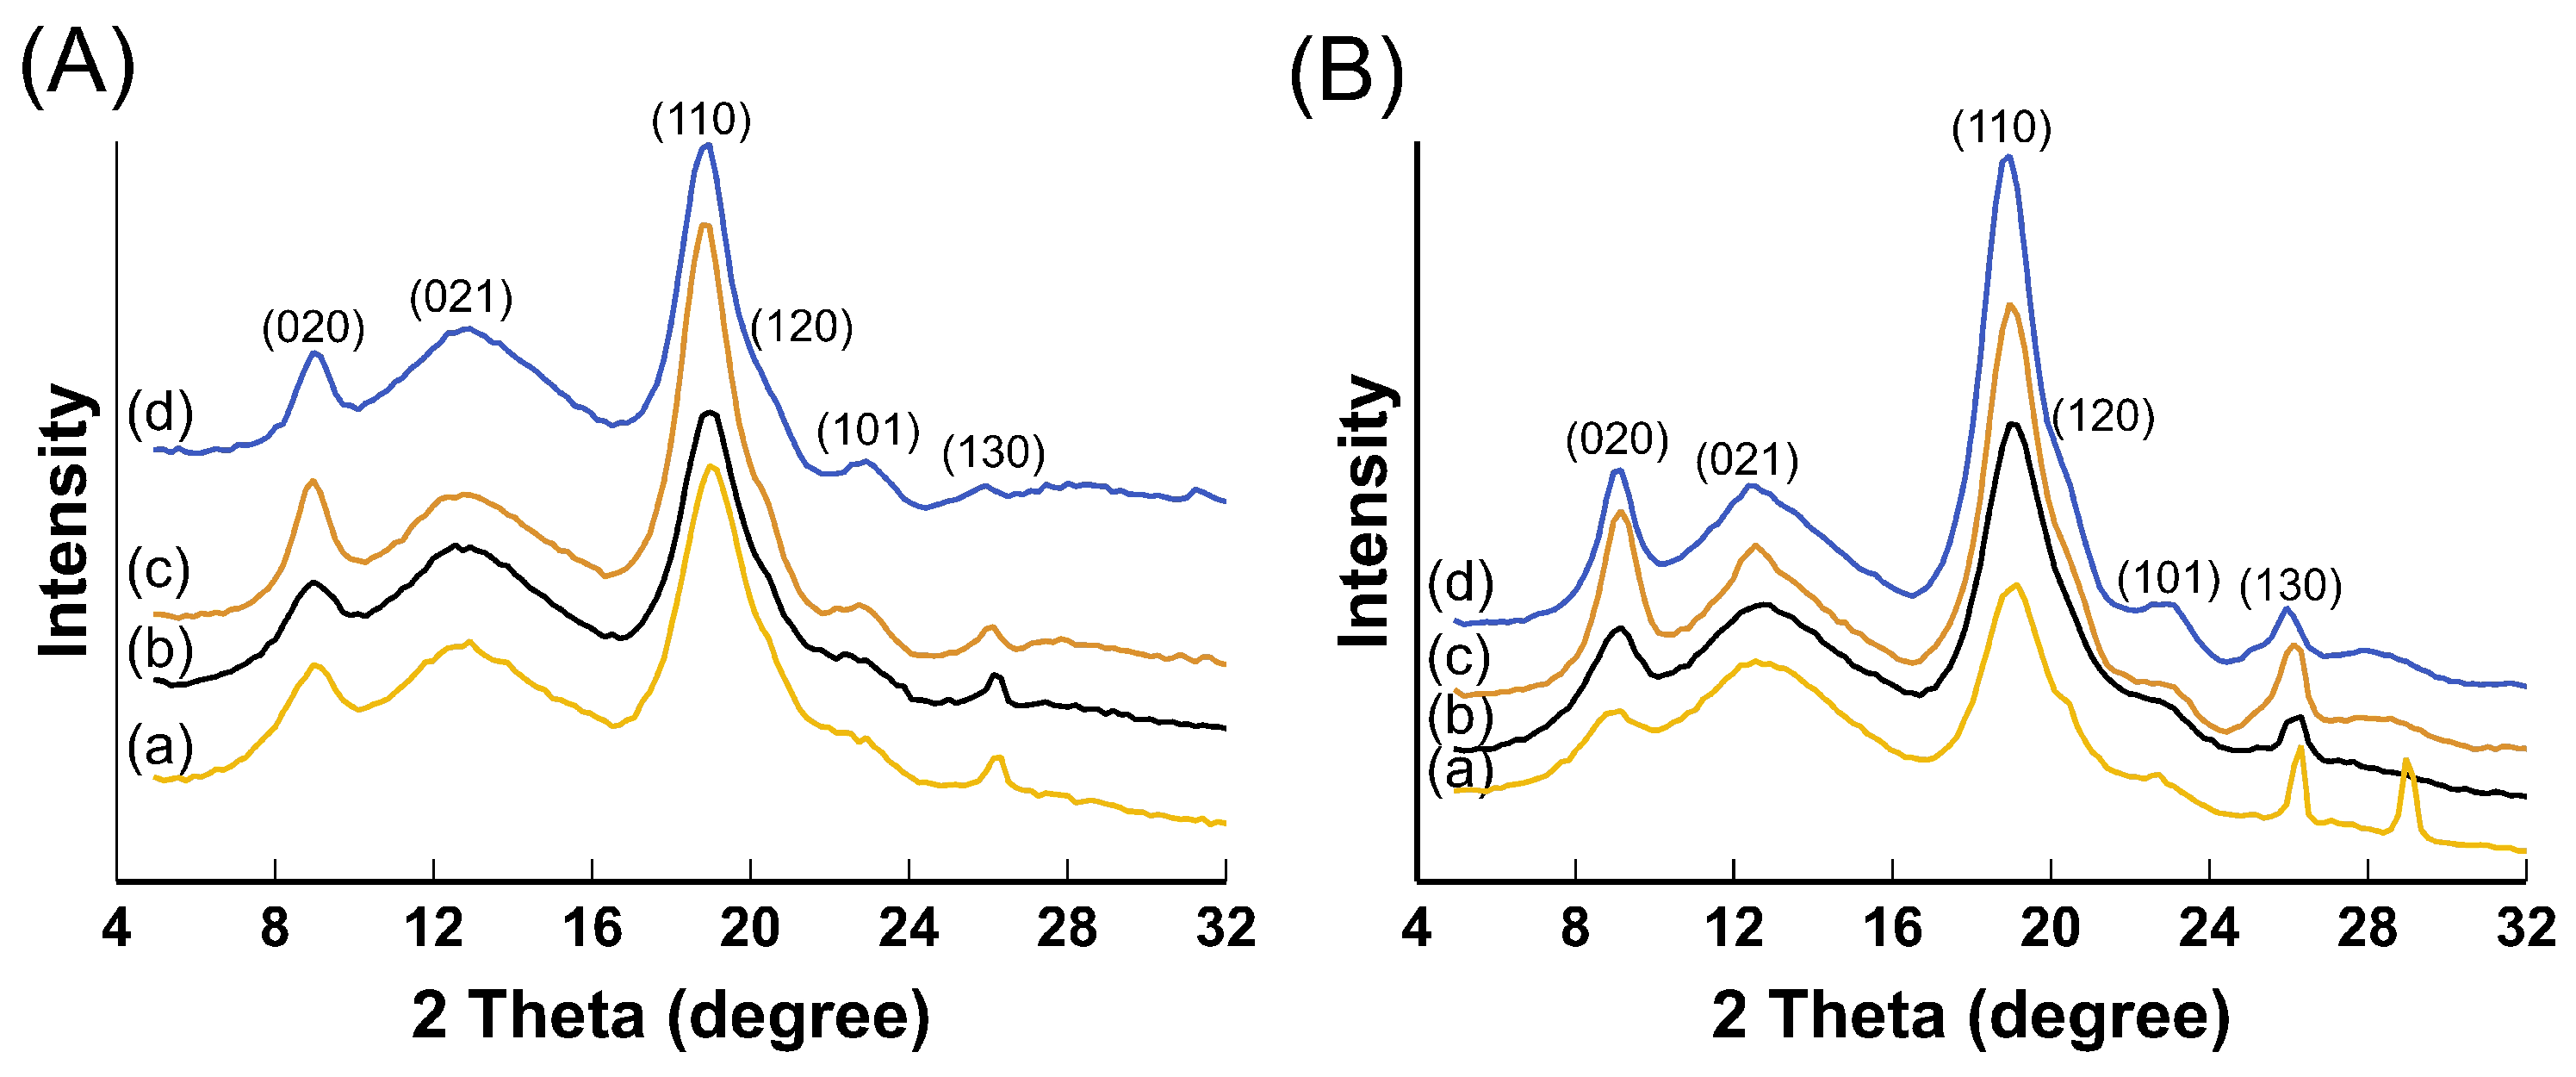
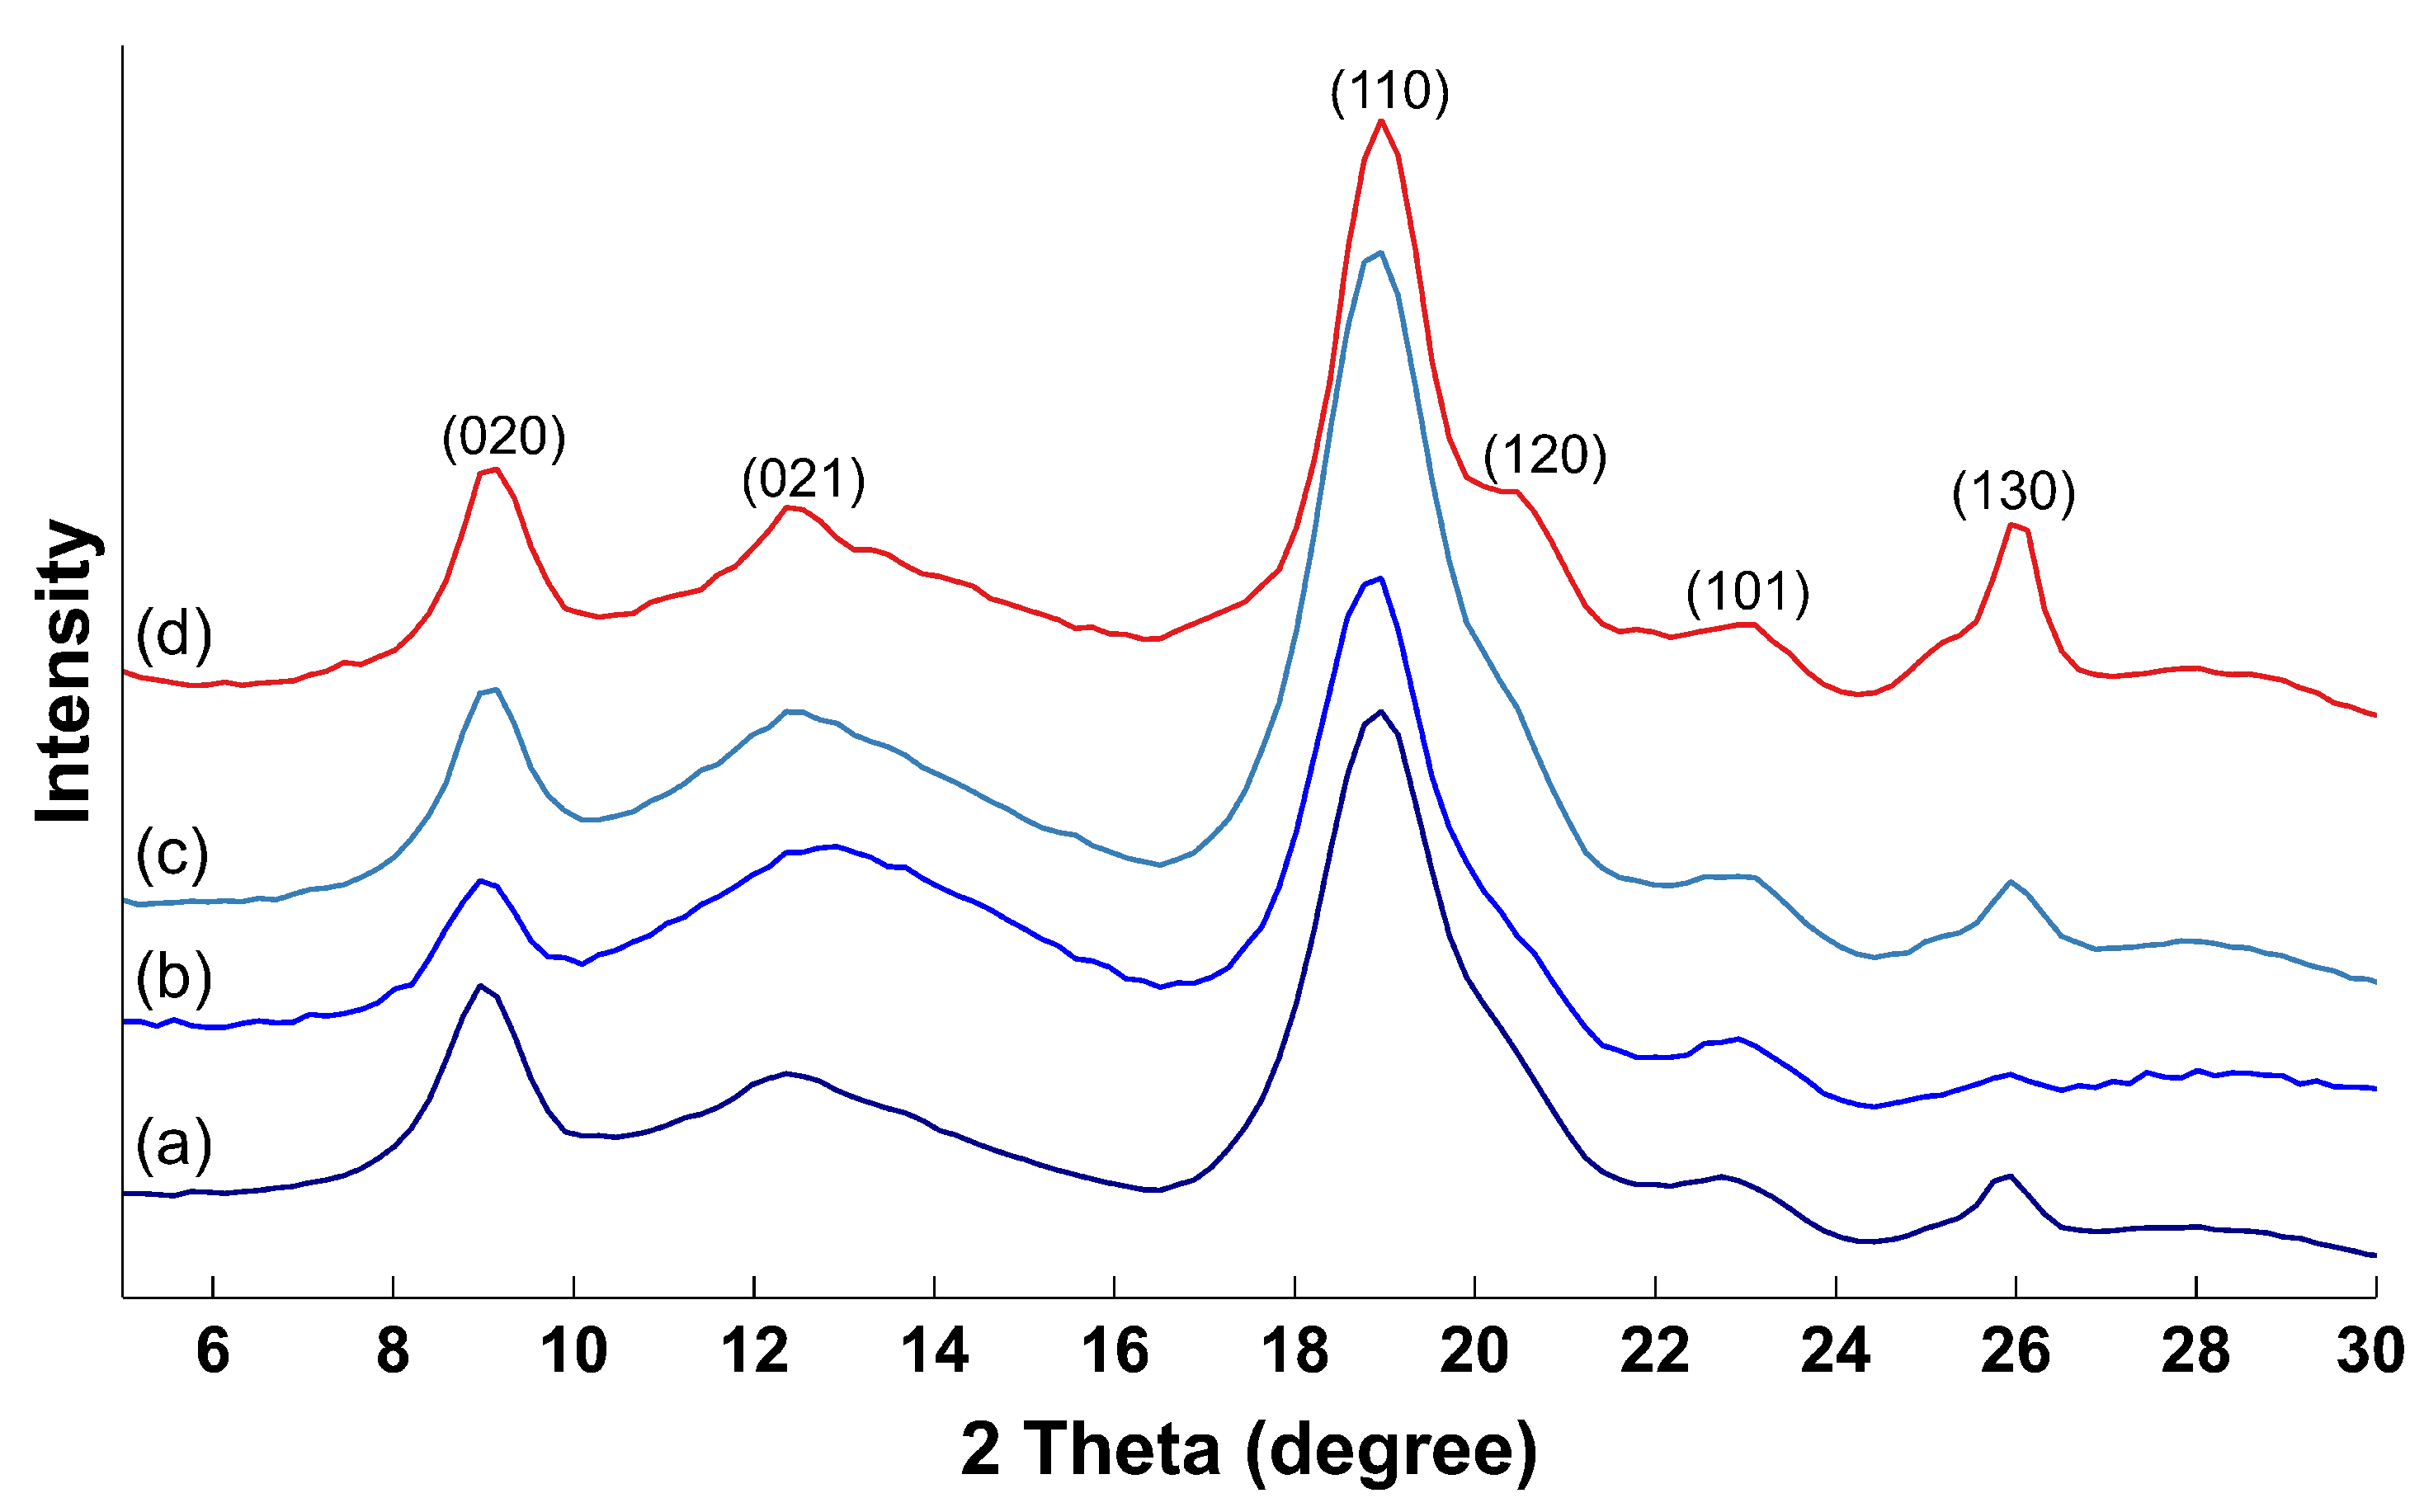
3.2. XRD Spectra of Chitin and Evaluation of the Cristallinity Index

As resulted from studies based on their supramolecular structure, chitin and chitosan, in solid state, are linear semicrystalline polymers [14]. Chitin macromolecules interact through hydrogen bonds to form nanofibrillar bundles called microfibrils, characterized by alternated ordered crystallites and non-ordered (amorphous) domains [15]. Figure 3 shows the XRD spectra of chitin extracted from cicada sloughs harvested in 2017, 2019 and 2020, as well as the spectrum of commercial chitin. All samples present similar spectra with peaks at 2 θ of about 8.9° from (020) planes, 12.5° from (021) planes and 18.9° for from (110) planes of crystalline unit cells and some additional weak peaks (i.e., 25.9° from (130) planes).
In a previous study [9], we analyzed the XRD spectra and measured the CrI not only of the final product chitin, but also of the intermediary products of the extraction process (demineralization, deproteinization and decolorization) performed on cicada sloughs harvested in 2017. Here, we do the same with cicada sloughs harvested in 2019 and 2020. The XRD spectra of raw material, demineralized, deproteinized and decolorized samples extracted from cicada sloughs collected in 2019 and 2020 are shown in Figure A2. We evidenced no particular differences among the XRD spectra of the intermediary products deriving from the extractions performed on the three different lots. Nevertheless, the measure of the CrI value shows interesting results concerning the evolution of the crystallinity of the products during the extraction processes. Table 3 shows the CrI values for the intermediary products of the extraction performed on cicada sloughs collected in 2017 (data reused from [9]), 2019 and 2020. The three lots (2017, 2019 and 2020) showed the same trend with the crystallinity slightly decreasing from the raw materials to the demineralized ones, increasing from the demineralized to the deproteinized and being almost stable from the deproteinized to the decolorized chitin. According to these results, chitin extracted from cicada sloughs collected in 2017 has a greater crystallinity (72.1%) compared to the chitin extracted from sloughs collected in 2019 and 2020 (61.5% and 61.6%, respectively). However, it has to be noticed that the decrease in the value of crystallinity for the chitin extracted from cicada sloughs harvested in 2019 and 2020, compared to the one extracted from cicada sloughs collected in 2017, is due to a different initial value of crystallinity in the raw materials (that was 68.6%, 56.4% and 56.1% for chitin 2017, chitin 2019 and chitin 2020, respectively). The trend of the crystallinity value through the extraction process suggests that the extraction process produces coherent results, even if the sources (i.e., raw materials) differ among them.

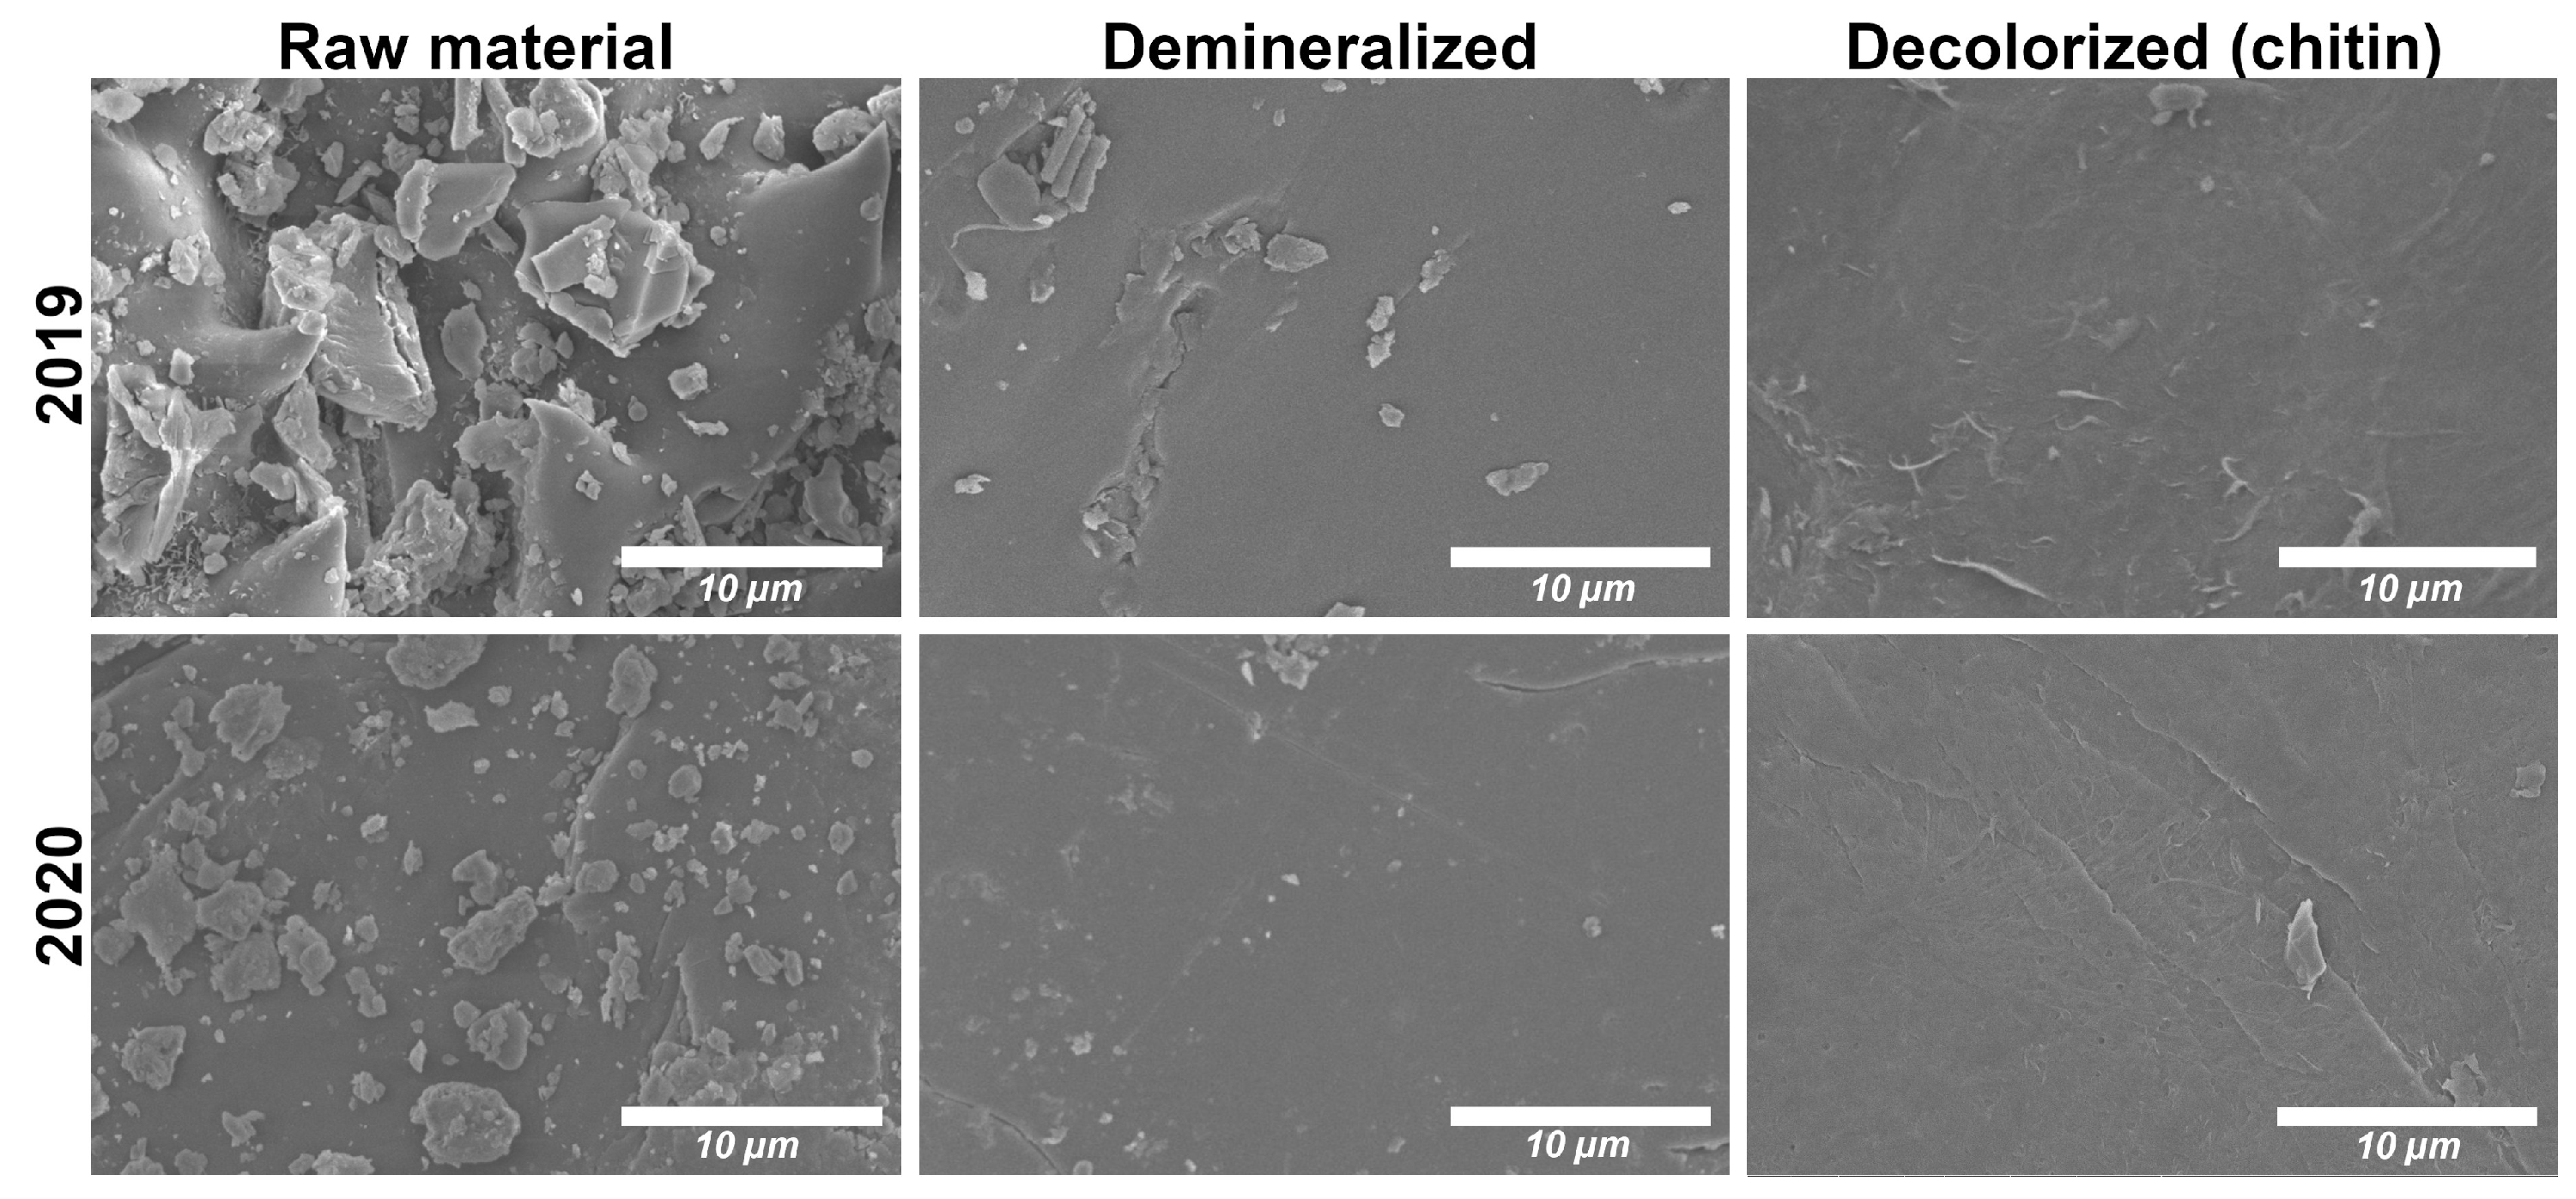
3.3. Scanning Electron Microscopy

Figure 4 shows the SEM images of raw material, demineralized and decolorized (chitin) samples from extractions performed on cicada slough harvested in 2019 and 2020 (for SEM images of extraction performed on cicada sloughs harvested in 2017, refer to the previously published paper [9]). Raw materials present a high amount of granular material, which could be attributed to calcium carbonate crystals. In fact, after the demineralization process, the surfaces appear smoother, suggesting an efficient removal of minerals. On the surface of the final decolorized product (chitin), it is possible to observe the thick chitin micro- and nano-fibers.

3.4. Characterization of the Extracted Chitosan

Chitin extracted from cicada sloughs collected in 2020 has subsequently been deacetylated to obtain chitosan. In order to assess the effectiveness of the deacetylation process and to characterize the extracted chitosan, the FTIR spectrum of the latter has been compared to the spectra of three commercial chitosan (CS-80, CS-90 and CS-95). Even though the spectra (shown in Figure 5) present high similarities among them, the extracted chitosan shows two additional peaks at 1556 and 1631 cm 1 . According to Dahmane et al. [16], the peak at 1631 cm 1 may indicate a specific hydrogen bond between C=O and the hydroxymethyl group (CH 2 -OH) of the next chitin residue of the same chain. Since C=O belongs to the acetyl group, which is characteristic of chitin rather than chitosan, its presence suggests that a high amount of acetyl groups are still present in the extracted chitosan. Dahmane et al. [16] also report that after the deacetylation of chitin, the peak at 1556 cm 1 , corresponding to amide II (N-H bending), disappeared along with the appearance of a new sharp peak at 1595 cm 1 (NH 2 bending). Since these two peaks (i.e., 1556 and 1631 cm 1 ) are more characteristics of chitin rather than chitosan, their presence suggests that the deacetylation process was only partially efficient. This can be confirmed by observing the peak at 1320 cm 1 , which is more intense for the extracted chitosan, while its intensity decreases as the DD increases (CH-95 has the less intense peak). This is due to the fact that the peak at 1320 cm 1 corresponds to the N-acetyl-d-glucosamine, which belongs to chitin (and for this reason included in the calculation of the DA/DD [11]).
The degree of deacetylation of the four chitosan samples has been calculated using the Equations (1) and (2) from their FTIR spectra. In order to assess the accuracy of the calculation of the DD for the extracted chitosan, we used the same method to calculate the DD of the three commercial chitosan (whose DD was stated in the product specification sheet obtained from Heppe Medical Chitosan, HMC + (refer to Section 2.1)). Table 4 shows the measured average DD of the extracted chitosan, CS-80, CS-90 and CS-95 as well as their DD obtained from the product specification sheets. The results show that the FTIR method employed for the calculation of the DD is highly efficient for chitosan with high DD. In fact, the measured value of DD for CS-90 and CS-95 (91.1 ± 1.1 and 93.7 ± 0.7, respectively) falls in the expected values of DD indicated by the company HMC + (87.6–92.5% and ≥92.6%, respectively). However, for the CS-80, we measured a higher DD (89.9 ± 1.6%) compared to the expected one (77.6–82.5%). According to the employed method, the extracted chitosan has a degree of deacetylation of 66.2 ± 1.6%. The low DD measured is not surprising considering the presence of the peaks at 1320, 1556 and 1631 cm 1 described above.
We then looked at the crystallinity of the extracted chitosan. The XRD spectra of the extracted chitosan, CS-80, CS-90 and CS-95 are shown in Figure 6. All the spectra are very similar and present peaks at approximately 12° from (020) plane and 19.5° from (110) plane, which are characteristics of chitosan. The peak at approximately 12° is indicative of the efficiency of the deacetylation process. In fact, while chitin (which is more crystalline than chitosan) present two distinct peaks at 8.9° and 12.5° (see Figure 6), chitosan only presents one large peak between 11.6 and 12.7° [17]. Our result shows that the extracted chitosan still presents a small peak at 8.9° from (020) plane, suggesting that the deacetylation process was not totally efficient. The peak at approximately 19.5° from (110) reflection is representative of the DD and it moves to higher angles while the DD increases. In fact, the peak at 18.9° of chitin (see Figure 3), moves to 19.1° for the extracted chitosan, to 19.7° for CS-80, to 19.9° for CS-90 and to 20° for CS-95. These results confirm that chitin was only partially deacetylated using this deacetylation process and that the extracted chitosan has a lower DD compared to the commercial ones.
Subsequently, we calculated the crystallinity index (CrI) of the extracted chitosan, CS-80, CS-90 and CS-95. The results are shown in Table 5. The extracted chitosan presented a higher CrI (53.7%) compared to CS-80, CS-90 and CS-95 (42.8, 49.4 and 49.4%, respectively). Several studies report that there is an indirect correlation between the DD and CrI with the CrI decreasing with increased DD [18,19], while other studied show opposite trends [20,21]. According to Wu et al. [22], the decrease in the CrI with increased DD is due to the fact that fewer acetyl groups are present, they are distributed more randomly and, consequently, the development of broad crystalline regions is not allowed. We found that the CrI increased with increased DD for the commercial chitosan (CS-80 has a lower CrI compared to CS-90 and CS-95). However, the extracted chitosan does not follow the same trend. On the contrary, the CrI of the extracted chitosan was more similar to the CrI found for chitin (CH-20, which was 61.6%), suggesting that the deacetylation was only partially efficient.
Figure 7 shows SEM images of extracted chitosan, CS-80, CS-90 and CS-95. The surface morphology of the four samples is similar and presents a fibrillar structure. However, the nano-fibers of the extracted chitosan are less evident compared to the commercial samples.

4. Discussion

In this study, chitin extracted from cicada sloughs harvested in two different years (2019 and 2020) has been characterized from a physicochemical point of view and compared to the chitin extracted from cicada sloughs harvested in 2017, the results of which are reported in a previous study [9]. The main objective of this comparison was to assess the stability of cicada sloughs as a source of chitin and to evaluate the efficiency of the extraction process. For that, we evaluated two of the parameters that mostly influence the chemical, physical and biological behavior of chitin and its derivative chitosan: the degree of acetylation/deacetylation (DA/DD) and the index of crystallinity (CrI) using simple techniques such as FTIR and XRD.
Our results show that chitin extracted from cicada sloughs harvested in 2020 has a significantly lower degree of acetylation compared to chitin extracted from cicada sloughs collected in 2017 and 2019. Other authors reported variabilities within the source harvested in different years or seasons. For example, Youn et al. [8] reported that the degree of deacetylation of chitosan obtained from the transformation of chitin extracted from shells of crabs harvested in three different seasons and years (July 2004, January 2005, and September 2007) was slightly different: 89.01%, 84.11% and 82.49% for the three seasons, respectively. However, in addition to having been harvested in three different years and seasons, samples (crab shells) were stored for different time before being characterized, and in particular for 3.5 years, 3 years and 3 months, respectively for shells harvested in July 2004, January 2005, and September 2007. The results showed that chitosan having longer storage time presented higher DD. However, the authors of the study were unable to conclude if the differences were due to the storage time or to the season or year of collection of crab shells.In another study, Green et al. [7], reported that within the same source (that in their case was crustacean shells), the content in minerals, proteins and chitin and the physicochemical properties of the latter can differ based on the season when the shells are collected. However, again, there is no information about how the different compositions in minerals, proteins and chitin would influence the characteristics of the final product chitin, in terms of degree of acetylation. In order to better analyze the differences that we found in the degree of acetylation of chitin extracted from cicada sloughs in different years, we compared the FTIR spectra of the raw materials (i.e., cicada sloughs). We found that two specific peaks (at 1420 and 1375 cm 1 ) have an opposite conformation in the sample CH-20 as compared to CH-17 and CH-19 which might justify the lower degree of acetylation of CH-20. However, the reasons for the lower degree of acetylation are unknown and further investigations are needed to understand the relation between DA/DD and, for example, abundance and structural organization of proteins and minerals within the source.
Concerning the crystallinity, we found that chitin extracted from cicada sloughs collected in 2017 has a greater crystallinity compared to the ones extracted from cicada sloughs harvested in 2019 and 2020. The evaluation of the CrI measured for the raw material showed that also the raw material of cicada sloughs harvested in 2017 had a greater crystallinity compared to the raw materials of cicada sloughs collected in 2019 and 2020. This result suggests that, within the source, chitin might be organized differently, or sloughs have a different composition (in terms of proteins and minerals) giving rise to a more or less crystalline structure [23]. The evaluation of the CrI and for the intermediary products resulting from the extraction of chitin (i.e., demineralized, deproteinized) gave us some important information about the repeatability of the extraction process. In fact, the trend of crystallinity displayed by these products (i.e., decreasing after demineralization, increasing after deproteinization and being almost stable after decolorization) suggests that the extraction process produces coherent results.
We then performed the deacetylation of chitin in order to obtain chitosan using a previously published protocol [10]. We compared the FTIR and XDR spectra and the resulting measured DD and CrI values of the extracted chitosan to three commercial chitosan with known DD. We found that the method employed in this study for the calculation of the DD was efficient for chitosan with high DD (90 and 95%), while it was less precise for chitosan with lower DD (80%). Using this method, the DD that we measured for the extracted chitosan was 66.2 ± 1.6 %. Even if the molecule extracted could be considered as chitosan (since the DD is higher than 50%), this result suggests that the deacetylation process was not the most appropriate for the deacetylation of this source. Luo et al. [10], by using the same protocol for the deacetylation of chitin extracted from cicada sloughs, obtained a chitosan with a DD of 84.1%. However, in their study, the DD was calculated using different absorbance peaks of the FTIR spectra, which might lead to different results. Concerning the crystallinity, we found that the extracted chitosan had a higher CrI compared to the commercial chitosan. Several studies show a tendency of the DD and CrI to be indirectly related with higher DD showing lower CrI [18,22]. However, other studies show an opposite trend [20,21] and this relation is still an object of discussion. The methods employed in this study for the calculation of the DA/DD and CrI present some limitations. In fact, more sophisticated techniques such as Nuclear Magnetic Resonance (NMR) spectrometry and X-ray photoelectron spectroscopy (XPS) would allow us to obtain more precise measurements of the degree of acetylation and alternative methods for the calculation of the CrI have been proposed in the literature (i.e., the use of the peak I 020 in the Equation (3) instead of I 110 [18]). However, when applied uniformly, the FTIR and XRD methods employed in this study are highly efficient to compare multiple samples among them. The characterization, in particular, of the DD of chitosan, is essential since it influences its possible applications [24]. In the biomedical field, DD is one of the most important properties of chitosan since most of its biological properties are attributed to its cationic behavior, which depends on its DD. In fact, in acidic solutions, the amine groups (NH 2 ) of chitosan acquire a positive charge (NH 3 + ) [25]. This property makes chitosan the only naturally cationic polysaccharide, allowing it to form polyelectrolyte complexes with negatively charged polymers [4]. Several studies investigated the effect of different DD for different applications. Some authors report that chitosan with high DD is more suitable for tissue engineering [26] because usually constructs made of chitosan with lower DD degrade faster, leading to less supportive healing. However, other studies reported the higher the DD of chitosan, the lower was the adhesion of keratinocytes and fibroblasts on chitosan films [27]. Chitosan is also highly used as a vehicle for nucleic acid or drug delivery (in form of nano- or micro-particles). Sizovs et al. [28] reported that a degree of deacetylation of at least 65% is required for an efficient transfection with the desirable value being in the range of 65–80%. Gupta et al. [29] showed that microspheres prepared using chitosan with a DD comprised between 48–62% presented a higher drug loading capacity.

5. Conclusions

In this work, we compared the physicochemical properties (i.e., degree of deacetylation and crystallinity index) of chitin extracted from Cicada orni sloughs harvested in three different years in order to assess the repeatability of the extraction process and the stability of cicada sloughs as a source of chitin. We found that the extracted chitin presented different physicochemical characteristics from one year to another and that this variability seems not to be dependent on the extraction process, but rather on intrinsic differences within the source, as suggested by the results obtained on the raw material (i.e., cicada sloughs) through FTIR and XRD analysis. The methodology employed in this study, based on the evaluation of the raw material and the resulting intermediary products of the extraction (i.e., demineralized and deproteinized products) in terms of FTIR spectra and trends of crystallinity, could be extended to the evaluation of the quality of other sources and the effectiveness of different extraction protocols. We then determined the physicochemical properties of chitosan and found that it has a low degree of deacetylation ( 66.2 ± 1.6 %), which can be attributed to the deacetylation process, which is probably not appropriate for this source. Further studies should be conducted to understand the causes of the variability in cicada sloughs over the years and to optimize the protocol of deacetylation in order to obtain chitosan with a higher degree of deacetylation.

Author Contributions

Conceptualization, F.C. and A.P.; investigation, A.P., T.G., C.P.; writing—original draft preparation, A.P.; writing—review and editing, A.P., T.G., S.F., J.-P.J., E.A.-T., J.F.M.; supervision, F.C. and J.F.M.; funding acquisition, F.C. All authors have read and agreed to the published version of the manuscript.

Funding

This work was supported by the French PIA project “Lorraine Université d’excellence”, reference ANR-15-IDEX-04-LUE and by CNRS GDR 2088 BIOMIM.

Conflicts of Interest

The authors declare no conflict of interest.

Abbreviations

Appendix A

Appendix A.1. FTIR Spectra of All the Steps of the Extraction

Figure A1. FTIR spectra of raw material (a), demineralized (b), deproteinized (c) and decolorized (d) samples extracted in (A) 2019 and (B) 2020.
Applsci 11 11278 g0a1

Appendix A.2. XRD Spectra of All the Steps of the Extraction

Figure A2. XRD spectra of raw material (yellow), demineralized (black), deproteinized (orange) and decolorized (blue) samples extracted in (A) 2019 and (B) 2020.
Applsci 11 11278 g0a2

References

  1. El Knidri, H.; Belaabed, R.; Addaou, A.; Laajeb, A.; Lahsini, A. Extraction, chemical modification and characterization of chitin and chitosan. Int. J. Biol. Macromol. 2018, 120, 1181–1189. [Google Scholar] [CrossRef] [PubMed]
  2. Roy, J.C.; Salaün, F.; Giraud, S.; Ferri, A.; Chen, G.; Guan, J. Solubility of chitin: Solvents, solution behaviors and their related mechanisms. Solubility Polysacch. 2017, 10. [Google Scholar] [CrossRef] [Green Version]
  3. Jang, M.K.; Kong, B.G.; Jeong, Y.I.; Lee, C.H.; Nah, J.W. Physicochemical characterization of α-chitin, β-chitin, and γ-chitin separated from natural resources. J. Polym. Sci. Part Polym. Chem. 2004, 42, 3423–3432. [Google Scholar] [CrossRef]
  4. Cheung, R.C.F.; Ng, T.B.; Wong, J.H.; Chan, W.Y. Chitosan: An update on potential biomedical and pharmaceutical applications. Mar. Drugs 2015, 13, 5156–5186. [Google Scholar] [CrossRef] [PubMed]
  5. Alves, N.M.; Mano, J.F. Chitosan derivatives obtained by chemical modifications for biomedical and environmental applications. Int. J. Biol. Macromol. 2008, 43, 401–414. [Google Scholar] [CrossRef] [Green Version]
  6. Hahn, T.; Tafi, E.; Paul, A.; Salvia, R.; Falabella, P.; Zibek, S. Current state of chitin purification and chitosan production from insects. J. Chem. Technol. Biotechnol. 2020, 95, 2775–2795. [Google Scholar] [CrossRef]
  7. Green, J.; Mattick, J. Fishery waste management. Food Process. Waste Manag. 1979, 202–227. [Google Scholar]
  8. Youn, D.K.; No, H.K.; Prinyawiwatkul, W. Physicochemical and functional properties of chitosans prepared from shells of crabs harvested in three different years. Carbohydr. Polym. 2009, 78, 41–45. [Google Scholar] [CrossRef]
  9. Poerio, A.; Petit, C.; Jehl, J.P.; Arab-Tehrany, E.; Mano, J.F.; Cleymand, F. Extraction and Physicochemical Characterization of Chitin from Cicada orni Sloughs of the South-Eastern French Mediterranean Basin. Molecules 2020, 25, 2543. [Google Scholar] [CrossRef]
  10. Luo, Q.; Wang, Y.; Han, Q.; Ji, L.; Zhang, H.; Fei, Z.; Wang, Y. Comparison of the physicochemical, rheological, and morphologic properties of chitosan from four insects. Carbohydr. Polym. 2019, 209, 266–275. [Google Scholar] [CrossRef]
  11. Brugnerotto, J.; Lizardi, J.; Goycoolea, F.; Argüelles-Monal, W.; Desbrieres, J.; Rinaudo, M. An infrared investigation in relation with chitin and chitosan characterization. Polymer 2001, 42, 3569–3580. [Google Scholar] [CrossRef]
  12. Zhao, D.; Huang, W.C.; Guo, N.; Zhang, S.; Xue, C.; Mao, X. Two-step separation of chitin from shrimp shells using citric acid and deep eutectic solvents with the assistance of microwave. Polymers 2019, 11, 409. [Google Scholar] [CrossRef] [Green Version]
  13. Hassainia, A.; Satha, H.; Boufi, S. Chitin from Agaricus bisporus: Extraction and characterization. Int. J. Biol. Macromol. 2018, 117, 1334–1342. [Google Scholar] [CrossRef] [PubMed]
  14. Rinaudo, M. Chitin and chitosan: Properties and applications. Prog. Polym. Sci. 2006, 31, 603–632. [Google Scholar] [CrossRef]
  15. Ioelovich, M. Crystallinity and hydrophility of chitin and chitosan. J. Chem. 2014, 3, 7–14. [Google Scholar]
  16. Dahmane, E.M.; Taourirte, M.; Eladlani, N.; Rhazi, M. Extraction and characterization of chitin and chitosan from Parapenaeus longirostris from Moroccan local sources. Int. J. Polym. Anal. Charact. 2014, 19, 342–351. [Google Scholar] [CrossRef]
  17. Daraghmeh, N.H.; Chowdhry, B.Z.; Leharne, S.A.; Al Omari, M.M.; Badwan, A.A. Chitin. In Profiles of Drug Substances, Excipients and Related Methodology; Elsevier: Amsterdam, The Netherlands, 2011; Volume 36, pp. 35–102. [Google Scholar]
  18. Zhang, Y.; Xue, C.; Xue, Y.; Gao, R.; Zhang, X. Determination of the degree of deacetylation of chitin and chitosan by X-ray powder diffraction. Carbohydr. Res. 2005, 340, 1914–1917. [Google Scholar] [CrossRef]
  19. Xu, J.; Liu, L.; Yu, J.; Zou, Y.; Wang, Z.; Fan, Y. DDA (degree of deacetylation) and pH-dependent antibacterial properties of chitin nanofibers against Escherichia coli. Cellulose 2019, 26, 2279–2290. [Google Scholar] [CrossRef]
  20. Wenling, C.; Duohui, J.; Jiamou, L.; Yandao, G.; Nanming, Z.; Xiufang, Z. Effects of the degree of deacetylation on the physicochemical properties and Schwann cell affinity of chitosan films. J. Biomater. Appl. 2005, 20, 157–177. [Google Scholar] [CrossRef]
  21. Foster, L.J.R.; Ho, S.; Hook, J.; Basuki, M.; Marcal, H. Chitosan as a biomaterial: Influence of degree of deacetylation on its physiochemical, material and biological properties. PLoS ONE 2015, 10, e0135153. [Google Scholar]
  22. Wu, T.; Zivanovic, S.; Draughon, F.A.; Conway, W.S.; Sams, C.E. Physicochemical properties and bioactivity of fungal chitin and chitosan. J. Agric. Food Chem. 2005, 53, 3888–3894. [Google Scholar] [CrossRef]
  23. Chandran, R.; Williams, L.; Hung, A.; Nowlin, K.; LaJeunesse, D. SEM characterization of anatomical variation in chitin organization in insect and arthropod cuticles. Micron 2016, 82, 74–85. [Google Scholar] [CrossRef]
  24. Aranaz, I.; Mengíbar, M.; Harris, R.; Paños, I.; Miralles, B.; Acosta, N.; Galed, G.; Heras, Á. Functional characterization of chitin and chitosan. Curr. Chem. Biol. 2009, 3, 203–230. [Google Scholar]
  25. Madera-Santana, T.J.; Herrera-Méndez, C.H.; Rodríguez-Núñez, J.R. An overview of the chemical modifications of chitosan and their advantages. Green Mater. 2018, 6, 131–142. [Google Scholar] [CrossRef] [Green Version]
  26. Hsu, S.h.; Whu, S.W.; Tsai, C.L.; Wu, Y.H.; Chen, H.W.; Hsieh, K.H. Chitosan as scaffold materials: Effects of molecular weight and degree of deacetylation. J. Polym. Res. 2004, 11, 141–147. [Google Scholar] [CrossRef]
  27. Chatelet, C.; Damour, O.; Domard, A. Influence of the degree of acetylation on some biological properties of chitosan films. Biomaterials 2001, 22, 261–268. [Google Scholar] [CrossRef]
  28. Sizovs, A.; McLendon, P.M.; Srinivasachari, S.; Reineke, T.M. Carbohydrate polymers for nonviral nucleic acid delivery. Nucleic Acid Transfection 2010, 131–190. [Google Scholar]
  29. Gupta, K.; Jabrail, F.H. Effects of degree of deacetylation and cross-linking on physical characteristics, swelling and release behavior of chitosan microspheres. Carbohydr. Polym. 2006, 66, 43–54. [Google Scholar] [CrossRef]
Figure 1. FTIR spectra of CH-17 (a), CH-19 (b), CH-20 (c) and of a commercial chitin (d).
Applsci 11 11278 g001
Figure 2. FTIR spectra of raw material (cicada sloughs) harvested in 2017 (a), 2019 (b) and 2020 (c).
Applsci 11 11278 g002
Figure 3. XRD spectra of CH-17 (a), CH-19 (b), CH-20 (c) and of a commercial chitin (d).
Applsci 11 11278 g003
Figure 4. SEM images of raw material, demineralized and decolorized samples harvested in 2019 and 2020.
Applsci 11 11278 g004
Figure 5. FTIR spectra of: (a) extracted chitosan, (b) CS-80, (c) CS-90 and (d) CS-95.
Applsci 11 11278 g005
Figure 6. XRD of: (a) extracted chitosan, (b) CS-80, (c) CS-90 and (d) CS-95.
Applsci 11 11278 g006
Figure 7. SEM images of: (a) extracted chitosan, (b) CS-80,(c) CS-90 and (d) CS-95.
Applsci 11 11278 g007
Table 1. Abbreviations of the samples used through the text.
AbbreviationsCorresponding Sample
CH-17Chitin extracted from cicada sloughs harvested in 2017
CH-19Chitin extracted from cicada sloughs harvested in 2019
CH-20Chitin extracted from cicada sloughs harvested in 2020
CS-80Commercial chitosan with a DD of ≈80 %
CS-90Commercial chitosan with a DD of ≈90 %
CS-95Commercial chitosan with a DD of ≈95 %
Table 2. Average degree of acetylation (DA) of CH-17, CH-19 and CH-20.
CH-17CH-19CH-20
DA % 96.3 ± 3.4 102.7 ± 5.5 74.7 ± 3.1
Table 3. Crystallinity index (CrI) % of raw material, demineralized, deproteinized and decolorized samples extracted in 2017, 2019 and 2020.
201720192020
Raw material 68.6 56.4 56.1
Demineralized 55.8 54.2 49.4
Deproteinized 73.4 65.2 62.5
Decolorized 72.1 61.5 61.6
Table 4. Measured average degree of deacetylation (DD) of chitosan extracted form cicada sloughs harvested in 2020 and of three commercial chitosan with known DD (CS-80, CS-90 and CS-95). For the latter, the DD provided by the supplier company is also indicated.
Extracted ChitosanCS-80CS-90CS-95
DD % 66.2 ± 1.6 89.9 ± 1.6 91.1 ± 1.1 93.7 ± 0.7
Expected DD %77.6–82.587.6–92.5≥92.6
Table 5. Crystallinity index (CrI) % of the extracted chitosan and CS-80, CS-90 and CS-95.
Extracted ChitosanCS-80CS-90CS-95
CrI (%) 53.7 42.8 49.4 49.4
Publisher’s Note: MDPI stays neutral with regard to jurisdictional claims in published maps and institutional affiliations.

