1. Introduction
Nowadays, the monitoring of bridging structures is mostly based on measuring the displacements, deformations, and vibrations of bridges. Data on the static and dynamic behavior of a structure under load are usually obtained by a load test. Data on the long-term behavior of facilities are obtained by load testing and continued monitoring. This is important for heavily loaded objects on highways or railroads. The technological development of measuring equipment has also intervened in the field of geodetic instruments. The measurement can be performed in several ways. The group of alternative methods includes geodetic (optical) measurements, which can be static or dynamic. Measuring systems can be contact or non-contact. In practice, displacements are measured only at certain points with a limited set of measuring instruments, which requires a lot of time to prepare measuring points. The result of the non-contact measuring system is the movement of individual points in different places. In addition to making optical systems more accurate, measurements are more transparent and there is virtually no preparation for measurement. Automatic capture of measured values allows us to quickly and reliably determine the position of points. Because the processing of oscillation signals is conditioned by the sampling frequency, the measurement accuracy is improved by increasing the readings per second. Until recently, only vertical and horizontal displacements could be determined by geodetic measurements. Today, with the development of geodetic equipment, increasing resolution, additional sensors for faster reading, and automatic prism monitoring, it is possible, when geodetic measurements are taken together with very accurate static measurements, to perform dynamic response measurements in various monitoring [
1,
2]. It should be noted that geodetic methods can be used in a very simple way to obtain quality data on the behavior of struction in locations where this would not be possible due to inaccessibility or difficulty with other methods.
The problem of determining the actual deformations of buildings under the influence of dynamic loads has been unsolved from the point of view of geodesy until recently. Systematic measurements of displacements of more flexible struction structures (e.g., bridges, tall buildings) began to be carried out with the advent of advanced geodetic devices such as GNSS, which enabled the capture of a sufficient number of position measurements in a certain time interval. The system works on the principle of connection with satellites, so the condition for performing such measurements is an unobstructed view of the horizon and the presence of a sufficient number of satellites. Problems occur in narrow basins and ravines or in urban settlements, where a clear path to the satellites is difficult to ensure throughout the measurement. With the development of two-frequency systems, today, we can perform measurements according to the system of the relative method using phase (real-time kinematic—RTK), thus avoiding problems with the satellite signal.
Due to the possibility of determining the 3D position of points in motion in an absolute system with the ability to read from 1 to 100 measurements per second, the GNSS method has become useful in addition to static measurements also suitable for dynamic research. Today’s GNSS equipment allows us to read between 10 and 20 Hz. The development of GNSS technology today allows us to measure with a frequency of 50 Hz as well as up to 100 Hz [
3,
4,
5,
6,
7,
8,
9].
The shortcomings of the GNSS method, such as multipath, poor satellite distribution, the unreliability of the elevation component, and other known shortcomings, are complemented by the introduction of additional geodetic measurements with the RTS method. The dynamic measurements of structures are mostly contaminated by dynamic noise, which is worsened by the errors caused by the GNSS monitoring techniques. Therefore, before studying the dynamic behavior of a structure, the de-noising, smoothing, and filtering methods should be applied to eliminate the effects of noise [
10].
Various authors [
11,
12,
13,
14,
15,
16,
17,
18,
19,
20,
21,
22] mainly dealt with the synchronization of the measurement signal obtained by the RTS method, which is essential for further dynamic response analyses.
With the development of technology and additional programs, the lack of synchronization is eliminated. If the struction, working conditions, weather, and time allow, it makes sense to use several independent measurement methods and to compare the measured values. The method of comparison was described in the work of Lekidis et al., 2005 [
18]. Today, modern geodetic instruments and sensors such as GNSS, RTS, and Scanners can be used for static and dynamic bridge monitoring [
1], which are the main part of a bridge’s load test after its construction, reconstruction, or remediation.
Nowadays, the RTS system is mainly used, which enables automatic prism monitoring up to a speed of 30 Hz, which is enough for dynamic monitoring of objects in the range of a few centimeters [
8,
9,
10,
11,
12,
13,
14]. Increasing the number of complaints allows an additional program, which controls the RTS station via a laptop The software was developed at the Faculty of Geodesy in Zagreb (Zagreb, Croatia) and allows us to make two types of measurements: measurements of length, Hz (horizontal angles) and V (vertical angles) angle in milli-seconds and measurements of Hz and V angle only, whereby, due to the exclusion of the distance measurement, it is possible to make several more regular measurements per second [
14,
15].
To better understand the behavior of the structure, it is reasonable to perform measurements with different independent non-contact methods and compare the results, as presented in [
22]. Recently, many authors [
23,
24,
25,
26,
27,
28,
29,
30] have been concerned with the use and accuracy of the results obtained with GNSS and terrestrial scanners in the determination of the structural response and in various types of object monitoring.
In this paper, we give an example of a new way of performing measurements of the dynamic response of a bridging structure using two completely different measuring techniques. RTS was used to measure displacements on two separate structures in the vertical direction of the structure oscillation. In parallel with these measurements, we performed vibration velocity measurements with a seismograph and an associated geophone. Based on the measured physical values, the program was used to analyze the dynamic response of the bridging structure.
The Purpose of Study
The monitoring of displacements and deformations is necessary primarily for the protection of lives and property and to determine the condition of structures. There are many methods for monitoring displacements, and the purpose of our work is to upgrade already known methods and perform synchronization and comparison of results obtained with different methods. In this work, we used a robotic total setting, which with an additional program, increased the possibility of capturing data from 9 to 26 measurements per second. The program allows different combinations of measurements depending on what we need. A novelty in the paper is the analysis, comparison, and synchronization of the obtained measurements with emphasis on the results of RTS in determining the dynamic response of the structure.
2. Materials and Methods
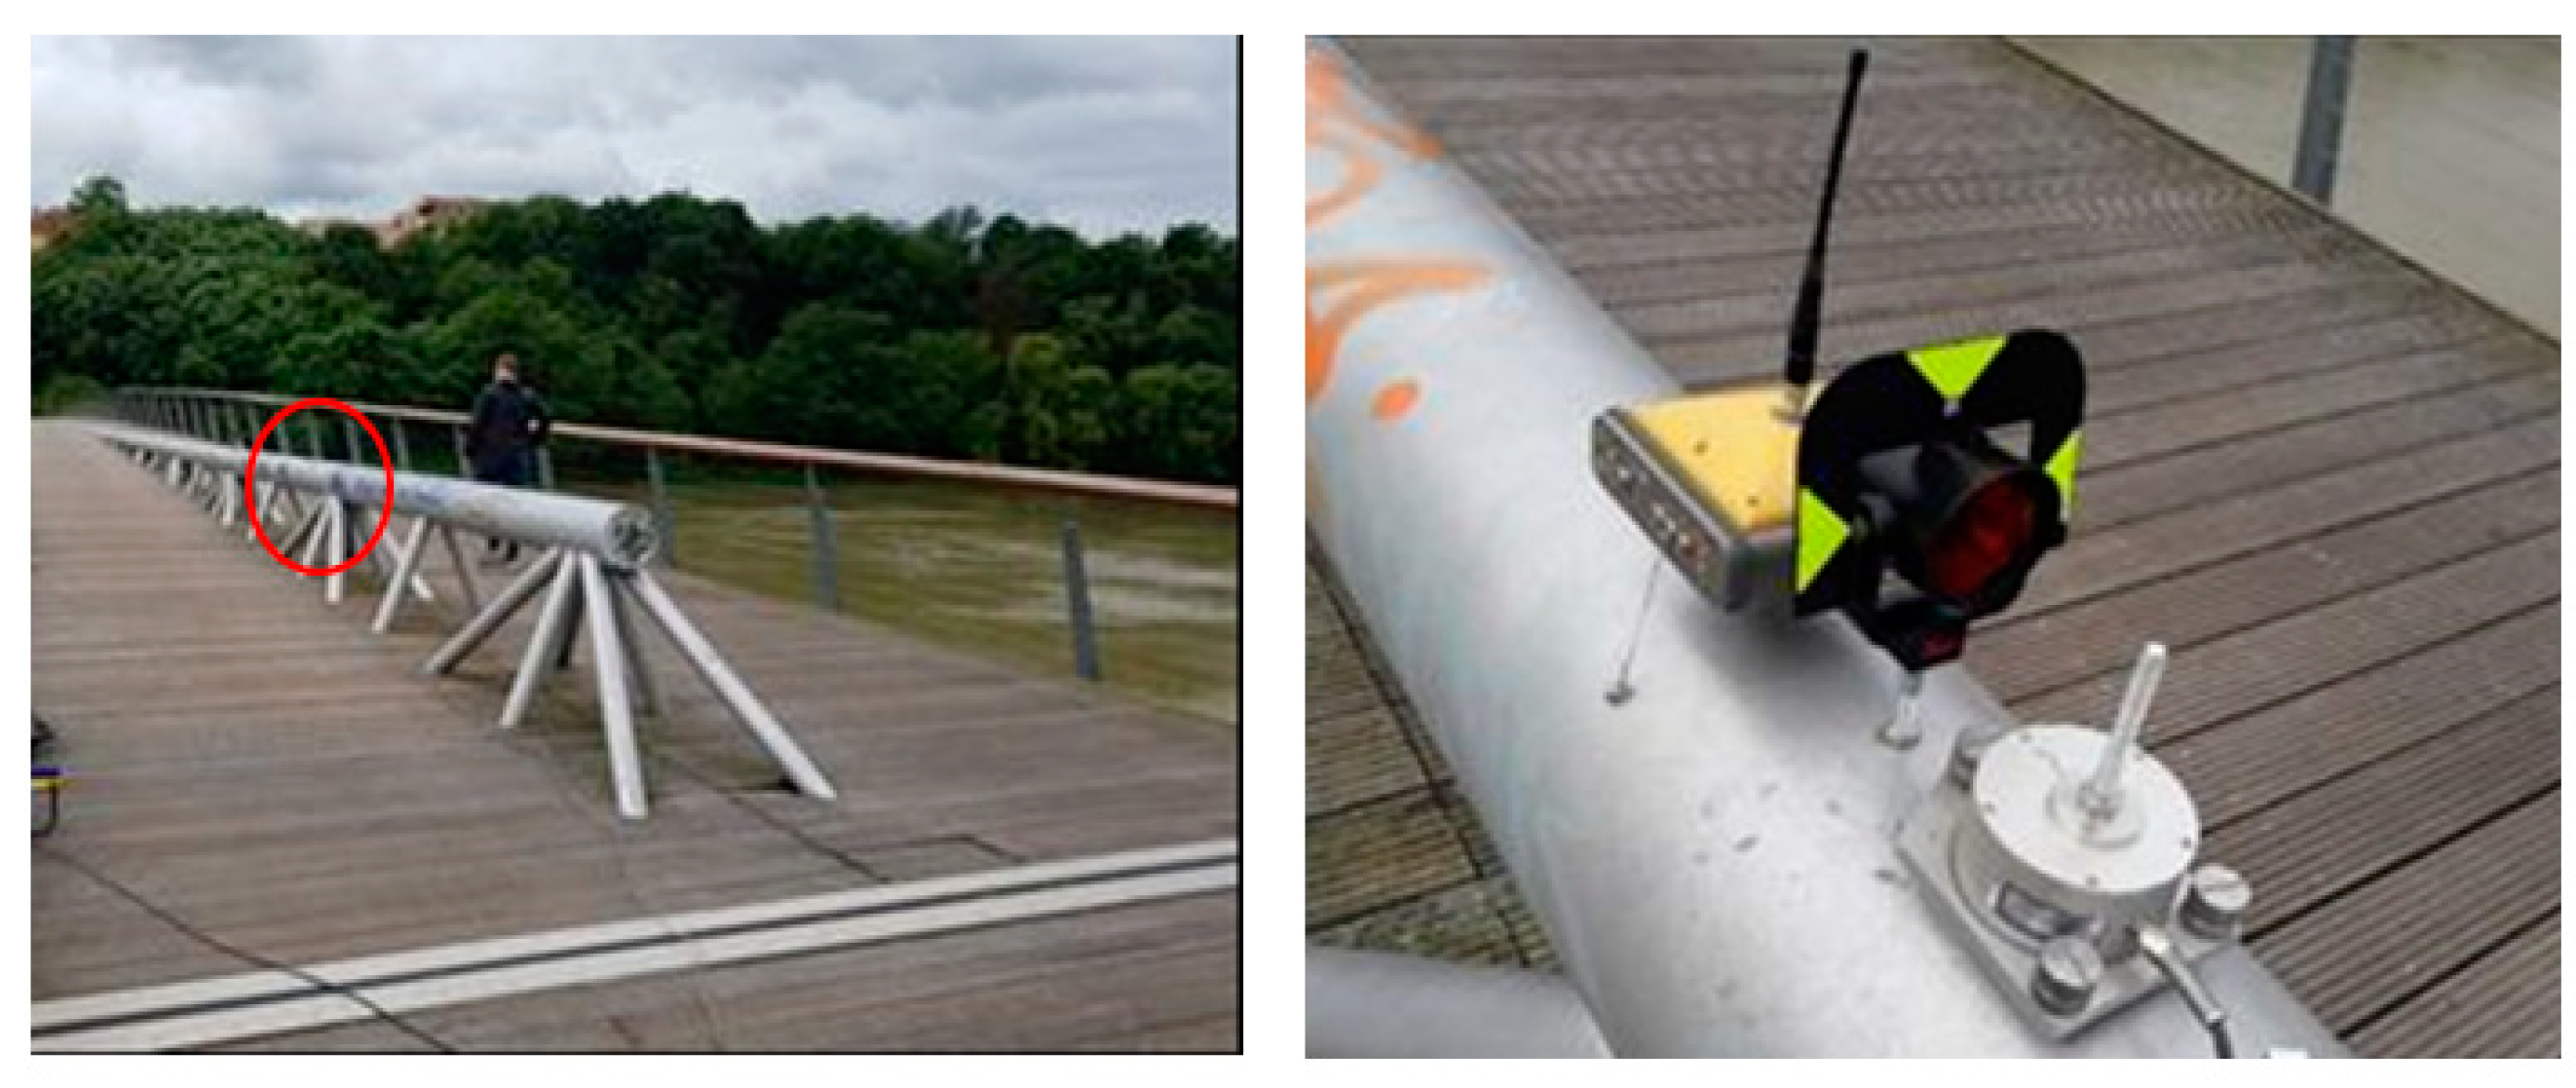
Monitoring to determine the dynamic response of the bridging structure was carried out on a pedestrian and bicycle bridge across the Drava River in Maribor, Slovenia. The dynamic response of the structure was measured using geodetic instruments and a seismograph with a triaxial geophone, which is classified as a group of physical instruments. The pedestrian bridge is a steel space bar structure, 126 m long, with three spans of 42 m each. The point at which we measured the dynamic response of the induced vibration was on the main longitudinal steel bridge girder in the middle of the first span, as shown in
Figure 1.
Vibrations for measuring the dynamic response of the bridging structure were induced by two people with a total mass of 160 kg running away from the measuring point. Geodetic measurements were performed with two Total Robotic Station (RTS) Leica TS50 and TS30. The apparatus measures the change in the horizontal and vertical angles to the geodetic target. The third measuring device was the Topcon Hiper Pro Global Navigation Satellite System (GNSS), which allows dynamic observation of a measuring point based on measured distances to satellites. Physical measurements were performed using an Instantel Minimate Plus seismograph with a triaxial geophone. The basic characteristics of measuring equipment are shown in
Table 1.
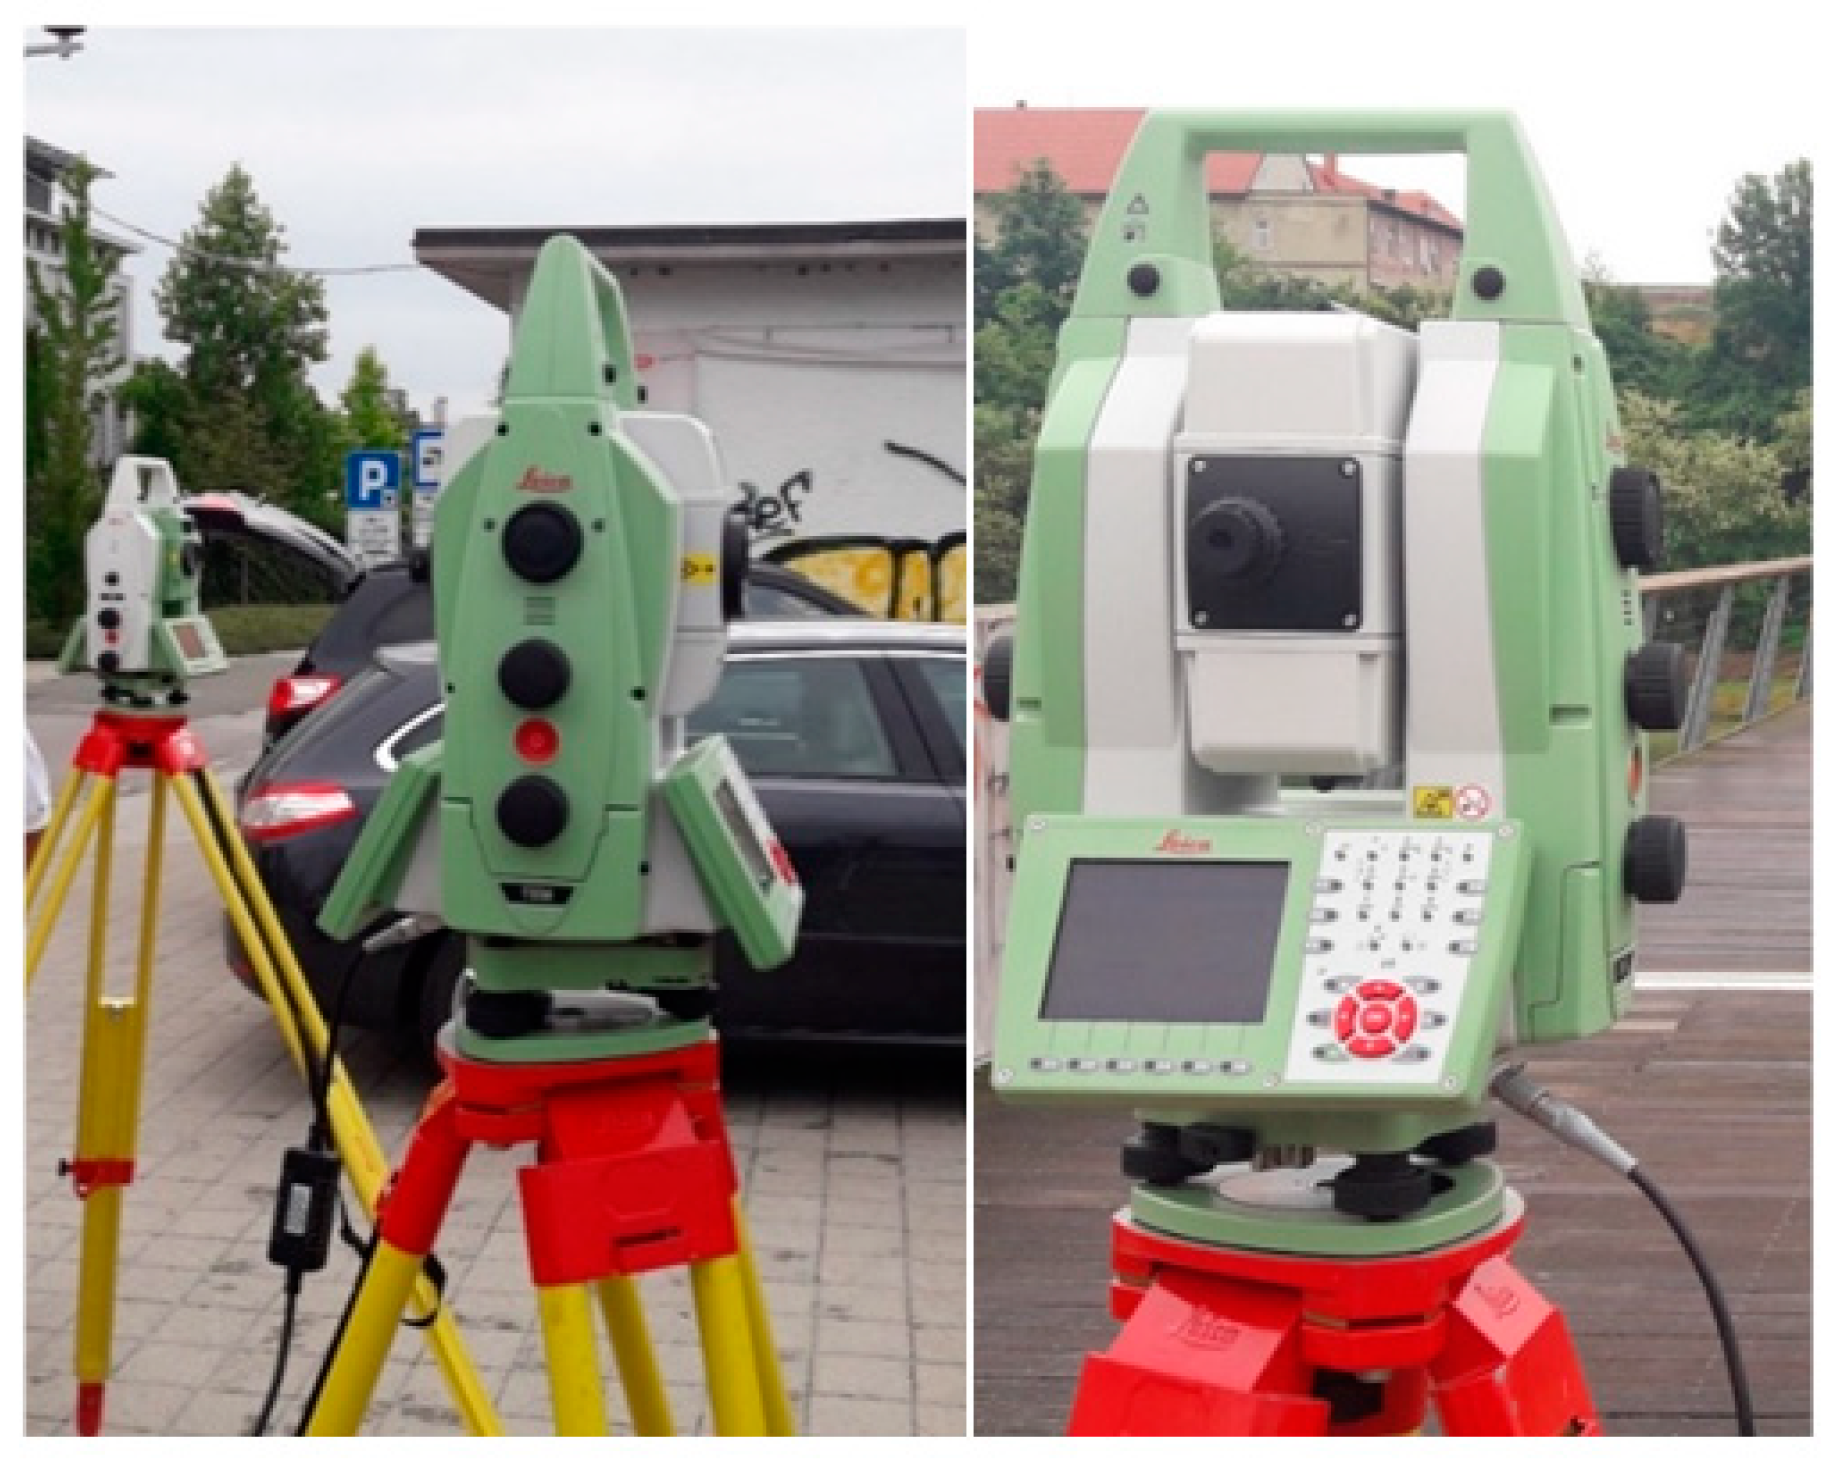
For the experiment, we used the Leica TS50 and TS30 robotic tachymeters shown in
Figure 2. The instruments were placed on undeformable terrain, 19.5 m away from the Leica GPR121 target. The instruments automatically track the target and are capable of sampling frequencies up to 20 Hz. The TS50 and TS30 instruments have declared factory accuracies: according to ISO 17123-3 for angular measurements of 0.5 s or 0.15 mgons and according to ISO 17123-4 for spacings of 0.6 mm + 1 ppm. The TS30 recorded data at a frequency of 6 Hz, while for the TS50, we used the GeoCom/Zg add-on program, which recorded results at a frequency of 26 Hz.
The software uses a GEV269 cable to connect the instrument to a laptop. As mentioned earlier, the software can measure angles, lengths, and time, or just angles and time (
Figure 3). When testing the program, it was found that switching off the distance measurement gives more uniform results [
31]. When determining the dynamic response parameters, it is sufficient to only record the changes along the vertical direction.
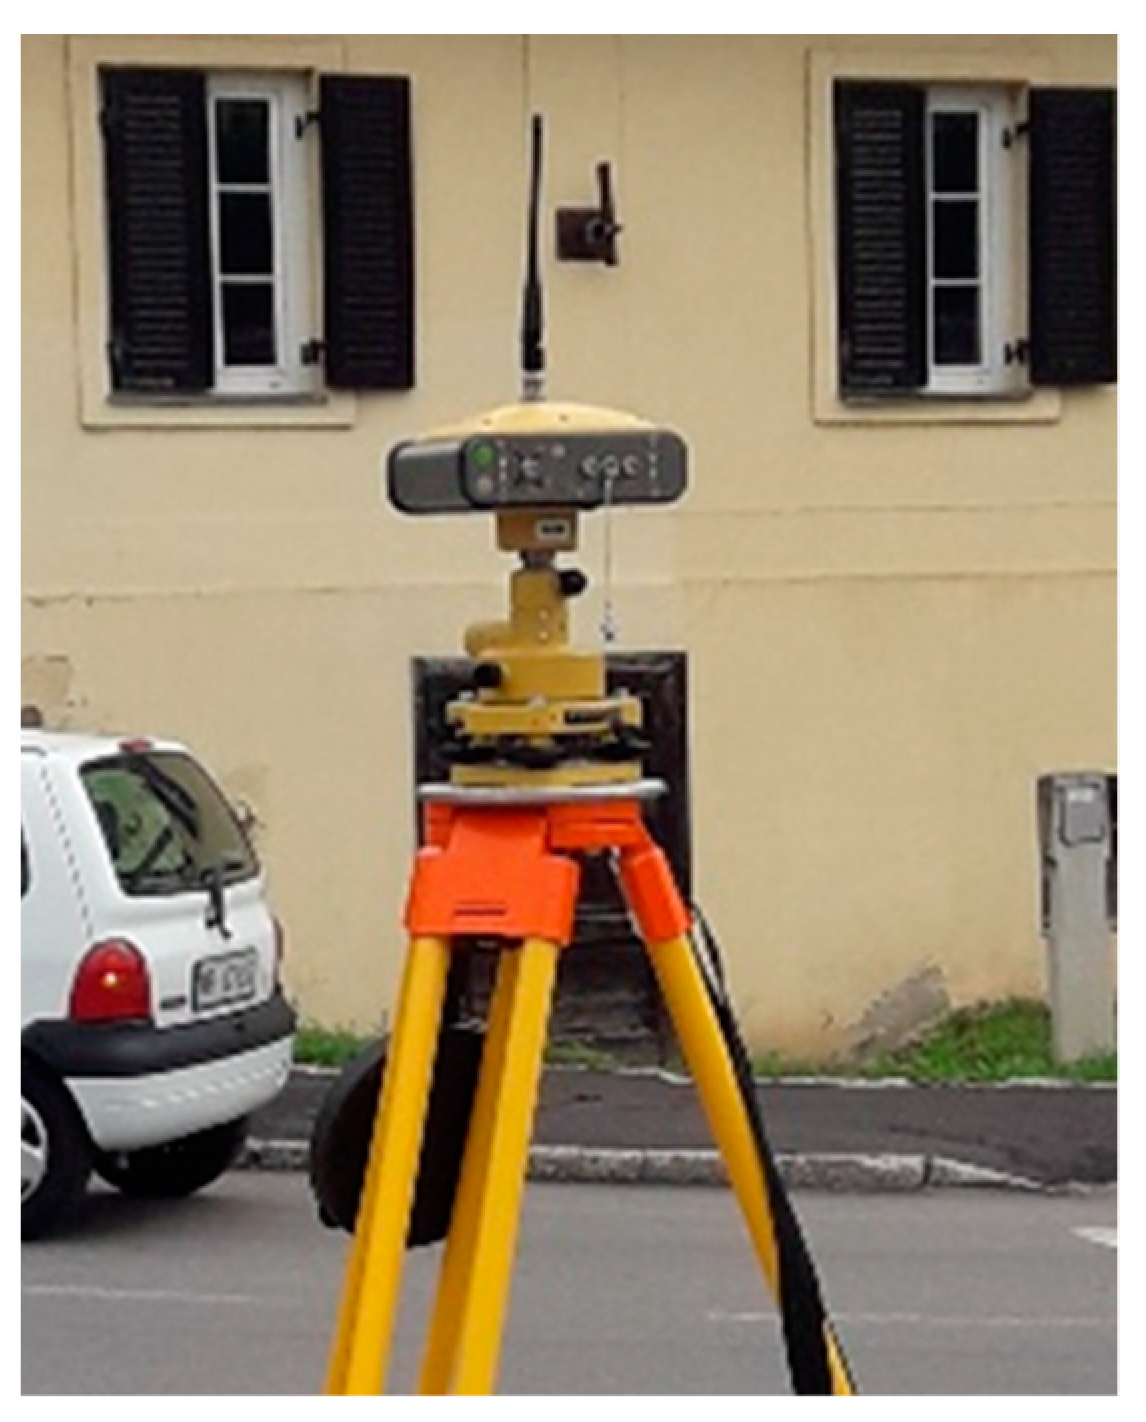
Determining the position with the GNSS receiver in the first phase is based on the so-called pseudo-distance or on determining the distances to selected satellites in space. The latter have precisely defined points with perfectly known coordinates. The receiver locally creates a duplicate copy of the signal, which it receives as feedback from the satellite, and then compares the signal thus generated with the originally received signal. The comparison or adjustment of the measured point takes long enough that the receiver completely equates its locally generated signal with the received one, which is reflected in reaching the peak of the cross-correlation function between the signals. Only with full coverage is the signal decoded into a navigation message from which satellite position information can be deduced. The determination of the position in the field is performed by measuring four distances to four different satellites, as only in this case is a uniform determination of the three-dimensional position possible. To determine the exact position, modern GNSS receivers combine different signals and, at the same time, address observations using a geodetic code and phase. GNSS measurement methods are, by their nature, divided into relative and absolute methods. Absolute methods represent much more generalized approaches and are more valid than personal navigation methods, as their accuracy does not exceed a few meters. Relative methods are measurement methods with GNSS systems whereby high accuracy can be achieved. In such methods, one receiver, named a reference or base, is positioned in a place with known or unknown coordinates, and the other, a movable receiver (rover), is positioned in a place where we determine the position of new points [
32]. In our experiment, we used the RTK (base-rover) method with a reading speed of 0.1 s (
Figure 4). The static GNSS method would be quite useless in our case, due to the presence of too many metal parts near the antenna that would interfere with the satellite signal receiver and due to the confinement of the terrain.
The dynamic response of the constriction was induced by two persons running with a total mass of 160 kg. Measurements in most scientific and engineering fields are characterized by the periodic signal of the measured objects, with periodicity determined by spectral analysis.
In the field of spectral analysis, the most widely used technique is the Fourier transform calculation method. The Fourier transform has the disadvantage of requiring a constant (equivalent) measurement interval [
32].
The Fourier transform is used in many mathematical fields. The main reason for using this method is to convert the complex operations of interpretation and convolution into a simple multiplicative operation. Thus, the Fourier transform is an important tool in solving differential equations.
Uniform sampling can only be recorded with advanced automated measurement systems, such as accelerometers or strain gauges, which allow us to capture measurements up to 2000 Hz. In contrast to these, non-contact methods have the problem of non-uniform sampling, where data are acquired at regular or irregular time intervals. This is due to the inherent technical shortcomings of the instruments. These errors are considered to be gross errors due to insufficient frequencies, noise, and mechanical interruptions of the measurements.
The Fourier transform becomes practically useless if the analysis considers results at unequal intervals. To solve this problem, Nicholas R. Lomb and Jeffrey D. Scargle introduced the Lomb periodogram method, which allows spectral analysis of irregularly (and also correctly) sampled measurement data. The Lomb (or Lomb–Scargle) periodogram is based on the principle of least squares, and the procedure is based on fitting sine functions to the shape [
32,
33,
34]:
The Lomb periodogram
P(t) describes a non-dimensional value with which the spectral power is expressed. For time period
T, it is defined as [
33,
34]:
where in the equation for the time lapse, the parameter
τ is defined as:
where:
… the size of the data block;
… time of the measured displacement ;
… mean value of the displacement, calculated with the term ; and
… standard deviation, calculated with the expression .
The resulting extreme positive values of the Lomb–Scargle periodogram, which appear at the location of the frequencies that reduce the sum of squares when the value is fitted to a time-sine oscillation, give an approximation of the amplitude, as shown in
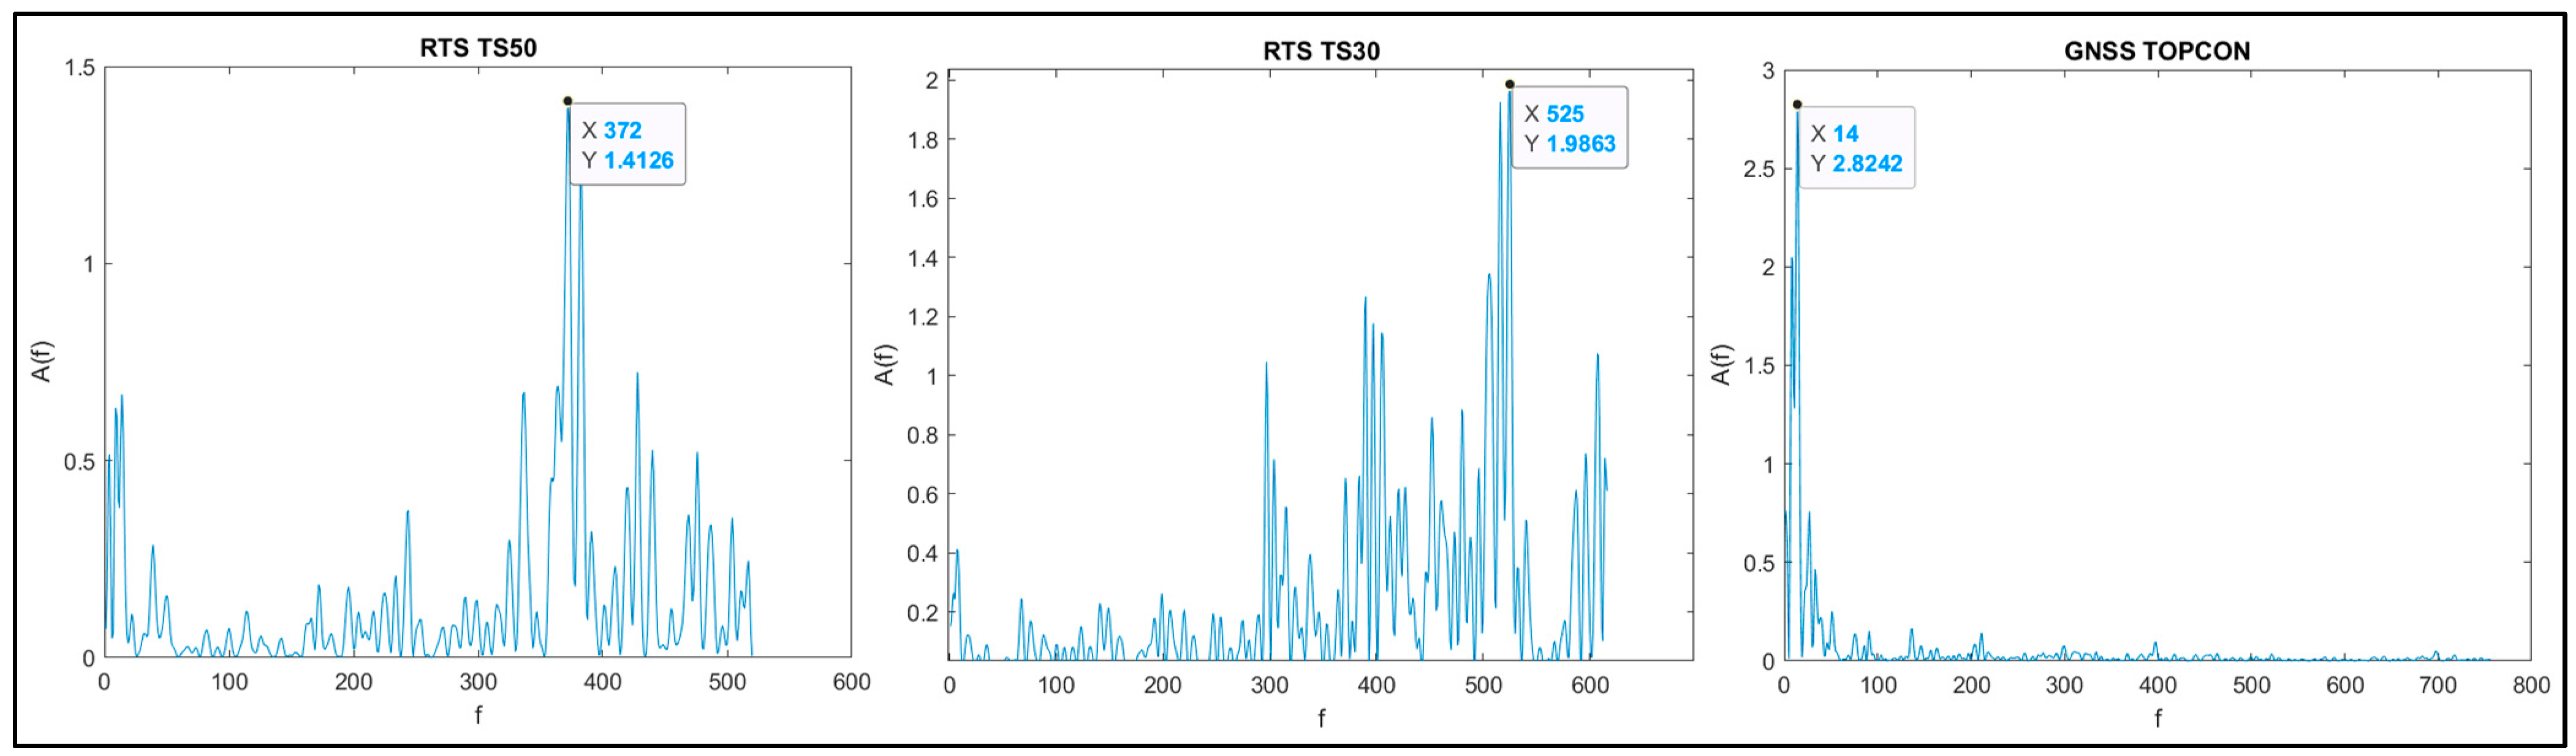
Figure 5 and
Figure 6 and
Table 2.
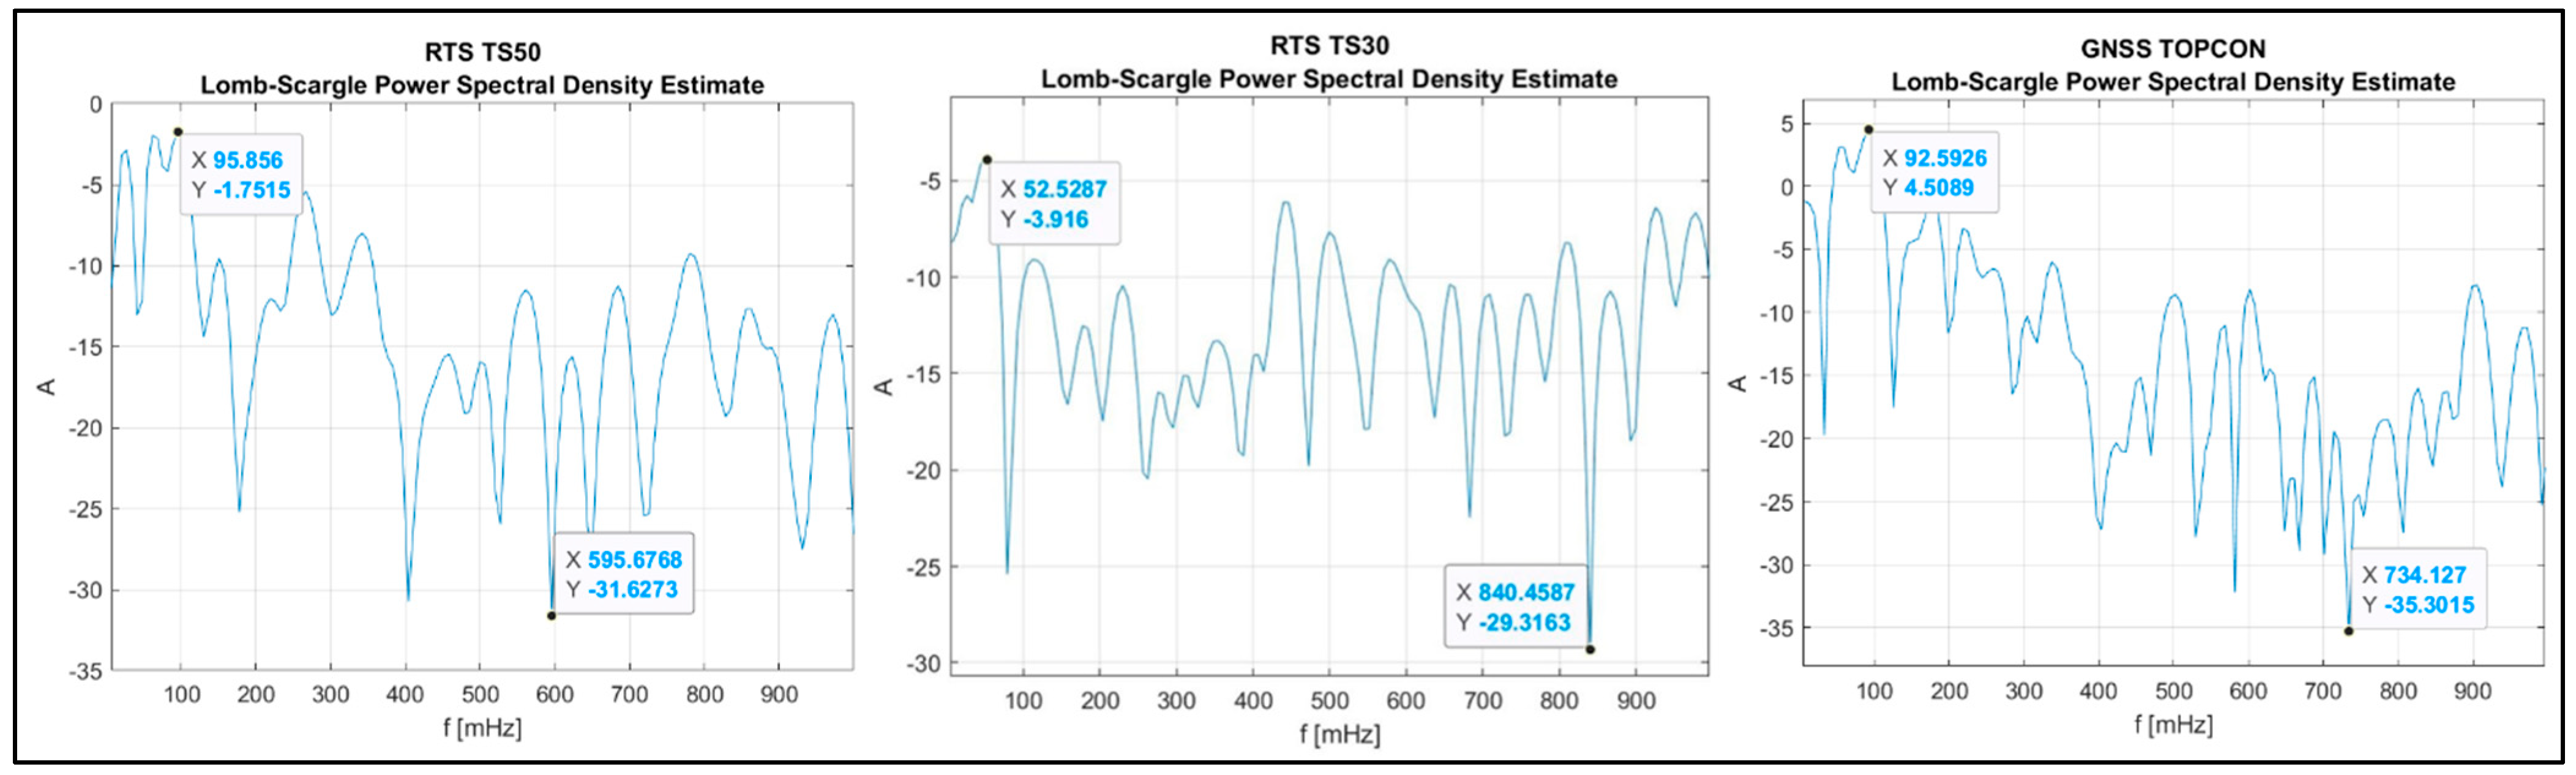
The first row of
Figure 5 shows the Lomb–Scargle periodogram (a spectral approximation for the range between 0 and 1 Hz of the fundamental signal), and the third row shows A(f) for the full Lomb–Scargle periodogram, where A(f) is calculated from Equation (2).
3. Results
The analysis of the measured signals was performed using the Fast Fourier Transformation (FFT) and the Lomb–Scargle periodogram (LS). The Blastware Advanced Module hardware was used to analyze the signals measured with the seismograph, and the GeoCOM/Zg computer program developed by the Faculty of Geodesy, University of Zagreb—Croatia, was used to analyze the signals measured with the geodetic equipment.
Figure 5 and
Figure 6 show the frequency spectra of the response of the structure due to the induced vibration, which was measured with geodetic measuring equipment. The summary of the vibration measurement results is given in
Table 2.
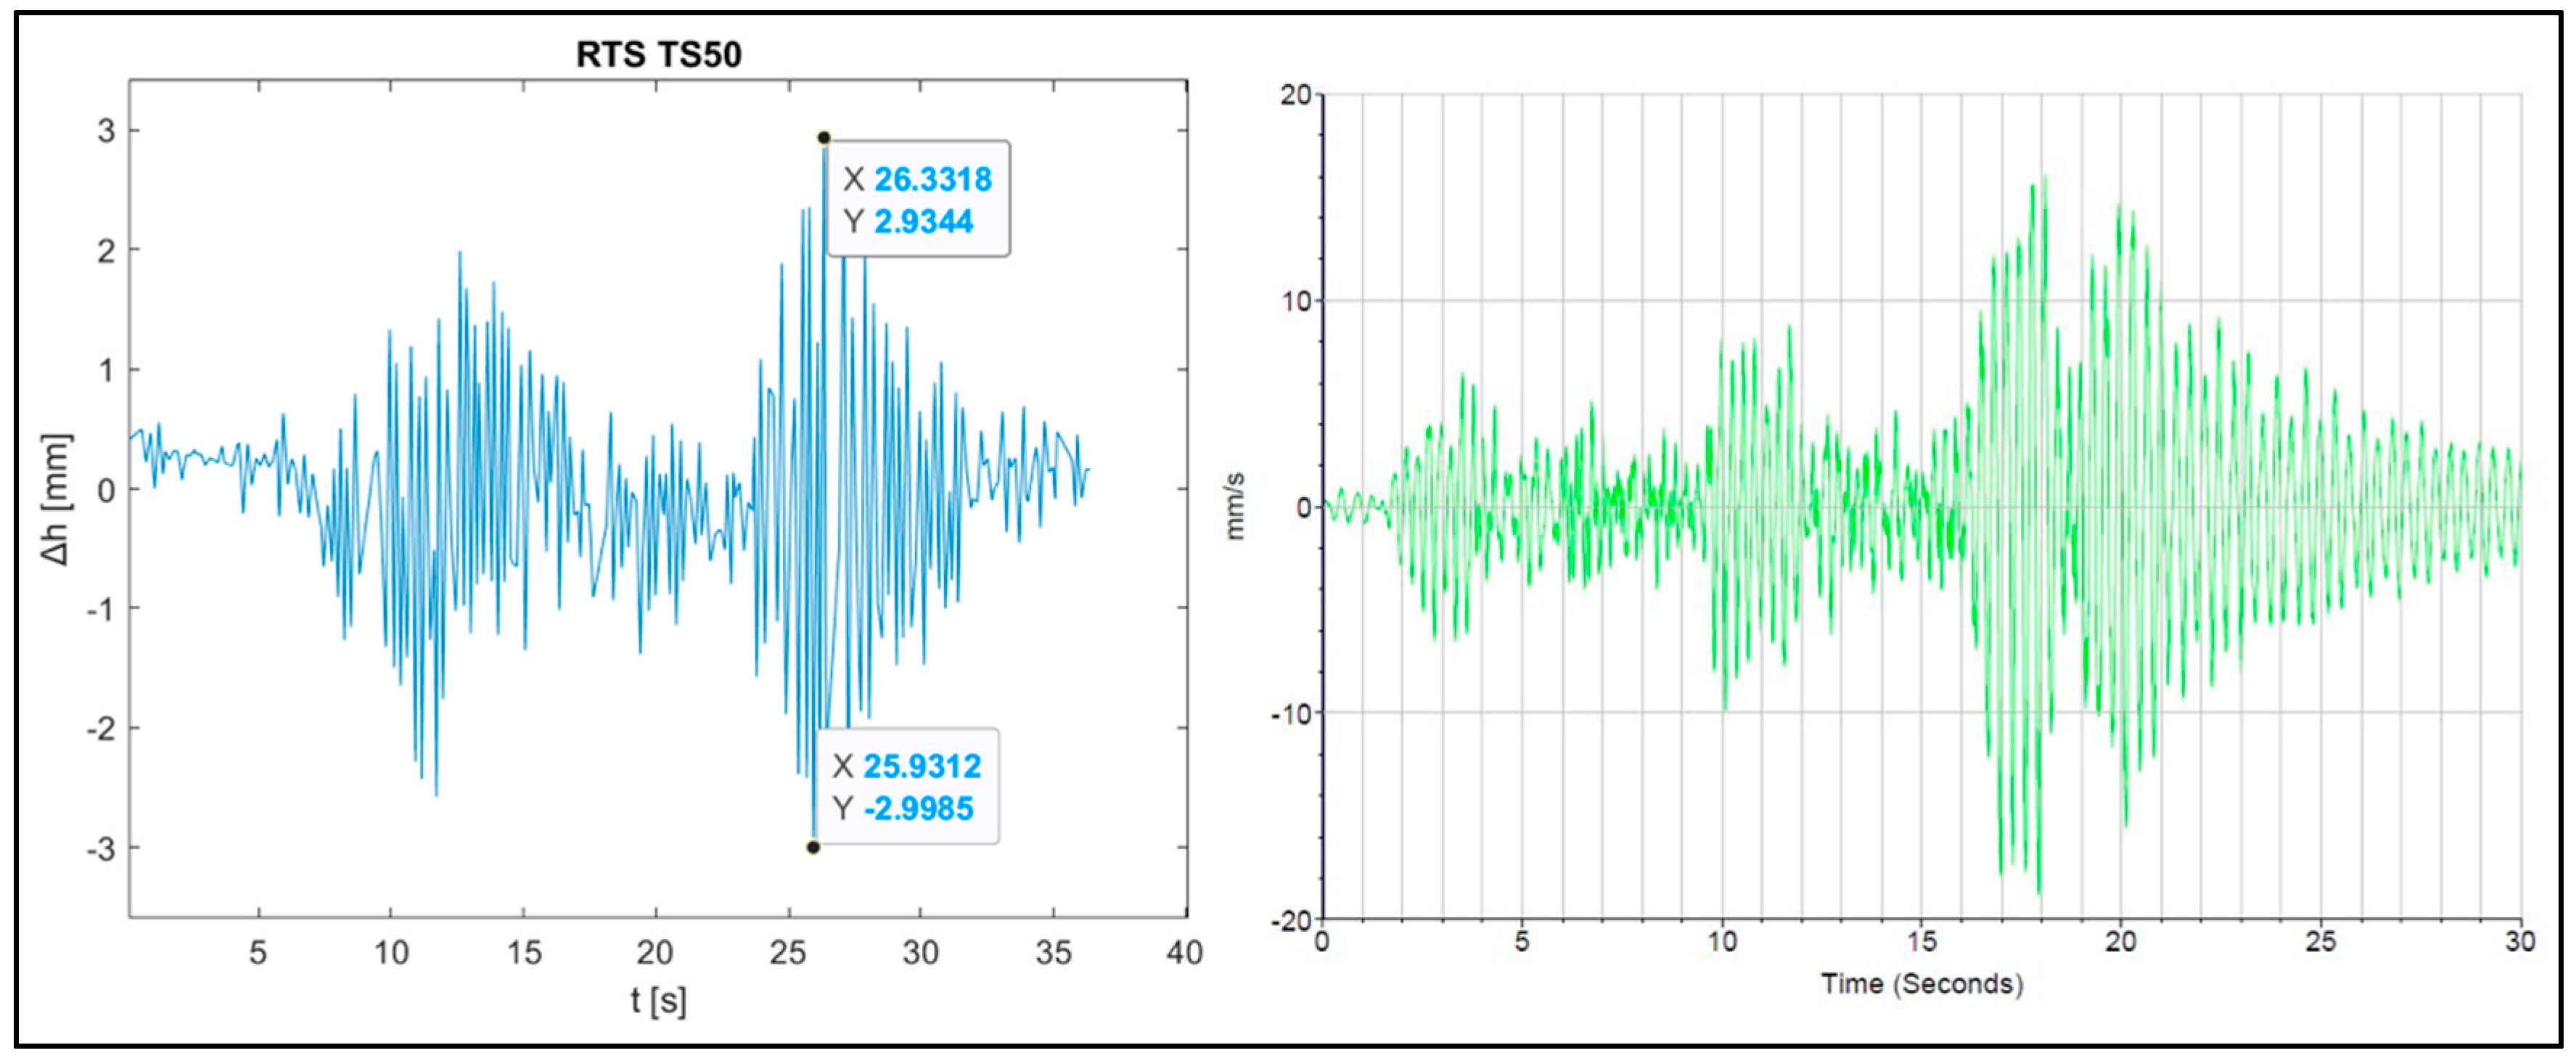
Figure 7 on the left side shows a graph of vertical displacements as a result of geodetic measurement equipment, and
Figure 7 on the right shows a graph of Peak Particle Velocity Vertical (PPV V) obtained by analyzing the signals measured with a seismograph. The graphs show that the graphs are very similar in shape.
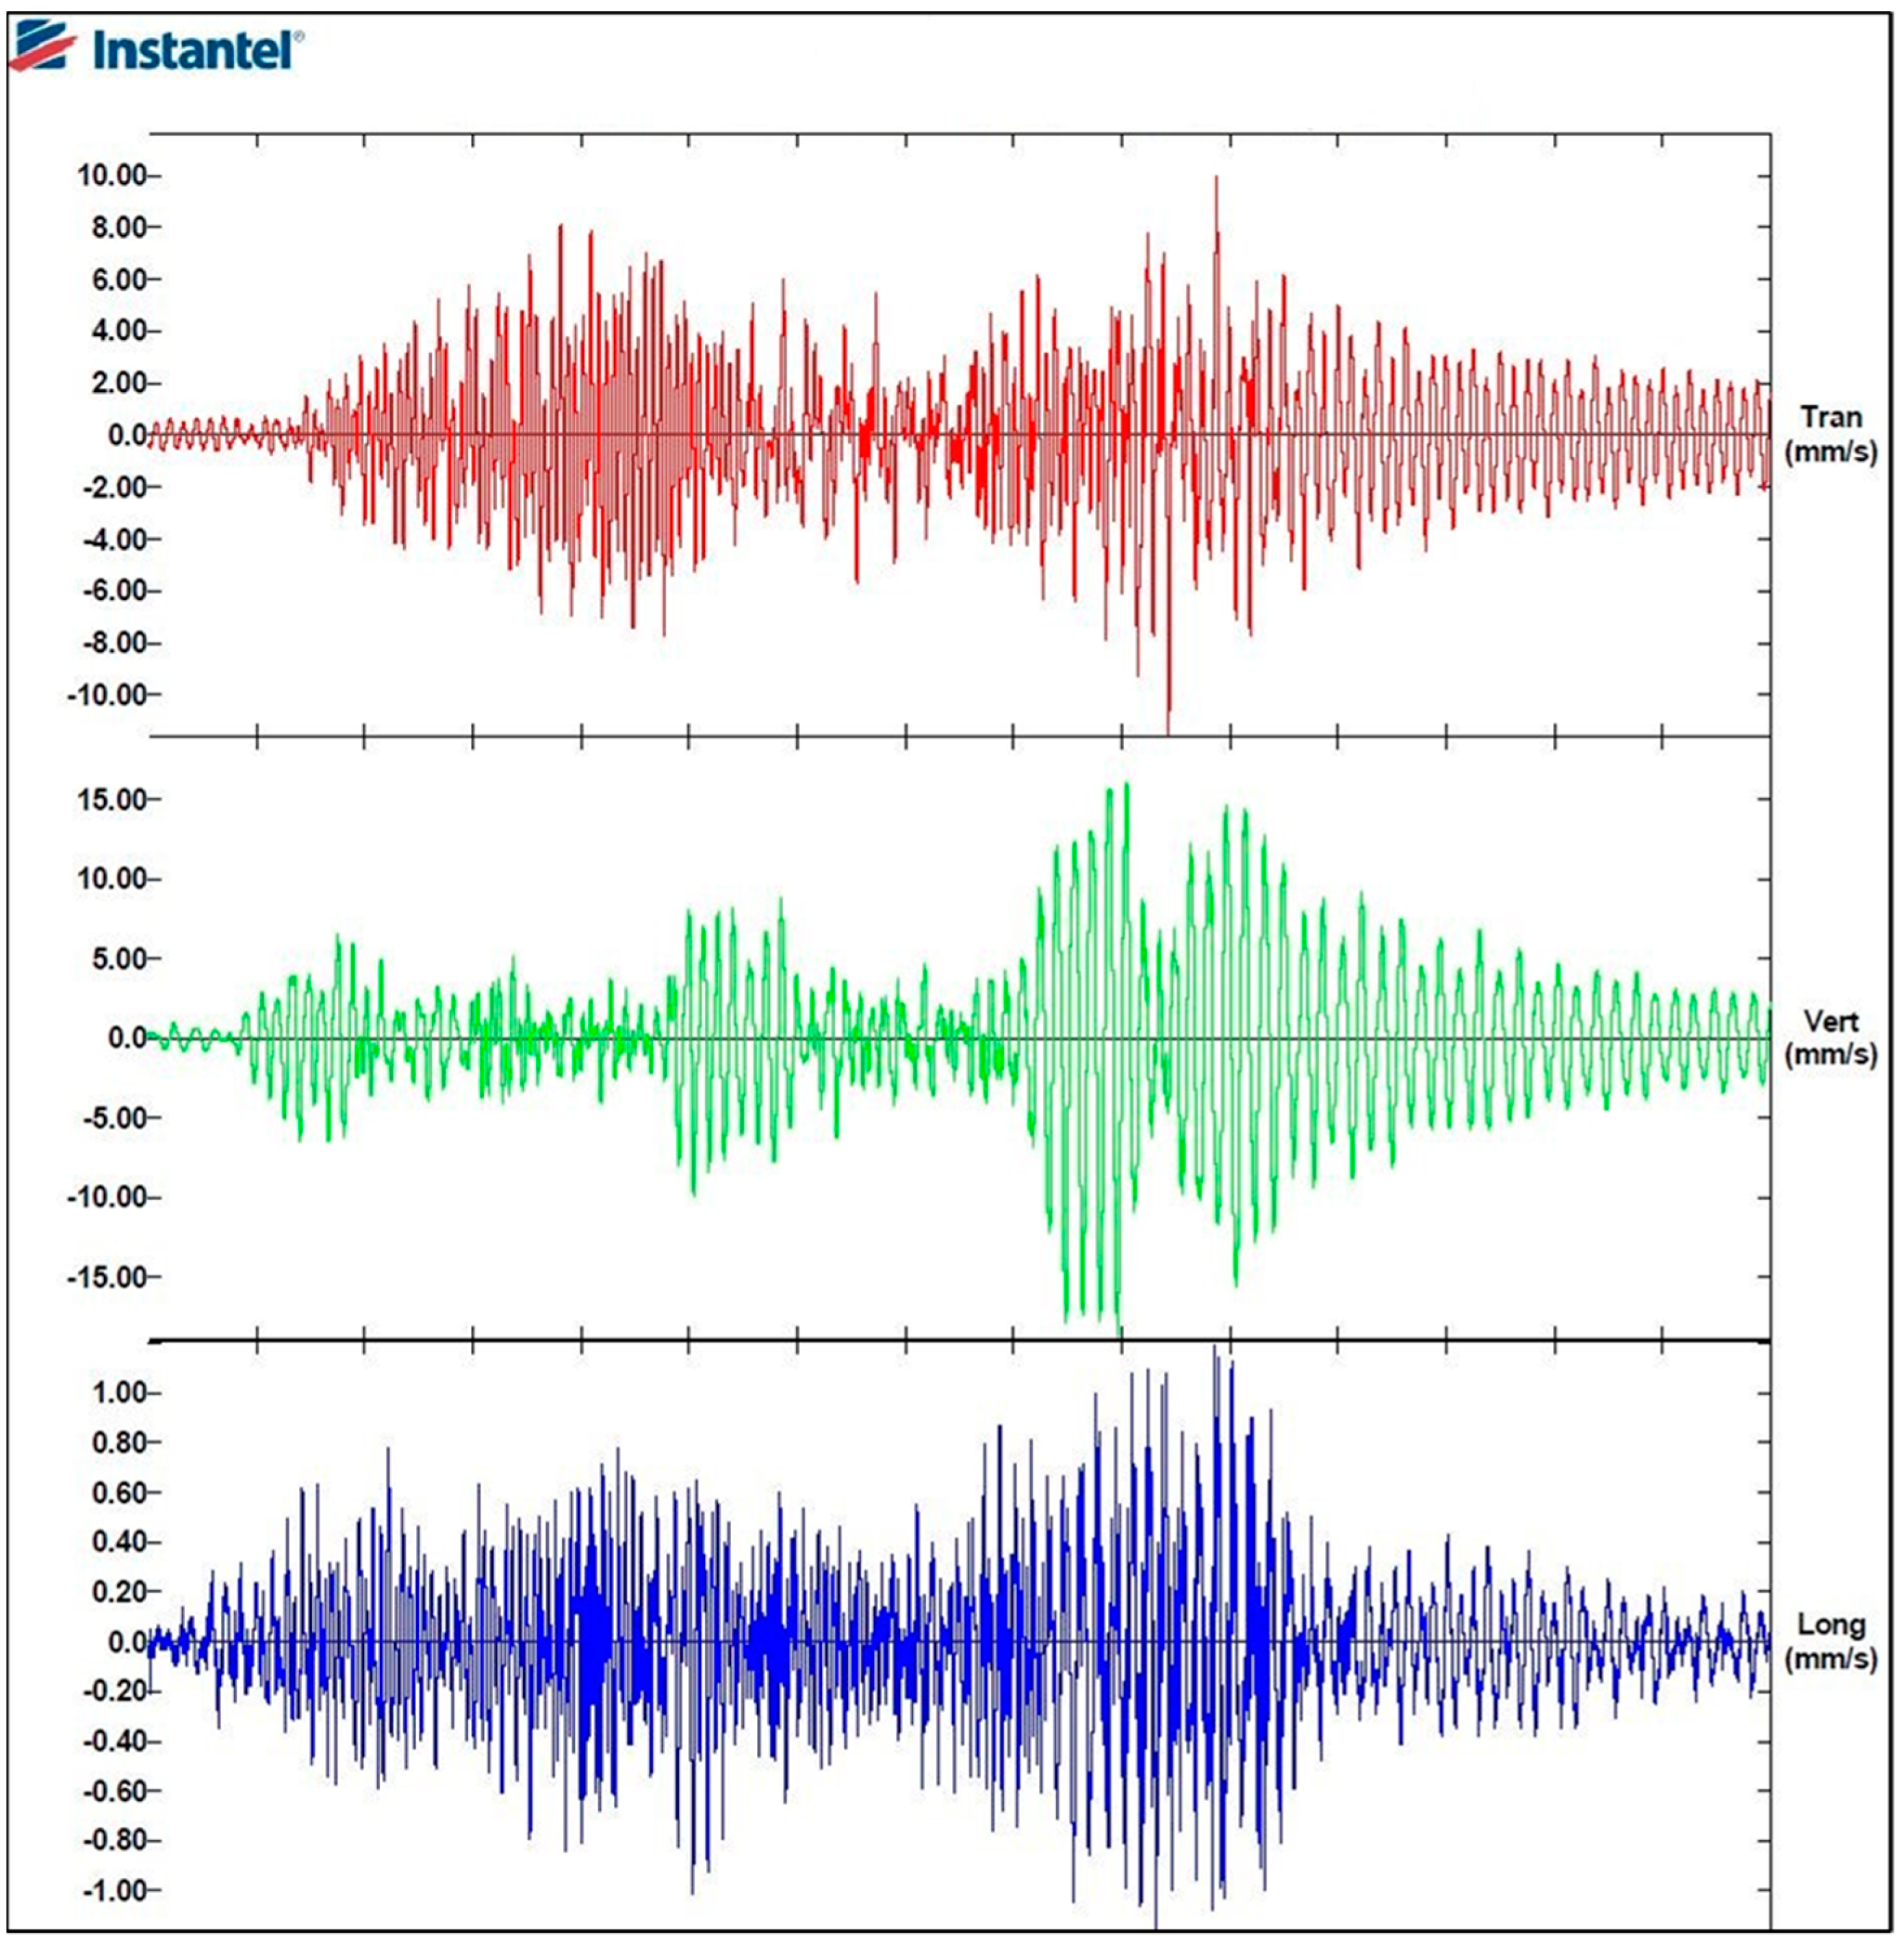
Figure 8 shows the vibration velocities’ Peak Particle Velocity in all three orthogonal directions—Transversal, Vertical and Longitudinal, measured by the seismograph.
The frequency spectrum of the signal over the entire measurement period in the vertical direction as a result of the FFT analysis is shown in
Figure 9. The vertical axis shows the amplitude value, and the horizontal axis shows the frequency.
A comparison of the frequency spectra obtained with surveying equipment and the values of relative displacements and velocities of vibration shows:
The most important parameters are hereinafter described:
The graphs of the vertical displacements and the corresponding vibrational velocities in the vertical direction coincide and can also be compared only on the basis of graphs.
Extreme value locations coincide relatively well.
Phase graphs of vibration velocities and vertical displacements can be seen as a result of vibration excitation at different spans of the bridging structure.
The dominant frequencies are generally relatively comparable.
The amplitudes and measured displacements are generally incomparable.
Table 3 shows the values of vertical displacements, dominant frequencies, and vertical amplitudes, which were calculated by analyzing the signals of the geodetic measuring equipment and the seismograph. We do not give the values of the data that were calculated by analyzing the signals of the Topcon Hiper Pro measuring equipment because they are not comparable due to the lack of precision of this equipment. Furthermore, the calculated displacement measured by the seismograph is not comparable as it represents the relative value of this quantity.
Therefore, it can be concluded that the results of geodetic and physical measurements in the event under consideration were comparable from the standpoint of the corresponding graphical trajectories of the measured signals and the corresponding dominant frequencies obtained by spectral analysis.
4. Discussion
The measurements we performed at the bridging objects enabled us to analyze the induced vibrations, which were performed taking into account the results of representative measurements with different measuring equipment. The presented monitoring of the dynamic response of bridging structures using geodetic and physical measuring instruments represents a unique way that provides a comprehensive insight into the behavior of such structures. The use of algorithms such as FFT and LS gives very good results of the frequency range of the oscillation of the structure. Our measurements have shown that even with geodetic instruments, if the appropriate sampling frequency is enabled, we can very accurately measure the dynamic response of the bridging structure. The comparison of frequency spectra obtained with the described measuring equipment confirms the consistency of the source signals and the matching of the frequency spectra. The practical use value of such monitoring is also confirmed by the comparable accuracy of the results.
Based on the comparative analysis of individual measurements with RTS TS50 measuring and geodetic equipment and on the basis of the described available literature, we found that the highest accuracy of measurements was achieved at frequencies lower than 20 Hz. The highest achieved oscillation frequency was 30 Hz, which according to Nyquist’s sampling theorem, would mean that we would need measuring instruments with a minimum frequency of 60 Hz. However, currently available geodetic equipment does not allow such sampling. Said measuring equipment can be measured in the frequency range between 20 and 30 Hz.
5. Conclusions
Methods of the dynamic response of building structures for struction practice represent an extremely important area. With such measurements, we obtain the information needed to analyze the behavior of structures. There are many ways to perform such measurements, but today in this area, preference is given to methods that can be performed using contactless monitoring with which we can observe the structure very accurately at a relatively large distance regardless of the size and accessibility of measuring points. Geodetic non-contact monitoring is based on the analysis of measured signals. In our case, we performed monitoring with three different geodetic instruments on the bridging structure, which was loaded with four mutually different load tests. We used two robotic total stations (RTS Leica TS30 and RTS Leica TS50) and a global navigation receiver (GNSS Topcon Hiper Pro). Simultaneously with the geodetic monitoring, we also performed measurements with the help of physical measuring equipment Instantel Minimate Plus, which helped us to compare and evaluate the accuracy of the measured values with which we can control the dynamic response of such structures. For each type of equipment used, we performed an analysis of the results of the measured values.
The general finding of the useful value of measurements with GNSS measuring equipment is that this equipment enables the monitoring of the dynamic response, but the results of the dynamic monitoring are not sufficiently accurate for struction practice. We found that for a frequency spectrum above 10 Hz accompanied by small displacements, the measurements are not accurate enough. This equipment is only useful for measuring larger displacements at low frequencies over a long period of time. The error of the GNSS method in our case can be attributed to the incorrectly selected RTK method. To determine the dynamic response, it would make more sense to use the static GNSS method, which provides us with more accurate and reliable results.
In the analysis of monitoring with RTS geodetic equipment, we found that the results obtained in the frequency range between 6 and 26 Hz are comparable. We observed minor deviations on the basis of which we can conclude that the frequency of signal capture has a decisive influence on the accuracy of measured values.
In analyzing the results, we found that the use of algorithms for spectral analysis such as FFT and LS represents a very good mathematical tool that allows the interpretation of the frequency components of the oscillation.
Both used total robotic stations—RTS in the frequency range between 6 and 26 Hz enabled engineeringly accurate monitoring. The mutual comparison of the results of dynamic response measurements with geodetic measuring equipment determined by the dominant frequency is, in all cases, a comparable value, even in the case of measurements with physical measuring equipment.
Monitoring the dynamic response of a bridging structure with geodetic and physical equipment presented in this article provides representative and useful results for struction practice. The use of geodetic monitoring, which must be monitored by physical monitoring, represents a very reliable and technically perfect possibility for monitoring the behavior of the facility during its use.


