Article

Ensemble Voting-Based Multichannel EEG Classification in a Subject-Independent P300 Speller

by
Ayana Mussabayeva
1,2,*,
Prashant Kumar Jamwal
2 and
Muhammad Tahir Akhtar
2
1
Department of Mathematics, University of Manchester, Manchester M13 9PL, UK
2
Department of Electrical and Computer Engineering, School of Engineering and Digital Sciences, Nazarbayev University, Nur-Sultan 010000, Kazakhstan
*
Author to whom correspondence should be addressed.
Appl. Sci. 2021, 11(23), 11252; https://doi.org/10.3390/app112311252
Submission received: 3 October 2021 / Revised: 30 October 2021 / Accepted: 4 November 2021 / Published: 26 November 2021

Abstract

:
Classification of brain signal features is a crucial process for any brain–computer interface (BCI) device, including speller systems. The positive P300 component of visual event-related potentials (ERPs) used in BCI spellers has individual variations of amplitude and latency that further changse with brain abnormalities such as amyotrophic lateral sclerosis (ALS). This leads to the necessity for the users to train the speller themselves, which is a very time-consuming procedure. To achieve subject-independence in a P300 speller, ensemble classifiers are proposed based on classical machine learning models, such as the support vector machine (SVM), linear discriminant analysis (LDA), k-nearest neighbors (kNN), and the convolutional neural network (CNN). The proposed voters were trained on healthy subjects’ data using a generic training approach. Different combinations of electroencephalography (EEG) channels were used for the experiments presented, resulting in single-channel, four-channel, and eight-channel classification. ALS patients’ data represented robust results, achieving more than 90% accuracy when using an ensemble of LDA, kNN, and SVM on four active EEG channels data in the occipital area of the brain. The results provided by the proposed ensemble voting models were on average about 5% more accurate than the results provided by the standalone classifiers. The proposed ensemble models could also outperform boosting algorithms in terms of computational complexity or accuracy. The proposed methodology shows the ability to be subject-independent, which means that the system trained on healthy subjects can be efficiently used for ALS patients. Applying this methodology for online speller systems removes the necessity to retrain the P300 speller.

1. Introduction

A brain signal’s features extraction and classification are the most essential steps of the brain–computer interface (BCI) system’s processing algorithm. The majority of BCI devices use electoencephalography (EEG) for brain activity recording [1]. EEG is a relatively inexpensive neuroimaging method, which provides a fast response while measuring the electrophysiological activity of the neurons. EEG has a spatial resolution of only about 10 mm, which is imprecise compared to intracortical recording [2]. However, EEG has a great advantage of being noninvasive, which is very important for BCI devices.
EEG BCI systems are used for diagnostic classification of dementia [3] and seizure prediction [4]. Furthermore, they are used as rehabilitation systems [5]; however, when functionality with rehabilitation is not restored, BCI is used as an assisting device, for example, a brain-controlled wheelchair for walking disabilities or lower-limb paralysis [6]. Different types of robotic prostheses also use EEG signal processing to enable people to control them [7].
Speller systems are another popular application of EEG-based BCI. The classical EEG-based BCI speller is designed to enable people with serious motor neuron diseases to communicate with the outer world. One of the most common paralyzing diseases is amyotrophic lateral sclerosis (ALS), which paralyzes the whole organism, destroying a human’s ability to speak and communicate. According to statistics, more than six thousand people are diagnosed with ALS each year all over the world [8].
BCI spellers commonly use the event-related potential (ERP) paradigm, which states that a human’s reaction to a stimulus can be classified by analyzing voltage deflections of EEG signals, called ERP components. ERP events can be classified into several groups which are: slow cortical potential (SCP), neuronal potential, event-related synchronization (ERS), event-related desynchronization (ERD), and visual evoked potentials. SCP is caused by the shifts in the depolarization levels of dendrites, while the neuronal potential is caused by the change of neuronal firing [9]. ERS can be indicated by an increase in power in some frequency bands of the EEG signal, while ERD is characterized by the decrease in power in that frequency. The most popular ERP type used for speller systems is visual evoked ERP. Visual evoked ERP components are indicated by the latency and sign of the voltage amplitude. ERP components are used in the oddball paradigm, in which repetitive stimuli are presented to the subject. High-probability nontarget visual stimuli are mixed with low-probability target stimuli when the oddball paradigm is applied. In speller systems, the target stimulus is the intensification of the chosen character.
The oddball paradigm is used in the classical P300 speller [10], which identifies the target symbol by extracting the positive voltage peak, starting at about 300 ms after the oddball stimulus, called P300 component [11]. Figure 1 shows the graphical user interface (GUI) of a P300 speller for an English-speaking user, which is usually presented as a 6 × 6 matrix of symbols, having 12 possible intensifications of 12 rows/columns. By analyzing the EEG signal’s ERP response, 2 target intensifications can be detected out of 12: one row and one column intensification. The intersection of the target intensified row and column would be the character chosen.
The objective of this work was to design a robust subject-independent classifier for the P300 speller. In other words, the aim was to design a P300 speller, which could be trained on healthy subjects but provide good results when used by ALS patients, to remove the necessity for ALS patients to train the speller themselves, wasting their time and effort.
The classification of brain signals can be performed using different algorithms and methods. Over the last decade, different methods have been applied for ERP-based spellers. P300 identification can be performed using unsupervised, semi-supervised and supervised methods. Unsupervised learning can be applied for calibrating a subject-independent classification model [12]. Subject independent ERP classification can also be performed using unsupervised Baum-Welch algorithm [13] or using error-related potential (ErrP) [14]. Semi-supervised learning can be efficiently applied for the P300 speller using a self-training least squares support vector machine (LS-SVM) [15]. Nevertheless, generally, supervised learning algorithms provide better accuracy than semi-supervised or unsupervised methods for P300 classification. The only problem is that supervised models are usually applied for each subject separately to achieve better results. However, supervised learning algorithms can provide high performance for subject-independent training as well. For instance, a supervised learning genetic algorithm can be successfully applied for adaptive selection of the ERP wave latency for each subject [16]. Recently Riemannian geometry-based algorithms have also been used for the P300 speller owing to their robustness and transfer learning capabilities [17].
This work focuses on supervised learning models for P300 component extraction and classification. Different models, such as linear-discriminant analysis (LDA), support-vector machine (SVM), k-nearest neighbors (kNN) and convolutional neural network (CNN), are combined using an ensemble learning approach to achieve more stable results. Ensemble learning puts together the advantages of different classifiers and provides more trusted classification, which is crucial for the subject-independence of the BCI system. Apart from using ensemble learning, a different number of EEG electrodes is used in the experiments, in order to find the most subject-independent data channels for features extraction.
The remainder of this paper is organized as follows. Section 2 overviews the chosen classifiers. Section 3 describes the key concepts of the proposed methodology, followed by the simulation results, presented and discussed in Section 4. Finally, the concluding remarks of the paper are presented in Section 5.

2. Overview of Classifiers

2.1. Linear Discriminant Analysis

Linear discriminant analysis (LDA) is one of the most popular classifiers in BCI research, as it is computationally efficient and provides robust results. Despite the fact that this trivial algorithm was proposed in the 1980s [18], it is still one of the most useful methods applied for classification of various data, including multichannel EEG time-series. LDA can be applied for both a supervised and unsupervised P300 speller [19].
LDA assumes that the covariance matrices of each class are identical and full rank matrices, which results a linear structure when using Bayes’ rule. Different solving methods can be applied for LDA implementation, such as singular value decomposition (SVD), eigenvalue decomposition (ED), or the least squares solution (LSS). SVD is applied for LDA in our case as the EEG data vectors have a large number of features.
LDA is a classical method for EEG time-series classification, as it is good for dimensionality reduction and classification. LDA usually provides stable results for BCI systems, for instance, when using EEG and electrooculography (EOG) combined for detecting a user’s response, LDA can achieve an accuracy of more than 97% [20]. Despite the fact that LDA may not be as efficient when applied to small high-dimensional datasets, it provides good results when the amount of the user data is sufficient. Nevertheless, LDA-based methods, such as group sparse discriminant analysis [21] can be applied to overcome the undersampling problem. In order to improve the results obtained by LDA, some complex dimension reduction methods, such as bond graph analysis, may be applied as a preprocessing step [22].

2.2. Support-Vector Machine

The SVM classifier is frequently used in BCI research to achieve accurate classification of brain signals’ features. This classifier uses kernel functions to transform the data from one dimension to another and then constructs an optimal hyperplane to separate the data classes. The transformation is called kernel trick, and it usually requires such functions as linear kernel, polynomial kernel, Gaussian radial basis function (RBF), sigmoid, hyperbolic tangent, etc. Kernel function is the most important hyperparameter of the SVM classifier, as it significantly affects the computational complexity, further data representation, and classification accuracy of the model.
When the kernel trick is done, the optimal hyperplane can be found by solving the quadratic optimization problem. Derivative tests, such as Karush-Kuhn-Tucker (KKT) conditions, are usually applied to solve this problem [23]. SVM is frequently used for time-series EEG classification for the oddball paradigm [24]. Ensembled with convolutional neural network (CNN) and F-ratio features selection, SVM achieved 99% accuracy for 15 epochs for two different subjects [25]. Ensembled SVM with Platt scaling [26] reached 98.5% accuracy for 15 trial blocks [27].
By comparing different kernel functions using grid search (GS) when using EEG data of healthy subjects, the most efficient kernel function turned out to be hyperbolic tangent (tanh), which outperformed the Gaussian radial-basis function (RBF), sigmoid, and polynomial functions by different degrees varying from 2 to 5. The tanh is calculated as
tanh ( X i ) = e X i e X i e X i + e X i ,
where X i is the EEG feature vector.

2.3. k-Nearest Neighbors

One of the most simple and efficient classifiers is kNN, which identifies the distance between the classified data point and its k nearest neighbors. The main advantage of this classifier is that it is a very fast algorithm that does not require much time for computation and classification. The distance metric used for kNN classifier can be cosine distance, Euclidean distance, Manhattan distance, etc. Apart from the distance metric, an important hyperparameter is the number of neighbors, which is compared to the classified data point. For the binary classification problem, it is necessary to ensure that k is an odd number, to avoid the state when the classifier is equally voting for both classes.
By trying different hyperparameters when training on data collected from healthy subjects, the best result was provided by Manhattan distance, computed as
d ( X j , X i ) = m = 0 m = M 1 | x j m x i m | ,
where the classified EEG vector X j of length M was compared to its k neighbors. Here X i denotes the ith neighbor’s vector and x i m denotes the mth data point of this vector. The best number of k was evaluated using GS. The classifier reached a promising result of F-score = 98.6 % for k = 3 . Moreover, the best computational complexity was provided by using k = 3 .

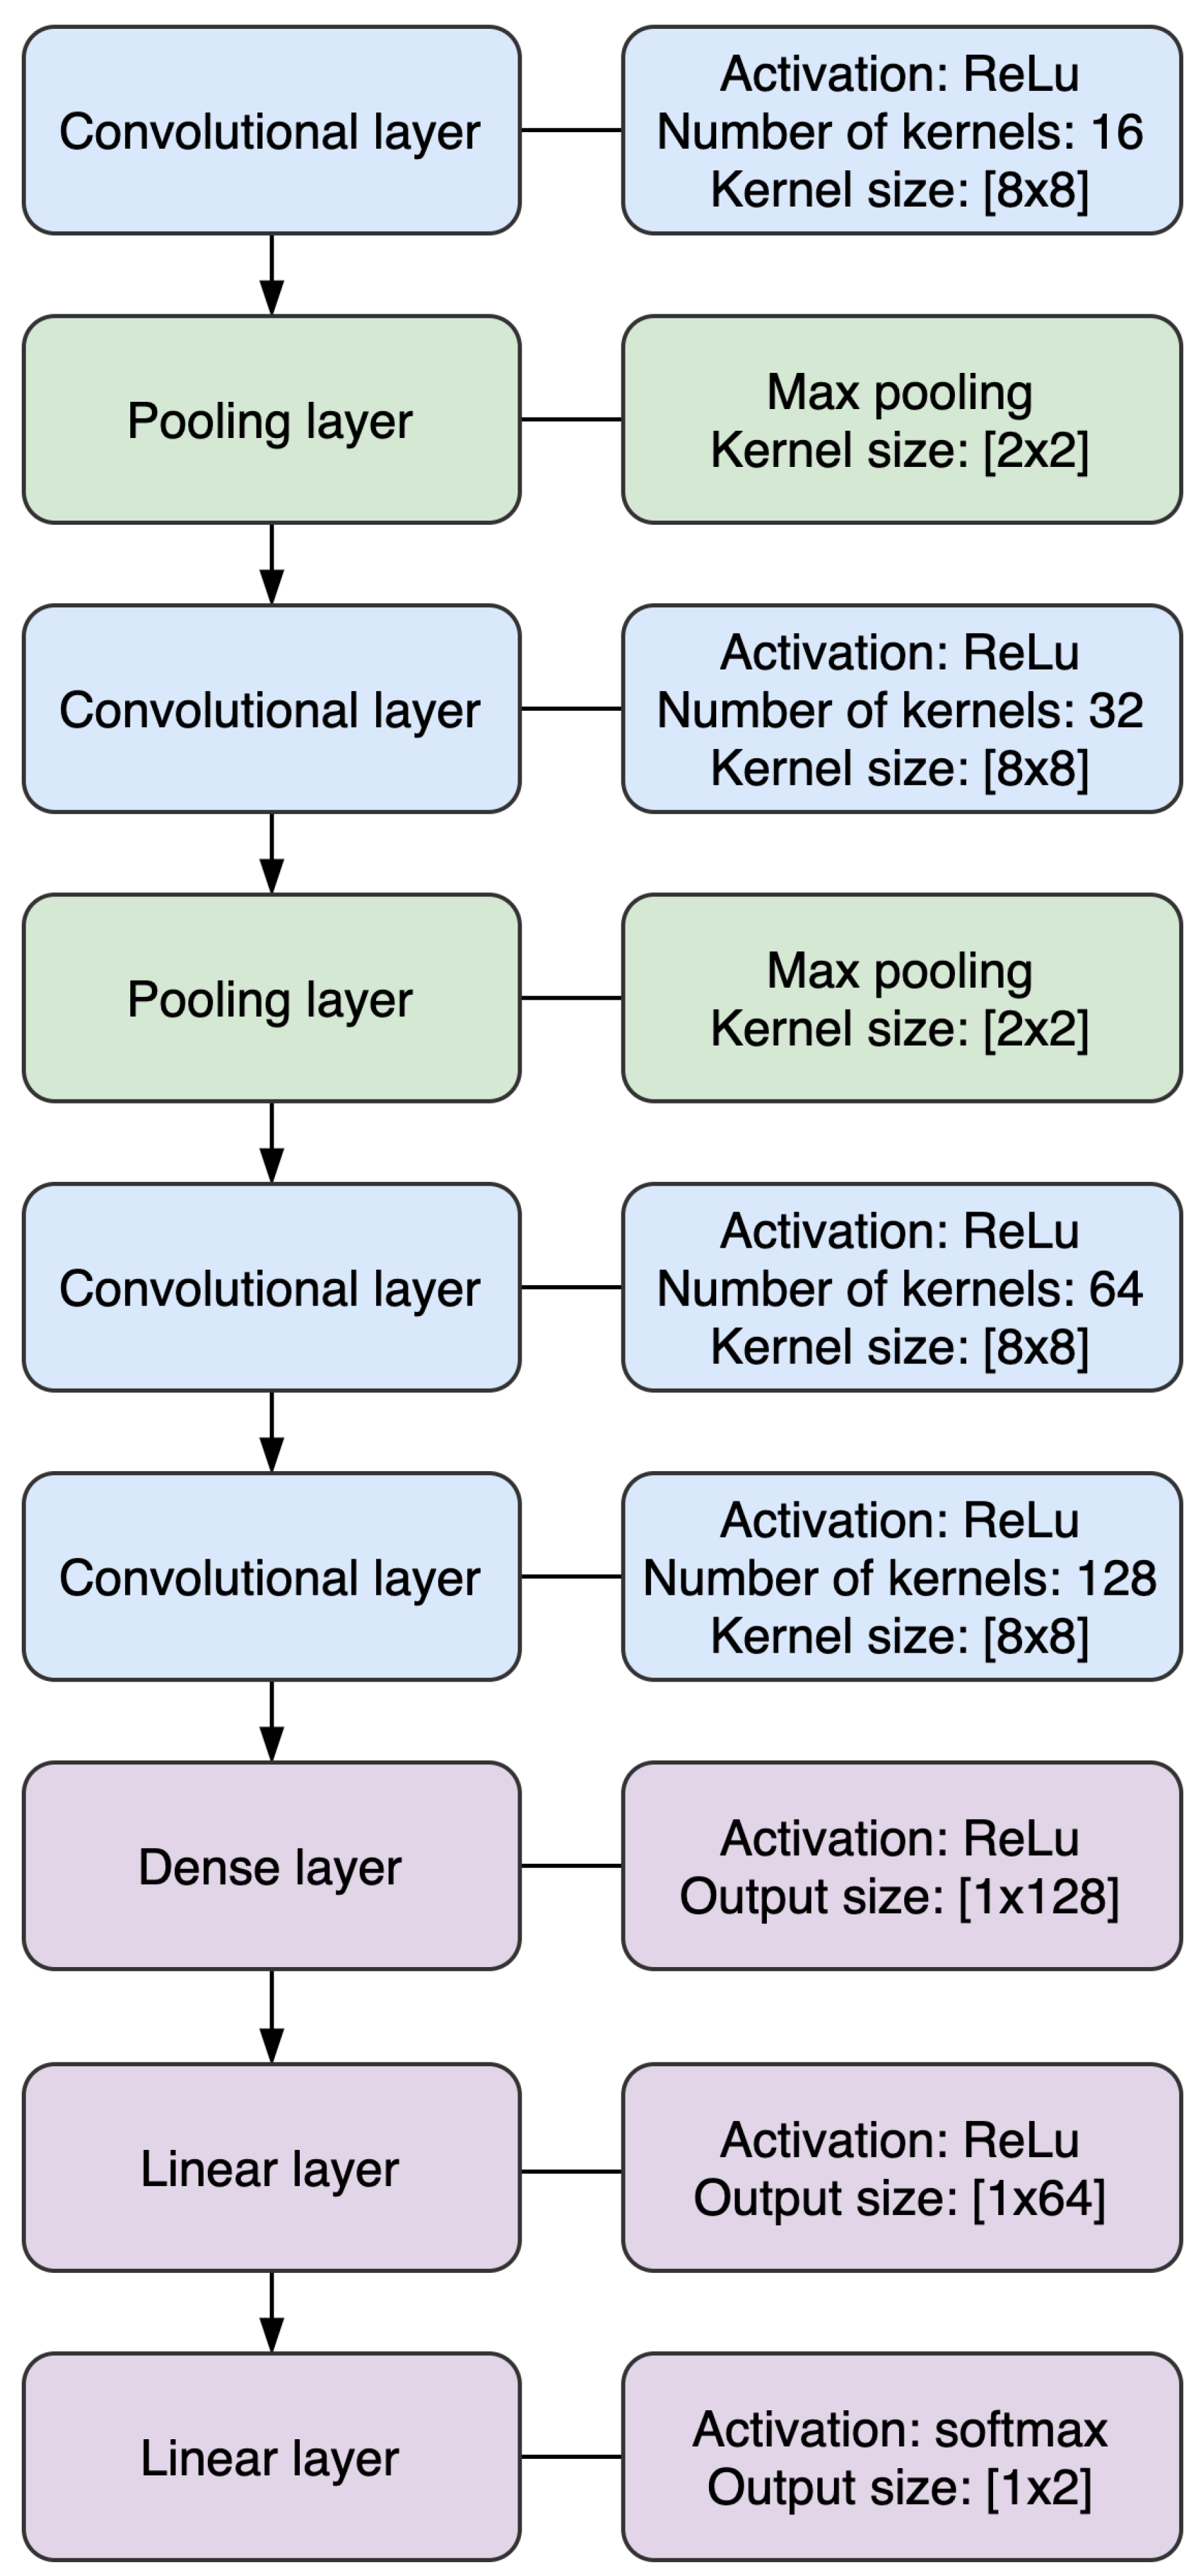
2.4. Convolutional Neural Network

CNN has become quite popular in BCI research over the last decade. CNN can process multichannel EEG data without additional dimensionality reduction and preprocessing.
CNN has shown good results when applied in BCI research. For instance, residual blocks as part of the ResNet architecture achieved 96.77% accuracy for one subject and 93.3% for another [28]. Still, the model is not subject-independent, as the difference between the results was more than 3% [28]. That is why standalone CNN is not a very popular choice for the P300 speller. CNN can be combined with a long-short term memory (LSTM) neural network in an autoencoder for more efficient dimensionality reduction [29]. It also can be used in ensemble models. The ensemble voting classifier comprised of two CNNs achieved 96.5% accuracy, and the same accuracy was obtained by ensemble learning with SVM [30].
1D CNN architecture was applied for multichannel EEG data. The depth of the output of a convolutional layer becomes equal to the number of filters applied. For example, by applying 16 kernels, we obtained the output of the same width and length, but with a depth of 16. The CNN architecture used for multichannel EEG classification is presented in Figure 2.
The CNN uses several convolutional layers, followed by the pooling layers. To achieve faster dimensionality reduction, we used an 8 × 8 kernel (or filter). The pooling layers used a 2 × 2 kernel, which found the maximum among the input values, as max pooling turned out to be more efficient than average pooling. By comparing different activation functions, such as sigmoid, tanh, and rectified linear unit (ReLU), the CNN model achieved 76.53% accuracy on validation during 20 training epochs using the ReLU activation function, 73.21% using the tanh, and only 61.08% accuracy using the sigmoid. Moreover, while using the sigmoid and the tanh activation functions, the error gradient vanished due to multiple hidden layers. Therefore the ReLU, which is computationally less expensive, was used here. The ReLU function is defined as
ReLU ( X i ˜ ) = max ( 0 , X i ˜ ) ,
where X i ˜ is the feature vector resulting from the previous layer.
The last linear layer of the CNN uses softmax as an activation function. The softmax function is a generalization of the sigmoid function, and when the number of classes is two, the softmax function reduces to the sigmoid function. It is calculated as
softmax ( X i ˜ ) j = e x j k = 1 K e x k ,
where the exponential of each data point x j is normalized by the sum of the exponentials of all K data points of the feature vector X i . The output of the linear layer was a vector of length of 2. It represented the probability of the input EEG data being a target P300 component P ( X i , y = 1 ) or a nontarget component P ( X i , y = 1 ) .

3. Proposed Methodology

The proposed models were trained using the data of eight healthy subjects in the Akimpech P300 dataset [31]. Test data consisted of four healthy subjects from the Akimpech P300 dataset and five subjects with bulbar and spinal onset ALS from the BCI Horizon 2020 ALS patients P300 dataset [32]. Further data preprocessing steps are described in Section 4.1.

3.1. Training Approach

There are two different training approaches used for the P300 speller, subject-specific training (SST) and generic training (GT). SST assumes training for each user separately, and it is used in the majority of the classical P300 spellers. The training dataset in this case was collected from a single subject. SST usually provides better results, however, it is not an option for the subject-independent P300 speller, as it usually requires training and testing the classifier using the same user’s data. This approach is not user-friendly, as it usually takes at least 30 min to train the speller for each user.
The GT approach merges the data from different subjects into a single training dataset. The generically trained model can further be used for new subjects without retraining. GT training has been applied for subject-independent adaptive EEG classification in the P300 speller [12]. Sometimes both intersubject features resulting from GT training and intrasubject features extracted during SST training are used for designing an adaptive classifier [33]. The GT approach represented better results in our previous experiments as reported in [34]. Therefore, the GT approach was employed for the proposed ensemble voting classifiers training, as discussed in this paper.

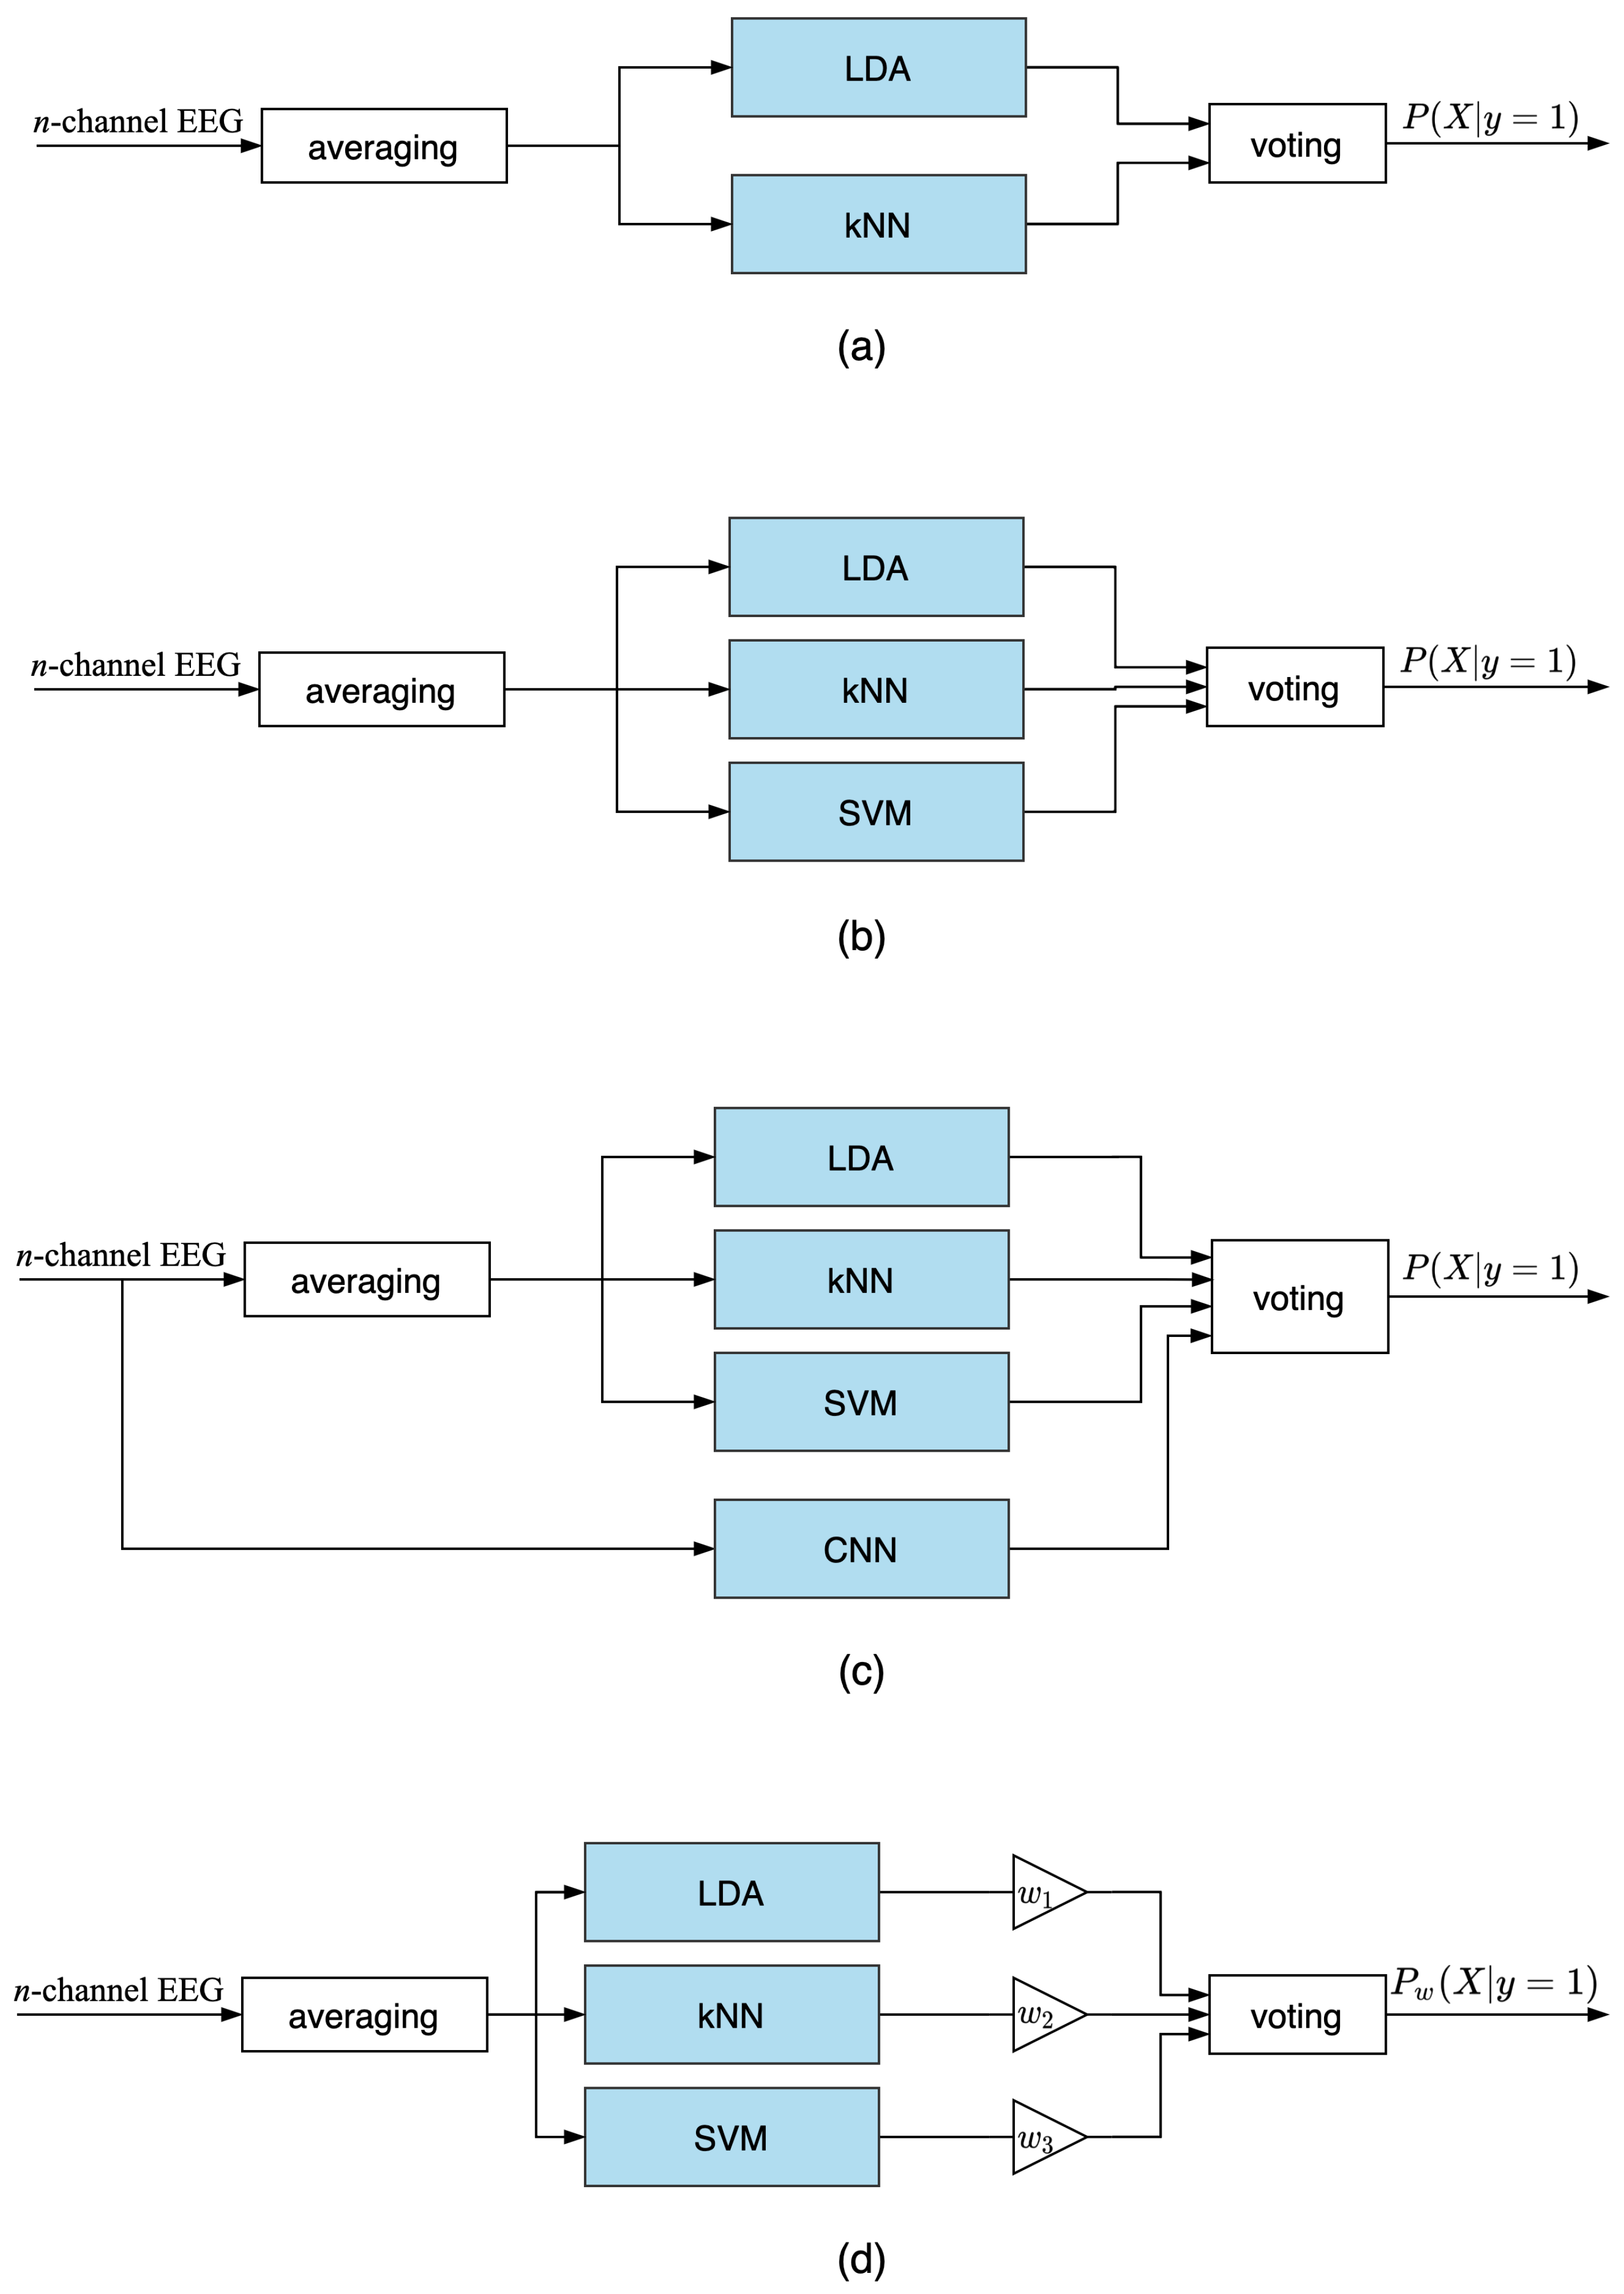
3.2. Ensemble Voting

Ensemble learning is a technique of combining several models to achieve more stable results. Recently, ensemble learning has become a popular choice for brain signals’ features classification. For instance, a number of classifiers, such as SVM, can be applied on the same data. The models have different hyperparameters for classifying the P300 speller data [27]. Apart from the SVM, a popular choice for EEG classification is to ensemble several CNN classifiers [30] with different architectures.
Ensemble learning exhibits stable results for P300 component classification; however, it always uses more computational resources to be trained because it contains not one but several models. That is why the proposed methodology is designed for GT. Here, the model is trained on a merged dataset from different subjects and does not require retraining for the new user. Using the above-described classifiers soft-voting ensemble models were designed, as shown in Figure 3. Essentially, four different ensemble architectures were designed: the LDA-kNN model (Figure 3a), LDA-SVM-kNN (Figure 3b), LDA-SVM-kNN-CNN (Figure 3c), and the W-LDA-SVM-kNN model(Figure 3d). Three of these models used simple averaging voting, while the last was a weighted-averaging voter. As mentioned in Section 3, CNN uses 2D EEG data directly, while LDA, SVM and kNN models require channel-averaging before features extraction.
We decided to combine the LDA and kNN models in order to achieve the most efficiency in terms of a time complexity ensemble voting model. The fusion of LDA, kNN, and SVM and its weighted version were assumed to be more accurate than LDA-kNN, as SVM is one of the best models for P300 classification. Combining CNN with the LDA and/or kNN in one ensemble voter seemed to not be effective in terms of computational complexity, as CNN requires much more time to process the data than LDA and kNN. SVM however requires more computational resources, due to the kernel trick and optimal hyperplane construction. Thus, CNN was added to the fusion of LDA, SVM, and kNN in order to see whether 2D data classification could improve the existing ensemble model. Despite the fact that the LDA-SVM-kNN-CNN ensemble model may require much more time to process the data, it is assumed that it can outperform other ensemble voting models in terms of accuracy.
The classification results of the simple ensemble-averaged voting models were computed as follows
P a v g ( X | y = 1 ) = i = 1 N P i ( X | y = 1 ) N ,
where P i ( X | y = 1 ) is the ith classifier’s prediction of EEG vector X containing the target P300 component. N is the number of classifiers in the ensemble voting model.
It can be assumed that weighted voting would be more efficient for the P300 speller rather than just ensemble averaging. For instance, the weighted voting based on CNN, SVM, and stepwise LDA was introduced for the P300 speller with the aim of improving EEG classification [35]. In this work, we assume that the weighted ensemble voting based on LDA, SVM, and kNN classifiers can improve the performance of the system.
Figure 3d represents the weighted voting model’s structure (W-LDA-SVM-kNN), where each result of the inner classifiers is multiplied by the weight w i as
P w ( X | y = 1 ) = i = 1 N w i P i ( X | y = 1 ) i = 1 N w i .
In order to find the optimal weights, GS or random search (RS) can be applied. In GS it is necessary to run through the grid of the possible triplets of weights, while in RS hyperparameters are sampled randomly. As there are only three weights needing to be found, random combinations of three weights are generated quite fast. The most optimal weights combination is further selected among the generated parameters without any aliasing. In this work classical fixed step-size RS is used, however, some more optimized methods such as adaptive step-size RS may also be applied.

4. Simulation Results

This section presents details of simulations carried out to demonstrate the effectiveness of the proposed methodology in comparison with the existing approaches. The proposed ensemble models were compared with two boosting classifiers: classical gradient boosting and extreme gradient boosting, which are further described in Section 4.3. Moreover, the performance of the ensemble classifiers was compared with the standalone LDA, SVM, kNN, and CNN models.

4.1. Experimental Settings

The experimental validation of the proposed models was verified on two datasets [31,32]. The datasets were obtained 10-10 EEG electrode positions with modified combinatorial nomenclature [36]. The datasets used a unipolar reference [37]. The signal was referenced to the ground earlobe and grounded to the left mastoid. In order to have the same number of electrodes, two electrodes (C3, C4) were removed from the Akimpech data. As a result eight-channel (Fz, Cz, Pz, P3, P4, PO7, PO8, Oz) data were extracted from both datasets. The provided EEG values vectors X were marked with a y label. For EEG vectors containing target P300 peak y = 1 , while for nontarget flashings y = 1 .
The raw EEG data of healthy subjects were filtered using a Chebyshev 4th order notch filter for the frequency range of 58–62 Hz anda Chebyshev 8th order band-pass filter for 0.1–60 Hz range by the authors of the dataset. The frequencies higher than 30 Hz or γ -band of EEG signal did not need to be considered in the oddball paradigm. Thus, the EEG signal was again band-passed using the 0.1–30 Hz frequency range. The frequencies below 30 Hz, which are α -band (8–13 Hz), β -band (13–30 Hz), δ -band (0.1–4 Hz) and θ -band (4–8 Hz) brainwave frequencies, were mainly considered for P300 component extraction. The data of ALS patients were already band-passed for 0.1–30 Hz range by the dataset providers.
Some researchers prefer using 1000 ms latency of EEG vectors for classifying P300 component, for instance the time period from −200 ms to 800 ms can be considered as in [20]. The period starting from 0 ms to 700 ms is also a popular choice for P300 detection [38]. To reduce the redundancy of the dataset, it was decided not to consider the whole 1000 ms time period for each flashing but only to take the period up to 700 ms after the stimuli. However, since the dataset considered not only healthy subjects but also ALS patients, it was decided to extend the period taking into consideration 100 ms before the stimulus. This can improve the classification, as a sharper difference can be detected between the voltage detected 100 ms before the stimulus and 300 ms after the stimulus, rather than the difference between the beginning of the stimulus (0 ms) and the P300 component. Thus, it was decided to consider the regions starting from −100 ms before the flashing and ending with the 700 ms after the flashing. By taking the −100 ms to 700 ms latency period, 204 data points were extracted for each flashing trial, and the sampling rate was 256 Hz.
The removal of the unnecessary EEG data can improve the computational complexity of the ensemble models, which require more computational resources than classical standalone classifiers. In addition, the dataset was balanced by removing redundant nontarget EEG vectors. Initially, there were 25 letters of input provided by the dataset for each subject, which gave 300 data samples for a single subject. There were 250 nontarget data samples out of 300. In order to balance the data, only 75 of them were randomly selected for further training. The dataset comprised 60% of the nontarget class and 40% of the target class data from data balancing steps. This gave us 125 data samples for each subject. Training data was collected from 8 healthy subjects, resulting in 1000 data samples. Test data consisted of 500 data samples of healthy subjects and 625 data samples from ALS patients. Instead of complex dimensionality reduction techniques, such as principal component analysis (PCA), the EEG signal was averaged by the channels for its further classification by LDA, kNN, and SVM.
The proposed models were trained on 1000 data samples and tested for 500 data samples of healthy subjects. In order to evaluate the models, 3-fold validation was performed. Each model was trained and validated three times and the average metrics were calculated for healthy subjects’ training. The trained models were then tested on 625 data samples of ALS patients.
The computations were performed using Python 3.7.3. The hardware used during the simulations was NVIDIA GeForce GT 650M together with the 2.6 GHz Quad-Core Intel Core i7 processor. The simulations were carried out for experimental EEG data (as described earlier) and in various settings of number of channels, viz., 8-channel EEG, 4-channel EEG, and single-channel EEG.
In order to evaluate the performance of each classifier, the number of true positive ( T P ), true negative ( T N ), false positive ( F P ), and false negative ( F N ) predictions were calculated. The most commonly used metric for performance evaluation is classifier’s accuracy, which is calculated as
Accuracy = T P + T N T P + T N + F P + F N .
However, when working with unbalanced datasets, accuracy does not show the overfitting rate. If the dataset is not balanced, it would consist of 10 nontarget flashings and only 2 target flashings (as only one row and one column out of 12 rows and columns contain the chosen character). If the classifier identifies only nontarget EEG signals, but fails to classify the target flashings, there would be 10 correctly recognized nontarget components. However, in that case, there would be zero true positively recognized target class components. For this example, the accuracy would still be 85.71%, which seems quite good. However, the fact is that the classifier failed to identify all of the target peaks. In order to examine whether the target class was correctly recognized and the number of F N was low, the recall metric is calculated as
Recall = T P T P + F N .
Precision value indicates an EEG signal labeled as positive (target response) is positive and is computed as
Precision = T P T P + F P .
In our case, the data were not perfectly balanced. The number of nontarget classes exceeded the target classes, as the dataset comprised 60% of the nontarget class and 40% of the target class after the balancing. That is why the recall value was still considered. In order to see both characteristics of recall and precision metrics, the F-score was calculated as a harmonic mean
F- score = 2 ( Precision * Recall ) Precision + Recall .
Thus, recall and F-score were mainly used for the performance evaluation.

4.2. Intra-Subject Experiments

The main objective of the present contribution was to develop and test a robust subject-independent classification approach for a P300 speller. The results of the proposed approach are presented later; however, in this subsection, the results for the intra-subject experiments are presented, where the models were trained and tested from the same subject. In other words, SST training was applied using five ALS patients and five healthy subjects. 80% of the data from one subject was used for training and 20% for testing.
The averaged metrics were obtained by summing the results from each subject and dividing by the number of subjects. The experiments were done for eight-channel data, four-channel data, and single-channel data. The obtained averaged F-score is presented for each model in Table 1.
It can be observed from Table 1 that there was no significant difference between the performance when using eight data channels and four data channels. Single-channel data provided inaccurate results, achieving about an 83% average F-score for all subjects. Thus, it can be concluded that single-channel data is a poor choice for intra-subject classification. It is further seen in Section 4.5 that single-channel usage did not provide high performance in generic training either.
The usage of CNN in LDA-SVM-kNN-CNN did not significantly decrease the performance in the eight-channel data experiment, reaching a 98.75% F-score. However, it dropped to 93.56% when using four-channel data. All of the other ensemble voting models provided quite stable results during the experiments on eight-channel and four-channel data.
When trained and tested for each subject separately, the models achieved higher performance, compared to the proposed subject-independent training results, presented in Section 4.3Section 4.5. However, it should be noticed, that this approach is not a good option when talking about online training and practical usage. As stated earlier, the aim of this research is to develop a subject-independent classifier, which can be used by ALS patients without the necessity to train. So, despite the fact that by using SST training the models were able to reach a 99% F-score, inter-subject results are more important for a user’s comfort and are detailed in the following subsections.

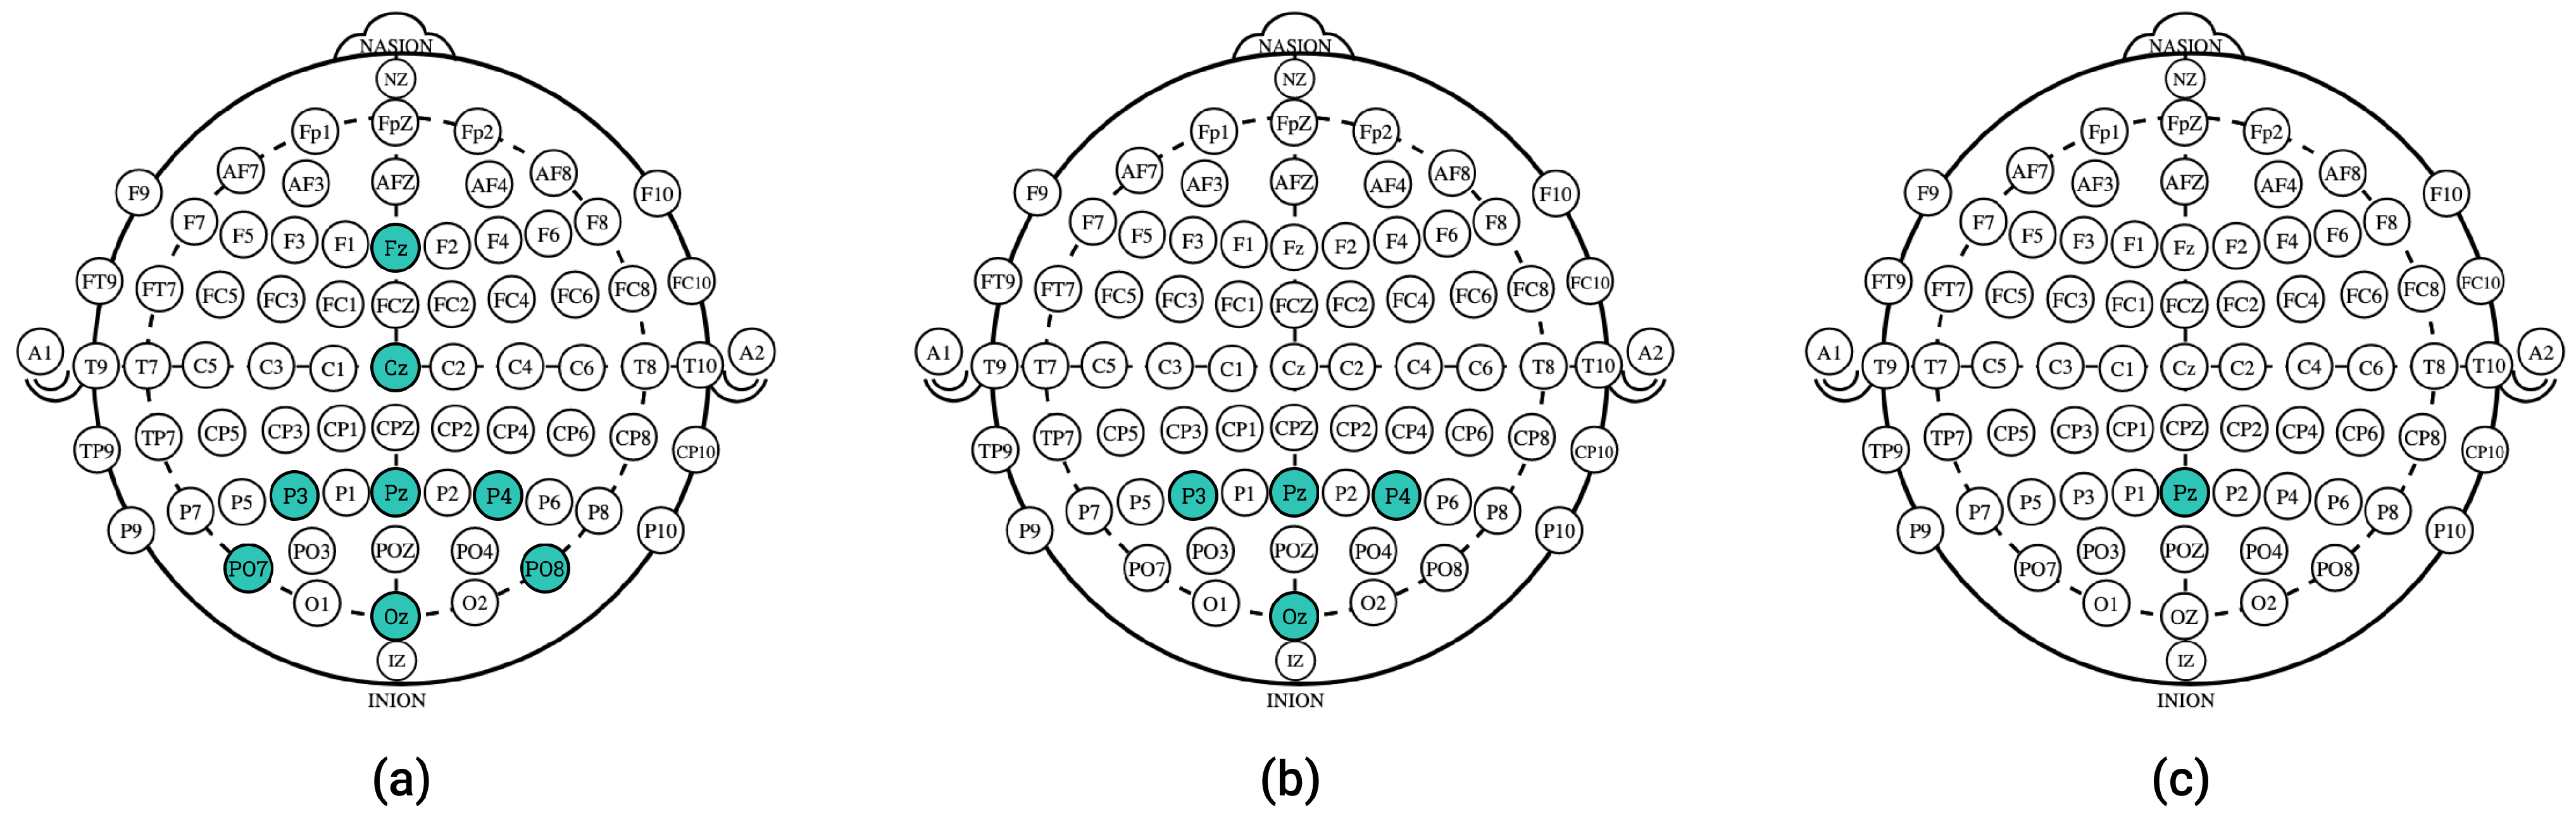
4.3. Eight-Channel Data Simulations

The classification models were trained on the eight-channel data of eight healthy subjects and tested on four healthy subjects. The channels used are represented in Figure 4a. Two baseline classifiers were also trained and tested on the same data. The first classifier was a classical gradient boosting. Gradient boosting has shown high performance for EEG classification in different applications, such as rehabilitation systems [39] and the P300 speller [40]. In this work, the gradient boosting classifier was modeled by using the sklearn python library [41]. The second classifier was extreme gradient boosting or XGBoost [42]. Due to its high performance and time efficiency over recent years, XGBoost has become a popular option for different applications, and the P300 speller is not an exception [43]. Both XGBoost and gradient boosting classifiers are designed with the maximum number of trees limited to 100, where each tree can have a maximum depth of three nodes. A default learning rate of 0.1 was used for the experiments [41]. There were no pruning and no parallel threads used for the baseline classifiers. XGBoost uses tree booster, which is preferable to the linear booster, as the linear booster may fail to fit when using complex time-series EEG data.
While training for eight-channel data, the weights of the W-LDA-SVM-kNN model were found using RS. RS performed nested 5-fold cross-validation on the data of eight healthy subjects to find the optimal weights. There were 800 data samples used for training and 200 data samples used for the test to find the optimal weights. Searching for the weights took 41.58 s for the data from eight subjects. The obtained weights were as follows:
  • LDA weight: w 1 = 0.19
  • SVM weight: w 2 = 0.71
  • kNN weight: w 3 = 0.25
The obtained weights can be used for further experiments, without renewal. The average time for elapsed for testing was 3.91 s as seen from the results, presented in Table 2. The last column of Table 2 represents the computational time spent for various models while testing the same amount of data. The proposed classifiers provided good results, except for the model that used CNN. The LDA-SVM-kNN-CNN ensemble voting model turned out to be computationally ineffective due to the complex structure of the neural network. Moreover, the model suffered from overfitting, as the value of the F-score was more than 7% lower than the accuracy value.
The fastest model proposed was the LDA-kNN fusion, which took only 0.72 s to train for eight subjects. This can be explained by the fact that LDA is an efficient choice for EEG classification with low computational complexity, and kNN is an instance-based algorithm that computes the distance for only k = 3 neighbors. For the same experiment, standalone LDA required 0.61 s for training, while it took only 0.16 s for kNN to train the same amount of data. The weighted ensemble model did not show any performance improvement compared to the simple averaged LDA-SVM-kNN model. However, both models provided the best F-score, achieving more than 99.12%.
Obviously, the proposed ensemble classifiers require more time to process the data than the classical standalone models. However, it is seen from Table 2 that the difference between the elapsed time is not very meaningful. Thus, it can be said that ensemble learning does not require many more computational resources when trained on eight subjects. Moreover, the proposed classifiers provided better results than the gradient boosting in terms of computational complexity. This is explained by the fact that the gradient boosting nests decision trees one after another to achieve the necessary performance. XGBoost works much faster than the classical gradient boosting, however, it was still slightly outperformed by the proposed ensemble voting classifiers, except for the LDA-SVM-kNN-CNN. Table 3 represents the simulation results obtained from testing on five ALS patients’ data. The overall performance of the classifiers decreased compared to the results of testing on the healthy subjects’ data. Still, the proposed methods did work with ALS patients. This means that the classifiers are subject-independent even in terms of comparing healthy subjects with patients with a brain disorder. The baseline classifiers performed slightly better, reaching more than 85% F-score. The weighted voter classifier W-LDA-SVM-kNN outperformed gradient boosting and achieved the best performance metrics among the proposed classifiers in this case. So it can be assumed that the SVM classifier, which had the most value in the weighted voter, performed better on ALS eight-channel data than LDA and kNN.
The simple ensemble averaging models LDA-SVM-kNN and LDA-kNN achieved about 84% accuracy, which is also a meaningful result, despite the fact that these models were slightly outperformed by the boosting algorithms. Again, LDA-SVM-kNN-CNN showed the worst result among the proposed models, meaning that the convolution of the eight-channel data was not a good choice. The proposed CNN architecture failed to extract the most essential features out of the EEG input data. Thus, it can be summarized that the CNN model is a poor choice for EEG time-series data classification in a subject-independent P300 speller.

4.4. Four-Channel Data Simulations

Multichannel EEG classification allows covering different regions of the human brain; however, it makes it much more complex. It has been shown by the comparison of 14-channel data and 4-channel data classification that increasing the number of EEG electrodes does not increase the accuracy of the P300 speller [44]. For instance, decreasing the number of channels from 64 to 20 using channel selection and nontarget data reduction provided better results in terms of computational complexity and did not affect the accuracy negatively [45]. The EEG channels can be efficiently selected using different methods, such as abchannel-aware dictionary with sparse representation for the P300 speller as in [45]. Group sparse Bayesian linear discriminant analysis (BLDA) can also be applied for channel selection. As reported in [46], by applying group sparse BLDA to the data collected from 16 different subjects, it was found that the most optimal channels selected by the algorithm were located close to visual ERP areas. Despite the fact that optimal EEG channel selection is subject-dependent, the abovementioned results lead to the common idea that the selected channels should be located in the parietal and occipital zones of human brain. The presented results show that the CPz, P4, P3, Pz, O1, Oz, and O2 channels were the most efficient electrodes for the majority of the subjects using most of the channel selection methods. Authors recommend using the Pz, Oz, O1, and O2 combination of channels as the most efficient [46].
In order to check whether the number of EEG channels can be decreased without affecting the accuracy negatively, experiments have been conducted using four EEG channels. The four channels used for the experiment were chosen from the visual ERP area of a human brain, according to the results that were presented by other researchers. The channels selected were P3, P4, Pz, and Oz. The placement of the electrodes is represented in Figure 4b. The combination of PO7, PO8, Pz, and Oz was also tried during the experiments; however, its accuracy was on average about 3.5% lower than the combination of P3, P4, Pz, and Oz.
Table 4 presents the obtained results for four-channel data features classification. Testing on ALS patients using four channels generally improved the classification performance among the proposed ensemble models. Comparing these results with the eight-channel experiments (see Table 3), the F-score increased on average by more than 5% for the proposed ensemble models, which did not use CNN. In contrast, the performance of the LDA-SVM-kNN-CNN model decreased by more than 10%. This is explained by the structure of the CNN classifier, which is very dependent on the input shape. That is another reason why the CNN is inefficient for EEG time-series classification in the P300 speller. Every time the number of channels is changed, the architecture of the CNN classifier should be changed too, which is a very complex procedure.
It is observed from Table 3 that the weighted ensemble voting classifier achieved a 90.74% F-score, which was higher than the gradient boosting with 88.59%. The proposed simple averaging voters achieved 89.17% using LDA-kNN architecture and 88.88% using LDA-SVM-kNN fusion, which was also better than the gradient boosting algorithm. XGBoost appears as the most accurate model in this case study, however, it suffers from a long processing time (see Table 2). The proposed models achieved a somewhat similar performance, and at a reduced computational cost.

4.5. Single-Channel Data Simulations

Multichannel EEG processing is a time-consuming and complex process. Some researchers prefer using a single-channel EEG data for the P300 speller [47]. Single-channel classification must be performed using some of the central electrodes (such as Fz, Cz, Pz, or Oz), as it is inappropriate to consider only one hemisphere of the human brain for data acquisition in BCI speller. Fz and Cz channels are not located in the visual cortex of the brain, thus for single-channel experiments either the Pz or Oz electrode should be chosen. To examine whether a single data channel usage was efficient in our case, the Pz electrode was chosen for further simulations.
The parietal region showed the maximum activity during the oddball paradigm, thus, the Pz electrode presented in Figure 4c was chosen among other active options. During the simulations, the LDA-SVM-kNN-CNN voter was excluded, as there is no meaning of CNN usage on a single-channel EEG vector.
The results obtained during testing for four healthy subjects and five ALS patients are shown in Table 5. A single-channel classification was not as efficient as multichannel usage. The average accuracy for healthy subjects’ data classification was 91.28% for the proposed voters, while it was only 78.19% average accuracy for the EEG classification of ALS patients. The weighted voter was slightly more accurate for ALS data, while there was no significant change in the results for healthy subjects. The weighted fusion of three classifiers again slightly outperformed the LDA-kNN voter in terms of performance metrics for ALS data, reaching 78.74% accuracy, while LDA-kNN reached only 77.86%. Still, the proposed ensemble models provided better results than the standalone classifiers.

4.6. Discussion

When classifying the data obtained from healthy subjects, the LDA-kNN voter achieved better results and outperformed the SVM-based voters by about 0.33%. This difference may not seem significant; however, considering the low computational complexity of the LDA-kNN fusion, this classifier is better to use when training on larger datasets. However, when using smaller datasets, it is preferred to add SVM into the ensemble model, as it will provide more accurate results. The weighted ensemble voting model with the SVM classifier provided the best performance for ALS patients’ data, achieving more than 90% accuracy when using four-channel classification. There was a tradeoff between the accuracy and the computational complexity. For large datasets, the LDA-kNN voter will be the better option. However, W-LDA-SVM-kNN provided more accurate results, but as it requires much more time for training, it is better to use on smaller datasets.
Apart from the tradeoff between the computational complexity and the accuracy, there was one general weakness, related to memory requirements. Due to the fact that kNN is an instance-based algorithm, it must store the training data. This may cause problems when using more training data for online spellers. Nevertheless, 1000 data samples, which were vectors containing 204 data points, were enough for an efficient result; thus, data storage should not cause significant limitations.
By comparing different numbers of channels, it turned out that using only four channels of the parietal zone was more efficient than using a wider range of brain activity with eight channels. The summary of the results for ALS patients’ data with different number of EEG channels is presented in Table 6. The accuracy improved by about 5% (on average) when using the four channel EEG data. Single-channel EEG classification provided less than 80% accuracy, which was another limitation found during the experiments. However, if the single-channel EEG timeseries are converted to a frequency domain, the accuracy may increase as in [47]. Thus, to decrease the number of used electrodes in the future, it is planned to use frequency domain spectrograms instead of EEG timeseries.
The proposed methodology allows training a universal P300 speller, which does not need to be retrained for each subject. Despite the fact that the classification was performed offline, it is assumed that the same tendency will be noted for the online P300 speller as well. Therefore, ALS patients will not face the necessity of sitting for an hour in front of the flashing GUI for the speller to collect the training set. The proposed features classification methodology makes the P300 speller ready for exploitation right from the first trial.

5. Conclusions

In this paper, four different ensemble voting models based on LDA, SVM, kNN, and CNN classifiers were proposed. The experimental results suggest that the proposed ensemble voting classifiers trained on the data from healthy subjects are able to classify bulbar and spinal onset ALS patients’ data. The proposed ensemble voting based on LDA, SVM, and kNN classifiers provided robust results when tested on different subjects. The W-LDA-SVM-kNN weighted ensemble voting model achieved the most accurate results among the proposed classifiers, reaching 91.34% accuracy for four-channel ALS patients’ data. When comparing the proposed methods by the time elapsed during the training, the most efficient classifier turned out to be the LDA-kNN combination, which achieved a good accuracy of 99.92% for eight-channel data of healthy subjects but provided less than 90% accuracy for ALS patients. Almost all of the proposed ensemble voting models (except for the CNN-based model) outperformed standalone classifiers by about 5% during the experiments on eight-channel, four-channel, and single-channel data. The ensemble model with CNN turned out to be inefficient for timeseries classification in a subject-independent P300 speller.
It is planned to extend the methodology in the future and test the given subject-independent models using data from patients suffering other motor neuron diseases, such as cerebral palsy or peripheral neuropathy. Moreover, while using the online P300 speller, the users can be tired and their mental workload may affect the classification as well. Thus, mental workload classification of EEG [48] is also planned to be used in future research. The possible usage of a spectrogram representation of the EEG signal is also considered being combined with ensemble learning in the future. EEG data can be presented as an intertrial coherence plot or event-related spectral power (ERSP) spectrograms [49] and processed simply as images. In that case, transfer learning may be used in the future together with more advanced CNN architectures such as ResNet [50].

Author Contributions

Conceptualization, A.M.; methodology, A.M.; software, A.M.; validation, A.M., P.K.J. and M.T.A.; formal analysis, A.M. and P.K.J.; investigation, A.M.; resources, P.K.J. and M.T.A.; data curation, A.M., P.K.J. and M.T.A.; writing—original draft preparation, A.M.; writing—review and editing, P.K.J. and M.T.A.; visualization, A.M.; supervision, P.K.J. and M.T.A.; project administration, P.K.J. and M.T.A.; funding acquisition, P.K.J. and M.T.A. All authors have read and agreed to the published version of the manuscript.

Funding

The work presented in this paper was carried out by the first author as a part of her MSc Thesis (in Electrical and Computer Engineering) at Nazarbayev University. This research was supported by the Faculty Development Competitive Research Grants Program under the grant numbers 110119FD4525, 021220FD0251, and the Collaborative Research Grants Program under the grant number 091019CRP2116.

Institutional Review Board Statement

Not applicable.

Informed Consent Statement

Not applicable.

Data Availability Statement

The datasets are publicly available and the links can be found in the references [31,32].

Conflicts of Interest

The authors declare no conflict of interest.

Sample Availability

The supporting source code is available upon request from the corresponding author.

Abbreviations

The following abbreviations are used in this manuscript:
ALSAmyotrophic lateral sclerosis
BCIBrain–computer interface
CNNConvolutional neural network
EDEigenvalue decomposition
EEGElectroencephalography
EOGElectrooculography
ERPEvent-related potential
ERSPEvent-related spectral power
GUIGraphical user interface
kNNk-nearest neighbors
LDALinear discriminant analysis
LSSLeast squares solution
LSTMLong-short term memory
PCAPrincipal component analysis
ReLURectified linear unit
SVDSingular value decomposition
SVMSupport vector machine

References

  1. McFarland, D.J.; Wolpaw, J.R. EEG-based brain–computer interfaces. Curr. Opin. Biomed. Eng. 2017, 4, 194–200. [Google Scholar] [CrossRef]
  2. Nicolas-Alonso, L.; Gomez-Gil, J. Brain computer interfaces, a review. Sensors 2012, 12, 1211. [Google Scholar] [CrossRef]
  3. Wang, C.; Xu, J.; Zhao, S.; Lou, W. Identification of early vascular dementia patients with EEG signal. IEEE Access 2019, 7, 68618–68627. [Google Scholar] [CrossRef]
  4. Qin, Y.; Zheng, H.; Chen, W.; Qin, Q.; Han, C.; Che, Y. Patient-specific seizure prediction with scalp EEG using convolutional neural network and extreme learning machine. In Proceedings of the 2020 39th Chinese Control Conference (CCC), Shenyang, China, 27–29 July 2020; pp. 7622–7625. [Google Scholar] [CrossRef]
  5. Colombo, R.; Pisano, F.; Micera, S.; Mazzone, A.; Delconte, C.; Carrozza, M.; Dario, P.; Minuco, G. Robotic techniques for upper limb evaluation and rehabilitation of stroke patients. IEEE Trans. Neural Syst. Rehabil. Eng. 2005, 13, 311–324. [Google Scholar] [CrossRef]
  6. Rebsamen, B.; Burdet, E.; Guan, C.; Zhang, H.; Teo, C.L.; Zeng, Q.; Laugier, C.; Ang, M.H. Controlling a wheelchair indoors using thought. IEEE Intell. Syst. 2007, 22, 18–24. [Google Scholar] [CrossRef]
  7. Chen, X.; Zhao, B.; Wang, Y.; Xu, S.; Gao, X. Control of a 7-DOF robotic arm system with an SSVEP-based BCI. Int. J. Neural Syst. 2018, 28. [Google Scholar] [CrossRef] [PubMed]
  8. Xu, L.; Liu, T.; Liu, L.; Yao, X.; Chen, L.; Fan, D.; Zhan, S.; Wang, S. Global variation in prevalence and incidence of amyotrophic lateral sclerosis: A systematic review and meta-analysis. J. Neurol. 2020, 267, 944–953. [Google Scholar] [CrossRef] [PubMed]
  9. Kameswara, T.; Rajyalakshmi, M.; Prasad, T. An exploration on brain computer interface and its recent trends. Int. J. Adv. Res. Artif. Intell. 2013, 1, 17–22. [Google Scholar] [CrossRef] [Green Version]
  10. Farwell, L.; Donchin, E. Talking off the top of your head: Toward a mental prosthesis utilizing event-related brain potentials. Electroenceph. Clin. Neurophysiol. 1998, 70, 510–523. [Google Scholar] [CrossRef]
  11. Picton, T. The P300 wave of the human event-related potential. J. Clin. Neurophysiol. 1992, 9, 456–479. [Google Scholar] [CrossRef]
  12. Lu, S.; Guan, C.; Zhang, H. Unsupervised brain computer interface based on intersubject information and online adaptation. IEEE Trans. Neural Syst. Rehabil. Eng. 2009, 17, 135–145. [Google Scholar] [CrossRef]
  13. Speier, W.; Knall, J.; Pouratian, N. Unsupervised training of brain–computer interface systems using expectation maximization. In Proceedings of the 2013 6th International IEEE/EMBS Conference on Neural Engineering (NER), San Diego, CA, USA, 6–8 November 2013; pp. 707–710. [Google Scholar] [CrossRef]
  14. Grizou, J.; Iturrate, I.; Montesano, L.; Oudeyer, P.Y.; Lopes, M. Calibration-free BCI based control. In Proceedings of the AAAI Conference on Artificial Intelligence, Québec City, QC, Canada, 27–31 July 2014; Volume 2, pp. 1213–1220. [Google Scholar] [CrossRef]
  15. Gu, Z.; Yu, Z.; Shen, Z.; Li, Y. An online semi-supervised brain–computer interface. IEEE Trans. Biomed. Eng. 2013, 60, 2614–2623. [Google Scholar] [CrossRef] [PubMed]
  16. Dal Seno, B.; Matteucci, M.; Mainardi, L. A genetic algorithm for automatic feature extraction in P300 detection. In Proceedings of the 2008 IEEE International Joint Conference on Neural Networks (IEEE World Congress on Computational Intelligence), Hong Kong, China, 1–8 June 2008; pp. 3145–3152. [Google Scholar] [CrossRef]
  17. Kalaganis, F.; Laskaris, N.; Chatzilari, E.; Nikolopoulos, S.; Kompatsiaris, I. A Riemannian geometry approach to reduced and discriminative covariance estimation in brain computer interfaces. IEEE Trans. Biomed. Eng. 2019, 67, 245–255. [Google Scholar] [CrossRef] [PubMed]
  18. Fisher, R.D.; Langley, P. Methods of conceptual clustering and their relation to numerical taxonomy. Artif. Intell. Stat. 1986, 18, 77–116. [Google Scholar]
  19. Vidaurre, C.; Kawanabe, M.; von Bünau, P.; Blankertz, B.; Müller, K.R. Toward unsupervised adaptation of LDA for brain–computer interfaces. IEEE Trans. Biomed. Eng. 2011, 58, 587–597. [Google Scholar] [CrossRef]
  20. Lee, M.H.; Williamson, J.; Won, D.O.; Fazli, S.; Lee, S.W. A high performance spelling system based on EEG-EOG signals with visual feedback. IEEE Trans. Neural Syst. Rehabil. Eng. 2018, 26, 1443–1459. [Google Scholar] [CrossRef]
  21. Wu, Q.; Zhang, Y.; Liu, J.; Sun, J.; Cichocki, A.; Gao, F. Regularized group sparse discriminant analysis for P300-based brain–computer interface. Int. J. Neural Syst. 2019, 29, 1950002. [Google Scholar] [CrossRef]
  22. Naebi, A.; Feng, Z.; Hosseinpour, F.; Abdollahi, G. Dimension reduction using new bond graph algorithm and deep learning pooling on EEG signals for BCI. Appl. Sci. 2021, 11, 8761. [Google Scholar] [CrossRef]
  23. Diehl, C.P.; Cauwenberghs, G. SVM incremental learning, adaptation and optimization. In Proceedings of the International Joint Conference on Neural Networks (IJCNN), Portland, OR, USA, 20–24 July 2003; Volume 4, pp. 2685–2690. [Google Scholar] [CrossRef]
  24. Vo, K.; Pham, T.; Nguyen, D.N.; Kha, H.H.; Dutkiewicz, E. Subject-independent ERP-based brain–computer interfaces. IEEE Trans. Neural Syst. Rehabil. Eng. 2018, 26, 719–728. [Google Scholar] [CrossRef] [Green Version]
  25. Kundu, S.; Ari, S. P300 based character recognition using convolutional neural network and support vector machine. Biomed. Signal Process. Control 2020, 55, 101645. [Google Scholar] [CrossRef]
  26. Platt, J.C. Probabilistic outputs for support vector machines and comparisons to regularized likelihood methods. Adv. Large Margin Classif. 1999, 10, 61–74. [Google Scholar]
  27. Barsim, K.S.; Zheng, W.; Yang, B. Ensemble learning to EEG-based brain computer interfaces with applications on P300-spellers. In Proceedings of the 2018 IEEE International Conference on Systems, Man, and Cybernetics (SMC), Miyazaki, Japan, 7–10 October 2018; pp. 631–638. [Google Scholar] [CrossRef]
  28. Lu, Z.; Li, Q.; Gao, N.; Wang, T.; Yang, J.; Bai, O. A convolutional neural network based on batch normalization and residual block for P300 signal detection of P300-speller system. In Proceedings of the 2019 IEEE International Conference on Mechatronics and Automation (ICMA), Tianjin, China, 4–7 August 2019; pp. 2303–2308. [Google Scholar] [CrossRef]
  29. Ditthapron, A.; Banluesombatkul, N.; Ketrat, S.; Chuangsuwanich, E.; Wilaiprasitporn, T. Universal joint feature extraction for P300 EEG classification using multi-task autoencoder. IEEE Access 2019, 7, 68415–68428. [Google Scholar] [CrossRef]
  30. Kundu, S.; Ari, S. Fusion of convolutional neural networks for P300 based character recognition. In Proceedings of the 2019 International Conference on Information Technology (ICIT), Bhubaneswar, India, 19–21 December 2019; pp. 155–159. [Google Scholar] [CrossRef]
  31. Ledesma-Ramirez, C.; Bojorges-Valdez, E.; Yanez-Suarez, O.; Saavedra, C.; Bougrain, L.; Gentiletti, G. P300-speller public-domain database. In Proceedings of the 4th International BCI Meeting, Pacific Grov, CA, USA, 31 May–4 June 2010; p. 257. [Google Scholar]
  32. Riccio, A.; Simione, L.; Schettini, F.; Pizzimenti, A.; Inghilleri, M.; Olivetti Belardinelli, M.; Mattia, D.; Cincotti, F. Attention and P300-based BCI performance in people with amyotrophic lateral sclerosis. Front. Hum. Neurosci. 2013, 7, 732. [Google Scholar] [CrossRef] [PubMed] [Green Version]
  33. Xu, M.; Liu, J.; Chen, L.; Qi, H.; He, F.; Zhou, P.; Cheng, X.; Wan, B.; Ming, D. Inter-subject information contributes to the ERP classification in the P300 speller. In Proceedings of the 2015 7th International IEEE/EMBS Conference on Neural Engineering (NER), Montpellier, France, 22–24 April 2015; pp. 206–209. [Google Scholar] [CrossRef]
  34. Mussabayeva, A.; Jamwal, P.K.; Akhtar, M.T. Comparison of generic and subject-specific training for features classification in P300 speller. In Proceedings of the 2020 Asia-Pacific Signal and Information Processing Association Annual Summit and Conference (APSIPA ASC), Auckland, New Zealand, 7–10 December 2020; pp. 222–227. [Google Scholar]
  35. Takeichi, T.; Yoshikawa, T.; Furuhashi, T. Detecting P300 potentials using weighted ensemble learning. In Proceedings of the 2018 Joint 10th International Conference on Soft Computing and Intelligent Systems (SCIS) and 19th International Symposium on Advanced Intelligent Systems (ISIS), Toyama, Japan, 5–8 December 2018; pp. 950–954. [Google Scholar] [CrossRef]
  36. Nuwer, M.R. 10-10 electrode system for EEG recording. Clin. Neurophysiol. 2018, 129, 1103. [Google Scholar] [CrossRef] [PubMed]
  37. Teplan, M. Fundamental of EEG measurement. Meas. Sci. Rev. 2002, 2, 1–11. [Google Scholar]
  38. He, H.; Wu, D. Transfer learning for brain–computer interfaces: A Euclidean space data alignment approach. IEEE Trans. Biomed. Eng. 2020, 67, 399–410. [Google Scholar] [CrossRef] [Green Version]
  39. Liu, Y.; Zhang, H.; Chen, M.; Zhang, L. A boosting-based spatial-spectral model for stroke patients’ EEG analysis in rehabilitation training. IEEE Trans. Neural Syst. Rehabil. Eng. 2016, 24, 169–179. [Google Scholar] [CrossRef] [PubMed]
  40. Hoffmann, U.; Garcia, G.; Vesin, J.; Diserens, K.; Ebrahimi, T. A boosting approach to P300 Detection with application to brain-computer interfaces. In Proceedings of the 2nd International IEEE EMBS Conference on Neural Engineering, Arlington, VA, USA, 16–19 March 2005; pp. 97–100. [Google Scholar] [CrossRef] [Green Version]
  41. Pedregosa, F.; Varoquaux, G.; Gramfort, A.; Michel, V.; Thirion, B.; Grisel, O.; Blondel, M.; Prettenhofer, P.; Weiss, R.; Dubourg, V.; et al. Scikit-learn: Machine learning in Python. J. Mach. Learn. Res. 2011, 12, 2825–2830. [Google Scholar] [CrossRef]
  42. Chen, T.; Guestrin, C. XGBoost: A scalable tree boosting system. In Proceedings of the 22nd ACM Sigkdd International Conference on Knowledge Discovery and Data Mining, San Francisco, CA, USA, 13–17 August 2016; pp. 785–794. [Google Scholar] [CrossRef] [Green Version]
  43. Vijay, M.; Kashyap, A.; Nagarkatti, A.; Mohanty, S.; Mohan, R.; Krupa, N. Extreme gradient boosting classification of motor imagery using common spatial patterns. In Proceedings of the 2020 IEEE 17th India Council International Conference (INDICON), New Delhi, India, 10–13 December 2020; pp. 1–5. [Google Scholar] [CrossRef]
  44. Nashed, N.N.; Eldawlatly, S.; Aly, G.M. A deep learning approach to single-trial classification for P300 spellers. In Proceedings of the 2018 IEEE 4th Middle East Conference on Biomedical Engineering (MECBME), Tunis, Tunisia, 28–30 March 2018; pp. 11–16. [Google Scholar] [CrossRef]
  45. Lee, Y.R.; Lee, J.Y.; Kim, H.N. A reduced-complexity P300 speller based on an ensemble of SVMs. In Proceedings of the 2015 54th Annual Conference of the Society of Instrument and Control Engineers of Japan (SICE), Hangzhou, China, 28–30 July 2015; pp. 1173–1176. [Google Scholar] [CrossRef]
  46. Yu, T.; Yu, Z.; Gu, Z.; Li, Y. Grouped automatic relevance determination and its application in channel selection for P300 BCIs. IEEE Trans. Neural Syst. Rehabil. Eng. 2015, 23, 1068–1077. [Google Scholar] [CrossRef] [PubMed]
  47. Meng, H.; Wei, H.; Yan, T.; Zhou, W. P300 detection with adaptive filtering and EEG spectrogram graph. In Proceedings of the 2019 IEEE International Conference on Mechatronics and Automation (ICMA), Tianjin, China, 4–7 August 2019; pp. 1570–1575. [Google Scholar] [CrossRef]
  48. Qu, H.; Shan, Y.; Liu, Y.; Pang, L.; Fan, Z.; Zhang, J.; Wanyan, X. Mental workload classification method based on EEG independent component features. Appl. Sci. 2020, 10, 3036. [Google Scholar] [CrossRef]
  49. Makeig, S. Auditory event-related dynamics of the EEG spectrum and effects of exposure to tones. Electroenceph. Clin. Neurophysiol. 1993, 86, 283–293. [Google Scholar] [CrossRef]
  50. He, K.; Zhang, X.; Ren, S.; Sun, J. Deep residual learning for image recognition. In Proceedings of the IEEE Conference on Computer Vision and Pattern Recognition, Las Vegas, NV, USA, 27–30 June 2016; pp. 770–778. [Google Scholar] [CrossRef] [Green Version]
Figure 1. Classical 6 × 6 GUI matrix of P300 speller: 12 rows and columns are flashing one by one randomly. A single trial has two target intensifications out of twelve possible flashing rows and columns. By finding the intersection of the target row and column, the chosen character is extracted.
Applsci 11 11252 g001
Figure 2. Architecture of the CNN used: features are extracted using convolutional and pooling layers, followed by linear layers.
Applsci 11 11252 g002
Figure 3. Ensemble averaging models: (a) LDA-kNN model; (b) LDA-SVM-kNN model; (c) LDA-SVM-kNN-CNN model; (d) W-LDA-SVM-kNN model.
Applsci 11 11252 g003
Figure 4. EEG electrodes placement on a scalp: (a) 8-channel data experiments; (b) 4-channel data experiments; (c) single-channel data experiments.
Applsci 11 11252 g004
Table 1. Intra-Subject Test Results.
ModelF-Score (%)
8-Channel Data4-Channel DataSingle-Channel Data
Gradient Boosting99.5399.4584.01
XGBoost99.7099.7585.52
LDA98.7898.8483.35
kNN98.5198.5482.29
SVM98.8098.8182.64
CNN98.4592.18-
LDA-kNN98.7898.9583.35
LDA-SVM-kNN98.8599.2383.28
LDA-SVM-kNN-CNN98.7593.56-
W-LDA-kNN-SVM99.4599.3783.51
Table 2. Test results using 8-channel data of healthy subjects.
ModelAccuracy (%)Recall (%)F-Score (%)Time Elapsed (s)
Gradient Boosting98.2180.4581.9116.25
XGBoost99.9097.0197.894.88
LDA98.8298.9898.790.61
kNN97.2396.8297.010.16
SVM99.5599.2099.123.79
CNN88.4583.1484.332686.98
LDA-kNN99.9299.9099.080.72
LDA-SVM-kNN99.9499.2599.133.83
LDA-SVM-kNN-CNN88.1783.1581.292687.57
W-LDA-SVM-kNN99.9399.2099.12general: 3.91
weights search: 41.58
Table 3. Test results using 8-channel data of ALS patients.
ModelAccuracy (%)Recall (%)F-Score (%)
Gradient Boosting85.0183.5685.98
XGBoost89.9587.4288.21
LDA78.0977.4877.02
kNN82.5282.2182.15
SVM83.9884.0183.79
CNN68.2665.1364.49
LDA-kNN84.7981.0082.95
LDA-SVM-kNN84.2084.9783.99
LDA-SVM-kNN-CNN76.0473.8974.45
W-LDA-SVM-kNN85.3683.9786.00
Table 4. Test results using 4-channel data.
ModelAccuracy (%)Recall (%)F-Score (%)
Testing on healthy subjects
Gradient Boosting97.6596.1197.03
XGBoost99.5399.0599.21
LDA98.3298.1998.19
kNN97.6496.9997.57
SVM98.5698.0598.51
CNN71.2070.9870.55
LDA-kNN99.3398.8098.71
LDA-SVM-kNN98.5297.6997.99
LDA-SVM-kNN-CNN78.0471.8173.77
W-LDA-SVM-kNN98.5297.6997.99
Testing on ALS patients
Gradient Boosting89.9287.4588.59
XGBoost92.5191.8792.09
LDA84.1782.4781.24
kNN87.4687.9285.21
SVM87.5687.0187.34
CNN60.6160.0860.52
LDA-kNN89.3389.1289.17
LDA-SVM-kNN90.0288.9388.88
LDA-SVM-kNN-CNN65.0061.3962.93
W-LDA-SVM-kNN91.3490.0890.73
Table 5. Test results using Pz channel data.
ModelAccuracy (%)Recall (%)F-Score (%)
Testing on healthy subjects
Gradient Boosting90.1789.3289.97
XGBoost91.6891.5192.80
LDA89.1588.9989.06
kNN86.5886.4287.10
SVM87.5187.2187.49
LDA-kNN91.5191.1291.40
LDA-SVM-kNN91.1090.9091.00
W-LDA-SVM-kNN91.2490.9191.17
Testing on ALS patients
Gradient Boosting78.0277.0177.46
XGBoost79.9578.9379.59
LDA73.1572.8973.11
kNN70.5870.5370.05
SVM76.9877.8277.09
LDA-kNN77.8676.9377.37
LDA-SVM-kNN77.9877.3677.42
W-LDA-SVM-kNN78.7478.1578.62
Table 6. Test results accuracy using ALS patients’ data with different channels.
Type of DataLDA-kNNLDA-SVM-kNNLDA-SVM-kNN-CNNW-LDA-SVM-kNN
8-channel data84.79%84.20%76.04%85.36%
4-channel data89.33%90.02%65.00%91.34%
single-channel data77.86%77.98%-78.74%
Publisher’s Note: MDPI stays neutral with regard to jurisdictional claims in published maps and institutional affiliations.

