Article

Applying Machine Learning Models to First Responder Collisions Beside Roads: Insights from “Two Vehicles Hit a Parked Motor Vehicle” Data

1
ADERSIM, School of Administrative Studies, Faculty of Liberal Arts & Professional Studies, York University, Toronto, ON M3J 1P3, Canada
2
Ale-Taha Institute of Higher Education, Tehran 1488836164, Iran
3
Sheridan College Institute of Technology & Advanced Learning, Oakville, ON L6H 2L1, Canada
4
A.U.G. Signals Ltd., Toronto, ON M5H 4E8, Canada
*
Author to whom correspondence should be addressed.
Appl. Sci. 2021, 11(23), 11198; https://doi.org/10.3390/app112311198
Submission received: 15 August 2021 / Revised: 8 November 2021 / Accepted: 22 November 2021 / Published: 25 November 2021
(This article belongs to the Section Transportation and Future Mobility)

Abstract

:
First responders including firefighters, paramedics, and police officers are among the first to respond to vehicle collisions on roads and highways. Police officers conduct regular roadside Please check if the country name is correct traffic controls and checks on urban and rural roads, and highways. Once first responders begin such operations, they are vulnerable to motor vehicle collisions by oncoming traffic, a circumstance that calls for a better understanding of contributing factors and the extent to which they affect tragic outcomes. In light of factors identified in the literature, this paper applies machine learning methods including decision tree and random forest to a subset of the National Collision Database (NCDB) of Canada that includes information on collisions between two vehicles (one in parked position) and the severity of these collisions as measured by having or not having injuries. Findings reveal that key measurable, predictable, and sensible factors such as time, location, and weather conditions, as well as the interconnections among them, can explain the severity of collisions that may happen between motor vehicles and first responders who are working alongside the roads. Analysis from longitudinal data is rich and the use of automated methods can be used to predict and assess the risk and vulnerability of first responders while responding to or operating on different roads and conditions.

1. Introduction

At the scene of a traffic emergency, the first responders including police officers, firefighters, rescuers, paramedics, and emergency medical technicians are the trained personnel who are among the first to arrive and provide assistance. Depending on the emergency circumstances, there are numerous risks that first responders may face during their response and operations. High speeds, reckless drivers, busy roads, and constant multi-faceted distractions create situations where the first responders may be at risk of being struck by vehicles while working on the side of the roads. Being struck by a vehicle represents the second-largest hazard to police officers’ lives, which is a considerable risk [1,2,3,4]. Furthermore, there are several responsibilities that each officer performs during a shift, which increases their exposure to collisions. For example, these duties include investigating vehicle crashes, assisting motorists, deploying/providing equipment, overseeing work zones, patrolling, performing traffic control, performing a traffic stop, and training [2].
Past and recent data can provide some insights into these risks. Between 1998 and 2008, 141 police officer deaths resulted from officers being struck by a vehicle [3]. From 2013 to 2017, in the USA, 238 officer deaths were classified under accidental circumstances, 40 of those were pedestrian officers who were struck by a vehicle [2]. Fourteen of the 40 officers were recorded as wearing high visibility clothing, 21 were not wearing high visibility clothing [2]. The lighting conditions were dark for 8 out of the 21 victim officers who were not wearing high visibility clothing [2].
The US fire administration recorded 1470 total deaths for firefighters between 1996–2010 [5], out of which 70 deaths were due to the firefighters being struck by a vehicle. In 2017, 18 firefighters died in vehicle-related incidents and 10 of them were struck by vehicles [6]. In 2018, 3 of 16 firefighters died of being struck by vehicles [6].
Although the likelihood of being struck by a vehicle is low, the consequences are potentially fatal, given the speed and weight of approaching vehicles. Reducing these risks through technology development, procedural changes, training, and education require a better understanding of the underlying causes of such incidents. While police officers’ data have been researched and reported much more in comparison to firefighters and emergency medical services data, lack of data and gaps in the literature suggest that research on emergency responders’ collisions when on duty is still underexplored. Reducing roadside collision risks requires new technologies, practices, and training. By reviewing the existing literature and employing machine learning methods to five years of data on collisions, this paper aims to identify the factors that influence collisions between vehicles and first responders, particularly those who are working on roadsides.
The paper is organized as follows. Section two provides a literature review on the parameters that have been identified as relevant to road collisions involving first responders. Section three presents the methodology and data. Statistical analysis on the National Collision Database (NCDB) of Canada, as well as the implementation of machine learning (ML) algorithms on the data, are described and discussed in section four. Section five concludes the paper, acknowledging limitations and proposing future directions in light of the findings.

2. Background

2.1. Factors Influencing Road Traffic Collisions

Many factors affect road traffic collisions. Understanding how much each factor contributes to collisions is an important area in road safety research. A thorough understanding of such factors is key to laying out the theoretical landscape in which collision data have been collected and analyzed. Such a review not only elicits the multidimensional nature of such factors and the extent to which those dimensions intersect, it also reveals the descriptive nature of past studies, which are mainly focused on statistical correlations.
Often, driver behavior, vehicle design, and conditions, as well as road conditions are among the main factors influencing road safety [7]. Statistical analysis shows that speed and age along with gender are the major factors of accidents on rural areas, while drivers’ age and gender, running speed, road conditions, lighting conditions are found to be the main factors of collisions on urban roads [8]. Using a combined GIS-empirical Bayesian approach, reference [9] showed the relationship between collisions and traffic density, road width, the density of intersections per segment, flow direction, and land use in the urban context. A field data analysis using a logistic regression model shows that speed, pedestrian age, vertical height from the ground level to the front/top transition point, along with the vehicle’s centerline and the average height of the top and bottom of the bumper are statistically significant predictors in the injury risks of vehicle-to-pedestrian frontal crashes [10]. Based on the literature, influencing factors can be divided into four main categories including: (a) road characteristics; (b) vehicle characteristics; (c) driver characteristics; and (d) environmental attributes (Table 1).
The probability and severity of collision vary in different road types. For example, in 2004 in the province of Ontario, Canada, collisions occurring on 400 series highways represent 14% ($2 billion) of social costs, 12% of fatalities, and 11% of all collisions [11]. Lane width, flow per lane, curving parameters, vertical curves, super elevation, transition curves, avoiding surprises and confusion in road design and traffic signs, etc., are the factors included in the design stage of road construction and in determining the speed limits. Speed is known as an important factor in the severity of collisions [8]. The road surface can be dry, wet, snowy, or icy depending on the weather conditions. This factor is reported to be important and examined by a significant number of studies [12,13,14,15,16]. Road configuration and high-risk (critical) segments include intersection, non-intersection, type of intersections, tunnel inlet/outlet, near bridges, and culverts, which are reported to be important [12]. Any restriction on visibility such as sharp turns and blind corners, or lanes covered with shrubs and trees may lead to a collision. Other potential threats include billboards located near streets [17,18,19], reaction to control devices such as yield signs, warning signs, traffic signals, stop signs [20], the presence of surveillance cameras [13], lighting conditions [14,20,21], as well as vehicle types and conditions [22]. Individual and demographic factors such as drivers’ age [12,13,20,23], sensory-perceptual deficits could affect driving performance even in the absence of overt disease [23], as well as gender and race [12,13,16,20]. Furthermore, environmental factors such as weather conditions and temporal characteristics in accident analysis [14,16,21] have been revealed in previous investigations. Weather conditions are usually categorized as snowy, sunny, foggy, rainy, stormy, and heavy rain [14,16,21]. Studies such as [16] and [20] showed that time of day had a significant effect on the injury risk of emergency vehicle occupants. The month of a year has also been revealed as an important parameter affecting the number of collisions [15,24].
In sum, the above risk factors have been found to have mixed effects on road collisions. As mentioned, studies are mainly descriptive and often do not account for mixed effects and relationships across parameters, which can help to analyze, model, predict, reduce the impact on and control road safety. Such a gap could be potentially tackled by robust model capabilities such as the machine learning methods proposed in this paper and add insight to the realm of existing factors. Practitioners could be better equipped to prevent collisions, thereby reducing the number of injuries and fatalities.

2.2. First Responder’s Collisions

In first responder’s collision literature, focus has been directed on emergency workers/first responders who are on foot performing their duty. Some duties include roadside pullovers, check stops, traffic control, etc. For factors in the environmental category, the discussion is centered around reduced visibility which includes nighttime driving and poor weather conditions. When there is reduced visibility, risk increases for first responders. Visibility influences reaction and response time or the time in which a driver can stop. Stopping times can vary after a driver first sees a pedestrian first responder working on the side of the roads. Night-time driving data are significant to understand because oncoming traffic/drivers must react quickly when their field of vision is reduced or compromised by oncoming vehicle headlights. Collisions during night-time driving are considerably higher than collisions during the daytime and factors such as a lighter pavement are expected to decrease headlight illumination distance and worsen visibility [25]. In a study conducted by the National Highway Traffic Safety Administration, it was found that high beam headlights are better than low beam headlights to detect pedestrians; however, there is little time to respond to moving pedestrians [26]. The limitations experienced at night are made worse when large vehicles are driven as bigger and higher vehicle hoods reduce the visibility of the driver [21]. Poor weather conditions compound these factors and reduce visibility. Drivers may not be in control of vehicles when road conditions are poor and weather such as icy roads, snow-covered roads, and heavy rain can prevent individuals from reacting quicker [5].
For the road characteristic category, reducing collisions can be achieved through safety instruments and protocols. An important protocol is the use of Traffic Control Zones (TCZ). A TCZ protects responders and maintains the flow of traffic [5]. In most cases of pedestrian workers being struck by vehicles, the TCZ was not adequately established or appropriately positioned [5]. To ensure that a TCZ is set up, there is a need for channeling devices such as signs, barricades, cones, and control vehicles, all of which are intended to assist in warning oncoming drivers of a potential threat or situation that is occurring. Without such devices, the roadside workers may be left vulnerable. In any case, road workers need to be expedient when responding to an incident. An example of this would be a police officer pulling over a driver. Police officers in this situation typically do not have the time to set up a full TCZ, and rely on their police vehicle emergency lights and siren. The sirens act as a device to signal to oncoming traffic that there is a ongoing situation and that they should be aware. Moreover, officers’ protocol is to use their vehicles as a barrier that gives them room to work.
For the driver characteristic category, reckless driving and driving under the influence are contributing factors that increase risks to pedestrian first responders. Research has consistently identified that driving under the influence of drugs and alcohol reduces the ability of drivers to make quick decisions, decreases the ability to track moving targets, and worsens the driver’s ability to perform two tasks at the same time (distracted attention) [27]. Driving under the influence is a significant factor when vehicles strike a pedestrian or car. In addition to basic skills, knowledge of road conditions, traffic volume, time of day are all considerations. Higher usage of cell phones and other distracting devices compromise drivers’ focus, which leads to more accidents and collisions [5].
Besides the common factors influencing the collisions, three other parameters can be highlighted in vehicles striking pedestrian road workers: (1) situational awareness for pedestrian first responders; (2) unmarked vehicles and unmarked first responders; and (3) lack of discretion by first responders. Situational awareness refers to having the knowledge and recognition of the situation and various factors which may influence the situation. In addition, referencing distracting devices, the associated risk for first responders is multitasking while in dangerous situations. Communicating with other responders, managers, and dispatchers presents a threat, as such distraction may lead to mistakes or inattention. For example, in cases of pedestrian police officers, they may communicate via radio or other devices which can distract them from fully focusing on their surroundings [21].
Lastly, pedestrian first responders are individual agents who may lack understanding of imperative elements when setting up the TCZ on the sides of roads and may be unaware of oncoming traffic. If pedestrian first responders fail to take into consideration the roadside risks, they may be vulnerable to oncoming traffic. Some factors which exacerbate risk include lack of training and inexperience [5]. In addition, pedestrian first responders who have worked alongside roads throughout their career may become complacent and develop a sense of invincibility [28]. This sense of invincibility may lead to risk-taking actions, less diligence, or shortcuts, all of which produce poor habits and contribute to complacency and a lack of awareness in high-risk situations. [5].
It is worth noting that while research has been extensive in identifying factors associated with collisions, dedicated efforts to examine particularities associated with first responders are still scarce. Moreover, the variety of relevant factors and the extent to which they can be combined adds complexity to a phenomenon of study that is both specific and scantly explored. Such a gap invites new approaches to this research agenda, including machine learning models employed in this paper being a potential avenue.

3. Materials and Methods

As previous research suggests, many factors are known to influence the risk of collision on the roads that may involve first responders. To the best of the author’s knowledge, there is no specific dataset that includes the factors affecting the collision of first responders. Therefore, one method of employment is using the collision datasets that resemble first responders’ collisions which will improve. Pedestrian first responders often park their vehicle near their work area along the road and walk or stay around the target vehicle or mission scene. Investigating the available online videos of collisions with first responders shows that the majority of collisions occur when vehicles are parked on the road. Therefore, the causes of collisions with parked vehicles can be similar to the probable collisions with the first responders.

3.1. Data

For this study, the National Collision Database (NCDB) of Canada is used to investigate the collisions involving first responders in the absence of a dedicated database. This database contains all police-reported motor vehicle collisions on public roads throughout Canada. The database includes selected variables (data features) related to fatal and injury collisions for 1999 to 2017 [29] that comprise a total of 6,772,563 records. There are three categories of data describing the collision-related parameters: (1) collision-level data; (2) vehicle-level data; and (3) person-level data. Table 2 shows the available 22 factors of the dataset. It should be noted that in this dataset there is no specific record that shows that the accidents involve first responders. However, a type of collision configuration that is “two vehicles hit a parked motor vehicle” may have the most relevant nature to the focus of the study. Although collisions that involve first responders only may have slightly different patterns, it is expected that these collisions of interest are within this large dataset. Collisions with parked vehicles comprise 30,255 records, out of which 6399 extend over a 5 years period, from 2013 to 2017. We use the latest 5 years to avoid possible long-term changes that may impact the frequency and nature of road collisions.

3.2. Methodology and Algorithms

To perform analytics on the available data, two approaches were employed: (1) statistical analysis; and (2) machine learning method. In the statistical analysis, variation of the number of collisions versus different classes were investigated. The underlying relationships, causes, patterns, and trends from the data were described and compared with other studies. While we only used the last 5 years of the data, a comparison with the whole dataset was performed to find any differences in patterns of the selected dataset. In the machine learning approach, the relative importance and correlation between the factors in the dataset are evaluated.
Different machine learning modeling approaches could be used to investigate the effects of previously mentioned factors of collisions. Regression models [30,31] and classification models [32,33,34]) were two common methods to analyze accident parameters. Classification models use data-mining approaches while the regression models assume a specific functional form to model the relationships between dependent and independent variables [34]. Classification models are independent of the assumption and focus on the state of data. Many classification models such as logistic regression, k-nearest neighbors (k-NN), Gaussian naive Bayes (GNB), support vector machines (SVM), etc. have been developed. In this study, the Auto-Sklearn (ver. 0.14.0) [35], one of the robust new Automated Machine Learning (AutoML) libraries, is used to select the best-tuned classification model. Auto-Sklearn library enables the user to automatically build and deploy advanced classification machine learning models to derive insight from the data.
To implement the Auto-Sklearn method, the “medical treatment required” (code “P_ISEV”) factor (Table 2), which represents the severity of a collision, was selected. This factor uses three classes of no-injury, injury, or fatality of people at the accident scene. Understanding the factor of required medical treatment as a function of the other 21 factors (criteria) could serve as a good predictor for the severity of a collision. The factors that lead to injury and fatality classes are important to consider for reducing the severity of collisions while the influencing factors on the no-injury class can be important for designing the collision avoidance warning systems to reduce false alarms. Factors that showed relative dependency with other factors, as well as those data columns that were not contributing to the collisions (e.g., P_ID, V_ID, C_YEAR, V_YEAR, C_CONF, and C_SEV) were eliminated from the analysis. Thus, the problem was simplified to find the dependency of the factor P_ISEV on the other 16 remaining factors. Before using the machine learning model, some steps were performed to prepare the data. Since the original data were imbalanced, downsampling the majority class of the original dataset to match the minority class was employed to balance the dataset. The min-max normalization technique was applied to rescale the data and make all of them consistent. Classification needed a two-step process: the learning step and the prediction step. The dataset was divided into 70% for training and 30% for testing and passed to the Auto-Sklearn classification model. This model was run for different total and single run time limits up to 24 h and 30 min, respectively. Table 3 exhibits the performance of 8 classifiers and corresponding metrics for the fastest models (outcome of total and single run time limits up to 120 and 30 s, respectively). Because the balanced dataset was used for the analysis, the accuracy metric could be used to evaluate the preferred classifier. For all examined models, the maximum test score and balanced accuracy were 0.67 and for the top 82 classifiers, these values remain above 0.6.
Among the top high score classifier, two models of Decision Tree (DT) and Random Forest (RF) were used to find the dependency of the influencing factors of the collision with the first responders. These models are intuitive and interpretable which priories them when they have acceptable accuracy for the highly regulated domains [36]. In the DT, a model that predicts the value of a target variable is developed. It presents the rules that are inferred from the data criteria (or features in machine learning terminology). DT was used here to indicate the rules connecting the factors to the dependent variable. The RF is a supervised learning algorithm that determines the importance of factors in a dataset. It was employed to highlight the most important collision factors and rank their relative importance in the collision severity. To obtain the performance in the range of high-ranked classifiers in the Auto-Sklearn process, a grid-search algorithm was applied to the dataset to tune the hyperparameters of each classification model. By using the k-fold cross-validation and grid-search methods, the best models and tuning conditions for their hyperparameters were found.
All the machine learning models and processes were implemented in the Python environment using the Scikit-Learn library. The code is accessible on https://github.com/mtofighi/RoadsideCollisions (Open accessed on 18 October 2021).

4. Result and Discussion

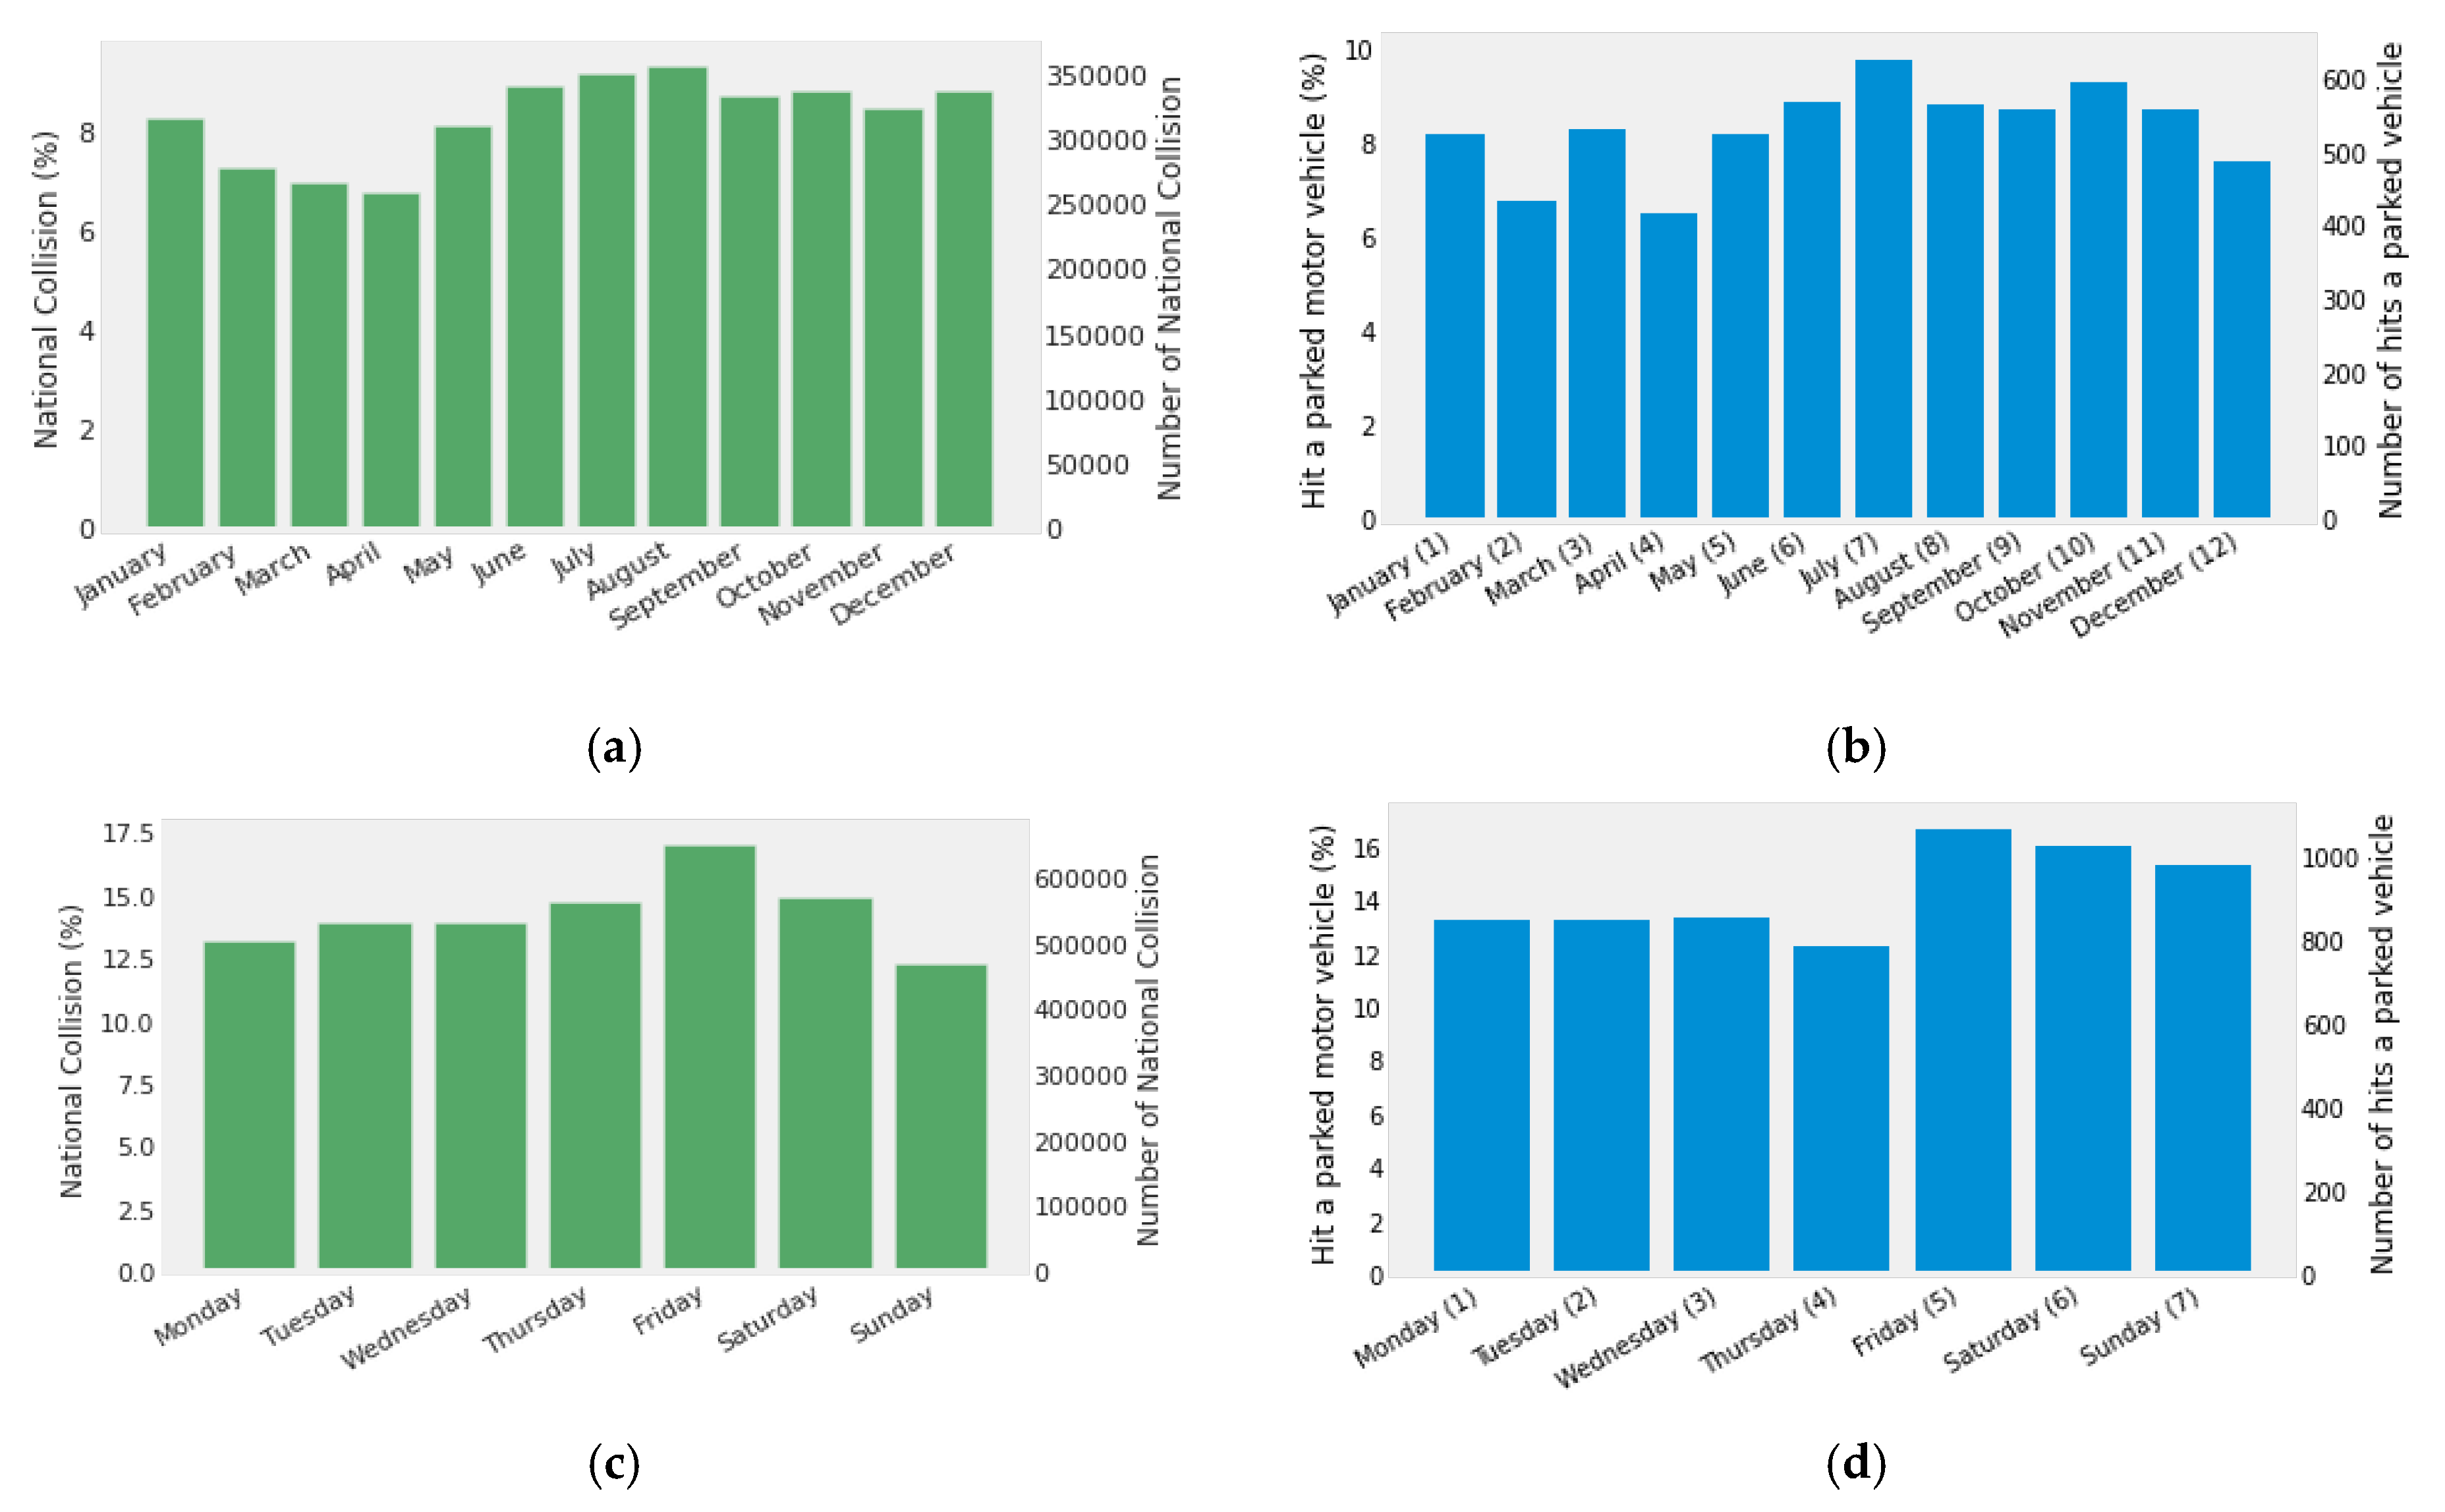
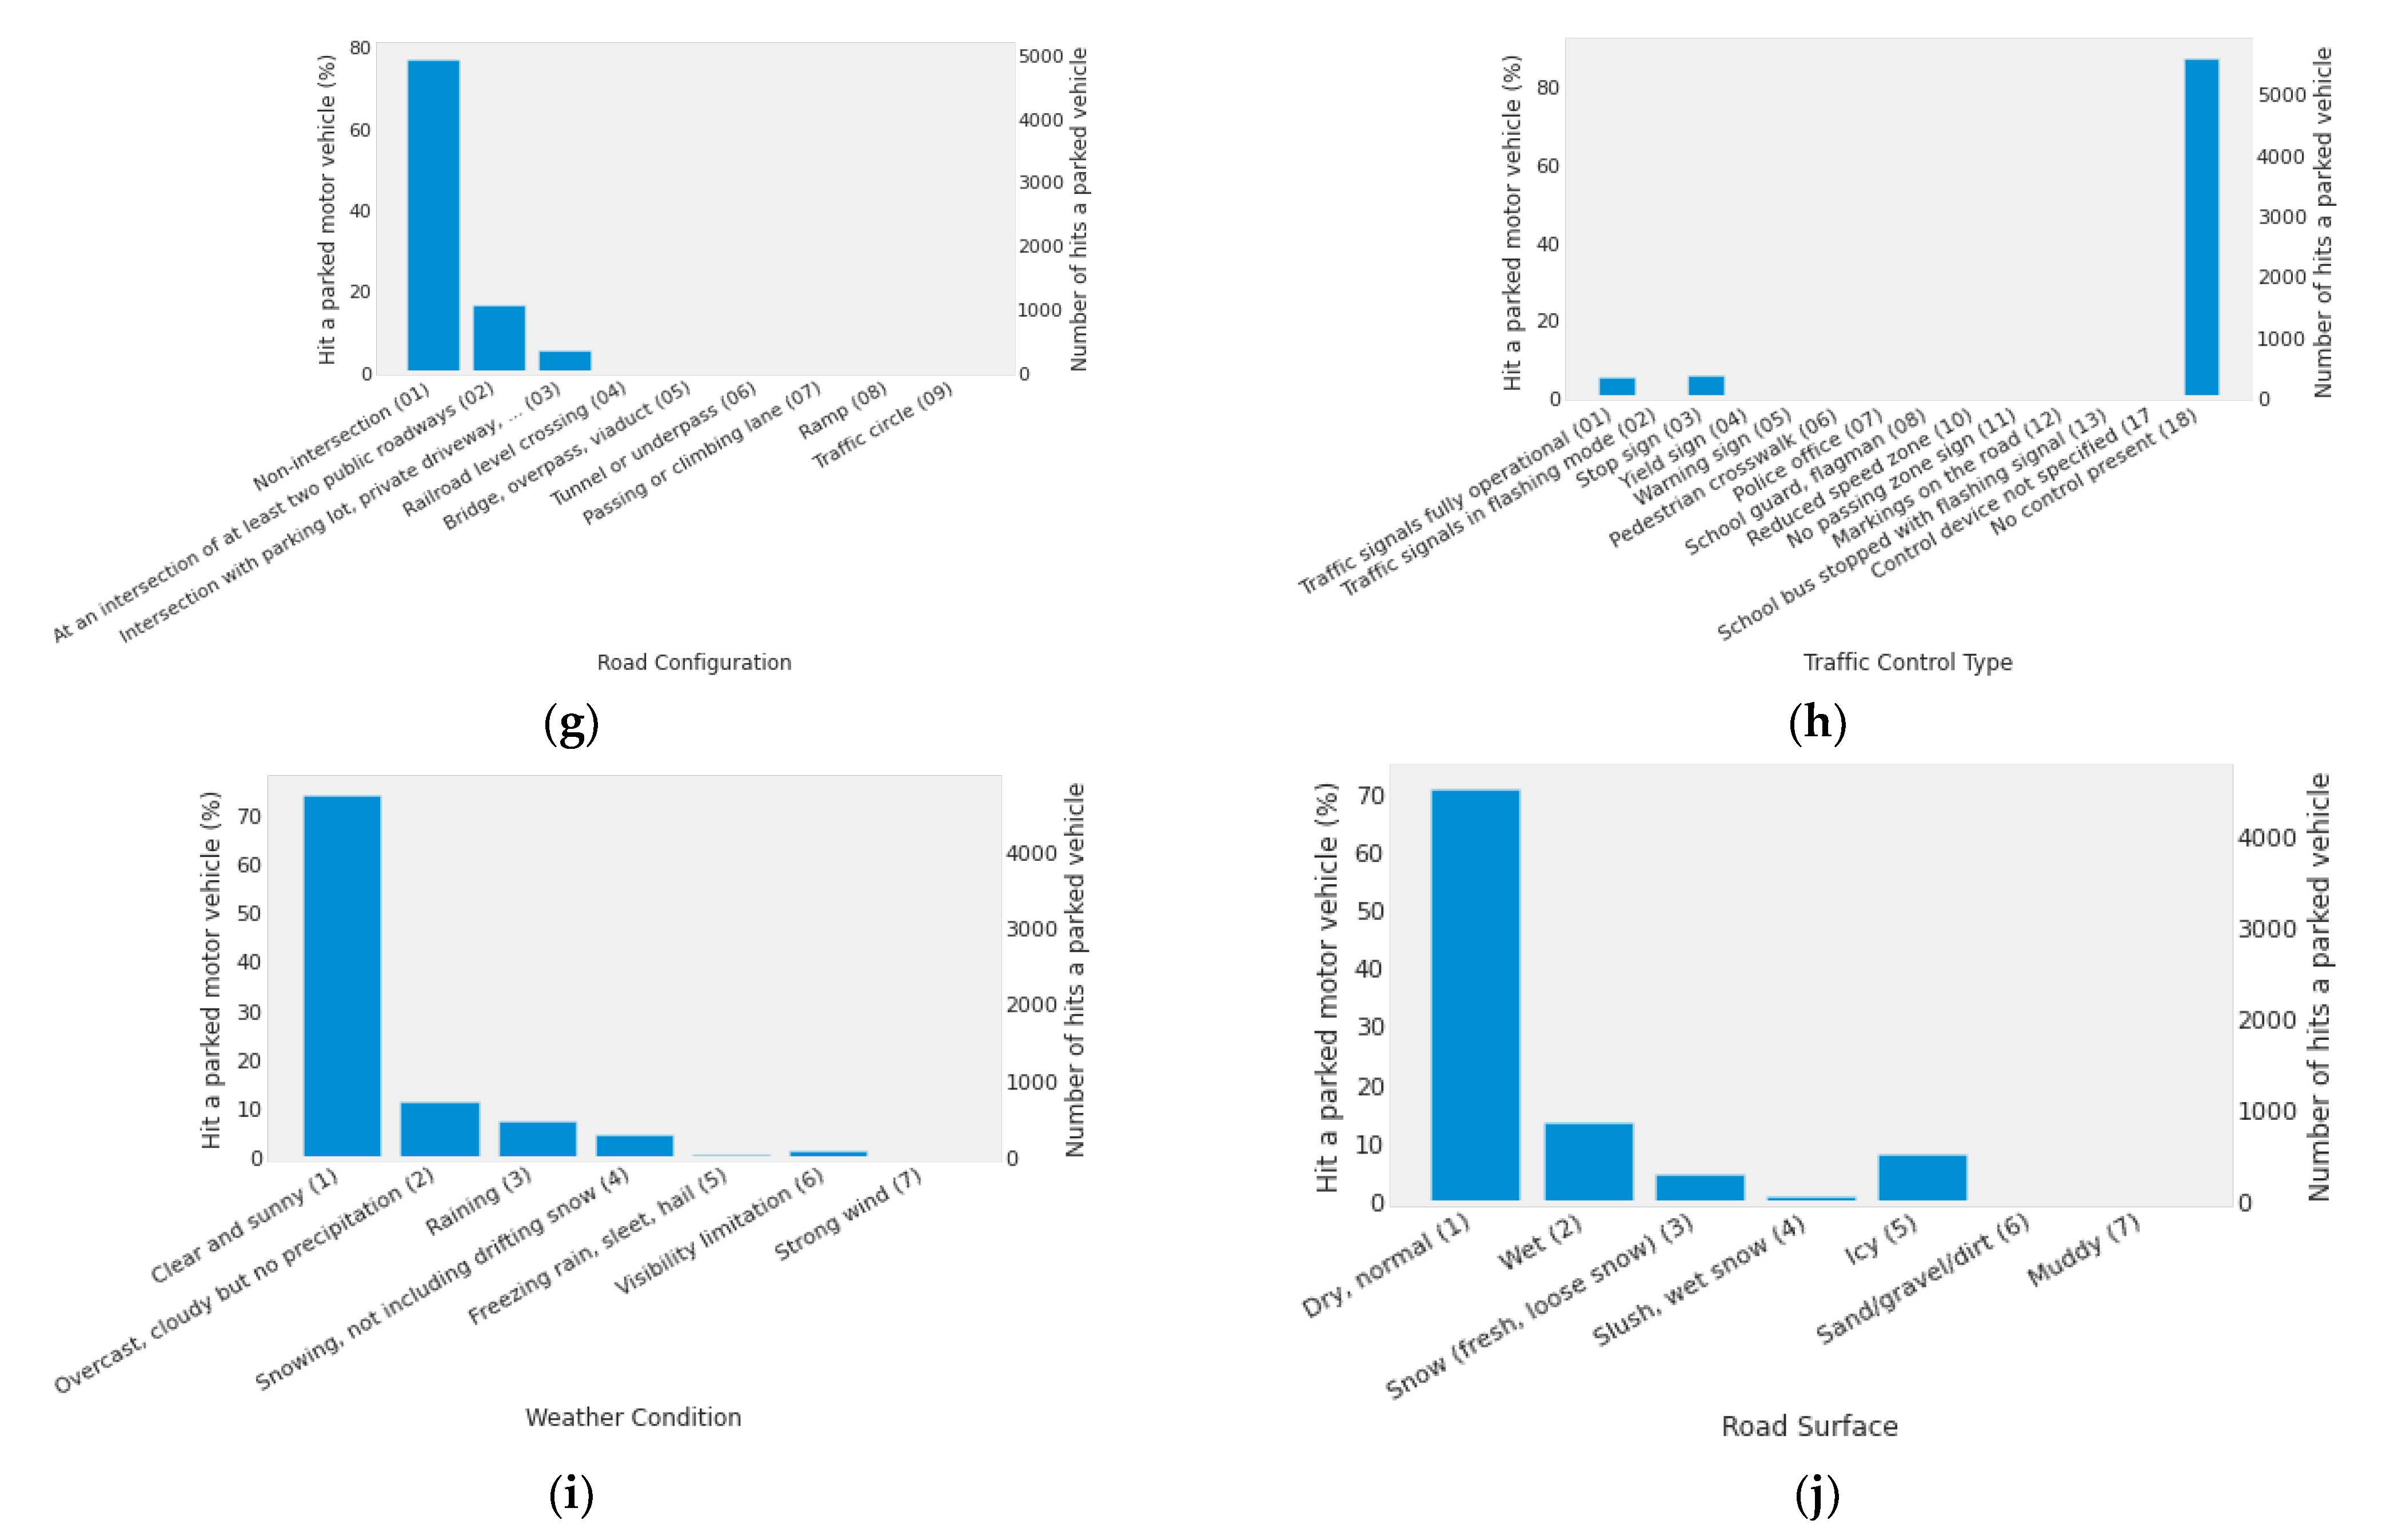
4.1. Findings on Established Factors in Roadside Collision Research

Figure 1 and Figure 2 show the distribution of cleaned NCDB of Canada versus different factors available in the dataset. Figure 1, provides a visual comparison of distributions among all cleaned datasets and collisions between two vehicles when one hits a parked motor vehicle. The pattern of distribution of data is almost similar in both the whole and the subset dataset. Figure 1a,b show an increase in the number of collisions-or risk of collision-in high travel seasons, such as the summer and holidays. Similarly, Fridays and Saturdays have higher rates and probability of collisions (Figure 1c,d). This is highlighted for the collisions with a parked motor vehicle. The peak collision hour in the morning is around 8:00 am and in the afternoon is between 15:00 to 17:00 (Figure 1e,f). These findings appear to explain some of the seasonal and time-specific effects that were observed in the previous studies such as those identified by [15,24].
Although the traffic hours vary widely from location to location, it can be observed that the number of collisions during rush hours is higher. The higher rate of collisions with a parked vehicle at night time compared to other types of collisions may show the importance of visibility in this type of collision. Figure 2a shows the contribution of the age of vehicles in collisions. The normalized standard deviation of the number of collisions for all vehicles is about 1.0. However, the same metric for those vehicles under 15 years old is 0.14. This illustrates that there is no significant difference between the number of collisions when vehicles are under 15 years old. Comparing this finding with the total annual number of new motor vehicles sold in Canada [37] shows that the rate of accidents involving new vehicles is lower than the old ones. This may reflect the improved safety standards and regulations, as well as increased usage of advanced collision avoidance systems (i.e., automatic emergency braking, traction, and electronic stability controls, etc.). The combination of safety measures and guidelines [20] with new detection technology appears to be effective in reducing accidents and may shed light on the extent to which commonly identified factors or predictors of collisions in the previous research remains relevant. Circumstantial conditions such as lightning and road infrastructure [8], vehicle design, and safety specifics [7,10] are examples of predictors that deserve further analysis.
Demographic factors, such as gender and driver’s age, also appear to be relevant, as predicted by the literature [8,16]. Men, for instance, are recorded in collisions about 1.2 times more than women (Figure 2b). This may be the result of risky driving practices such as not using safety belts, driving while impaired by alcohol, and speeding as specified in other studies [38]. Most of the people who are vulnerable to accidents are between 16 to 26 years old while two-thirds of them are drivers (Figure 2c,e). Figure 2d shows that using a safety device alone cannot reduce collision severity. However, no collision has been reported for motorcyclists, bicyclists, snowmobilers, all-terrain vehicle riders, and pedestrians who have used reflective clothing and/or helmets, a finding that endorses the role that visual measures play in inefficiently sharing information across agents who are interacting in the same ecosystem [20]. Practitioners should consider those measures as relatively inexpensive ways of improving road safety outcomes.
People’s positioning inside the vehicle also appears to play a role, with the first rows of vehicle seats having more injured individuals or fatalities (Figure 2e). Drivers and people who are seated in the front row, and right outboard, are the most vulnerable in these types of collision. More collisions happen in the straight roads, which are the major type of the existing roads (Figure 2f). It can be expected that better visibility in this type of road can reduce the probability of collision. However, the recorded collisions may be due to an unexpected situation that drivers face with a parked vehicle in this type of road alignment. Also, more accidents occur in the non-intersection road configurations (Figure 2g). This is due to the higher speed on these roads. Collisions with parked vehicles in an intersection with parking lot entrance/exit, private driveway, or laneway are about 7% of all incidents. It can be inferred that the surprise and confusion due to an unexpected parked vehicle on a road is an important contributing factor to collision occurrence. Figure 2h shows that most of the collisions happen where there is no traffic control sign. This may be due to the speed control when a traffic sign is available. Ignoring traffic signals such as stop signs plays an important role in collisions, which aligns with the findings of the previous studies [20].
Weather conditions play a significant role, particularly because it affects the rate of traffic. As research suggests, it is expected that when the weather is clear and sunny, more vehicles are available on roads and the probability of collisions is higher [14,16,21]. However, as findings suggest, other weather conditions (e.g., overcast, cloudy, raining, snowing, freezing rain, sleet, hail, visibility limitation) have significant effects on road collisions (Figure 2i). The same pattern has been identified for road surface and weather conditions. For example, on a clear and sunny day, the road surface is dry and the number of collisions is higher, whereas more collisions occur when the road surface is wet (rain, snow, slush, icy) (Figure 2j).

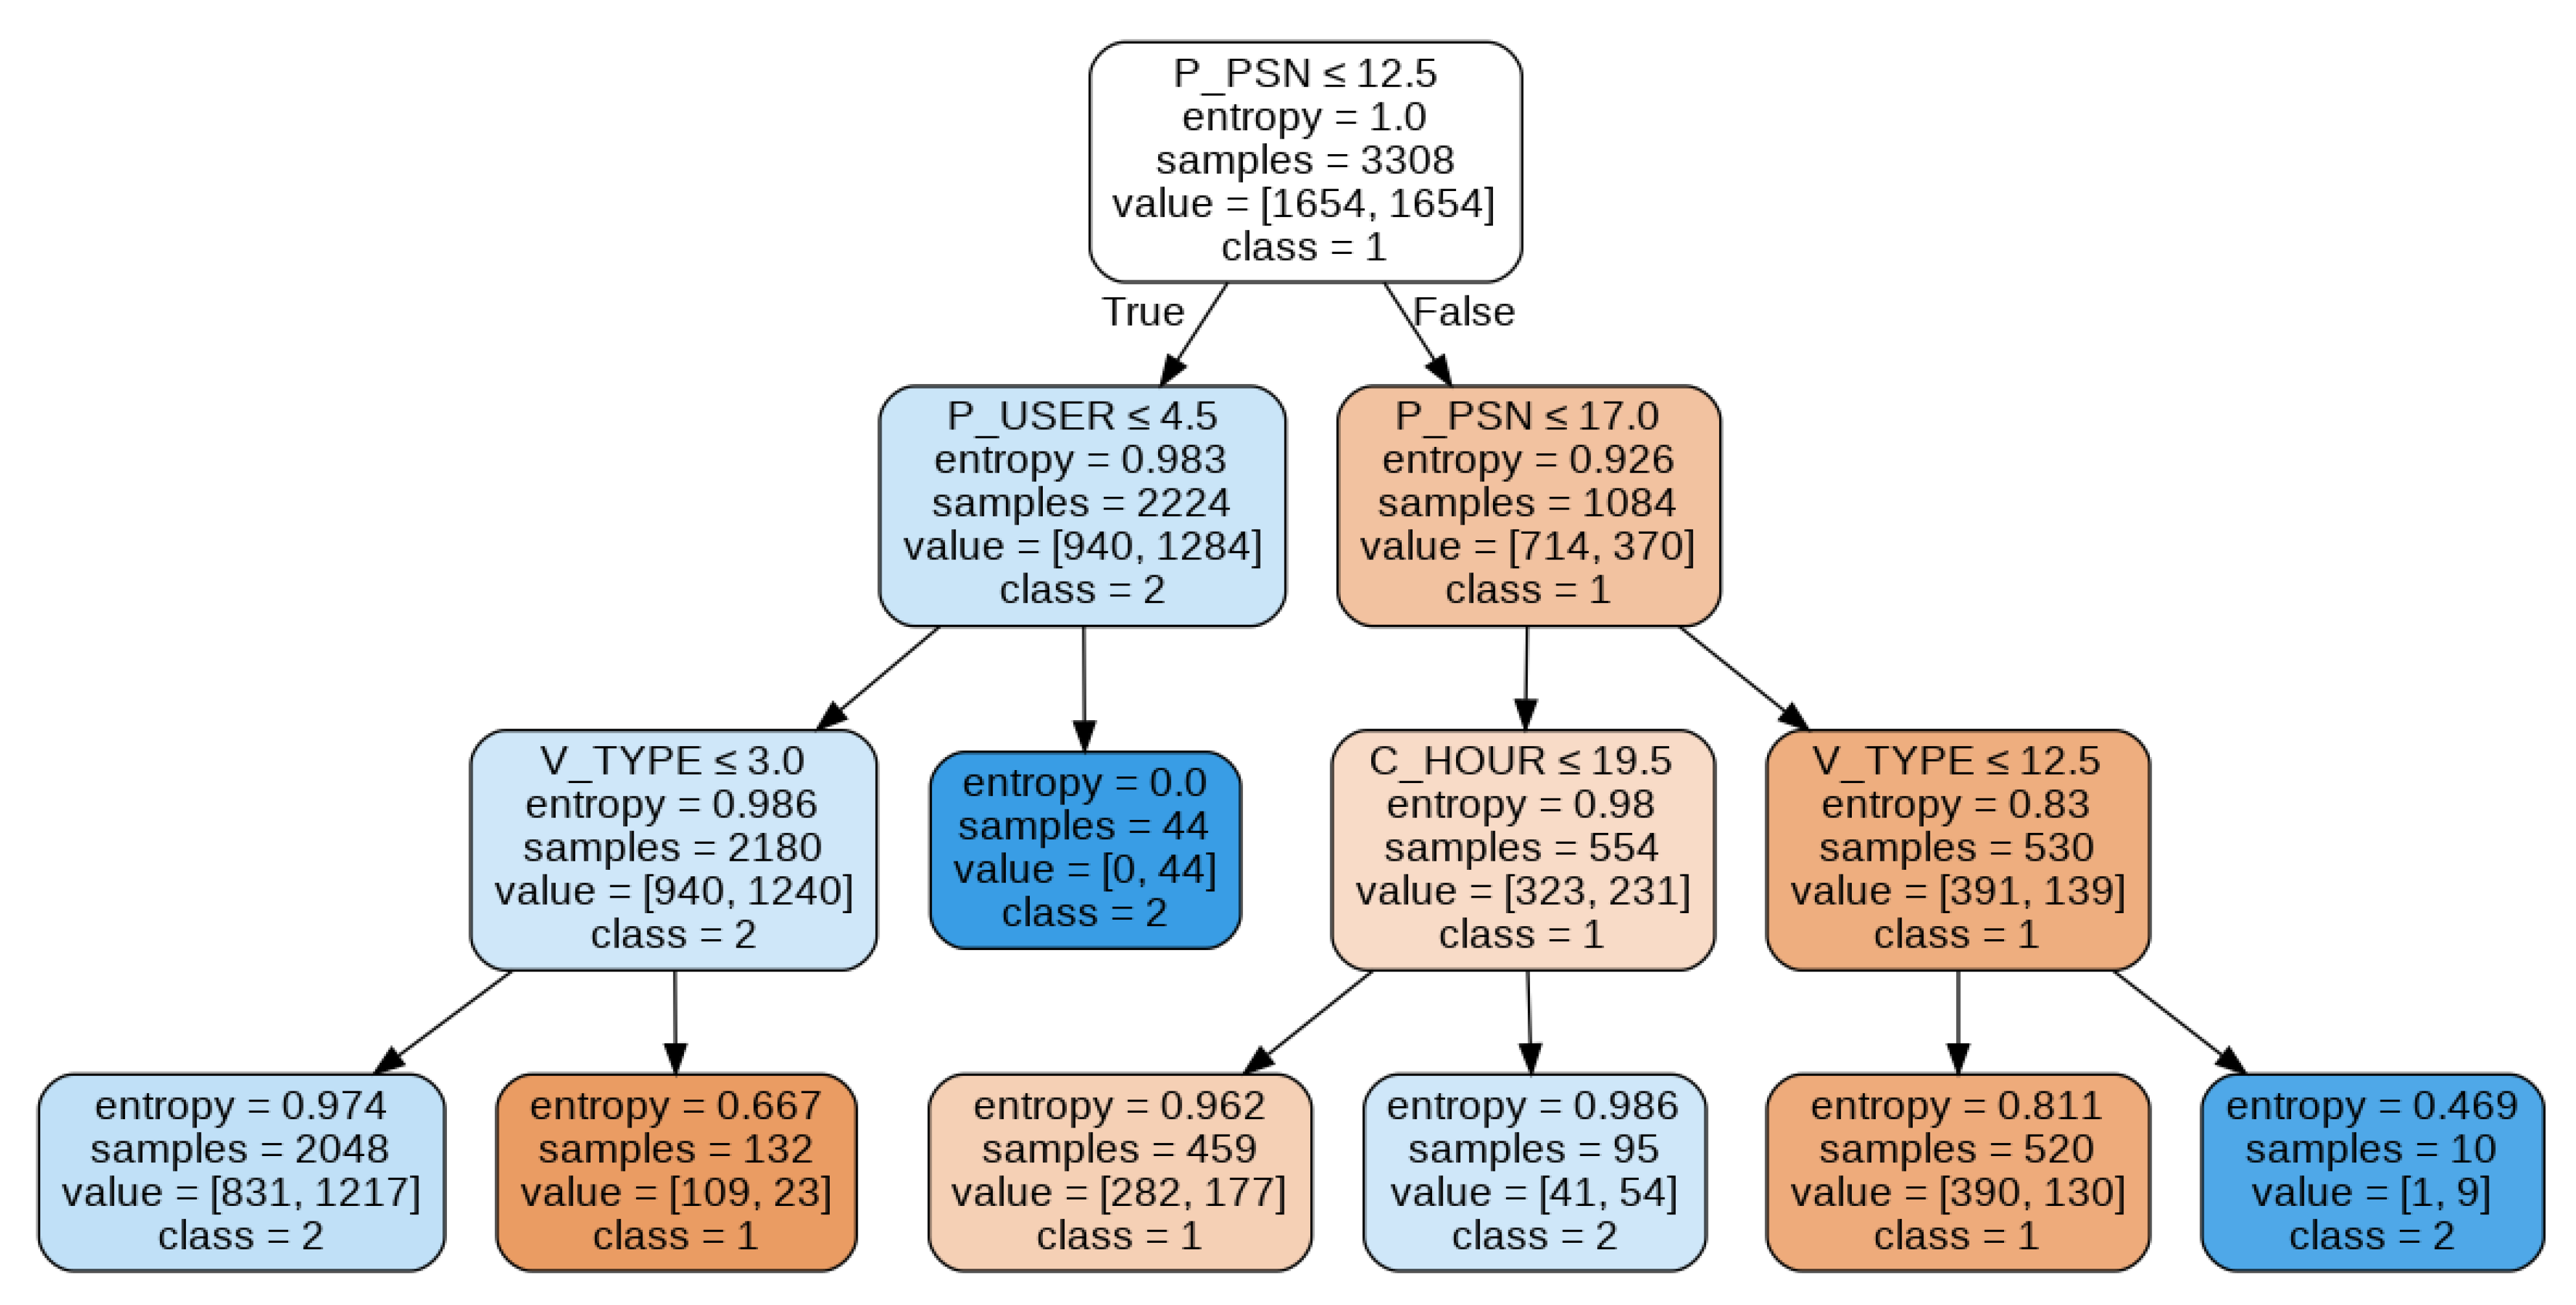
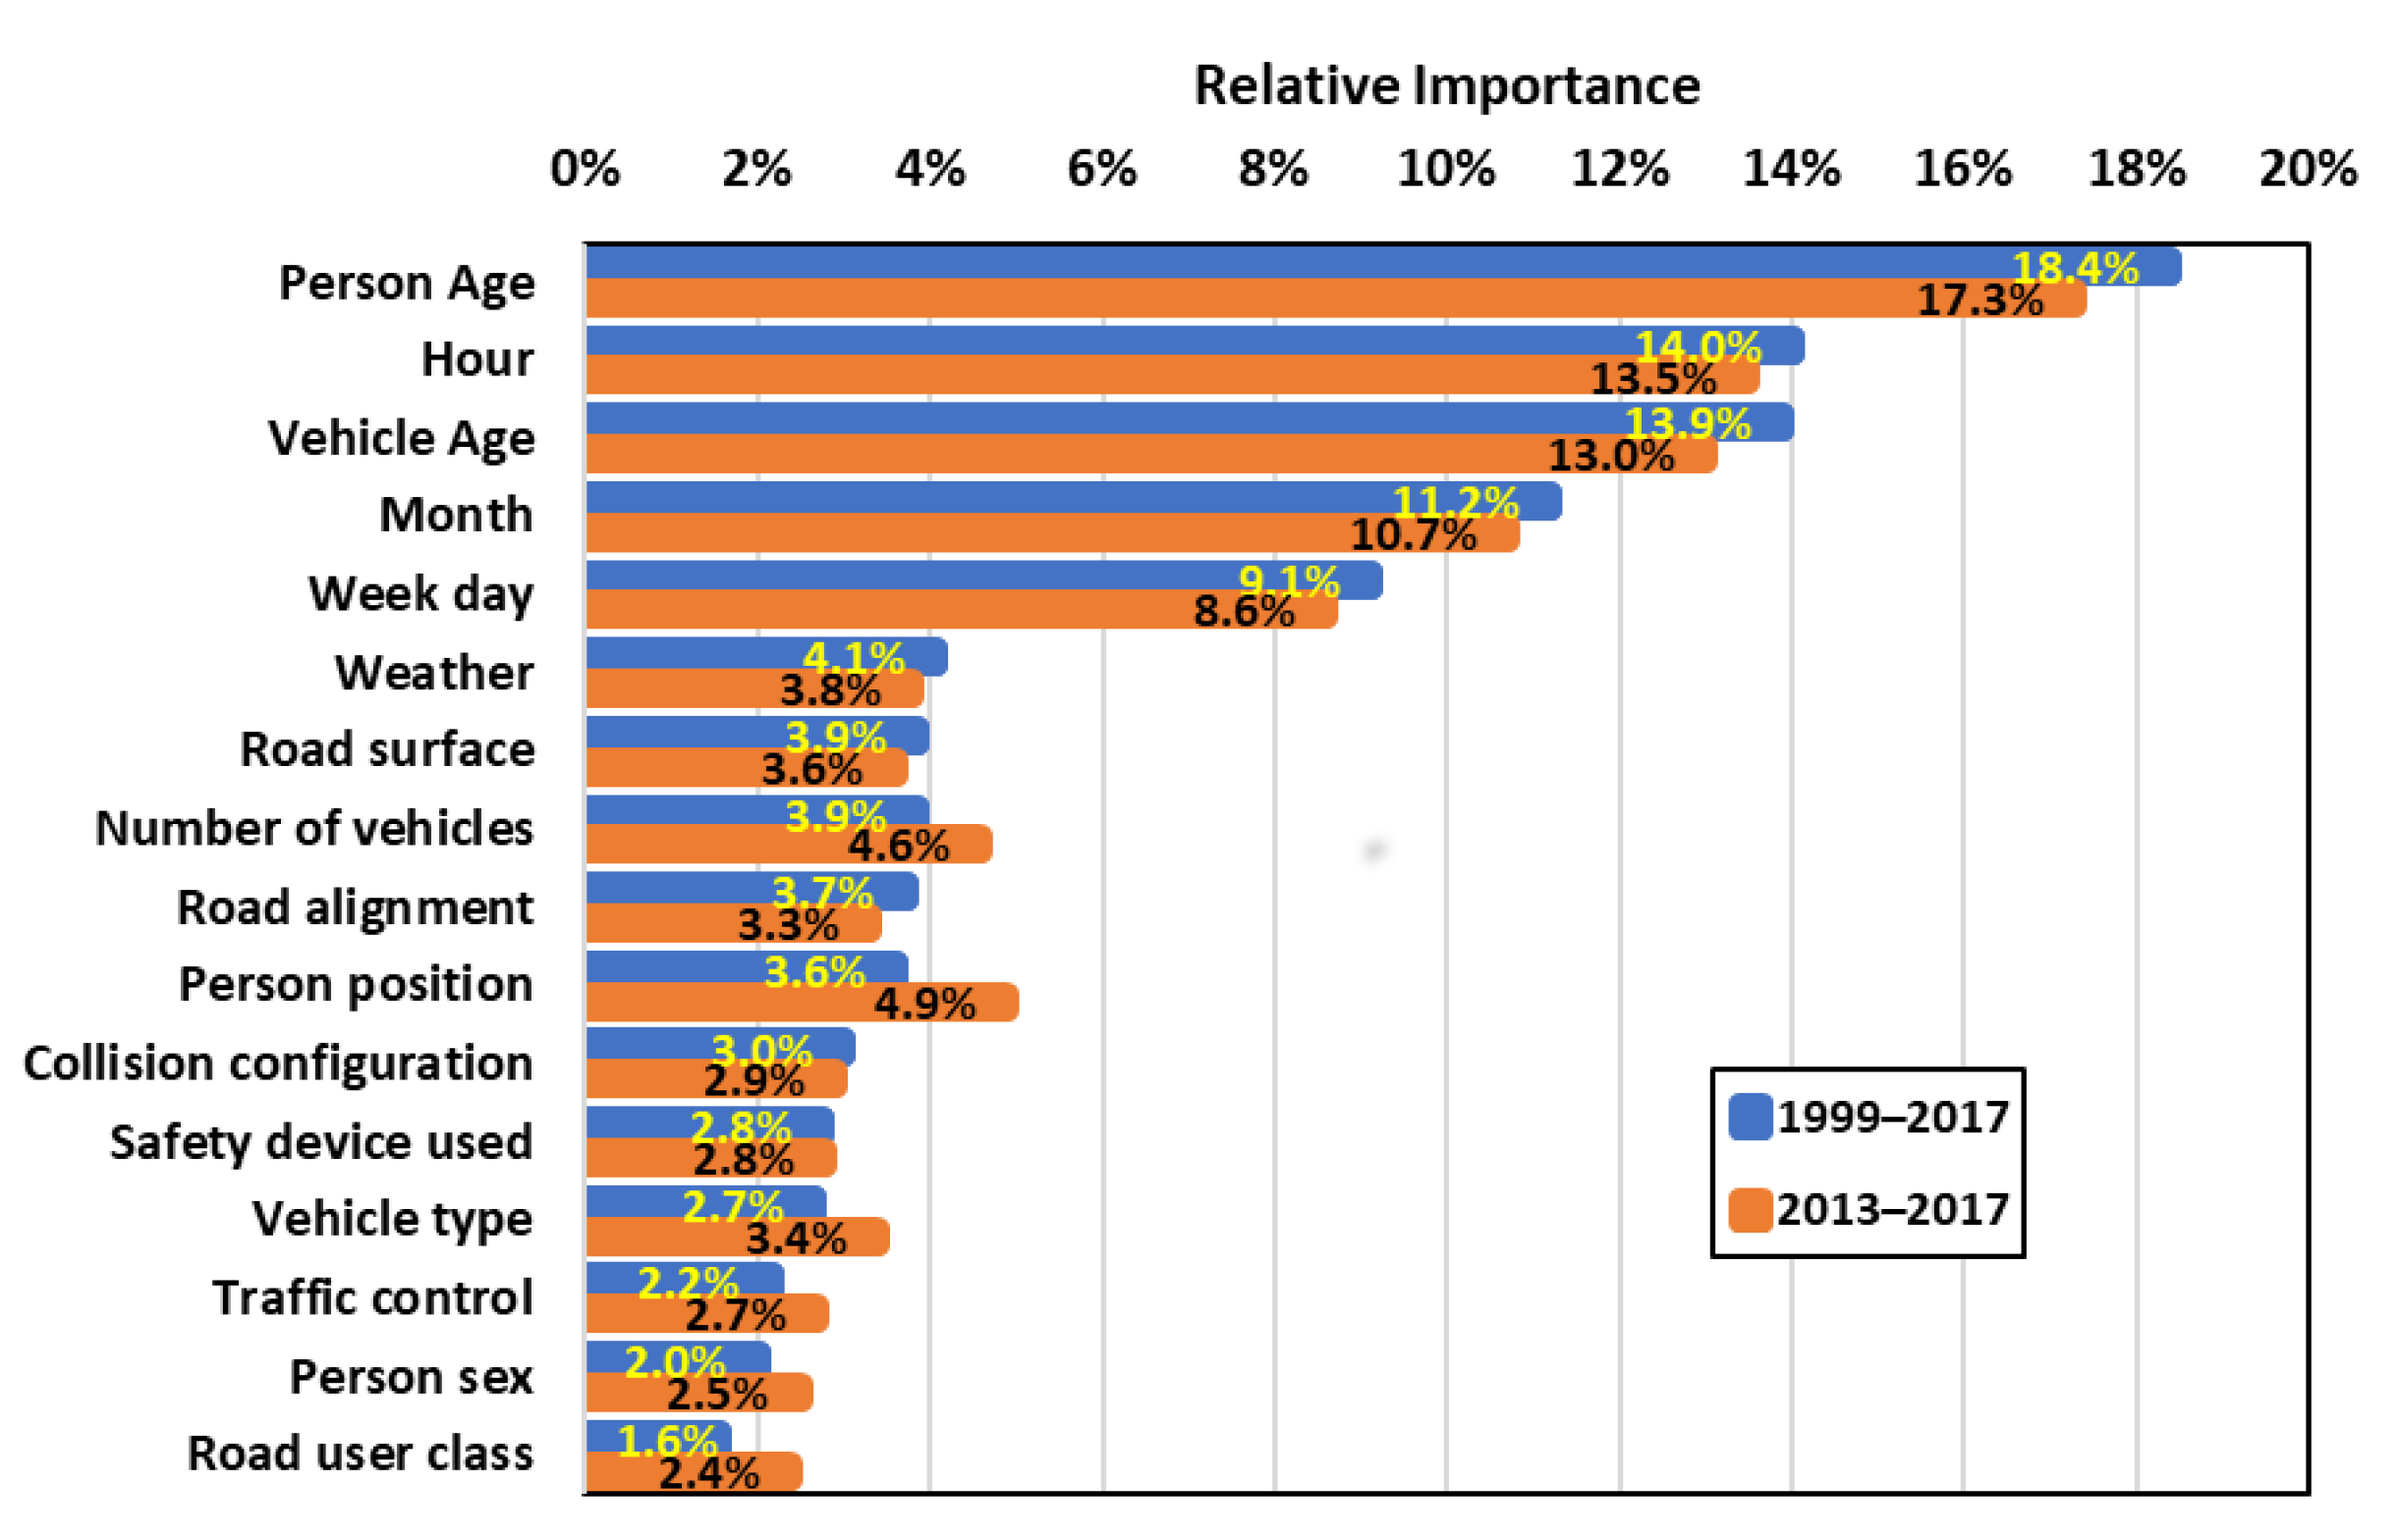
4.2. Examining Predictions through the Machine Learning Method

Table 4 exhibits the distribution of the collisions in the whole dataset, as well as the number of hits into a parked vehicle based on the three classes of health status. The percentage of collisions that lead to injuries is greater when a moving vehicle hits a parked one. This implies the importance of using safety regulations and devices when first responders are working along the roadside. The available dataset for the severity of collisions comprised 25.8% of no injured and 73.8% of injured people (Table 4). Fatality class was a small part of the dataset relative to other cases and was discarded for explanations in this section. Lastly, the dataset could be divided into two remaining classes (no injury and injury). To reduce the skewness of the data distribution, data were balanced. Balancing prevents problems in training since the majority class (injury) cannot dominate the minority class (no injury) and the classifier can learn two distinct concepts properly. Downsampling the majority class (4745 of 6399) limited the calculations onto the number of records similar to the minority class (1654 of 6399). Figure 3 shows a simplified version of the applied decision tree with four levels on the downsampled dataset. Each node in the tree can be used as an indicator rule showing the occurrence of “no injury” (Class 1) or “injury” (Class 2) in a collision. The colors on each node show the final decision made by the decision tree at that level. The orange color in the tree suggests “no injury” while the blue color shows the “injury” category. Darker colors indicate higher confidence in the decision. The top node or the root node of the tree, is the starting point of the ruling procedure using this algorithm. The DT at each node asks a question that yields a true/false answer based on just one factor among all other factors. If a node comes with a verifiable condition on a factor, children nodes (sub-nodes) are expected at left and right. If the node does not come with a condition, it appears as a leaf node in the decision tree. The decisions are made when we reach the leaf node, but the algorithm can be stopped at any node and the decision can be made based on the information available at that node. The DT makes models more interpretable and helps to obtain the results with fewer factors. However, the best results which consider all criteria can be found in the leaf nodes.
At the root node (Figure 3), the tree verifies a condition based on the “person’s position” factor. The condition in this node is P_PSN (person’s position) ≤12.5 (i.e., classes 11 and 12), which means a person is seated in the driver position (11) or the center of the front row of a vehicle (12) in a collision (see Table 2 for classifiers and Figure 2 for the codes). If the condition is true, the algorithm will move to the next level node at the left child, otherwise, it will go to the right child. For instance, if in a collision a person is seated at the front row, right outboard (P_PSN = 13 > 12.5) of the vehicle’s seats, in the next level, the right child node will again check the position (P_PSN = 13 ≤ 17). The next level will control the time of day and if C_HOUR ≤19.5 the person is injured. There is no condition at this child node, which is a leaf node. The light blue at this node indicates the level of confidence in this prediction. To calculate how much the tree is confident at this node, the twin values 41 and 54 on the node can be used. The level of confidence in the class “Injury” is 54/(54 + 41), which equals 57%. At each node, to find the level of confidence of “no injury”, it is possible to divide the left number in the list of values by the sum of twin values, and the level of confidence for the “injured” class is the division of the right value to the sum of twin values. As mentioned earlier, although a decision can be made at each node, they are not as accurate as the leaf node. For instance, if we want to make a decision based on the root node, the result of the classification model is “no injury”, but the confidence of the tree at this level is 50% (1654/(1654 + 1654)).
DTs typically reveal some important information based on a dataset. For the dataset used in this study, a clear description of the relevance of factors was not available, due to the wide range of factors influencing the severity of a collision and complexity of the relations. Therefore, the RF was used to further explain the relative importance of factors in the whole dataset from 1999 to 2017 and the last 5 years of the records (i.e., 2013 to 2017). Figure 4 shows both factor importance and relative importance of the factors based on the RF classifier algorithm, which is slightly different from the DT. Comparing the results of RF in the two datasets does not indicate a significant difference in weights and relative importance of the factors. This implies that the length and period of the dataset have no considerable effects on the results. However, the results from the last 5 years are preferred, due to the probable changes in conditions during a long period. While the sum of relative importance is 1, attributes such as person’s age, hour, vehicle age, month, weekday, and weather conditions can describe almost 70% of the underlying model. If a collision occurs, these factors could indicate the probability of the severity of a collision. For instance, looking at the categorical distribution of each factor (Figure 1 and Figure 2), it can be concluded that accidents that occurred during a weekend day of a high season in sunny and clear weather criteria are more likely to have injured drivers and passengers. This may be expected, but with the results of RF, the weight of importance (rate of contribution) of each factor can be observed.
Regarding the first responder safety, some of these factors (i.e., person or vehicle age) cannot be measured in advance of a collision, but some other factors such as time and location of the mission (the work assigned to the first responders) and their pertaining factors (i.e., road alignment, configuration, traffic control) are known, whereas weather condition and road surface category can be sensed or predicted. Based on the category of these known factors, the risk level of a first responder can be estimated before starting a mission or operation, and the priority of using the proper safety regulations and devices can be highlighted. Also, the number of team members can be revised to ensure that the necessary safety procedures are taken into consideration. In other words, safety devices, such as flashlights and warning radars, and safety measures, such as the length of traffic control zones, can be modified when there is a high risk of collision. To define this situation, again, the RF model results appear to be helpful (Figure 5).
The accuracy metrics are 0.63 and 0.64 for the DT and RF, respectively. These rates are in the range of the top rank classifiers offered by the Auto-Sklearn library and similar to those reported in previous studies using the same method [34,39]. However, the accuracy is not close to 1 due to the weak dependency of the severity of collision on the available factors as well as the absence of other important factors in the dataset (e.g., confusion or alcohol consumption of the driver, road geometry, speed, familiarity with the road, etc.). Ultimately, models can indicate the rules connecting the available variables and their relative importance, which are useful for defining measures that can help to understand factors and mechanisms associated with a collision and offer measures for prevention.
This study is not without limitations. Predictions are not within the desired range of accuracy, even though the accuracy obtained is in the range of other similar studies, and model results show the importance of available influencing factors and the relationship across them fairly well. This is possibly due to the complexity of the event of study, and the absence of all influencing factors should not prevent future studies from incorporating more data and performing further calibrations and validations. More specifically, further studies could be expanded to individuals who are working along roads or highways, and exploring qualitative data sources such as interviews with agents. Parameter validation and hypothetical scenarios could be then expanded through such a route. A more specialized collision dataset could also help to understand and prevent the types of collisions studied and offer more specific directions on a case-by-case basis.

5. Conclusions

This paper synthesized and analyzed relevant motor vehicle collision data through a twofold approach. First, a literature review about the factors influencing motor vehicle collisions was conducted, with special attention given to parameters affecting the pedestrian first responders’ collisions while on duty. The magnitude of influencing factors in collisions was examined in light of the National Collision Database (NCDB) of Canada. Second, statistical analysis and machine learning models using AutoML (Auto-Sklearn), were applied to the dataset. Auto-Sklearn offered the best classifiers based on performance metrics. Considering the ranking and the need for interpretability of the proposed classifier, the DT and RF were selected and extensive hyperparameter tuning was applied to illustrate the rules connecting the top factors that lead to a severe collision in addition to the weight of importance of each factor. Results showed that the machine learning methods have similar success in the prediction of severe collisions based on the examined data. The RF provided the weight of importance of each factor in a collision, and the DT showed the optimal thresholds that could be applied to each factor, yielding an interpretable form in the rule process. In light of these results on the importance of the factors for the parameters, such as the time and spatial data and weather conditions in road incidents, the risk to first responders during their missions can be evaluated before each operation.
Ultimately, this study proves there is an opportunity to use and prepare a risk assessment system for the management of road emergencies and road work conditions taking place along road and highway sides. More specifically, safety regulations and devices can be further developed or tuned using the results of this study.

Author Contributions

Conceptualization, A.A. and M.T.; methodology, A.A., G.T. and M.T.; software, G.T. and M.T.; validation, A.A., G.T., F.C. and M.T.; formal analysis, A.A., G.T. and F.C.; investigation, A.A., G.T. and F.C.; resources, A.A.; data curation, A.A., G.T. and M.T.; writing—original draft preparation, A.A., G.T., B.P. and M.T.; writing—review and editing, A.A., F.C., B.P., A.M. and X.L.; visualization, A.A.; supervision, A.A.; project administration, A.A.; funding acquisition, A.A. All authors have read and agreed to the published version of the manuscript.

Funding

This research was funded by DRDC grant number CFP/AD 0549. This research was conducted in ADERSIM funded by Ontario Research Fund (ORF).

Institutional Review Board Statement

Not applicable.

Informed Consent Statement

Not applicable.

Data Availability Statement

The data presented in this study are openly available in [Canada.ca, Open Government, National Collision Database] at [https://open.canada.ca/data/en/dataset/1eb9eba7-71d1-4b30-9fb1-30cbdab7e63a], accessed on 20 November 2021, reference number [1eb9eba7-71d1-4b30-9fb1-30cbdab7e63a].

Conflicts of Interest

The authors declare no conflict of interest.

References

  1. Federal Bureau of Investigation. Law Enforcement Officers Killed and Assaulted; U.S. Department of Justice: Washington, DC, USA, 2017.
  2. Federal Bureau of Investigation. Law Enforcement Officers Accidentally Killed- Type of Accident and Activity of Victim Officer at Time of Incident; U.S. Department of Justice: Washington, DC, USA, 2018.
  3. International Association of Fire Fighters. Best Practices for Emergency Vehicle and Roadway Operations Safety in the Emergency Services; International Association of Fire Fighters: Washington, DC, USA, 2010; ISBN 0-942920-52-X. [Google Scholar]
  4. LaTourrette, T. Risk factors for injury in law enforcement officer vehicle crashes. Polic. Int. J. Police Strateg. Manag. 2015, 38, 478–504. [Google Scholar] [CrossRef]
  5. US Fire Administration. Traffic Incident Management Systems; United States Department of Homeland Security: Washington, DC, USA, 2012.
  6. Fahy, R.; Molis, J. Firefighter Fatalities in the United States; National Fire Protection Association: Quincy, MA, USA, 2019. [Google Scholar]
  7. Komackova, L.; Poliak, M. Factors affecting the road safety. J. Commun. Comput. 2016, 13, 146–152. [Google Scholar] [CrossRef] [Green Version]
  8. Mohanty, M.; Gupta, A. Factors affecting road crash modeling. J. Transp. Lit. 2015, 9, 15–19. [Google Scholar] [CrossRef] [Green Version]
  9. Cantillo, V.; Garcés, P.; Márquez, L. Factors influencing the occurrence of traffic accidents in urban roads: A combined gis-empirical bayesian approach. DYNA 2016, 83, 21–28. [Google Scholar] [CrossRef]
  10. Zhang, G.; Cao, L.; Hu, J.; Yang, K.H. A field data analysis of risk factors affecting the injury risks in vehicle-to-pedestrian crashes. Ann. Adv. Automot. Med. 2008, 52, 199–214. [Google Scholar] [PubMed]
  11. Vodden, K.; Smith, D.; Eaton, F.; Mayhew, D. Analysis and Estimation of the Social Cost of Motor Vehicle Collisions in Ontario: Final Report; Transport Canada: Ottawa, ON, Canada, 2007. [Google Scholar]
  12. Redelmeier, D.A.; Tibshirani, R.J.; Evans, L. Traffic-law enforcement and risk of death from motor-vehicle crashes: Case-crossover study. Lancet 2003, 361, 2177–2182. [Google Scholar] [CrossRef]
  13. Tay, R.; Rifaat, S.M. Factors contributing to the severity of intersection crashes. J. Adv. Transp. 2007, 41, 245–265. [Google Scholar] [CrossRef]
  14. Savolainen, P.T.; Dey, K.C.; Ghosh, I.; Karra, T.L.; Lamb, A. Investigation of Emergency Vehicle Crashes in the State of Michigan; Purdue University: West Lafayette, IN, USA, 2009. [Google Scholar]
  15. Sanddal, T.L.; Sanddal, N.D.; Ward, N.; Stanley, L. Ambulance crash characteristics in the US defined by the popular press: A retrospective analysis. Emerg. Med. Int. 2010, 2010, 525979. [Google Scholar] [CrossRef] [PubMed]
  16. Yasmin, S.; Anowar, S.; Tay, R. Injury Risk of Traffic Accidents Involving Emergency Vehicles in Alberta; University of Calgary: Calgary, AB, Canada, 2014. [Google Scholar]
  17. Domke, K.; Wandachowicz, K.; Zalesińska, M.; Mroczkowska, S.; Skrzypczak, P. Digital billboards and road safety. Light Eng. Archit. Environ. 2011, 87, 119–131. [Google Scholar]
  18. Decker, J.S.; Stannard, S.J.; McManus, B.; Wittig, S.M.; Sisiopiku, V.P.; Stavrinos, D. The impact of billboards on driver visual behavior: A systematic literature review. Traffic Inj. Prev. 2015, 16, 234–239. [Google Scholar] [CrossRef] [Green Version]
  19. Bui, D.P.; Pollack Porter, K.; Griffin, S.; French, D.D.; Jung, A.M.; Crothers, S.; Burgess, J.L. Risk management of emergency service vehicle crashes in the United States fire service: Process, outputs, and recommendations. BMC Public Health 2017, 17, 885. [Google Scholar] [CrossRef] [Green Version]
  20. Drucker, C.; Gerberich, S.G.; Manser, M.P.; Alexander, B.H.; Church, T.R.; Ryan, A.D.; Becic, E. Factors associated with civilian drivers involved in crashes with emergency vehicles. Accid. Anal. Prev. 2013, 55, 116–123. [Google Scholar] [CrossRef] [PubMed]
  21. Hsiao, H.; Chang, J.; Simeonov, P. Preventing emergency vehicle crashes: Status and challenges of human factors issues. Hum. Fact. 2018, 60, 1048–1072. [Google Scholar] [CrossRef]
  22. Thomas, P.; Frampton, R. Large and small cars in real-world crashes -patterns of use, collision types and injury outcomes. Annu. Proc. Assoc. Adv. Automot. Med. 1999, 43, 101–118. [Google Scholar]
  23. Petridou, E.; Moustaki, M. Human factors in the causation of road traffic crashes. Eur. J. Epidemiol. 2000, 16, 819–826. [Google Scholar] [CrossRef] [PubMed]
  24. NHTSA. Occupant Fatalities in Law Enforcement Vehicles Involved in Motor Vehicle Traffic Crashes; NHTSA’s National Center for Statistics and Analysis, The U.S. National Highway Traffic Safety Administration: Washington, DC, USA, 2018.
  25. Dumont, E.; Brémond, R.; Hautière, N. Night-time visibility as a function of headlamps beam patterns and pavement reflection properties. In Proceedings of the VISION 2008, Marseille, France, 12–18 October 2008. [Google Scholar]
  26. Farber, G. Seeing with Headlights; The U.S. National Highway Traffic Safety Administration: Washington, DC, USA, 2004.
  27. Centers for Disease Control and Prevention. Impaired Driving: Get the Facts-BAC Effects. Available online: https://www.cdc.gov/transportationsafety/impaired_driving/impaired-drv_factsheet.html (accessed on 24 August 2020).
  28. Pinizzotto, A.; Davis, E.; Miller, C., III. Accidentally Dead: Accidental Line-of-Duty Deaths of Law Enforcement Officers; Federal Bureau of Investigation Bulletin; United States Department of Justice: Washington, DC, USA, 2002; Volume 7, pp. 8–13.
  29. Transport Canada National Collision Database 1999 to 2017. Available online: https://open.canada.ca/data/en/dataset/1eb9eba7-71d1-4b30-9fb1-30cbdab7e63a (accessed on 18 June 2019).
  30. Al-Ghamdi, A.S. Using logistic regression to estimate the influence of accident factors on accident severity. Accid. Anal. Prev. 2002, 34, 729–741. [Google Scholar] [CrossRef]
  31. Sze, N.N.; Wong, S.C. Diagnostic analysis of the logistic model for pedestrian injury severity in traffic crashes. Accid. Anal. Prev. 2007, 39, 1267–1278. [Google Scholar] [CrossRef] [PubMed]
  32. Kashani, A.; Shariat, A. Analysis of the traffic injury severity on two-lane, two-way rural roads based on Classification tree models. Saf. Sci. 2011, 49, 1314–1320. [Google Scholar] [CrossRef]
  33. Montella, A.; Aria, M.; D’Ambrosio, A.; Mauriello, F. analysis of powered two-wheeler crashes in italy by classification trees and rules discovery. Accid. Anal. Prev. 2012, 49, 58–72. [Google Scholar] [CrossRef]
  34. Wei, X.; Shu, X.; Huang, B.; Taylor, E.L.; Chen, H. Analyzing traffic crash severity in work zones under different light conditions. J. Adv. Transp. 2017, 2017, 10. [Google Scholar] [CrossRef] [Green Version]
  35. Feurer, M.; Klein, A.; Eggensperger, K.; Springenberg, J.; Blum, M.; Hutter, F. Efficient and Robust Automated Machine Learning. In Advances in Neural Information Processing Systems; Cortes, C., Lawrence, N., Lee, D., Sugiyama, M., Garnett, R., Eds.; Curran Associates, Inc.: Red Hook, NY, USA, 2015; Volume 28, pp. 2962–2970. [Google Scholar]
  36. Carvalho, D.V.; Pereira, E.M.; Cardoso, J.S. Machine learning interpretability: A survey on methods and metrics. Electronics 2019, 8, 832. [Google Scholar] [CrossRef] [Green Version]
  37. Statistics Canada. Table 20-10-0001-01 New Motor Vehicle Sales. 2019. Available online: https://www150.statcan.gc.ca/t1/tbl1/en/tv.action?pid=2010000101 (accessed on 15 June 2020).
  38. Insurance Institute for Highway Safety (IIHS) Fatality Facts 2018, Gender. Available online: https://www.iihs.org/iihs/topics/t/general-statistics/fatalityfacts/gender (accessed on 29 March 2021).
  39. Chang, L.-Y.; Chien, J.-T. Analysis of driver injury severity in truck-involved accidents using a non-parametric classification tree model. Saf. Sci. 2013, 51, 17–22. [Google Scholar] [CrossRef]
Figure 1. Variation of collision with time in the whole NCDB (1999–2017) dataset [29] (a,c,e) and in hit a parked vehicle accident (b,d,f).
Applsci 11 11198 g001aApplsci 11 11198 g001b
Figure 2. Distribution of collisions versus person or road level categories in hit a parked vehicle accident in NCDB dataset (1999–2017) [29]. (Number in parentheses shows the code for the category of the dataset).
Applsci 11 11198 g002aApplsci 11 11198 g002b
Figure 3. Decision tree.
Applsci 11 11198 g003
Figure 4. The importance of factors influencing the severity of a collision with a parked vehicle for all available factors in the dataset.
Applsci 11 11198 g004
Figure 5. The importance of measurable, predictable or sensible factors influencing the severity of a collision with a parked vehicle among the data set.
Applsci 11 11198 g005
Table 1. Factors affecting road collisions.
CategoryInvolving Parameters
Road characteristicsGeometry (e.g., curving parameters, lane width, …)
Type (e.g., local, collector, minor arterial, …)
Location (land use, such as residential or economic zones, rural areas, …)
Surface condition
Configuration
Drivers view and visibility
Traffic control devices and surveillance camera
Lighting condition
Traffic (e.g., speed, flow, density, congestion, …)
Vehicle characteristicsVehicle types
Safety equipment
Driver characteristicsAge
Gender
Conditions (e.g., confusion, alcohol consumption, helmet or seat belt usage, …)
Driving license (e.g., type, experience, deprivation, …)
Familiarity with road
Environmental attributesWeather
Time
Table 2. Factors in National Collision Database of Canada [29].
CategoryInvolving FactorsCode
CollisionYearC_YEAR
MonthC_MNTH
Day of weekC_WDAY
Collision hourC_HOUR
Collision severity (At least one fatality, Non-fatal injury)C_SEV
Number of vehicles involved in collisionsC_VEHS
Collision configuration (Single Vehicle in Motion, Two Vehicles in Motion-Same or Different Direction of Travel, Two Vehicles-Hit a Parked Motor Vehicle)C_CONF
Roadway configuration (e.g., Non-intersection, Intersection, Railroad level crossing, Bridge, …)C_RCFG
Weather condition (e.g., Clear and sunny, Overcast cloudy, Raining, Snowing, Freezing Rain, Sleet, Hail, Visibility limitation, Strong wind)C_WTHR
Road surface (e.g., Dry, normal, Wet, Snow, Slush, Icy, Muddy, Flooded, …)C_RSUR
Road alignment (e.g., Straight and level, Straight with gradient, Curved and level, …)C_RALN
Traffic control (e.g., Traffic signals, Stop sign, Yield sign, Warning sign, …)C_TRAF
VehicleVehicle sequence numberV_ID
Vehicle type (e.g., Light Duty Vehicle, Panel/cargo van, Bicycle, …)V_TYPE
Vehicle model yearV_YEAR
PersonPerson sequence numberP_ID
Person sex (Female, Male, Unknown)P_SEX
Person’s ageP_AGE
Person position (e.g., Driver, Front row, Second row, Third row, Position, Sitting on someone’s lap, Outside passenger compartment, Pedestrian)P_PSN
Medical treatment required (e.g., No Injury, Injury, Fatality)P_ISEV
Safety device used (e.g., No safety device, Helmet worn, Reflective clothing worn, …)P_SAFE
Road user class (e.g., Motor Vehicle Driver, Motor Vehicle Passenger, Pedestrian, Bicyclist, Motorcyclist)P_USER
Table 3. Auto-Sklearn metric results.
RankClassifierTest ScoreBalanced AccuracyPrecisionRecallf1Custom Error
1AdaBoost (Adaptive Boosting)0.640.640.600.750.670.36
2RF (Random Forest)0.620.620.610.600.610.38
3LDA (Linear Discriminant Analysis)0.620.620.590.730.650.38
4Extra Trees0.620.620.600.620.610.38
4MLP (Multi-Layer Perceptron)0.620.620.600.660.630.38
6GaussianNB (Gaussian Naive Bayes)0.570.560.560.470.520.43
7DT (Decision Tree)0.560.560.540.630.580.44
8LinearSVC (Linear Support Vector Classification)0.490.500.491.000.650.51
Table 4. Distribution of type of required medical treatment in collisions in NCDB [29] dataset.
CategoryAll RecordsHit a Parked Vehicle
No Injury43.0%25.8%
Injury56.4%73.8%
Fatality0.6%0.4%
Total number of collisions3,817,6136399
Publisher’s Note: MDPI stays neutral with regard to jurisdictional claims in published maps and institutional affiliations.

