1. Introduction
Due to the needs of the project, pits are often excavated to form slopes. Landslide disasters often occur due to the gravity of the earth and the instability of the slope itself. Therefore, engineers often take measures to strengthen the fragile slope. The reinforcement methods are often as follows: bolt reinforcement, anti-slide pile reinforcement, retaining wall reinforcement, bolt retaining wall reinforcement, pre-stressed anchor-rope lattice beam and bare slope. Bolt reinforcement is applicable to rock slope and soil slope, with high stability, low project cost and a short construction period. However, because the material of bolt has always been reinforced, it is easy to produce stress loss under the corrosion of long-term groundwater. Anti-slide pile reinforcement is widely used in the prevention and control of soil slope, but the determination of sliding surface and the selection of anti-slide pile position often become a difficult problem and bring uncertainty to engineering safety. Retaining wall reinforcement has the advantages of simple form, convenient construction, local materials and strong adaptability, so it is widely used. However, if the soil is weak, it will often consume a lot of economic cost. A bolt retaining wall has the advantages of a light structure and cost saving and safe construction, but the construction process is complex and it requires procedures such as drilling, grouting and the use of other supporting mechanical equipment. The pre-stressed anchor-rope lattice beam is a new type of anti-sliding retaining structure, which is widely used in slope treatment engineering with good effects, but it will still be plagued by corrosion. When the geological conditions are good and the space is sufficient, the bare slope can be adopted to save the cost. The aim of this test is to adopt bolt reinforcement which can last more than one hundred years. The durability of the anchorage system is affected by groundwater, fluctuating temperature, and other environmental factors when the traditional steel bar is used to reinforce the slope, coal mine and other projects [
1,
2,
3,
4,
5,
6]. Compared with the traditional steel bars, the new Glass Fibre Reinforced Polymer (GFRP) bar has the advantages of high strength, light weight, low modulus, and corrosion resistance [
7,
8,
9] and can be used to solve the durability problem of anchorage structures.
The replacement of steel bars with GFRP bars has become one of the most potentially effective solutions to solve corrosion problems in geotechnical engineering [
10] Therefore, more scholars have studied the durability of GFRP bars in different environments to achieve a deeper understanding of its application [
11,
12,
13,
14,
15]. In addition to the durability of GFRP bars, many scholars have studied the anchorage performance of GFRP bars. Kuang et al. [
16] studied the influence of the anchorage length, diameter, geotechnical parameters, and pre-stress on the bond performance of GFRP bars by ANSYS analysis. The bond slip relationship between GFRP and the grouting body was studied by Eliya et al. [
17], and a new bond slip relationship model for GFRP bars was proposed. Comparative studies between steel and GFRP anchor bars were conducted by Benmokrane et al. [
18], and Michal et al. [
19]. They compared the bond strength, failure slip, fatigue durability and other indexes (characteristics) of steel and GFRP bars through laboratory and field tests. Because of its lower elastic modulus, GFRP could better adapt to the deformation of slopes than steel bars [
20,
21]. From the above available literature, the previous research did not mention the behaviour of surroundings reinforced by anchor bar and failed to form a clear conclusion on the difference in the performance of the steel and GFRP bars under the surrounding rock or soil condition. Therefore, the performance of steel and GFRP bars under the condition of argillaceous sandstone soft rock needs to be further studied.
In this paper, an in-situ test was performed to study the damage characteristics of the bond state of steel and GFRP bars in soft rock and expansive soil under different loads. The commonalities and differences of the bond characteristics of steel and GFRP bars in soft rock and expansive soil slopes were compared to provide theoretical support for the application of GFRP bars in engineering reinforcement of soft rock slope in cases like the test project of Yangtze-to-Huai Water Diversion.
2. Materials and Methods
2.1. Engineering Geological Condition
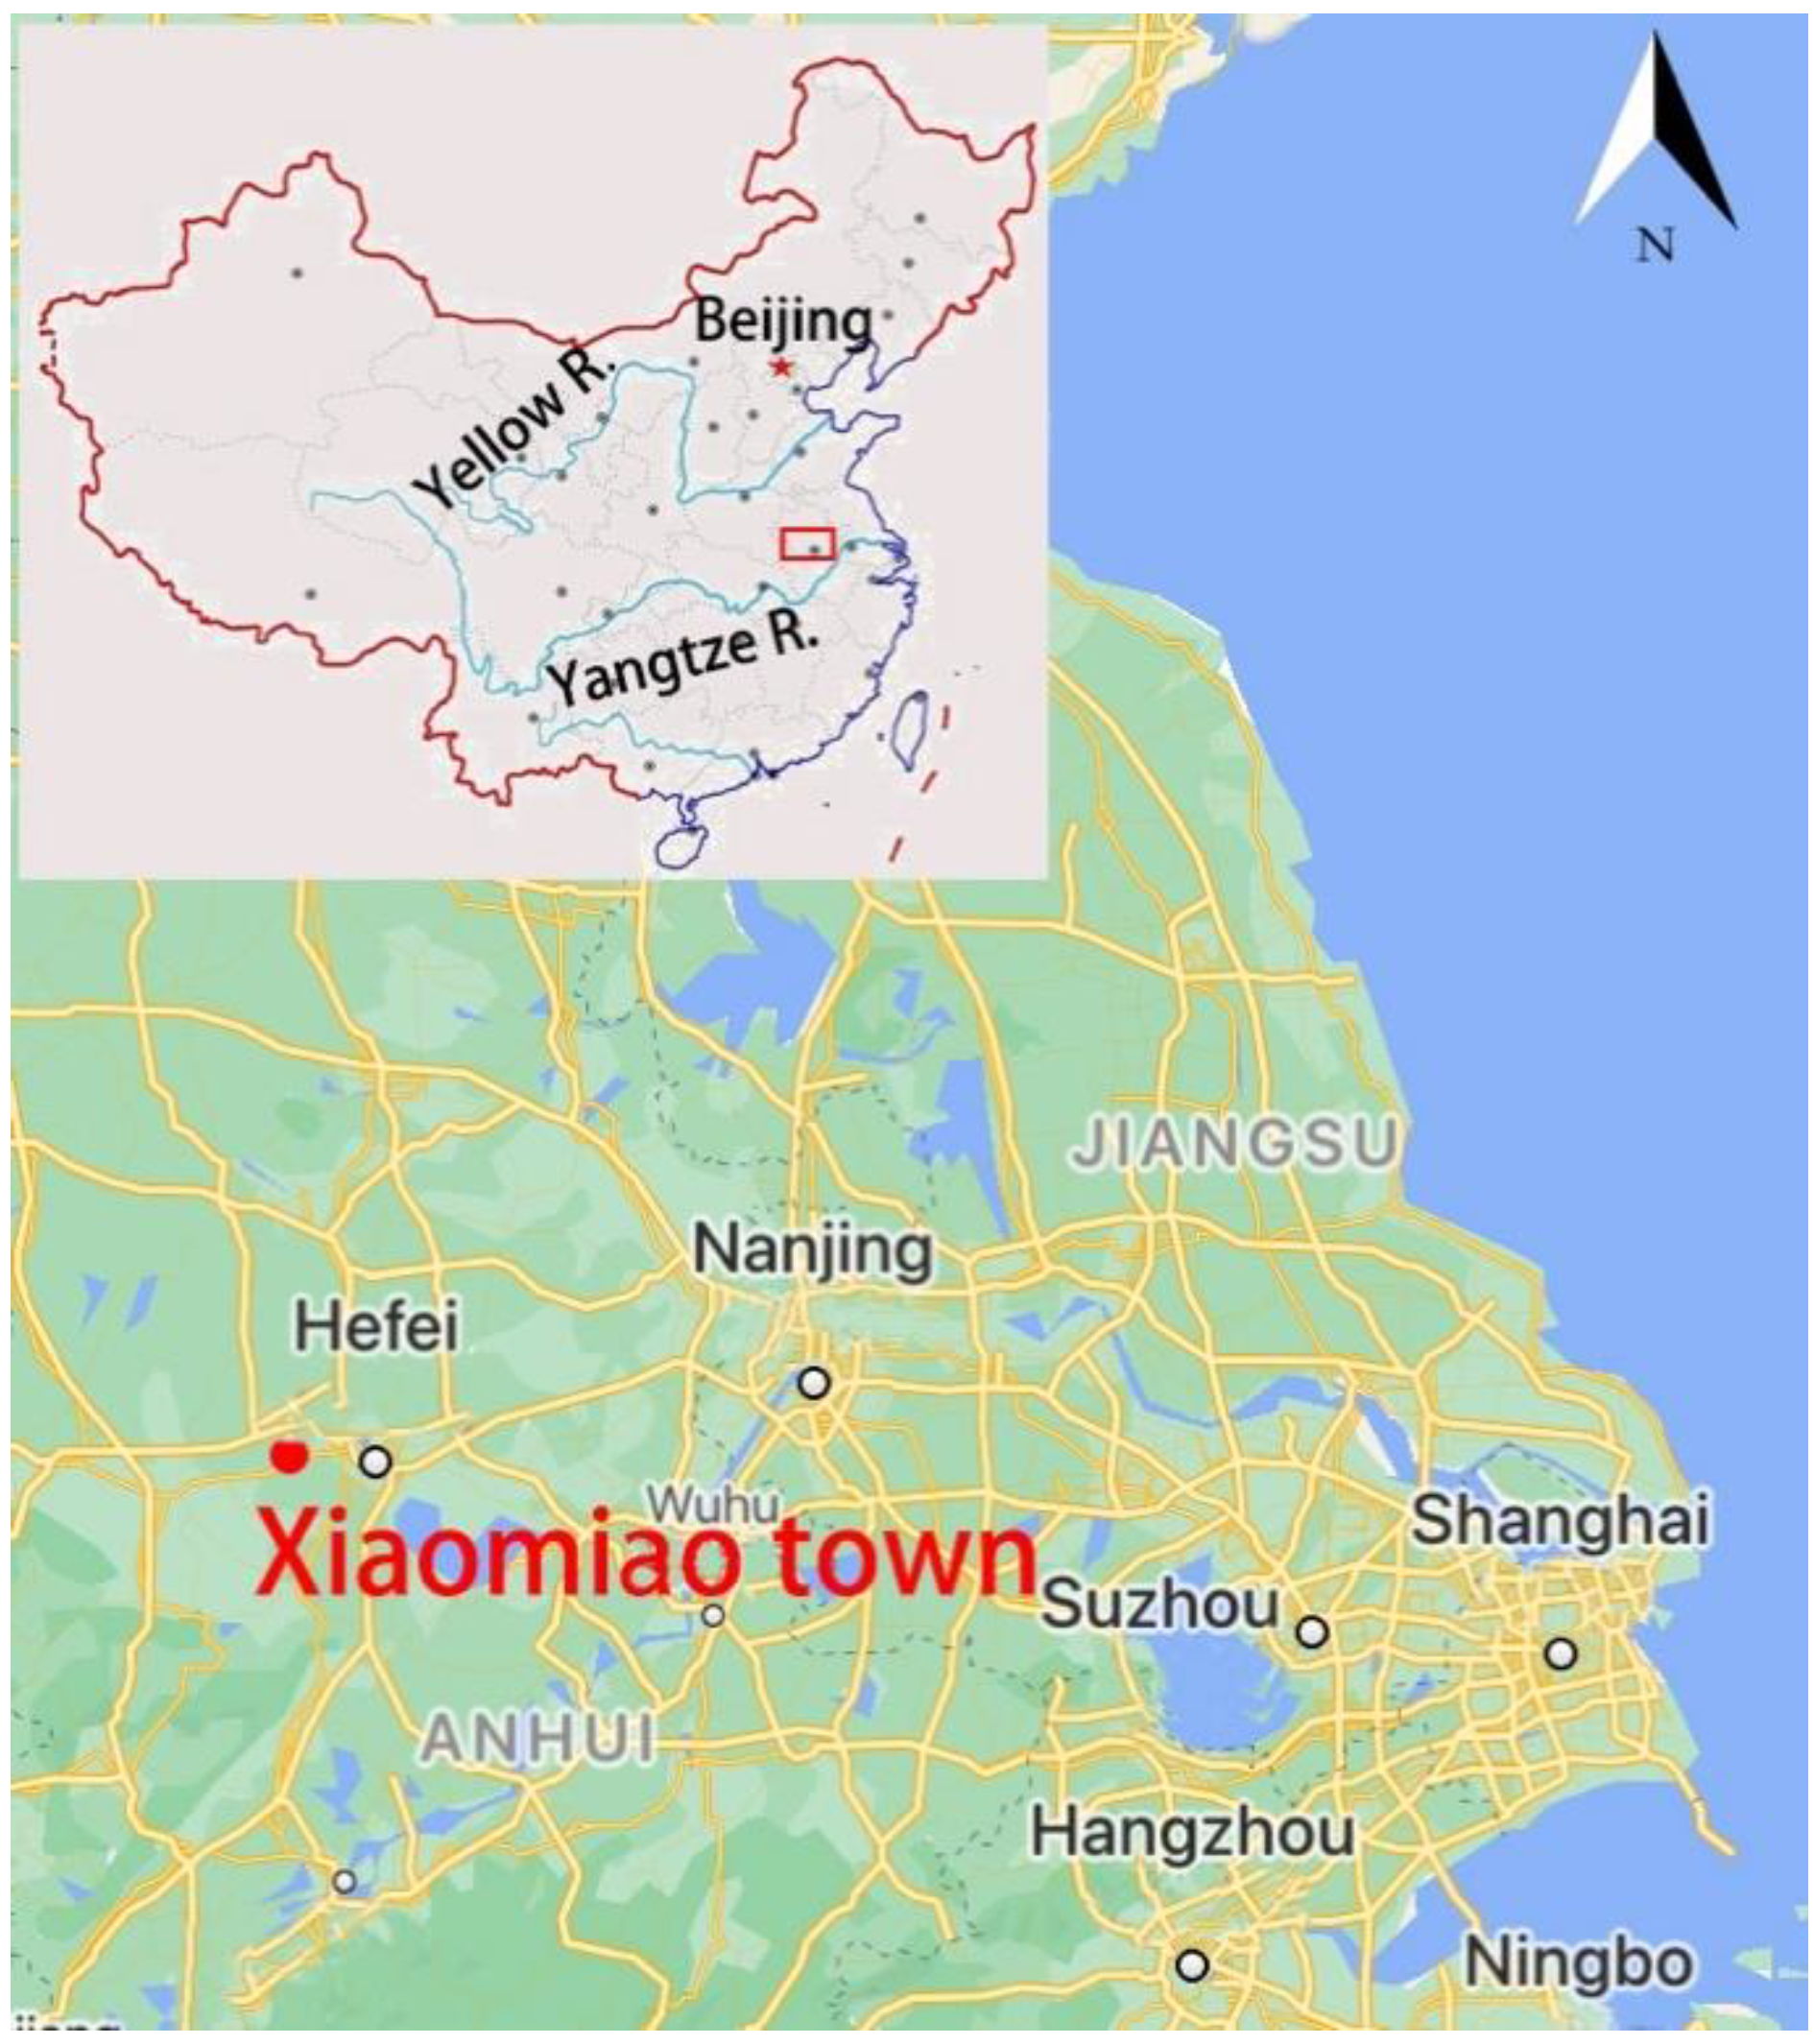
The test site was located in the project of Yangtze-to-Huai Water Diversion. The overlying strata were mainly Holocene silty loam, sandy loam, upper Pleistocene silty loam, silty clay, sandy soil, and some middle Pleistocene gravel clay. The underlying bedrock was mainly Jurassic siltstone, fine sandstone, mudstone, sinian and pre-sinian dolomite, gneiss, and some intrusive rocks such as granite and quartz-syenite. The location of the test site is shown in
Figure 1. The stratum section and the location of the bar are shown in
Figure 2. The physical and mechanical properties of the argillaceous sandstone and the expansive soil are shown in
Table 1 and
Table 2. The compressive strength was 5.0 MPa, and the rock mass was defined as extremely soft rock according to the Code for Investigation of Geotechnical Engineering [
22].
2.2. Elements of the Test Specimens
2.2.1. Bar
The bars used in this study were HRB400 threaded steel bars and GFRP bars. The GFRP is a new functional material made of synthetic resin and glass fibre through composite process. The mechanical properties of the steel and GFRP bars are shown in
Table 3 and
Table 4, respectively. The test plan and surface properties of the bar are shown in
Table 5 and
Figure 3, respectively.
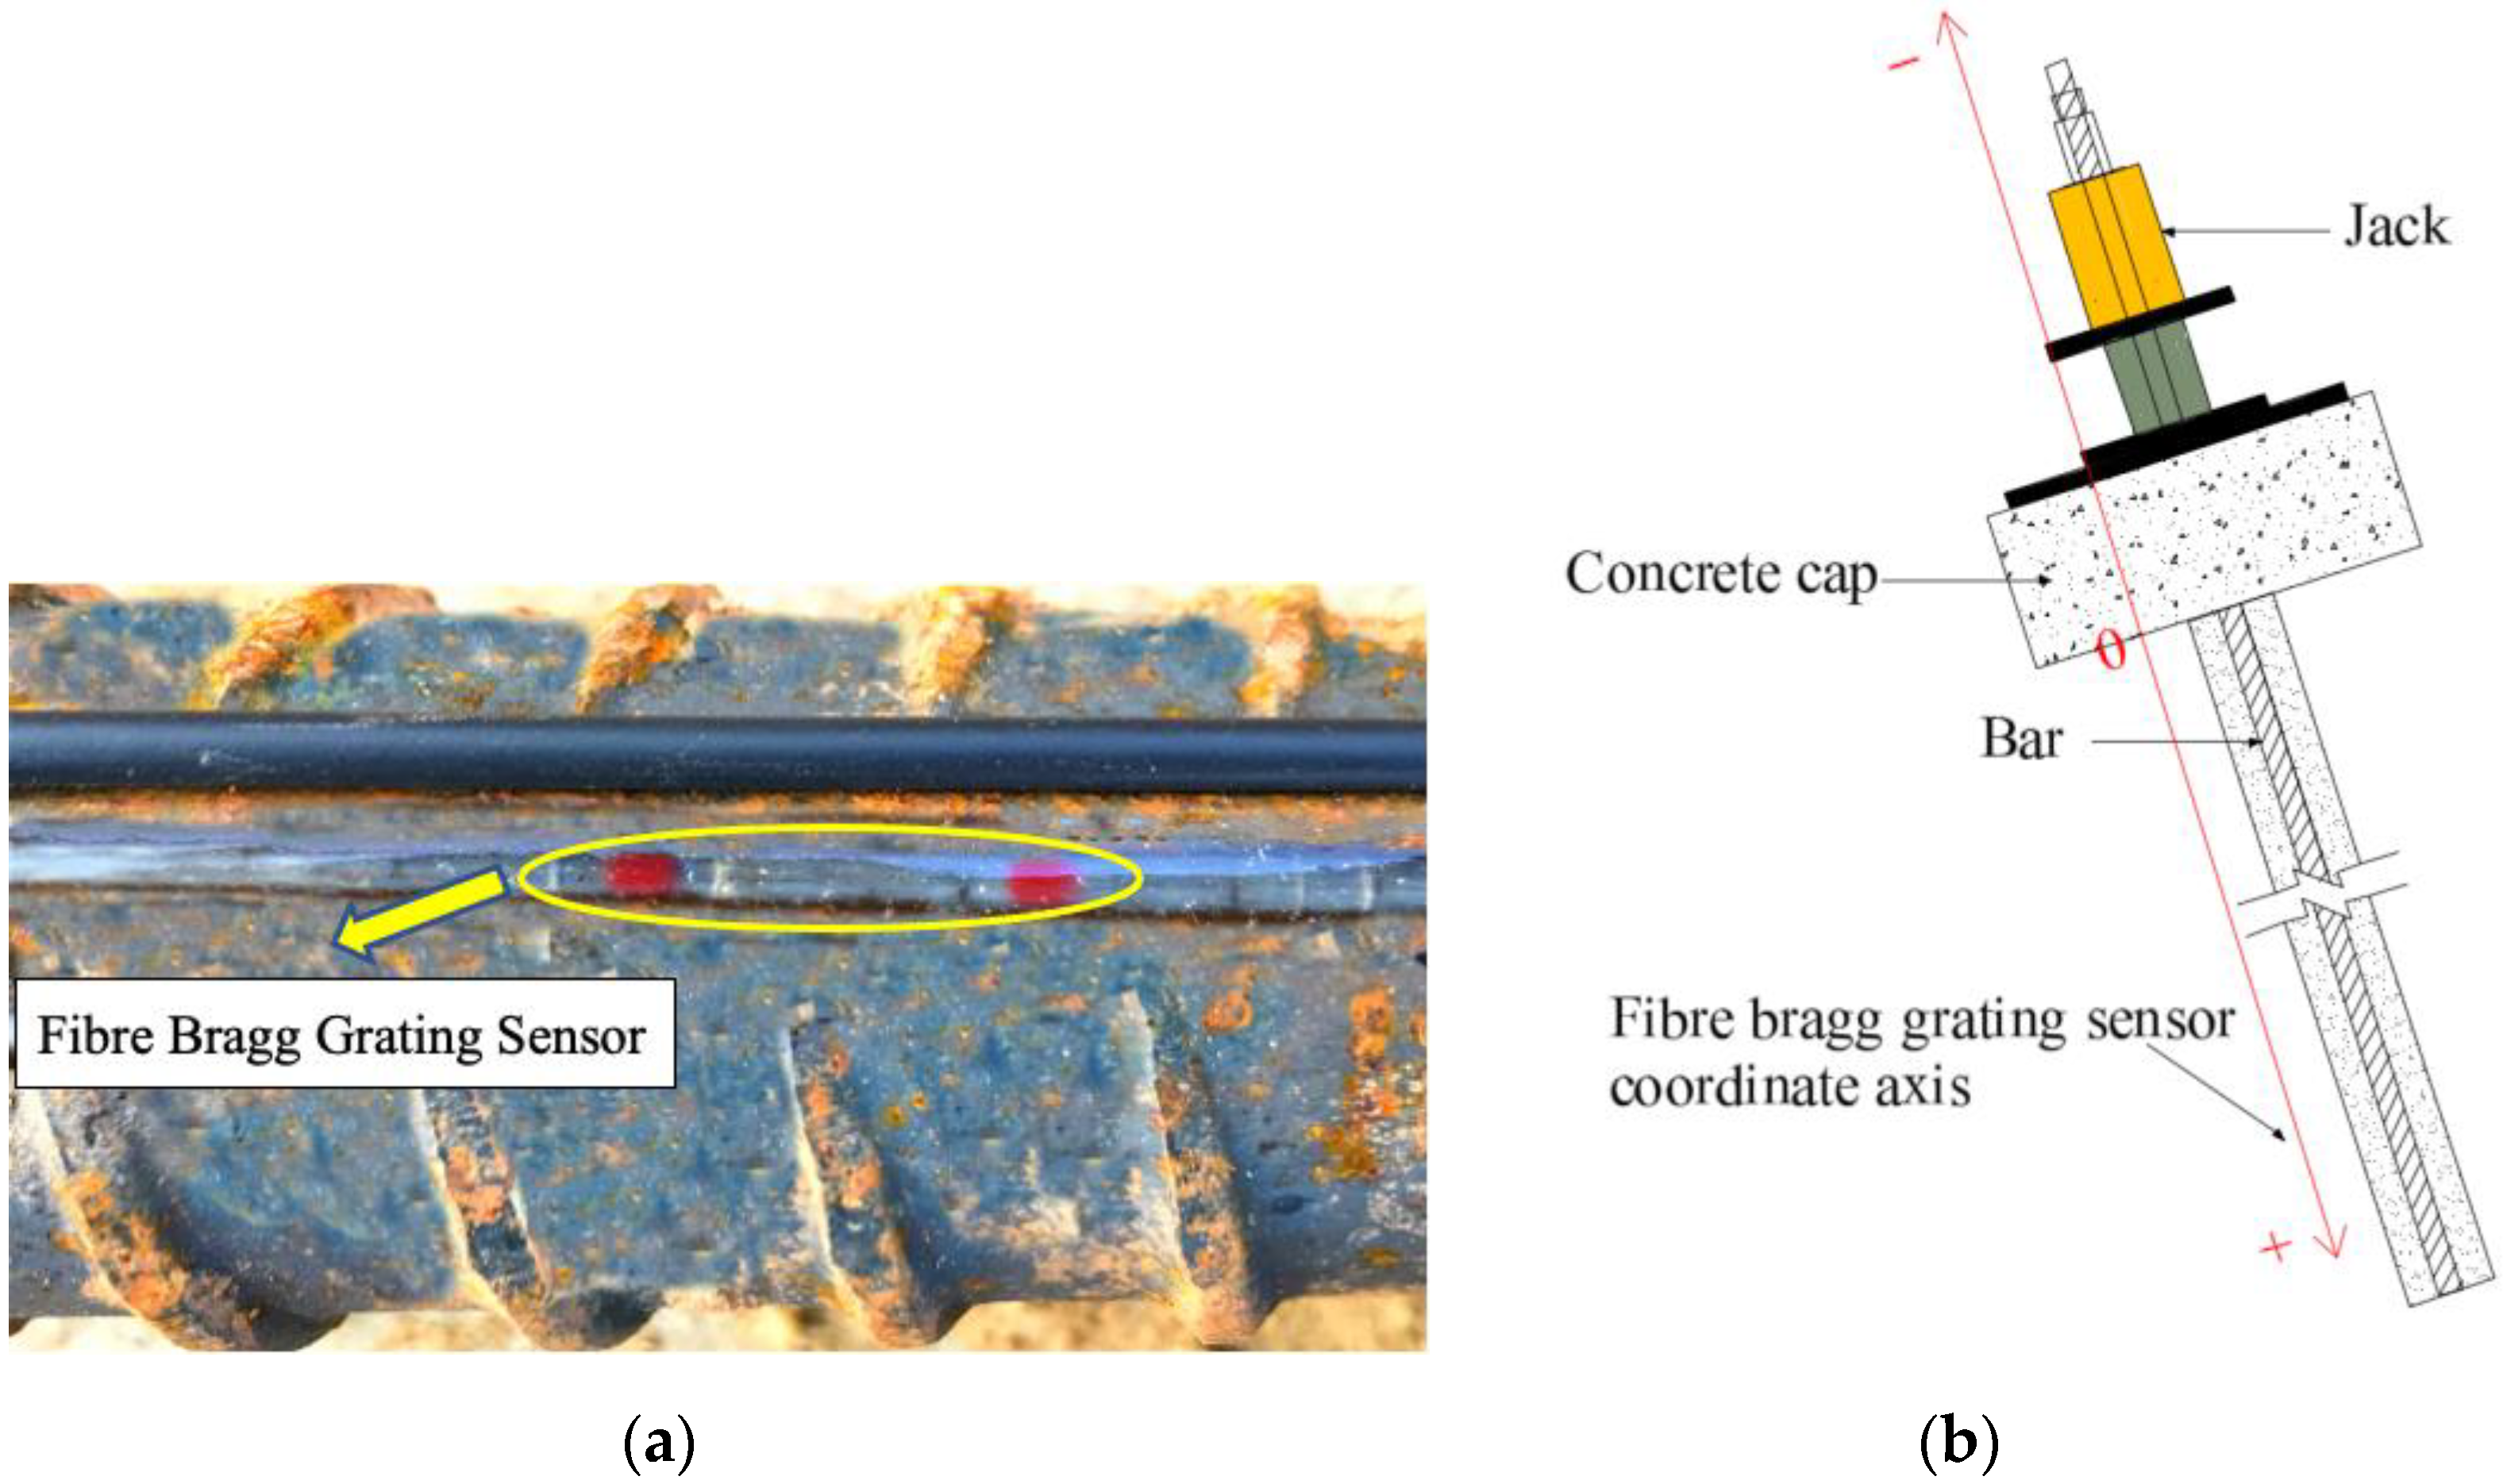
2.2.2. Fibre Bragg Grating Sensor
Grooves (1 mm × 1 mm) were made along the axis on the surface of the bar body. The grooves were cleaned with alcohol and then air-dried. The Fibre Bragg Grating Sensor was placed in the groove, which were fixed at both ends of the bar, and the grooves are covered with epoxy resin glue, as shown in
Figure 4a. The junction of the concrete cap bottom surface and bar was the coordinate of zero. The direction of the anchor segment was a positive coordinate, and the free top part of the bar was a negative coordinate, as shown in
Figure 4b.
2.2.3. Three String Dynamometer
The hollow hydraulic jack used in the test can bear a maximum of 50 tons, measured by the three-string dynamometer produced by Dandong Qiangong, whose measurement range is 500 kN and data is read by the vibrating wire reader.
The data collected by the vibrating wire reader is the frequency, which is converted into the load value of the dynamometer through the formula shown below.
where,
is the pulling force exerted by the jack,
is the frequency value under the current load condition,
is the initial frequency value, and
is the calibration coefficient of the dynamometer.
2.2.4. Bolt Installation and Concrete Cushion Cap Pouring
The air compressor is used to drill the bolt with a hole diameter of 110 mm, and then the bolt is installed into the hole. In order to prevent the sensor from being damaged by the excessive deflection of the bolt, the installation process is coordinated with the excavator as shown in
Figure 5a. After the bolt is inserted into the hole, pressure grouting is carried out. After the bolt is placed in the hole and grouting is completed, the concrete pile cap formwork prepared in advance is fixed around the bolt, and the size of the formwork is 50 cm × 50 cm × 30 cm. Then the PVC pipe is installed around the bolt to prevent the concrete from bonding with cement slurry and bolt during the pouring of the concrete pile cap. Watering curing shall be carried out after pouring, and pull-out test is carried out after 28 days. Both of these are shown in
Figure 5b.
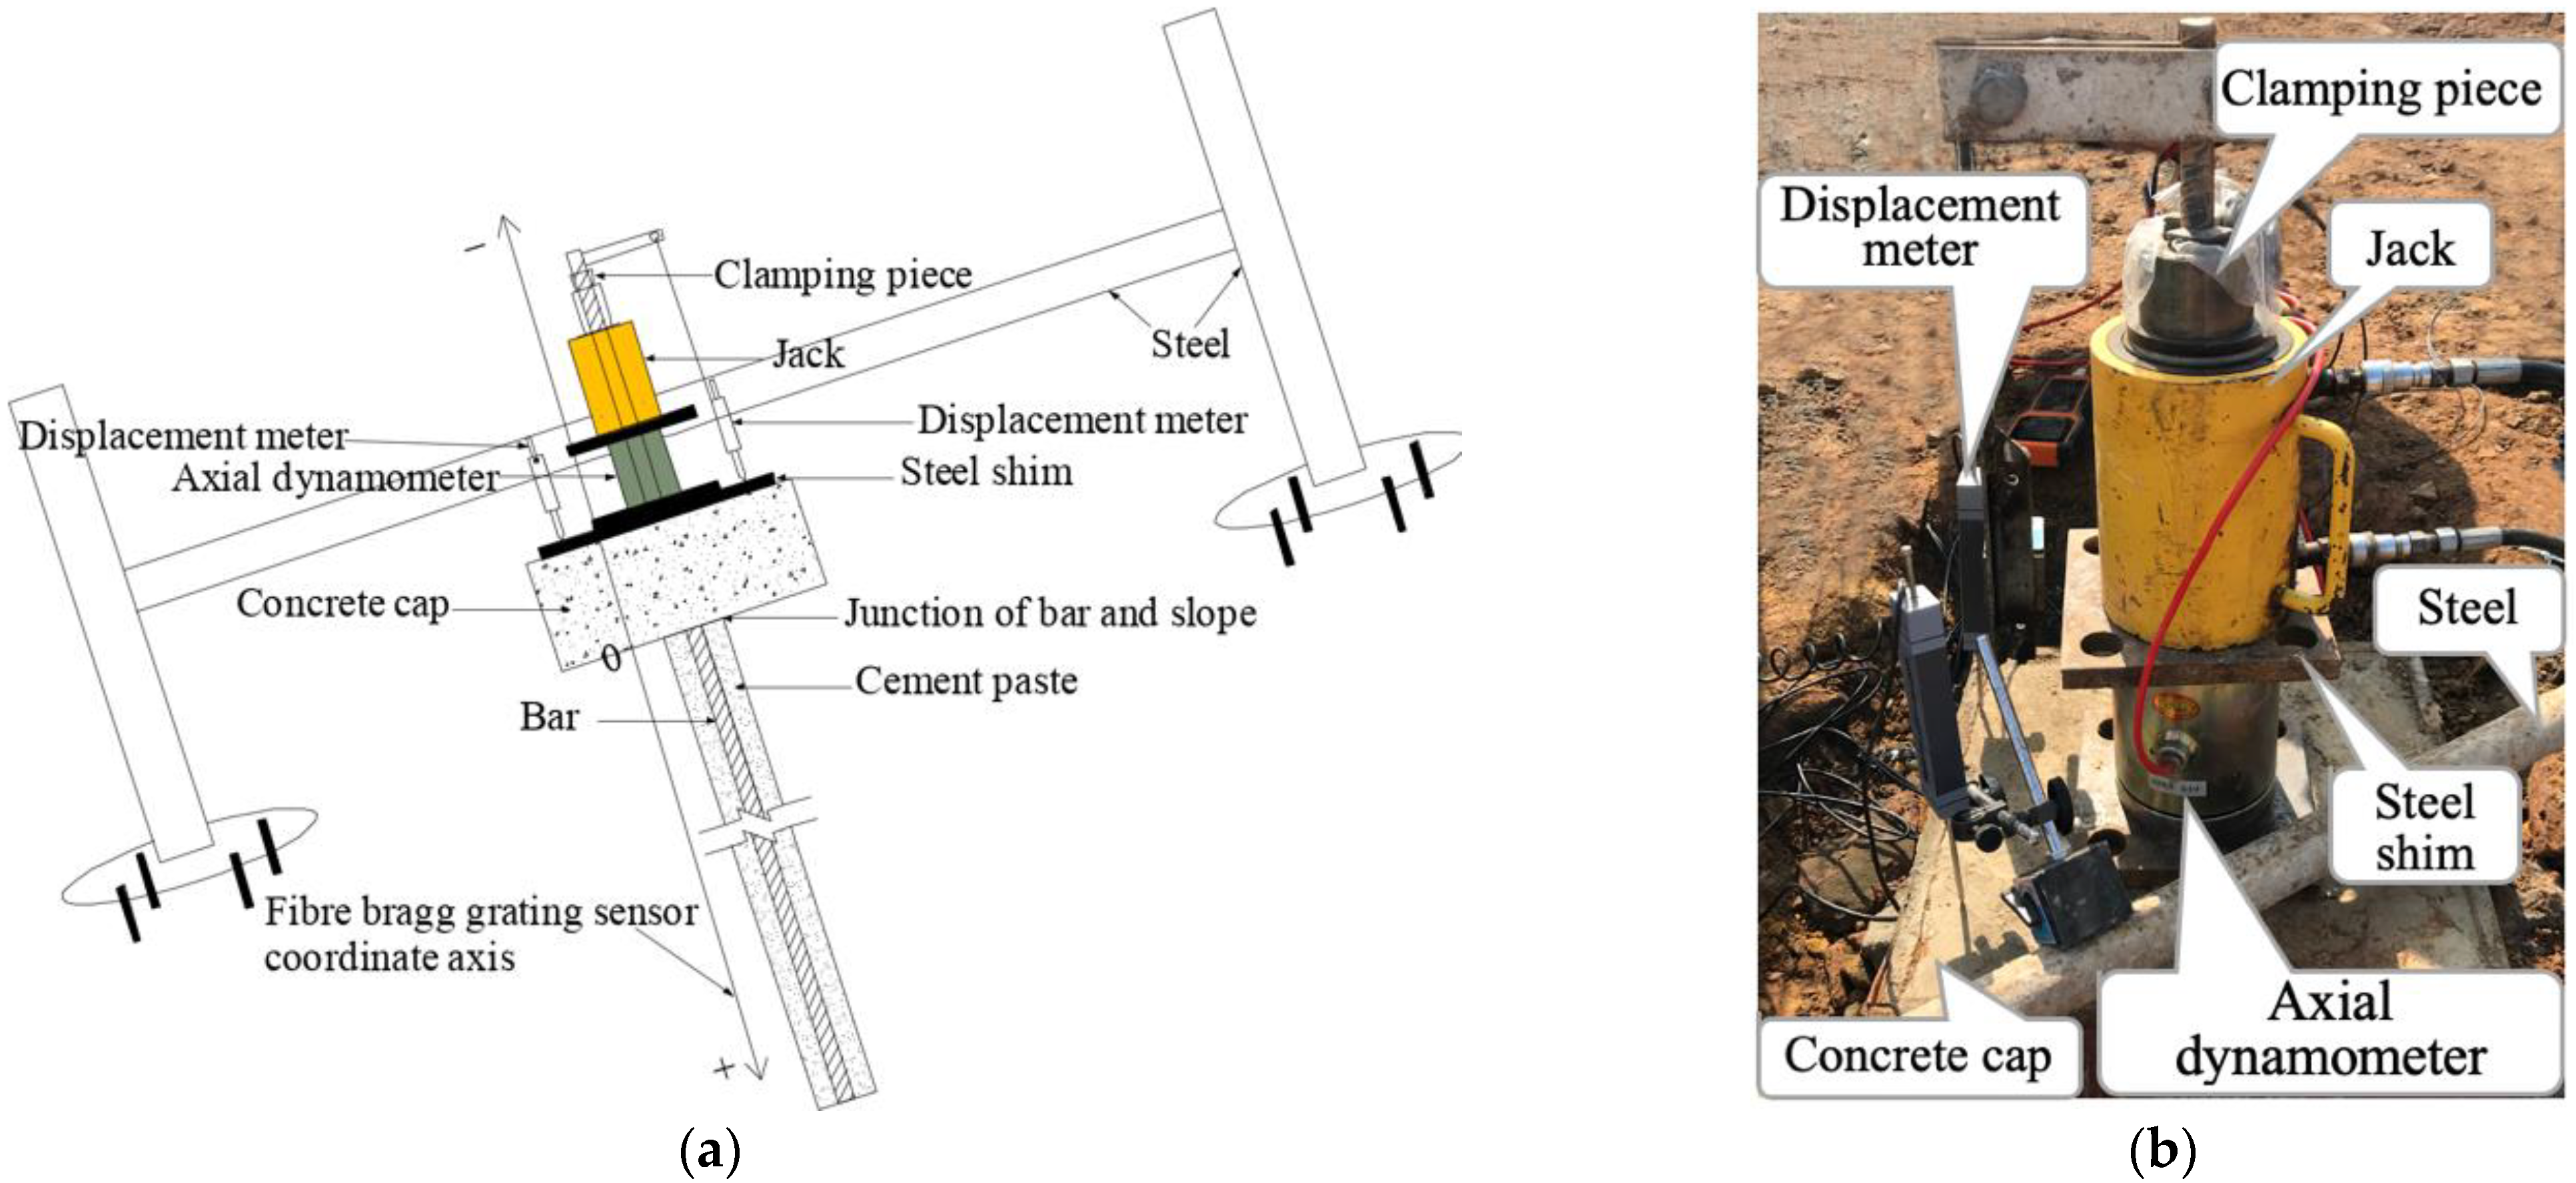
2.2.5. Test Device
The top part of the test bar adopted the traditional clamping piece method. The test device includes steel pipes, steel shims, an axial dynamometer, a displacement meter, a hollow hydraulic jack, and a clamping piece. The axial dynamometer used a three-string load cell, and the data were collected by a vibrating string frequency reader. An MOI SM125 demodulation instrument was used to collect the Fibre Bragg Grating Sensor data. The diagram of the test device is shown in
Figure 6.
During loading, the hollow hydraulic jack acted on the clamping piece, which transferred the tension to the test piece.
2.3. Test Methods and Control Conditions
The test referred to the Technical Code for Engineering of Ground Anchorages and Shotcrete Support. A steel bar and a GFRP bar were used as a control group. The cyclic test adopted the loading sequence shown in
Figure 7a, with multiple cyclic load levels of the steel bar and the GFRP bar. The constant load test adopted the single cyclic load method, as shown in
Figure 7b. The failure test adopted the graded loading method, as shown in
Figure 7b, until the bar was damaged. Failure criteria of the bar: ① the top part of the bar body did not converge, and ② the bar body was damaged. The load cell reading, strain value of the bar, displacement metre reading, and elongation at the top part of the jack under this level of load were recorded in the test procedures.
3. Results
3.1. Bond Damage of the Bar Interface under Cyclic Load
Figure 8 shows the test results of the relationship between the strain and load in the steel bar specimen at different depths and load.
Figure 8 shows that: (1) the larger the anchorage depth was, the smaller the bar strain would be, that is, the bar strain at 65 cm away from the zero point was generally less than that at 15 cm, which was caused by load attenuation with depth; (2) in the case of similar loads, the strain of the bar body corresponding to the subsequent cyclic load was greater than that by the previous one, resulting in the strain of the bar body increasing with the increase in the number of cycles, a phenomenon indicating that the loading cycle might aggravate the bond damage of the bar body interface; (3) when the load reaches the maximum value of the previous load, the strain of the bar body was approximately equal to the previous strain. This last phenomenon indicated that the cyclic load level had little effect on the bond damage of the bar interface when the load is not greater than the previous load.
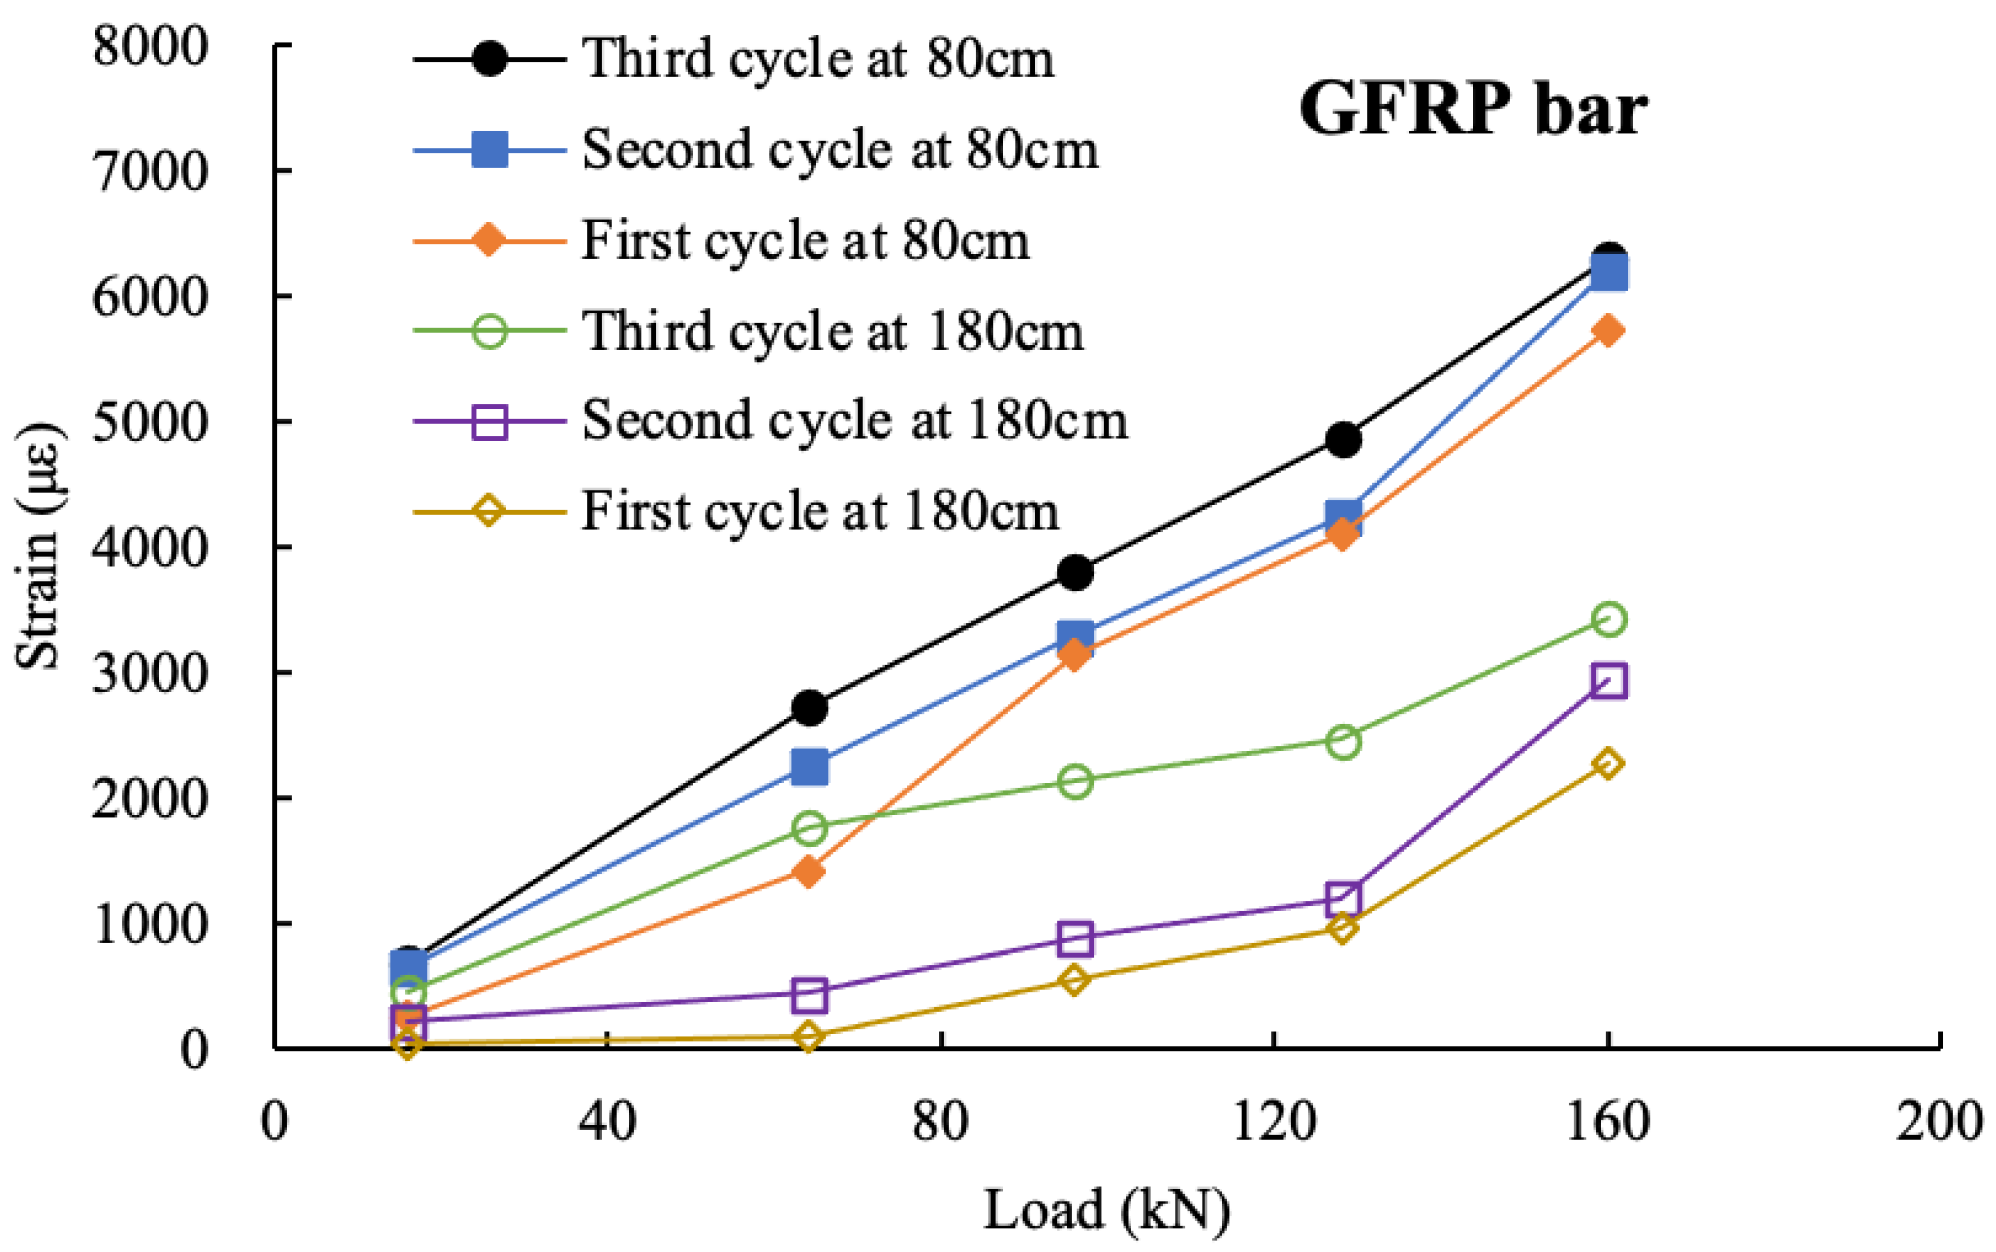
Figure 9 shows a similar phenomenon to
Figure 8 in the GFRP bar; (1) the strain at 80 cm away from the zero point is generally greater than that at 180 cm, which is caused by the attenuation of the axial force; (2) at the same depth and under the same load, the strain increases with the number of cycles, thereby indicating that cyclic load aggravates the bond damage at the bar interface; (3) when the cycle reaches the maximum value of the previous cycle, the strain is slightly larger than the previous cycle. In the actual loading process, due to the low accuracy of the jack oil gauge, it was difficult to accurately load to the exact value. When loading to the maximum, the specimen was loaded to a value slightly over the target value, and then part of the force was unloaded to reach the ideal value.
In conclusion, both steel and GFRP bar bodies in soft rock are affected by cyclic load, which can aggravate the bond damage of the bar interface. The steel and GFRP bars in soft rock are both affected by the previous maximum load, which is the main influencing factor of the bond damage of the anchorage bar, compared with the number of times of cyclic loading.
3.2. Bond Damage of the Bar Interface under a Constant Load
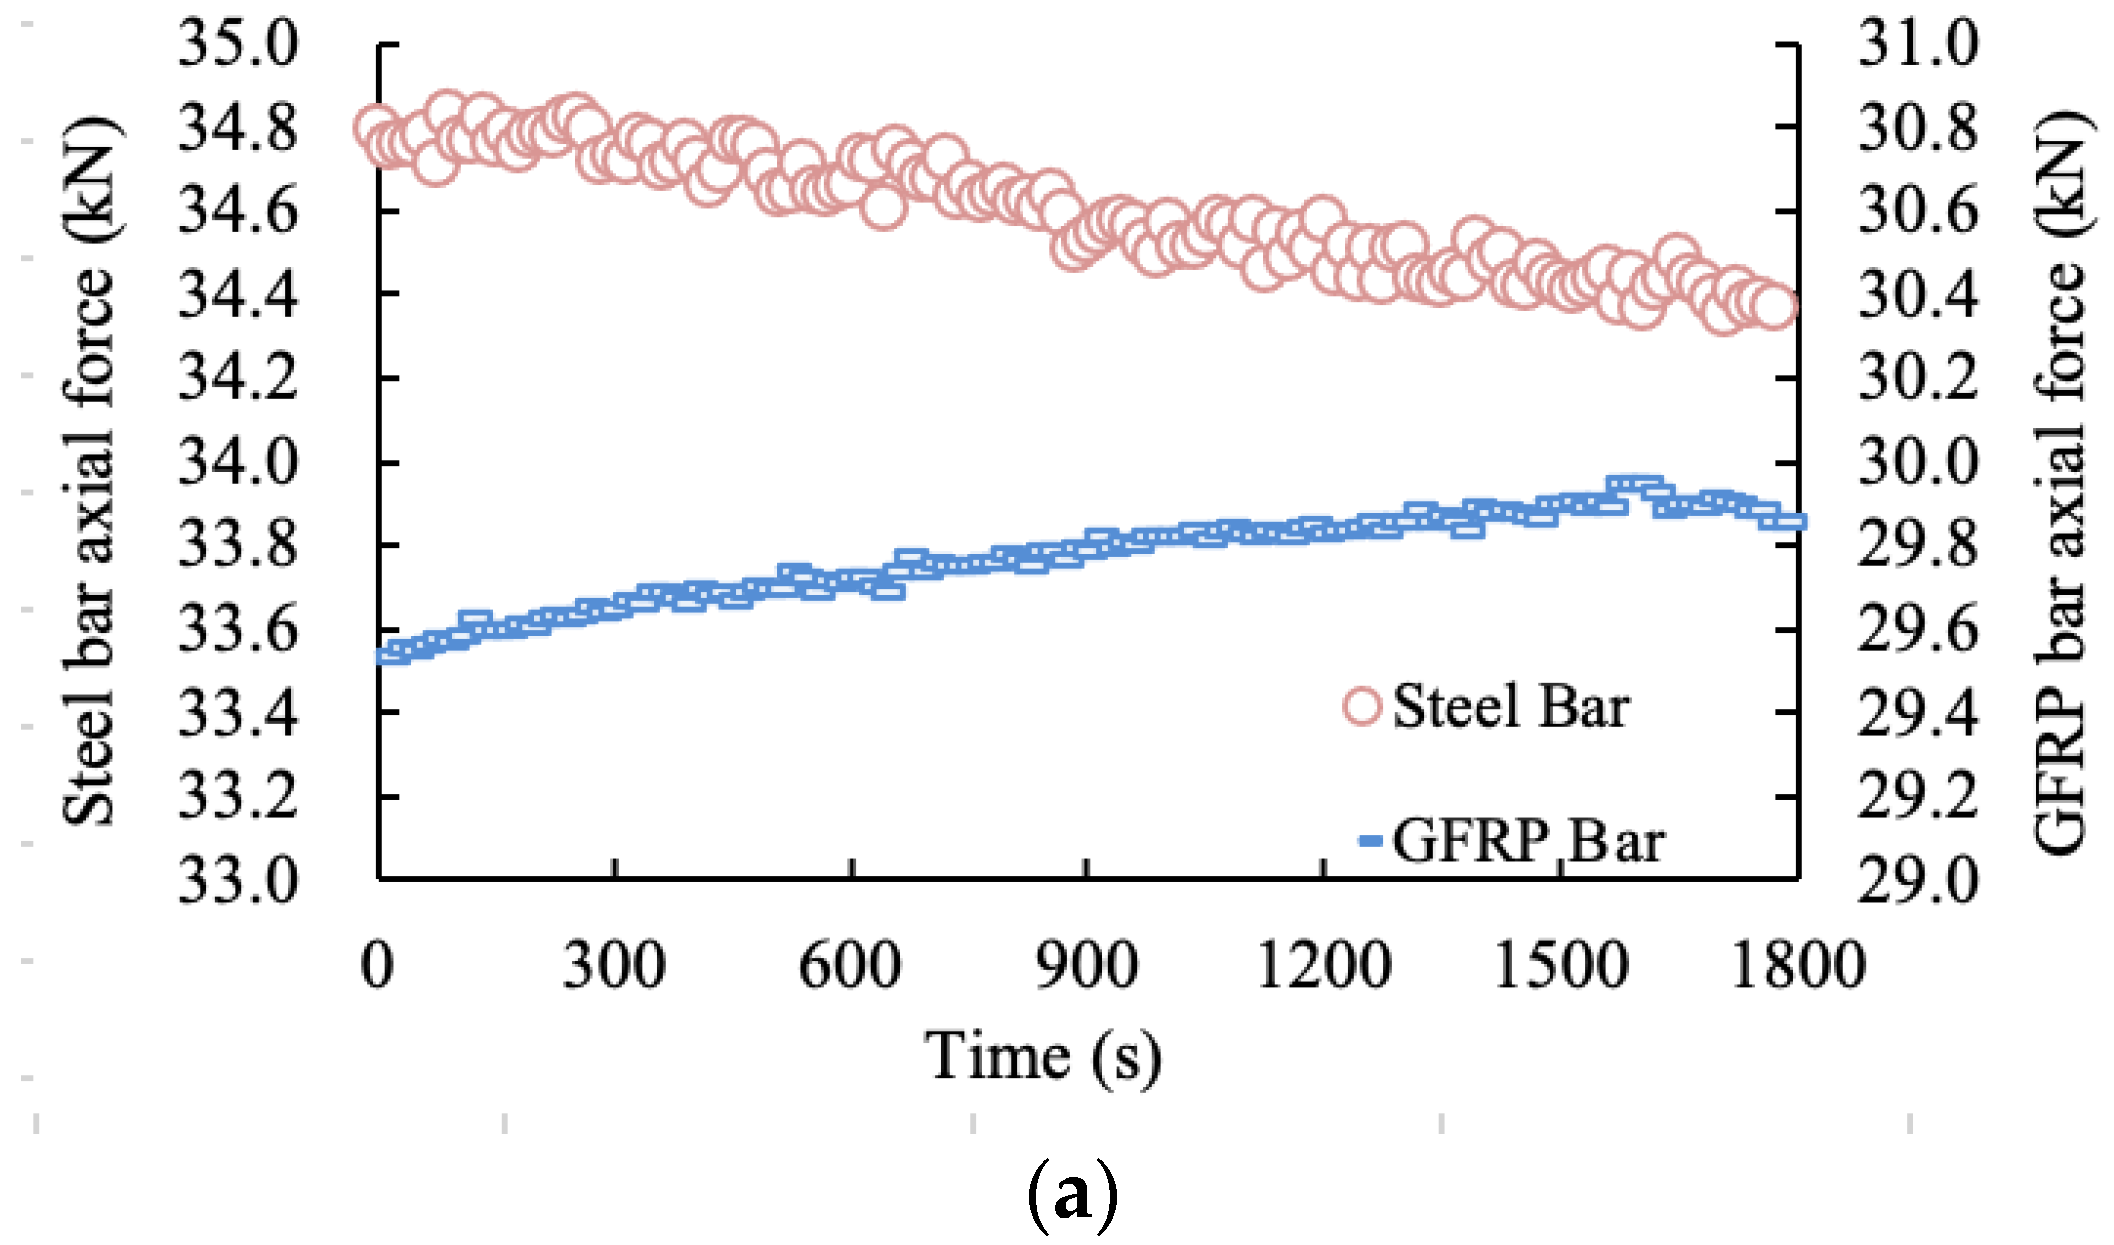
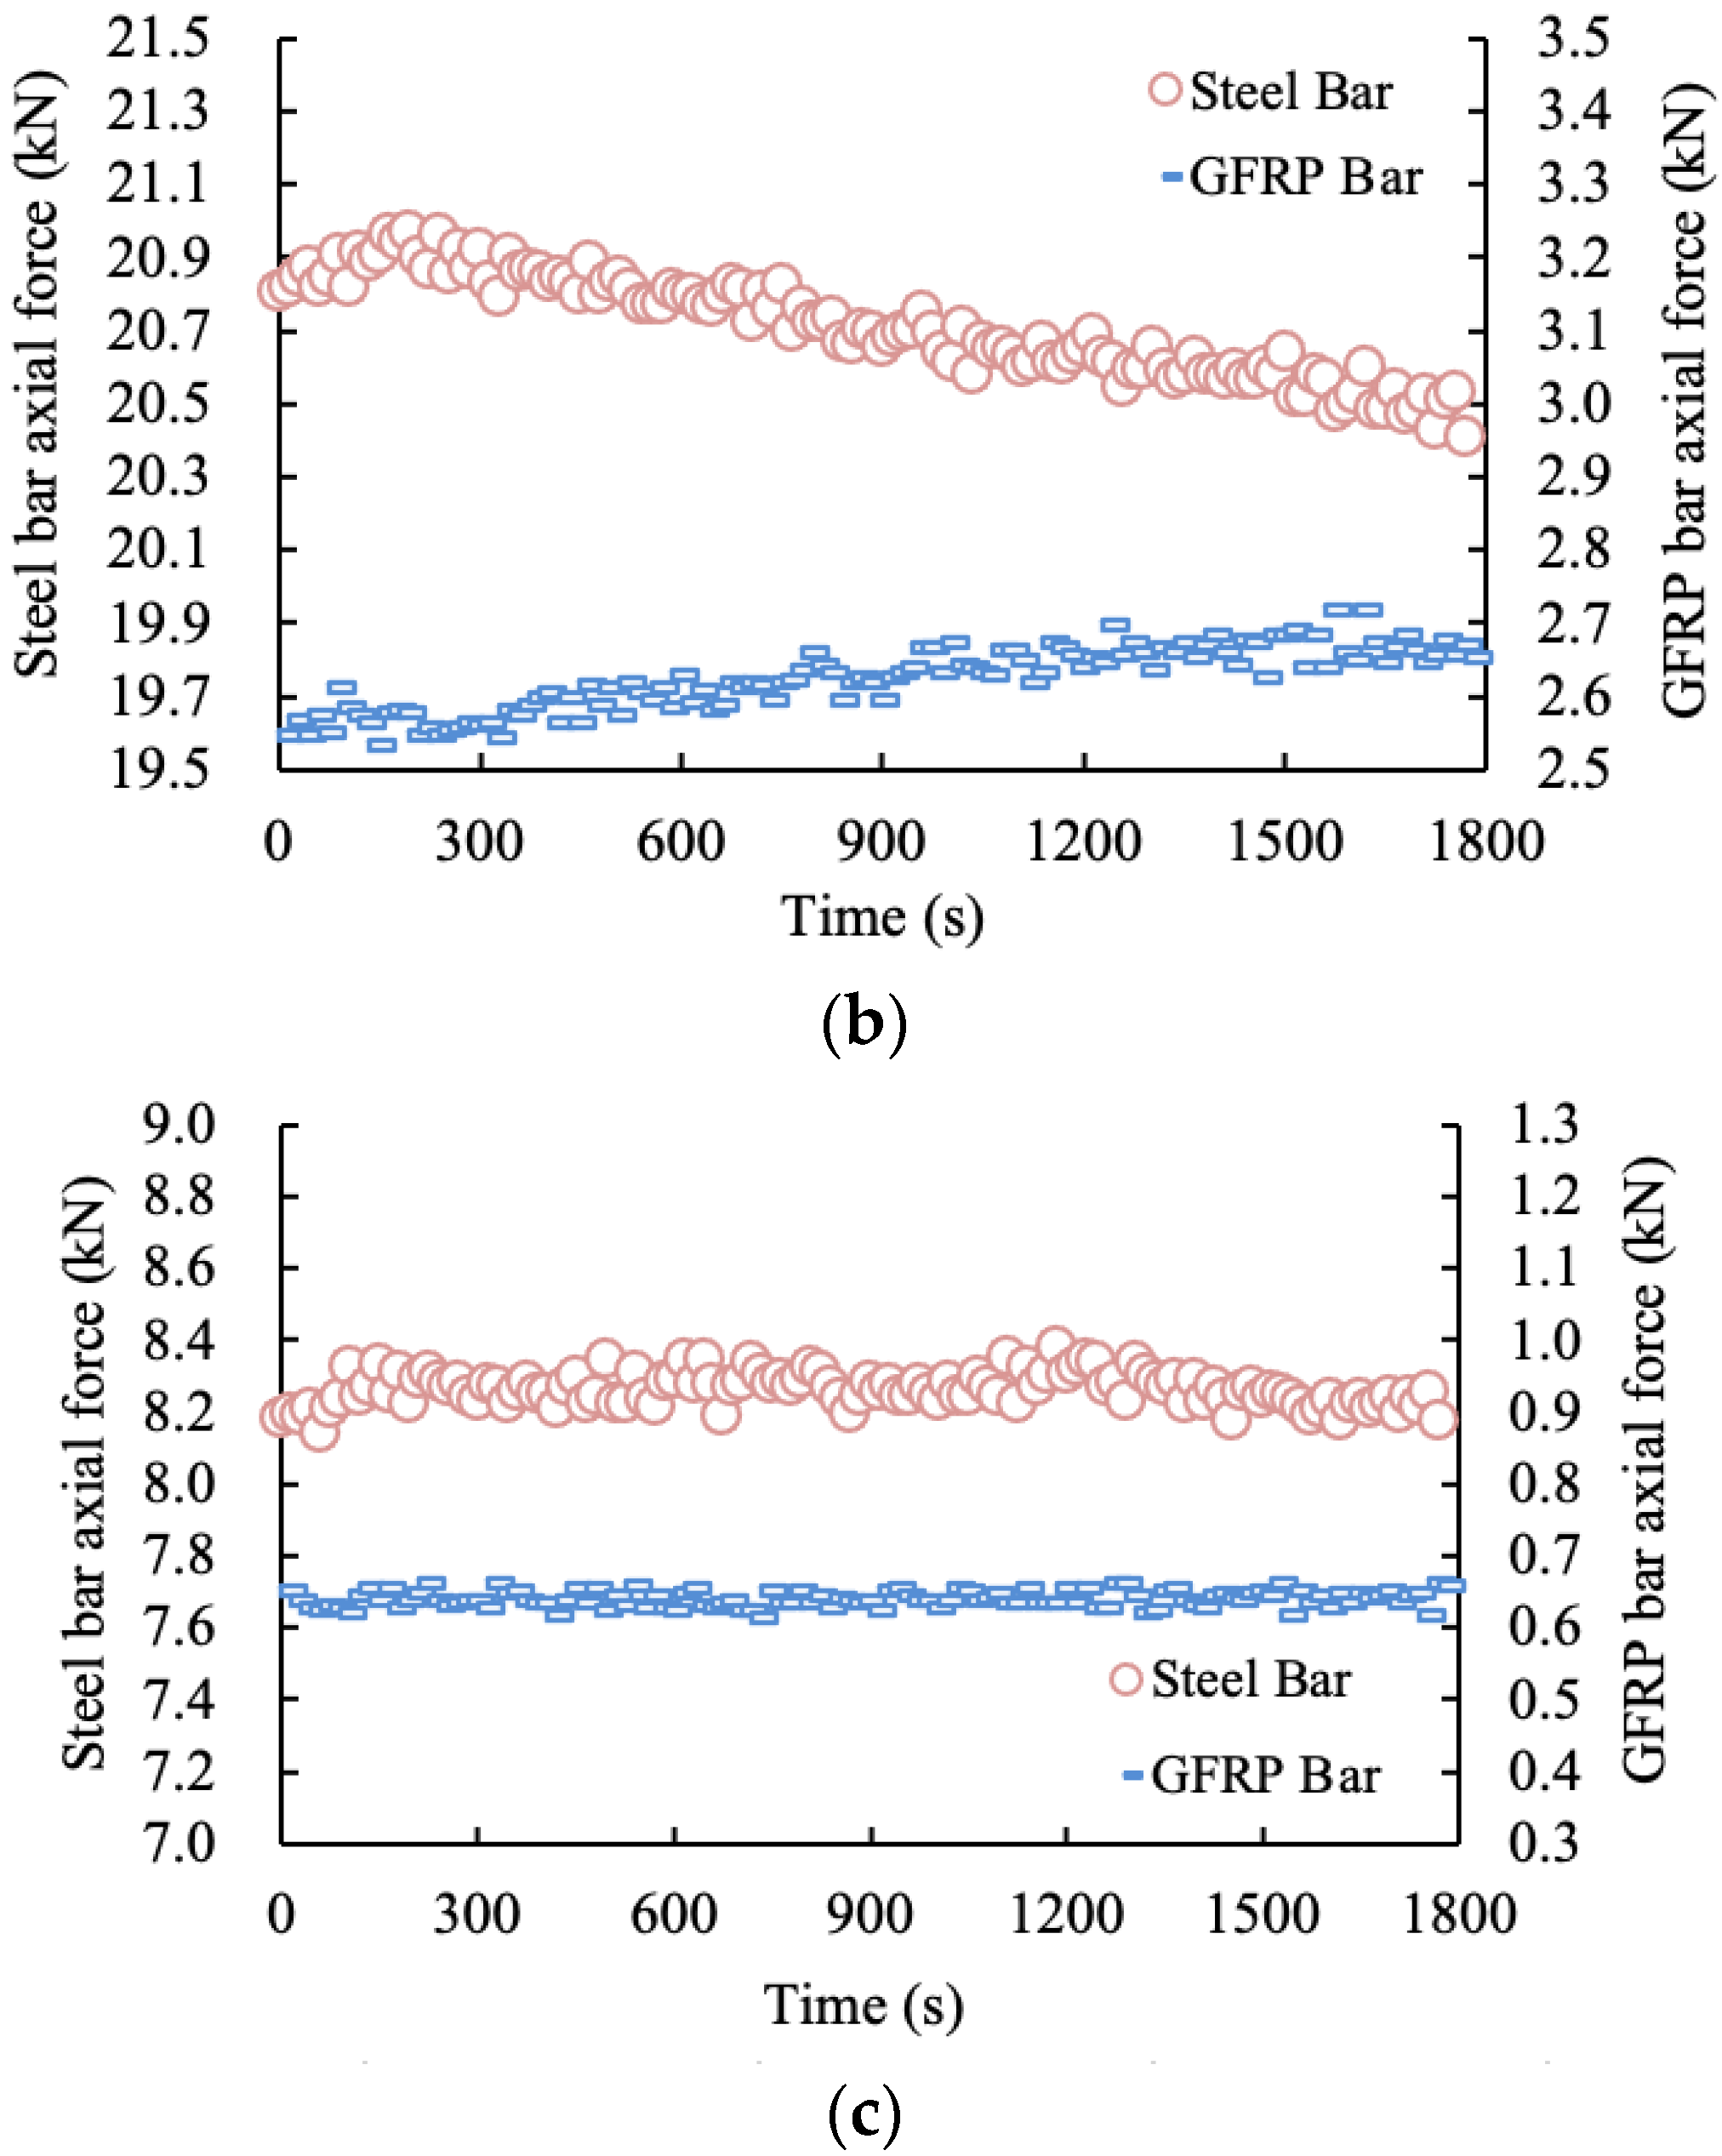
When the load of the bar was maintained at a constant value, the axial force-time curves of the bar at different anchorage depths under soft rock condition are shown in
Figure 10, including the steel and GFRP bars.
Under the condition of a constant load, when the axial force-time curve at a certain point trends upwards, it indicates that the interface bond force at this point was triggered and played a role. When the axial force-time at a certain point decreases, it indicates that the interface of the bar body at that point exhibited bond degradation, and the deformation of the bar body extended to the anchorage depth.
Figure 10a shows that the axial force of the steel bar decreased with time at 0.75 m away from the zero point of the steel bar when the tensile load was 150 kN, indicating that bond degradation of interface occurred at this point on the bar body when the tensile load was less than 150 kN. At 0.75 m away from the zero point of the GFRP bar, the axial force of the GFRP bar increased first to a peak value and then decreased with time, indicating that when the tensile load was 150 kN, the bond state of this point on the bar body appeared to degrade. Therefore, when the tensile load was 150 kN, bond degradation occurred at the bar interface 0.75 m away from the zero point. The bond between the bar and cement was destroyed, and the bond force failed. The load was borne by a friction force or biting force and transmitted along the bar to the depth of the anchorage.
As shown in
Figure 10b, when the bar was under a constant load of 150 kN, the axial force-time curve of the steel bar peaked at 1.25 m away from the zero point and then showed attenuation characteristics, indicating that the bond degradation phenomenon appeared at this point. At 1.25 m away from the zero point, the axial force-time curve of the GFRP bar showed an upward trend, indicating that the bond state at this point on the bar body was in the process of being triggered and would reach a peak or stable value in the future.
Figure 10c, shows that the axial force-time process of the steel and GFRP bar was stable at 1.75 m away from the zero point under a constant load of 150 kN, indicating that the bond state of the bar body at this point is stable and had no bond degradation [
24].
According to the above data analysis, the interface bond behaviour of the GFRP bar is better than the steel bar. The elastic modulus of the grouting body is about 30 GPa which is close to the GFRP bar. Because of the small difference in elastic modulus of GFRP bar and the grouting body, the interface bond between the GFRP bar and the grouting body can provide more efficient bond resistance which improves the performance of the anchorage system under constant loading.
3.3. Displacement of Anchorage Section under Loading
During the loading, the top displacements of the steel and the GFRP bars under the condition of soft rock and expansive soil layer were recorded. The displacement of anchorage section and other indexes are calculated, as shown in
Table 6.
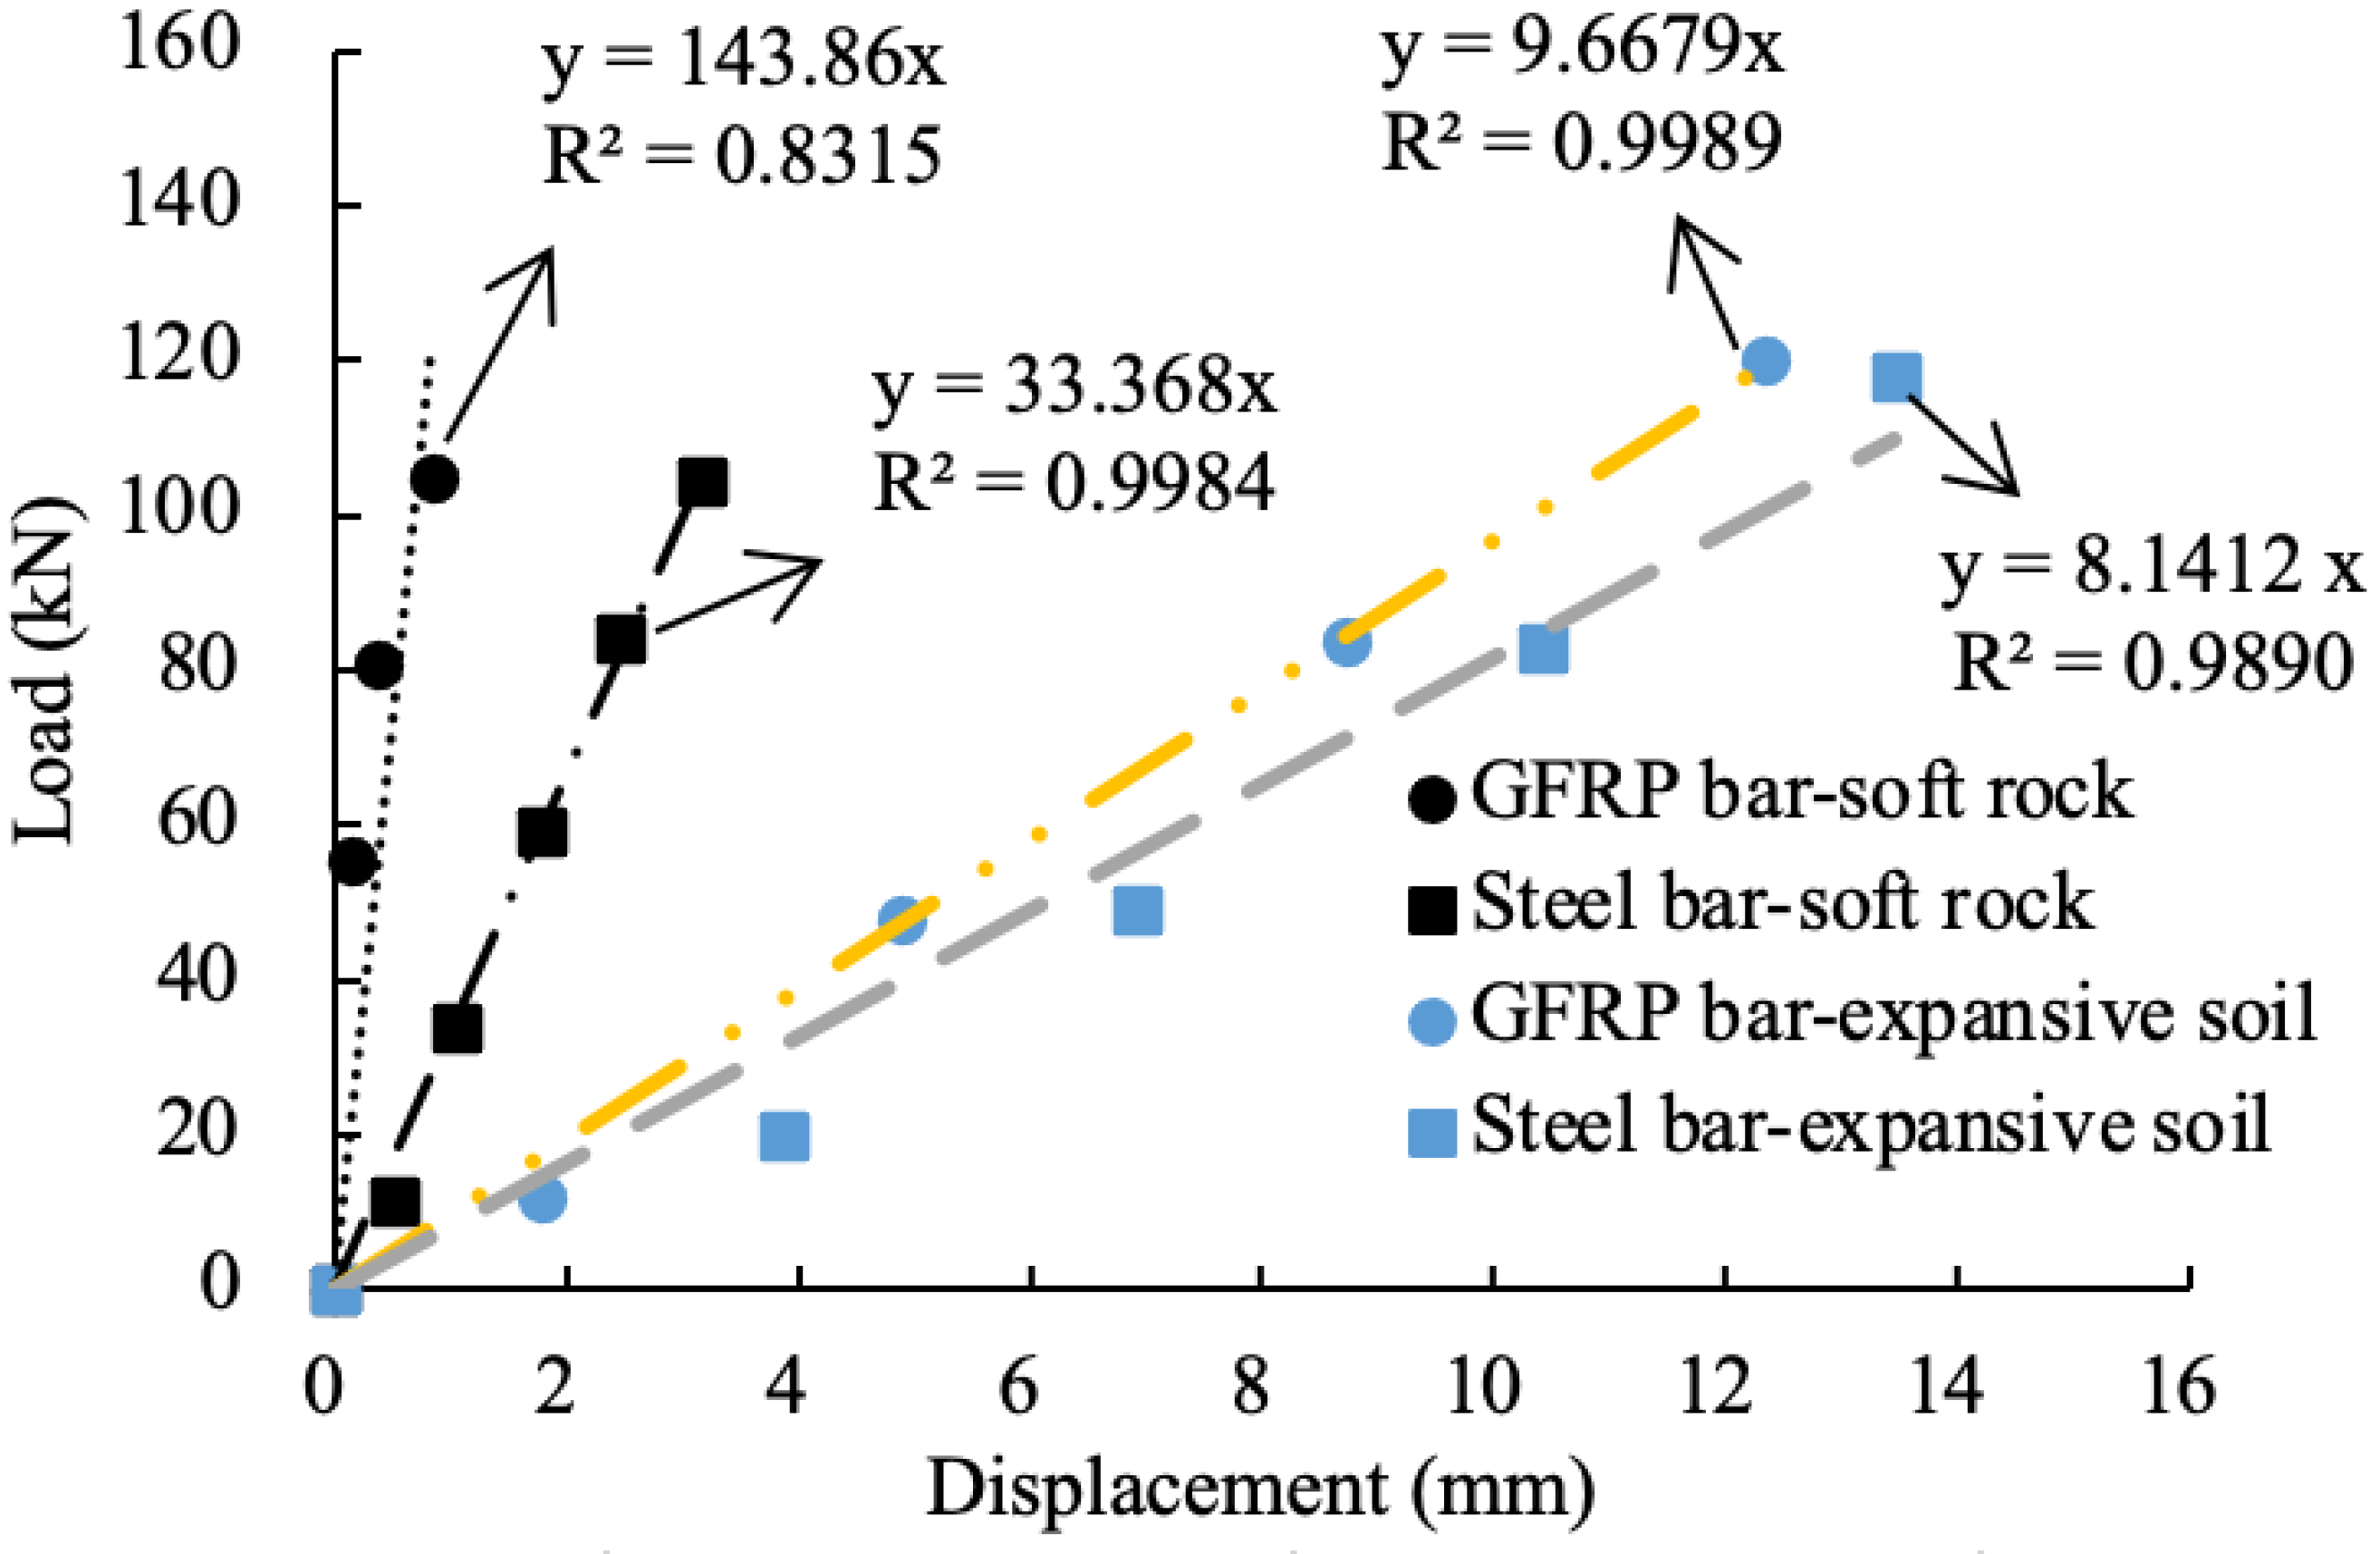
Figure 11 shows the bars displacement of anchorage section under loading, showing a linear relationship.
Figure 12 shows the gradients of displacement of anchorage section of two kinds of bars at different layers to compare the difference between the indexes of steel bar and GFRP bar in the anchorage section.
The relative difference is equal to the ratio of the difference of displacement gradient of GFRP bar and steel bar to the displacement gradient of GFRP bar, and the calculating results are shown in
Table 7. The gradient of the steel bar displacement curve is much smaller than the GFRP bar under the condition of soft rock, while the gradients are similar under the condition of expansive soil. According to
Figure 11, the small gradient means large displacement under the same load condition.
Under the condition of soft rock, the relative displacement of anchorage section of the steel bar was much larger than the GFRP bar. This is because when subjected to the same load conditions, there is a large difference in elastic modulus between the steel bar and the grouting body. Thus, the deformation coordination between the bar body and the grouting body was poor, and the interface damage was serious. The force to balance the external force was mostly concentrated in the bar body itself and the bar body interface. The average stress in the anchorage section of the bar body was 149 MPa, as shown in the
Table 6, which means that much more of the bar body participated in the deformation when subjected to tension. The elastic modulus of the grouting body is close to the GFRP bar, leading to a well-developed coordination between the bar and the grouting body. The force to balance the external force was mostly concentrated on the grouting body and the bar itself. The grouting body and the bar jointly resisted the external force. At this time, the average stress in the anchorage section of the bar was only 17 MPa, which means that only a small range of the bar body participated in the deformation. Therefore, the rate of deformation of the anchorage section of GFRP bar was much lower than the steel bar.
This also shows similar behaviour under the condition of expansive soil; however, the displacement gradients of steel bar and GFRP bar are similar. According to
Table 7, the relative difference between the steel bar and GFRP bar under soft rock conditions is about five times that under expansive soil conditions, indicating that the stress state under these two-layer conditions was different, resulting in little displacement difference between the steel bar and the GFRP bar. This is because compared with the soft rock, the void ratio of expansive soil is much larger, and the elastic modulus and strength of expansive soil are much lower, resulting in the weaker bond at the interface of the grouting body and the surrounding soil than that of the bar interface.
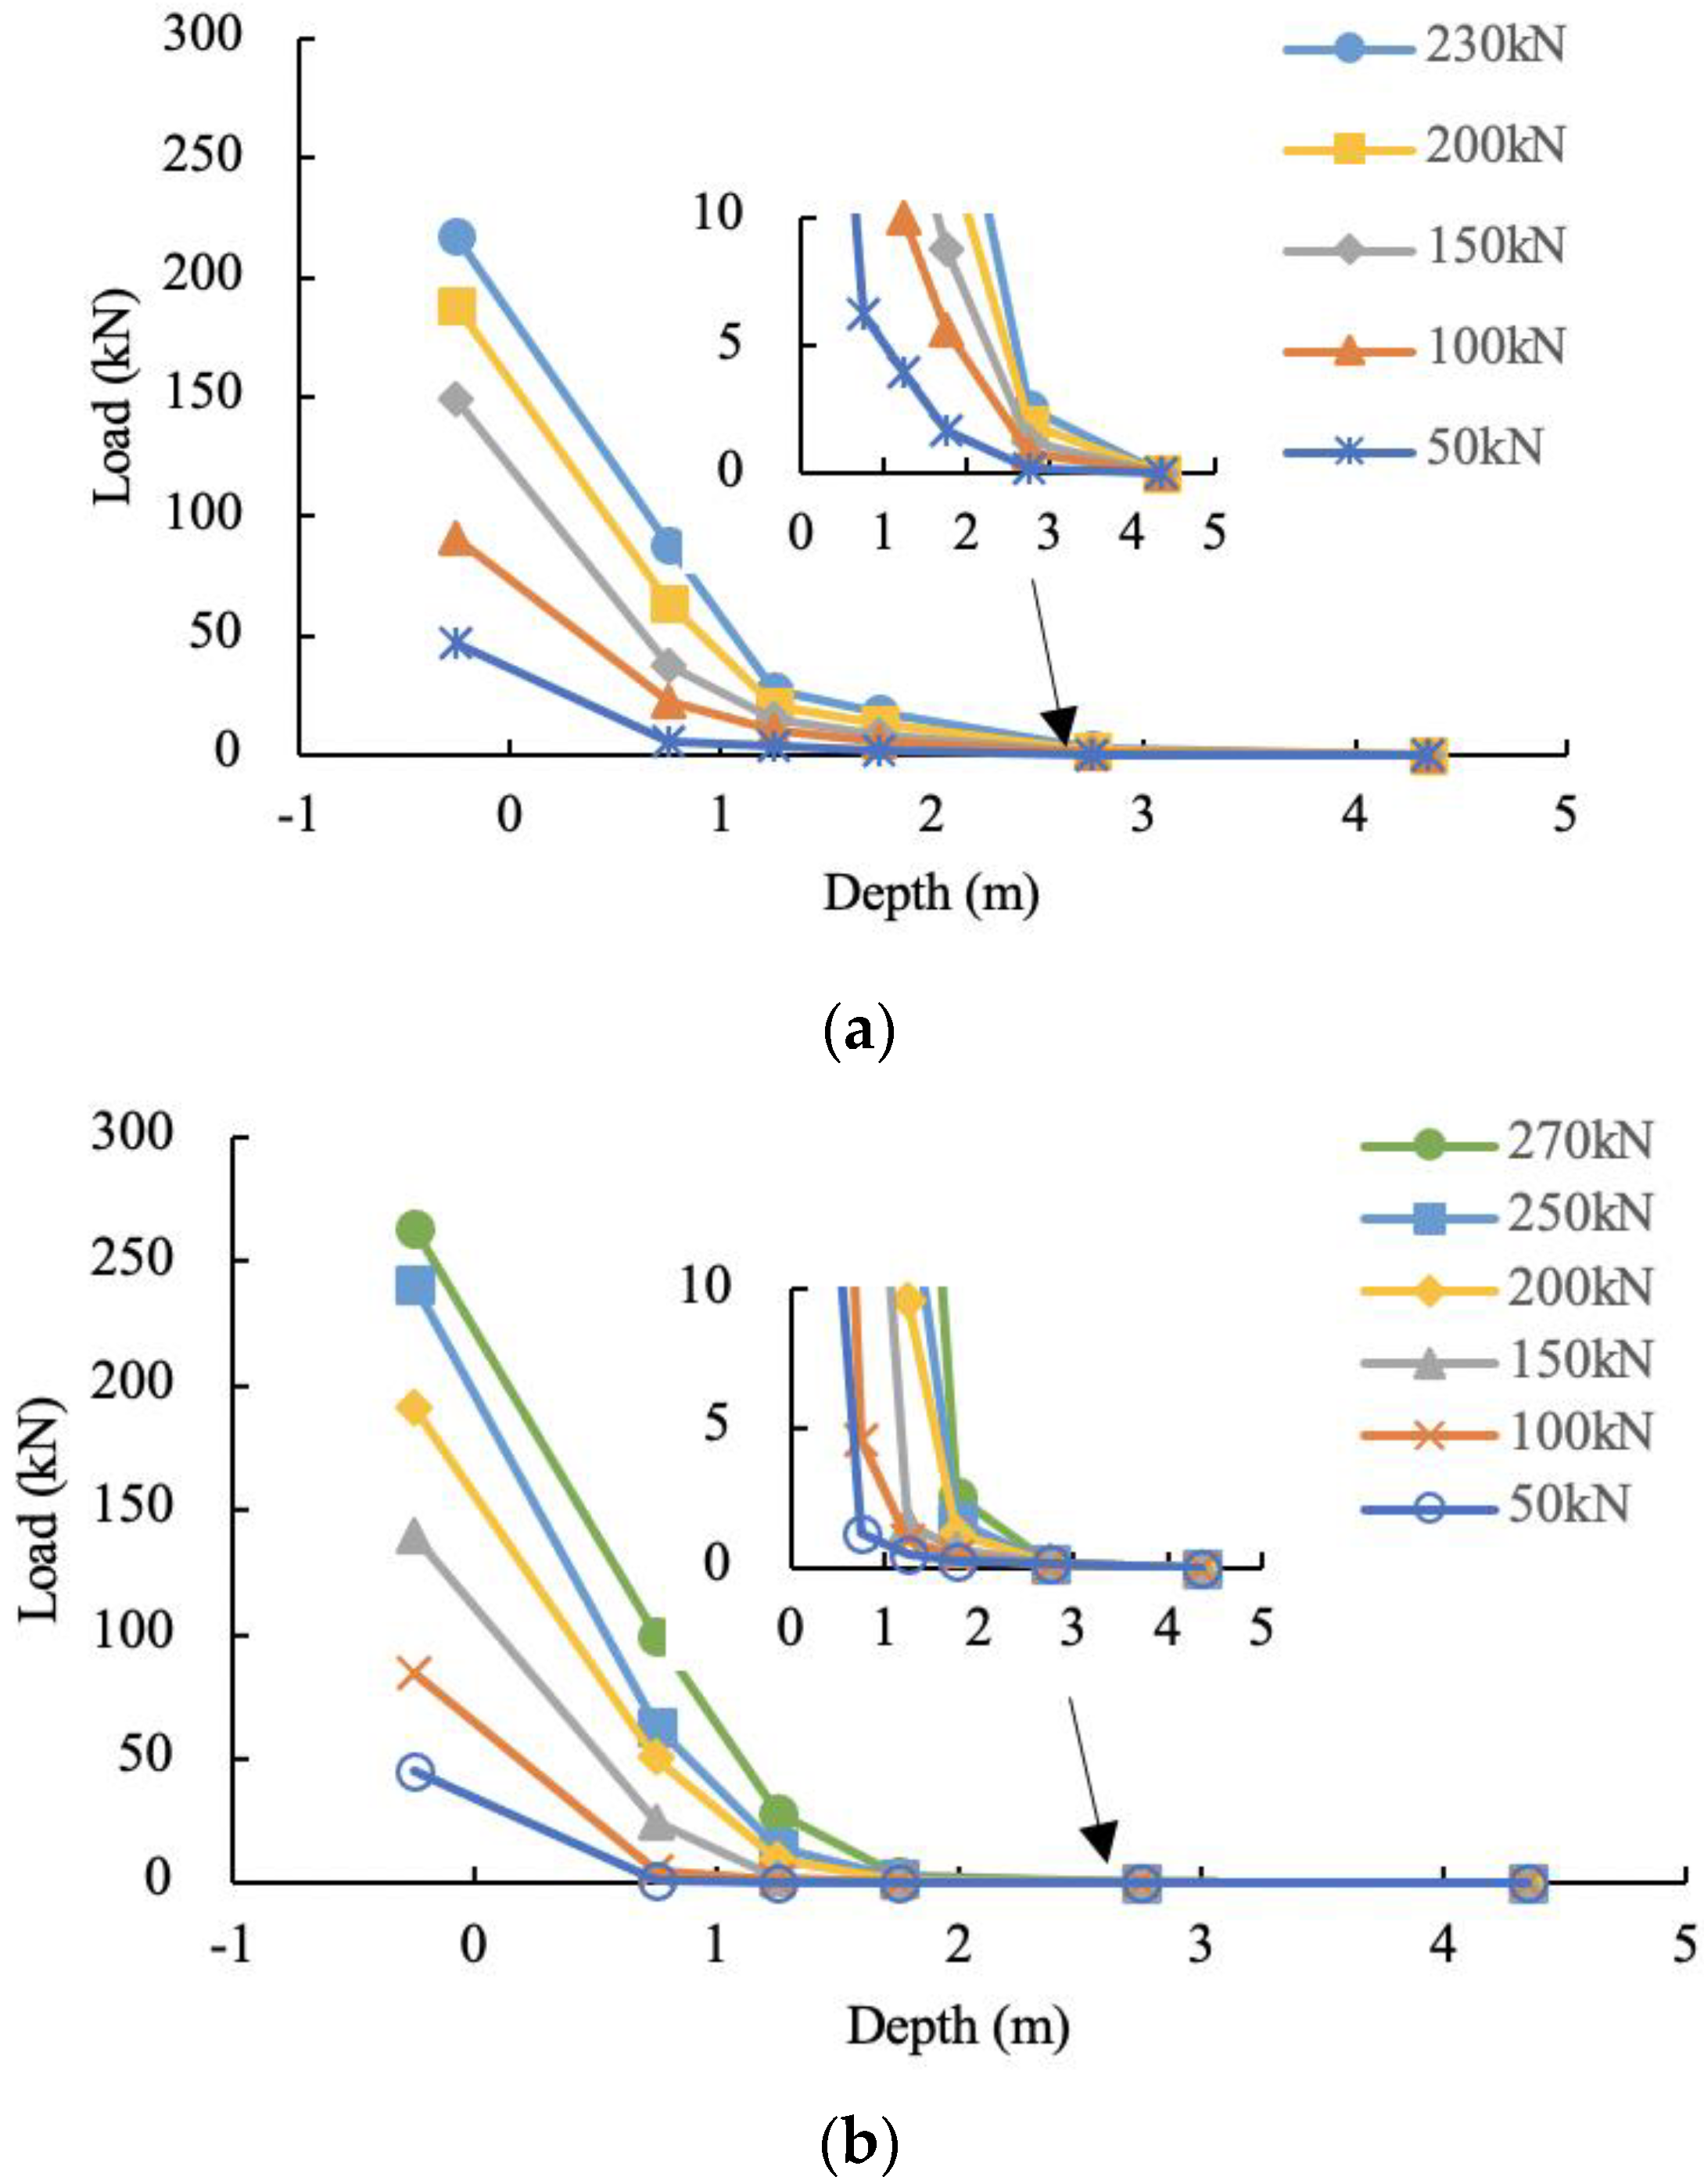
Figure 13 shows the relationship between the axial force and the anchorage depth of the two bars. It is obvious that the effective anchorage depth of the two bars is different, with the steel bar at approximately 4.35 m away from the zero point and the GFRP bar at approximately 2.75 m away from the zero point. The distribution range of the axial force of the GFRP bars was smaller than the steel bars. The elastic modulus of the GFRP bar is approximately 1/4 of the steel bar. Therefore, under the same axial force level, the deformation of the steel bar was smaller than the GFRP bar, and the sheer force of the grouting body around the steel bar was smaller. To balance the axial force of the steel bar, a longer range of the grouting body was required to provide shear. That is, under the same load condition, the damage of the grouting body in the steel anchorage system was greater than GFRP anchorage system.
In summary, the force in reinforcing soft rock slope with steel bar is mostly borne by the bar body itself and the bar body interface, while the force in strengthening soft rock slope with GFRP bar is mostly borne by the bar and the grouting body. Hence, the anchorage structure of steel bar in soft rock can generate larger interfacial relative displacement with the loading increasing than the GFRP bar in the anchorage section, even though the elastic modulus of steel is much larger than GFRP. In the expansive soil, the anchorage structure deformations of steel and GFRP bar are almost the same because of the weaker bond at the interface of the grouting body and the surrounding soil than that of the bar interface.
3.4. Bond Strength of the Bar Interface under the Ultimate Load
Table 8 shows the corresponding characteristic and phenomena of the specimens when they reached the ultimate state under tensile load.
Figure 14 shows the failure mode of the bar during the test.
Figure 15 shows the load displacement curve of the steel and GFRP bars under the soft rock slope excluding the bar body deformation of the free section.
As shown in
Table 8, the ultimate load of the steel bar was 230 kN. Compared with the strength of the steel bar itself, the ultimate stress of the steel bar body is small, therefore the failure mode of the steel bar was pulling-out failure. The ultimate load of the GFRP bar was 270 kN. Relative to the strength of the GFRP bar itself, the ultimate stress of the GFRP bar body is large, so the failure mode of the bar was fracture failure. When the anchoring system was damaged, the top part of the steel bar body moved 42 mm, and the GFRP bar body moved 39 mm. At the same time, it is observed that compared with the GFRP bar, the grouting body of steel bar is more seriously damaged. It shows that under the condition of soft surrounding rock, the anchoring system of GFRP is more intact, which will make it harder for water to enter the rock mass through cracks, resulting in the softening and disintegration of soft rock when encountering water.
To further prove the above conclusion, the bar body deformation of free section is subtracted from the displacement at the end of the bar body, so as to obtain the curve of load displacement of anchored part in
Figure 15.
Figure 15 shows that when the tensile load reached 200 kN, the gradient of the load displacement curve of the steel bar decreases rapidly and is close to zero, indicating that the deformation increased sharply, and the interface was about to reach the limit state. When the load reached 230 kN (not exceeding the strength of the bar itself), the strain measured at the deepest part of the bar was 10 με. It shows that the interface between the bar and the grouting body was very likely to produce relative slip. Combined with the analysis in
Section 3.3, the damage between the steel bar and the grouting body is extensive when the force is small. The sudden change of the gradient of the load displacement curve also occurs when the tensile load of the GFRP bar was 100 kN. This is because the length of the grouting body mobilized by GFRP bar in the early stage was small. The sheer force was concentrated and reached the limit state more quickly. Part of the bond force was transformed into friction, and the deformation of the bar body in the anchorage section continued to extend downward, resulting in large deformation. However, due to the good deformation coordination between the GFRP bar and the grouting body, the grouting body interface is not completely destroyed, while the bar body itself had reached the ultimate strength.
Figure 16 shows schematic diagrams of two kinds of bar failure.
In conclusion, under the ultimate loading of the anchorage structure in soft rock, the steel bar with 450 MPa which is less than its ultimate strength shows the failure of bar body pulling-out, while the GFRP bar with 508 MPa shows the failure of bar body fracture. The GFRP withstands loading that is higher than the ultimate load reported by the manufacturer. Thus, GFRP bars can withstand a higher ultimate load than steel bars, and the bond strength of the interface between the bar and the grouting body is relatively high under the same condition. The steel bar anchorage structure in soft rock is destroyed at the interface around the grouting body, and that of the GFRP performs satisfactorily.
4. Suggestions
For permanent anchors, due to factors such as groundwater level, they will bear more cyclic load. The performance of reinforced anchor bolts and GFRP under cyclic load is similar. Therefore, the corrosion resistance of GFRP provides guarantee for its durability.
For temporary anchors, there are many cases of bearing constant load around the foundation pit. The good deformation coordination between GFRP bar and the grouting body results in improved bond performance and better ensures the safety of the foundation pit.
Under the condition of soft rock, compared with steel bar, GFRP bar can better determine the overall anchorage system performance. In addition, GFRP can bear higher ultimate load, which is more suitable for soft rock.
5. Conclusions
In this paper, the bond damage characteristics of the steel and GFRP bar anchorage systems under three different loading conditions are studied. Through the comprehensive comparison of these characteristics, a more suitable application scenario of GFRP bolt is obtained. The specific conclusions are as follows:
(1) Both steel and GFRP bar bodies in soft rock are affected by cyclic load, and cyclic load can aggravate the bond damage of the bar interface. The steel and GFRP bars in soft rock are both affected by the previous maximum load, which is the main factor that influences the bond damage of the anchorage bar, compared with the number of cyclic loadings.
(2) The interface bond behaviour of the GFRP bar is better than the steel bar. Because of the small difference in elastic modulus of GFRP bar and the grouting body, the interface bond around the GFRP bar produces more efficient resistance of the grouting body which demonstrates a more effective anchorage performance than the steel bar under the same constant loading.
(3) The anchorage structure of steel bar in soft rock can generate larger interfacial relative displacement with the load increasing than the GFRP bar in anchorage section, even though the elastic modulus of steel is much larger than GFRP. In the expansive soil, the anchorage structure deformations of steel and GFRP bar are almost the same because of the weaker bond at the interface of the grouting body and the surrounding soil than that of the bar interface.
(4) The GFRP bar can bear a greater ultimate strength than the steel bar. Under the ultimate loading of the anchorage structure in soft rock, the steel bar with 450 MPa which is less than its ultimate strength shows the failure of the bar body pulling-out, and the GFRP bar with 508 MPa which is larger than its ultimate strength shows the failure of the bar body fracture. The steel bar anchorage structure in soft rock is destroyed at the interface around the grouting body. It can be seen from the results that the GFRP bar performs more efficiently when compared to the steel bar.
Due to time constraints, numerical simulation could not be carried out to verify the conclusion of the article. Later work will use numerical simulation and indoor model testing to verify the content of the article.
Author Contributions
X.H. (formal analysis, methodology, validation, writing original draft preparation); G.L. (formal analysis, Funding acquisition, writing-review& editing); S.K.B. (writing-review & editing; methodology). J.W. (conceptualization, supervision,). W.Y. (methodology, validation). All authors have read and agreed to the published version of the manuscript.
Funding
This research was funded by [National Natural Science Foundation of China] grant number [41472240, 51378008].
Data Availability Statement
Not applicable.
Acknowledgments
The authors wish to express their gratitude and sincere appreciation for the financial support received from the National Natural Science Foundation of China (Grant No. 41472240, 51378008).
Conflicts of Interest
The authors declare no conflict of interest.
References
- Zhang, W.; Wang, L.; Song, Y.; Tan, Y. Experimental study on the mechanical properties of grouted rock bolts subjected to sulfate attack and freeze-thaw cycling. Constr. Build. Mater. 2021, 291, 123391. [Google Scholar] [CrossRef]
- Yuan, J.; Ye, C.; Yang, J.; Xie, Z.; Liu, J.; Wang, S.; Liu, Y. Experimental and numerical investigation on the deterioration mechanism for grouted rock bolts subjected to freeze–thaw cycles. Bull. Eng. Geol. Environ. 2021. prepublish. [Google Scholar] [CrossRef]
- Wang, Q.; Wang, F.; Ren, A.; Peng, R.; Li, J.; Neves, L.C. Corrosion Behavior and Failure Mechanism of Prestressed Rock Bolts (Cables) in the Underground Coal Mine. Adv. Civ. Eng. 2021, 2021, 6686865. [Google Scholar] [CrossRef]
- Bylapudi, G.; Spearing, A.S.; Mondal, K.; Bhagwat, A. Design and evaluation of the roof bolt corrosion test system in a simulated underground coal mine environment. Min. Eng. 2020, 72, 43–44. [Google Scholar] [CrossRef]
- Bylapudi, G.; Mondal, K.; Spearing, A.J.; Bhagwat, A. Corrosion properties of ASTM A615 rock bolt steel in US underground coal mines. Min. Technol. 2020, 129, 135–150. [Google Scholar] [CrossRef]
- Jiang, S.H.; Li, D.Q.; Zhang, L.M.; Zhou, C.B. Time-dependent system reliability of anchored rock slopes considering rock bolt corrosion effect. J. Eng. Geol. 2014, 175, 1–8. [Google Scholar]
- Tang, X.X.; Luo, X.Y.; Sun, Q.; Kuang, Y.C. Test Research on Mechanical Property of GFRP Bolt under Freeze-Thaw Cycle Conditions. Key Eng. Mater. 2013, 531, 689–694. [Google Scholar] [CrossRef]
- Tang, X.X.; Luo, X.Y.; Li, K.L.; Kuang, Y.C. Test Research on Bonding Strength between GFRP Anchor Bolt and Concrete under Corrosive Conditions. Appl. Mech. Mater. 2012, 212, 904–911. [Google Scholar] [CrossRef]
- Luo, X.Y.; Tang, X.X.; Li, K.L.; Kuang, Y.C. Test on Corrosion Resistance of GFRP Anchor Bolt. Adv. Mater. Res. 2012, 535, 1927–1935. [Google Scholar] [CrossRef]
- Jeremic, N.; Sheikh, S.A. Performance of Glass Fiber-Reinforced Polymer Bent Bars. ACI Struct. J. 2021, 118, 273–285. [Google Scholar]
- Chen, Z.; Zheng, L.; Jin, Q.; Li, X. Durability study on glass fiber reinforced polymer soil nail via accelerated aging test and long-term field test. Polym. Compos. 2017, 38, 2863–2873. [Google Scholar] [CrossRef]
- Mahato, K.K.; Dutta, K.; Ray, B.C. High-temperature tensile behavior at different crosshead speeds during loading of glass fiber-reinforced polymer composites. J. Appl. Polym. Sci. 2017, 134, 44715. [Google Scholar] [CrossRef]
- Ahmad Sawpan, M. Effects of alkaline conditioning and temperature on the properties of glass fiber polymer composite rebar. Polym. Compos. 2016, 37, 3181–3190. [Google Scholar] [CrossRef]
- Sousa, J.M.; Correia, J.R.; Cabral-Fonseca, S. Durability of Glass Fibre Reinforced Polymer Pultruded Profiles: Comparison between QUV Accelerated Exposure and Natural Weathering in a Mediterranean Climate. Exp. Tech. 2016, 40, 207–219. [Google Scholar] [CrossRef]
- Chowdhury, E.U.; Eedson, R.; Bisby, L.A.; Green, M.F.; Benichou, N. Mechanical Characterization of Fibre Reinforced Polymers Materials at High Temperature. Fire Technol. 2011, 47, 1063–1080. [Google Scholar] [CrossRef]
- Kuang, Y.C.; Ou, L.W.; Hu, J.X. Experimental and Numerical Analysis on the Bonding Performance of GFRP Bolts. Appl. Mech. Mater. 2015, 777, 166–172. [Google Scholar] [CrossRef]
- Henin, E.; Morcous, G. Bond behavior of helically wrapped sand coated deformed Glass Fiber-Reinforced Polymer (GFRP) bars in concrete. Constr. Build. Mater. 2021, 288, 123120. [Google Scholar] [CrossRef]
- Benmokrane, B.; Xu, H.; Bellavance, E. Bond strength of cement grouted glass fibre reinforced plastic (GFRP) anchor bolts. Int. J. Rock Mech. Min. Sci. Geomech. Abstr. 1996, 33, 455–465. [Google Scholar] [CrossRef]
- Barcikowski, M.; Lesiuk, G.; Czechowski, K.; Duda, S. Static and Flexural Fatigue Behavior of GFRP Pultruded Rebars. Materials 2021, 14, 297. [Google Scholar] [CrossRef]
- Li, G.; Pei, H.; Hong, C. Study on the Stress Relaxation Behavior of Large Diameter B-GFRP Bars Using FBG Sensing Technology. Int. J. Distrib. Sens. Netw. 2013, 9, 201767. [Google Scholar]
- Li, G.W.; Ni, C.; Pei, H.F.; Ge, W.M.; Ng, C.W.W. Stress relaxation of larger diameter B-GFRP soil nail element grouted along body. China Ocean. Eng. 2013, 27, 495–508. [Google Scholar] [CrossRef]
- Ministry of Construction People’s Republic of China. GB50021-2001 Code for Investigation of Geotechnical Engineering; China Architecture & Building Press: Beijing, China, 2009; Volume 8.
- Li, G.; He, X.; Wu, J.; Chen, W.; Xiong, L.; Cao, X. Insitu test on bond fatigue characteristics of bolts for reinforcing soft shaly sandstone slopes. Chin. J. Rock Mech. Eng. 2020, 39, 1729–1738. (In Chinese) [Google Scholar]
- Li, G.; Yu, W.; Li, F.; Wu, J.; Cao, X.; Yuan, J.; Wang, J. Experiment on the difference of load bearing of GFRP and steel bars in soft-rock slopes of water diversion from Yangtze to Huai. Chin. J. Rock Mech. Eng. 2018, 37, 601–610. (In Chinese) [Google Scholar]
Figure 1.
Location of the test site.
Figure 1.
Location of the test site.
Figure 2.
Stratigraphic profile of the testing bar.
Figure 2.
Stratigraphic profile of the testing bar.
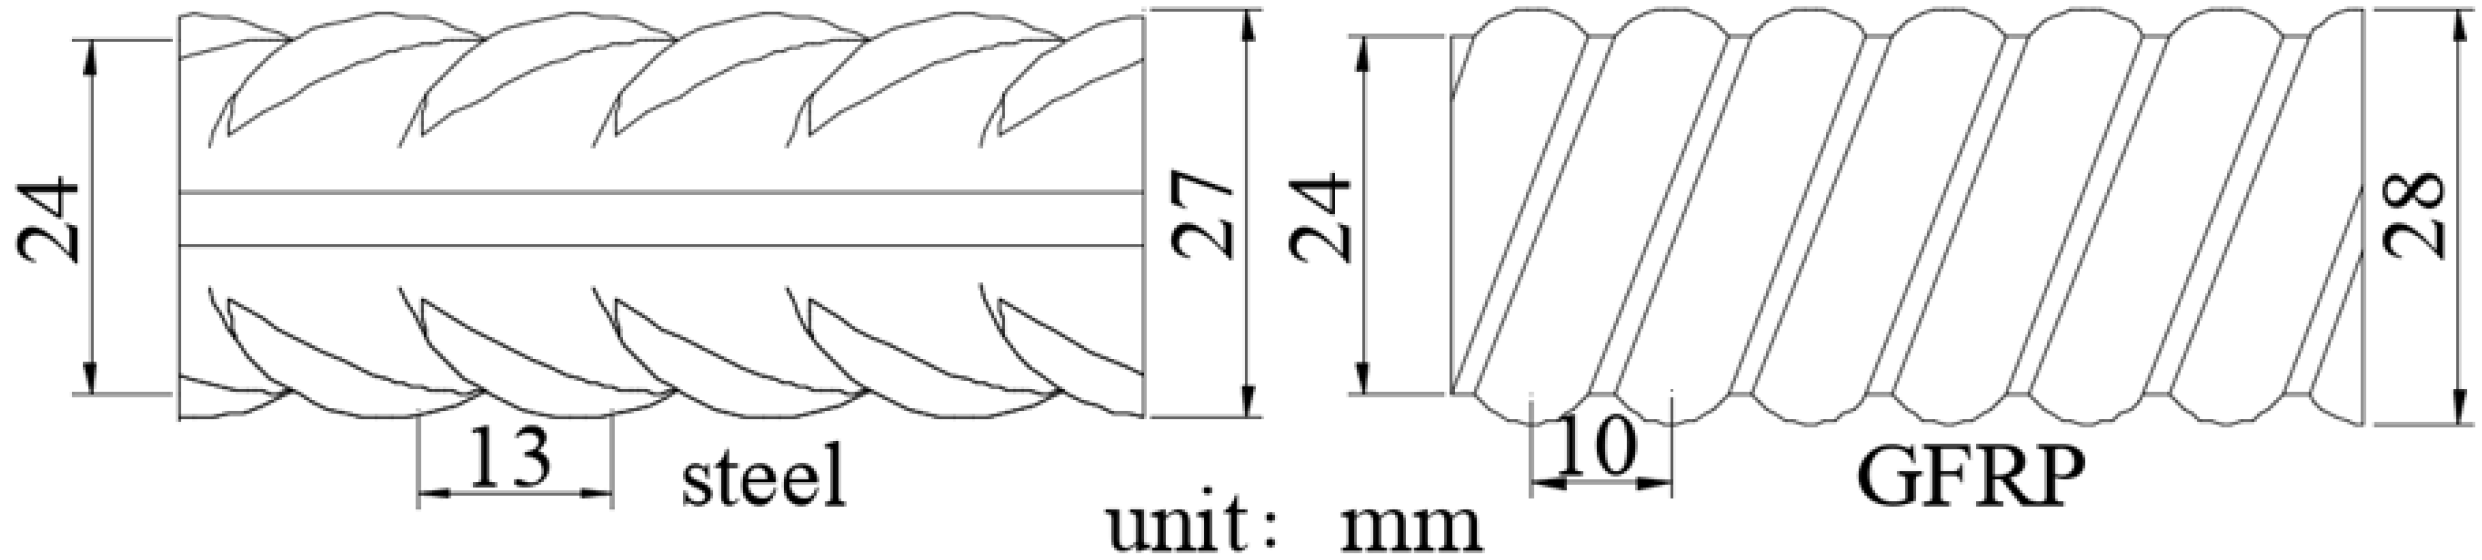
Figure 3.
Surface properties of the steel and GFRP bar.
Figure 3.
Surface properties of the steel and GFRP bar.
Figure 4.
Installation of the Fibre Bragg Grating Sensor. (a) Position of Fibre Bragg Grating Sensor (b) Coordinate axis of Fibre Bragg Grating Sensor.
Figure 4.
Installation of the Fibre Bragg Grating Sensor. (a) Position of Fibre Bragg Grating Sensor (b) Coordinate axis of Fibre Bragg Grating Sensor.
Figure 5.
Bolt installation and concrete pile cap. (a) Bolt installation (b) Concrete pile cap.
Figure 5.
Bolt installation and concrete pile cap. (a) Bolt installation (b) Concrete pile cap.
Figure 6.
Test device. (a) Schematic diagram of the testing device (b) Field drawing of the testing device.
Figure 6.
Test device. (a) Schematic diagram of the testing device (b) Field drawing of the testing device.
Figure 7.
Test loading curve of the steel and GFRP bar. (a) Loading curve of the cyclic test (b) Loading curve of the constant load test and destruction test.
Figure 7.
Test loading curve of the steel and GFRP bar. (a) Loading curve of the cyclic test (b) Loading curve of the constant load test and destruction test.
Figure 8.
Strain-load relationship curve of the steel bar at 15 cm and 65 cm away from the zero point [
23].
Figure 8.
Strain-load relationship curve of the steel bar at 15 cm and 65 cm away from the zero point [
23].
Figure 9.
Strain-load relationship curve of the GFRP bar at anchorage depths of 80 cm and 180 cm.
Figure 9.
Strain-load relationship curve of the GFRP bar at anchorage depths of 80 cm and 180 cm.
Figure 10.
Strain-time curve of each point of the bar body under constant load 150 kN. (a) Anchorage depth at 0.75 m away from the zero point. (b) Anchorage depth at 1.25 m away from the zero point. (c) Anchorage depth at 1.75 m away from the zero point.
Figure 10.
Strain-time curve of each point of the bar body under constant load 150 kN. (a) Anchorage depth at 0.75 m away from the zero point. (b) Anchorage depth at 1.25 m away from the zero point. (c) Anchorage depth at 1.75 m away from the zero point.
Figure 11.
Bars displacement of anchorage section under loading.
Figure 11.
Bars displacement of anchorage section under loading.
Figure 12.
Gradients of displacement curve of anchorage section.
Figure 12.
Gradients of displacement curve of anchorage section.
Figure 13.
Curve of the bar anchorage depth. (a) Steel Bar. (b) GFRP Bar.
Figure 13.
Curve of the bar anchorage depth. (a) Steel Bar. (b) GFRP Bar.
Figure 14.
Failure mode of the bar body. (a) Failure mode of the GFRP bar (b) Failure mode of the steel bar.
Figure 14.
Failure mode of the bar body. (a) Failure mode of the GFRP bar (b) Failure mode of the steel bar.
Figure 15.
Load displacement curve of the bar excluding the bar body deformation of free section.
Figure 15.
Load displacement curve of the bar excluding the bar body deformation of free section.
Figure 16.
Schematic diagram of bars failure. (a) Schematic diagram of the steel bar failure. (b) Schematic diagram of the GFRP bar failure.
Figure 16.
Schematic diagram of bars failure. (a) Schematic diagram of the steel bar failure. (b) Schematic diagram of the GFRP bar failure.
Table 1.
Physical and mechanical properties of argillaceous sandstone.
Table 1.
Physical and mechanical properties of argillaceous sandstone.
Density
/(g·cm−3) | Specific
Gravity | Moisture
Content/% | Elastic
Modulus/GPa | Poisson’s Ratio | Compressive Strength/MPa | Shear Strength
(Total Stress) |
|---|
| c/kPa φ/(°) |
|---|
| 2.25 | 2.60 | 2.3 | 0.6 | 0.30 | 5.0 | 250 0.50 |
Table 2.
Physical and mechanical indexes of expansive soil.
Table 2.
Physical and mechanical indexes of expansive soil.
Density
/(g·cm−3) | Specific
Gravity | Moisture Content/% | Void Ratio | Liquid Limit/% | Plastic Limit/% | Compression
Modulus/MPa | Shear Strength
(Total Stress) |
|---|
| c/kPa φ/(°) |
|---|
| 2.02 | 2.72 | 22.3 | 0.636 | 34.6 | 21.3 | 8.45 | 38.4 17.9 |
Table 3.
Mechanical properties of the steel bar.
Table 3.
Mechanical properties of the steel bar.
| Diameter/mm | Flutes Pitch
/mm | Tensile Strength
/MPa | Elastic Modulus
/GPa |
|---|
| Highest Point of Thread | Lowest Point of Thread |
|---|
| 27 | 24 | 13 | 470 | 205 |
Table 4.
Mechanical properties of the GFRP bar.
Table 4.
Mechanical properties of the GFRP bar.
| Diameter/mm | Flutes Pitch
/mm | Glass Fibre
/% | Resin
/% | Tensile Strength
/MPa | Elastic Modulus
/GPa |
|---|
| Highest Point of Thread | Lowest Point of Thread |
|---|
| 28 | 24 | 10 | 77 | 23 | 450 | 54 |
Table 5.
Testing bar arrangement.
Table 5.
Testing bar arrangement.
| Specimen Type | Specimen Number | Geological Conditions | Test Type | Number |
|---|
| Steel | S-1 | Argillaceous sandstone layer | Cyclic test | 1 |
| S-2 | Argillaceous sandstone layer | Constant load test | 1 |
| S-3 | Expansive soil layer | Constant load test | 1 |
| S-4 | Argillaceous sandstone layer | Destruction test | 1 |
| GFRP | G-1 | Argillaceous sandstone layer | Cyclic test | 1 |
| G-2 | Argillaceous sandstone layer | Constant load test | 1 |
| G-3 | Expansive soil layer | Constant load test | 1 |
| G-4 | Argillaceous sandstone layer | Destruction test | 1 |
Table 6.
State characteristics of anchorage section under loading.
Table 6.
State characteristics of anchorage section under loading.
| Geological Conditions | Specimen Type | Load/kN | Length of Free Section
/m | Total Displacement
/mm | Free Section Displacement/mm | Displacement of Anchorage Section
/mm | Effective Anchorage Depth
/m | Average Stress /MPa |
|---|
| Soft rock | Steel | 104 | 0.6 | 3.82 | 0.65 | 3.17 | 4.35 | 149 |
| GFRP | 105 | 0.3 | 1.95 | 1.10 | 0.85 | 2.75 | 17 |
| Expansive soil | Steel | 118 | 0.6 | 14.19 | 0.73 | 13.46 | 4.35 | / |
| GFRP | 120 | 0.3 | 13.60 | 1.26 | 12.34 | 4.35 | / |
Table 7.
Statistics of relative difference of various indexes.
Table 7.
Statistics of relative difference of various indexes.
| Geological Conditions | Specimen Type | Gradients of Displacement Curve of Anchorage Section | Relative Difference/%
|
|---|
| Soft rock | Steel | ) | 77 |
| GFRP | |
| Expansive soil | Steel | ) | 16 |
| GFRP | |
Table 8.
Limit state characteristics of the bar body in the field pulling-out test.
Table 8.
Limit state characteristics of the bar body in the field pulling-out test.
| Specimen Type | Anchor Hole Diameter
/mm | Ultimate Tensileload
/kN | Ultimate Stress
/MPa | Top Displacement of the Bar
/mm | Bond Strength
/MPa | Ultimate State Test Phenomenon |
|---|
| Steel Bar | 110 | 230 | 450 | 42 | 0.59 | Under pressure, the load of the bar did not increase. The top displacement of the bar continued to increase. The bar and the grouting body showed traces of slip. |
| GFRP Bar | 110 | 270 | 508 | 39 | 1.75 | After the “jumping” sound, the pressure gauge reading instantly attenuated. The top displacement of the bar continued to increase. The bar body fractures, and the fibre collapsed. |
| Publisher’s Note: MDPI stays neutral with regard to jurisdictional claims in published maps and institutional affiliations. |
© 2021 by the authors. Licensee MDPI, Basel, Switzerland. This article is an open access article distributed under the terms and conditions of the Creative Commons Attribution (CC BY) license (https://creativecommons.org/licenses/by/4.0/).


