1. Introduction
Autonomous underwater vehicles (AUV) are a type of unmanned underwater vehicle (UUV) which are irreplaceable in a variety of deep-sea resource surveys. With the rapid advancement of technology, AUV has been vigorously developed and is increasingly being valued by military marine technology departments in developed countries. However, some technologies still need to be improved, such as motion control, navigation, and power supply, etc., where power technology plays a crucial role in the completion of AUV tasks [
1].
However, AUVs cannot perform long-term underwater missions because of their limited energy storage [
2]. In recent years, the development of power systems and new energy sources has made considerable strides thanks to the efforts of various institutions and scientists. Currently, the solutions for power sources fall into three main categories, including batteries, docking stations and environmental energy [
3]. Among them, the battery power supply includes primary batteries [
4], secondary batteries [
5], fuel cells [
6], semi-fuel cells [
7] and a hybrid power system of batteries [
8], which have the advantages of a small size, high energy density, and direct power supply. However, its energy is limited, battery leakage can cause pollution to the marine environment, and it takes too long to replace the battery. Docking stations can extend the service time of the AUVs, thus ensuring mission accomplishment. However, AUVs need an additional navigation system to reach the designated site, which increases commercial costs. Environmental energy mainly includes solar energy [
9], thermal energy [
10] and wave energy [
11], which has huge energy storage and is widely regarded as the main source of energy for AUVs in the future [
12]. Among them, solar energy can directly convert energy into electricity, but its conversion efficiency is only 10–12%, which restricts the development of charging systems [
13]. Thermal energy comes from solar energy, which is less affected by environmental changes, but is limited by geographic location [
14]. As for wave energy, it is only related to wave height and period, so its application is more extensive [
15].
Wave energy has attracted widespread attention from the scientific community and the energy industry because it is easy to predict and available. Wave energy resources and potential have been evaluated in many recent studies, such as coastal sea areas [
16], sea areas with different energy flow densities [
17] and lakes [
18]. The collection of wave energy depends on the development of wave energy converter (WEC) technology. The first device to convert wave energy into electrical energy was created in France in 1799 [
19]. In recent years, breakthroughs in wave energy technology have accelerated the development of the industry, and maritime trials have also achieved promising results [
20]. The general wave energy converters are point absorbers [
21,
22], oscillating water columns (OWC) [
23,
24] and flaps [
25]. The annual energy varies from 6.90 to 15.64 GWh for Wave Dragon WEC and from 0.45 to 0.97 GWh for Pelamis WEC in the sea area with an energy flow density of 7.83 to 29.94 kW/m [
26]. The feasibility study of energy harvesting in the Italian seas shows that large WECs are idle for most of the year, but smaller WECs have significantly higher capacity factors [
27], especially suitable for energy in the lower waters [
28]. With the widespread application of gyroscopes on ships for stabilization [
29,
30], a gyroscope wave energy converter (GWEC) device has become a research hotspot. At present, Japan [
31,
32,
33], Italy [
34,
35] and Spain [
36] are relatively mature in this technology area. The application of small GWEC to AUVs has become a future development trend due to it being sensitive to external stimuli.
In this paper, a novel wave energy conversion system for AUV is described and mathematically modeled. The hydrodynamic response of the hull to various cycles of waves is obtained using ANSYS/AQWA software. Additionally, the effect of different input parameters on the power output of GWEC was simulated and analyzed. In order to reduce the time and economic cost of actual maritime experiments, a hardware experimental platform that simulates wave movement is developed in this paper. Finally, the ability of the GWEC to transform the energy of regular waves was tested and the validity of the mathematical model was verified.
2. Mathematical Model
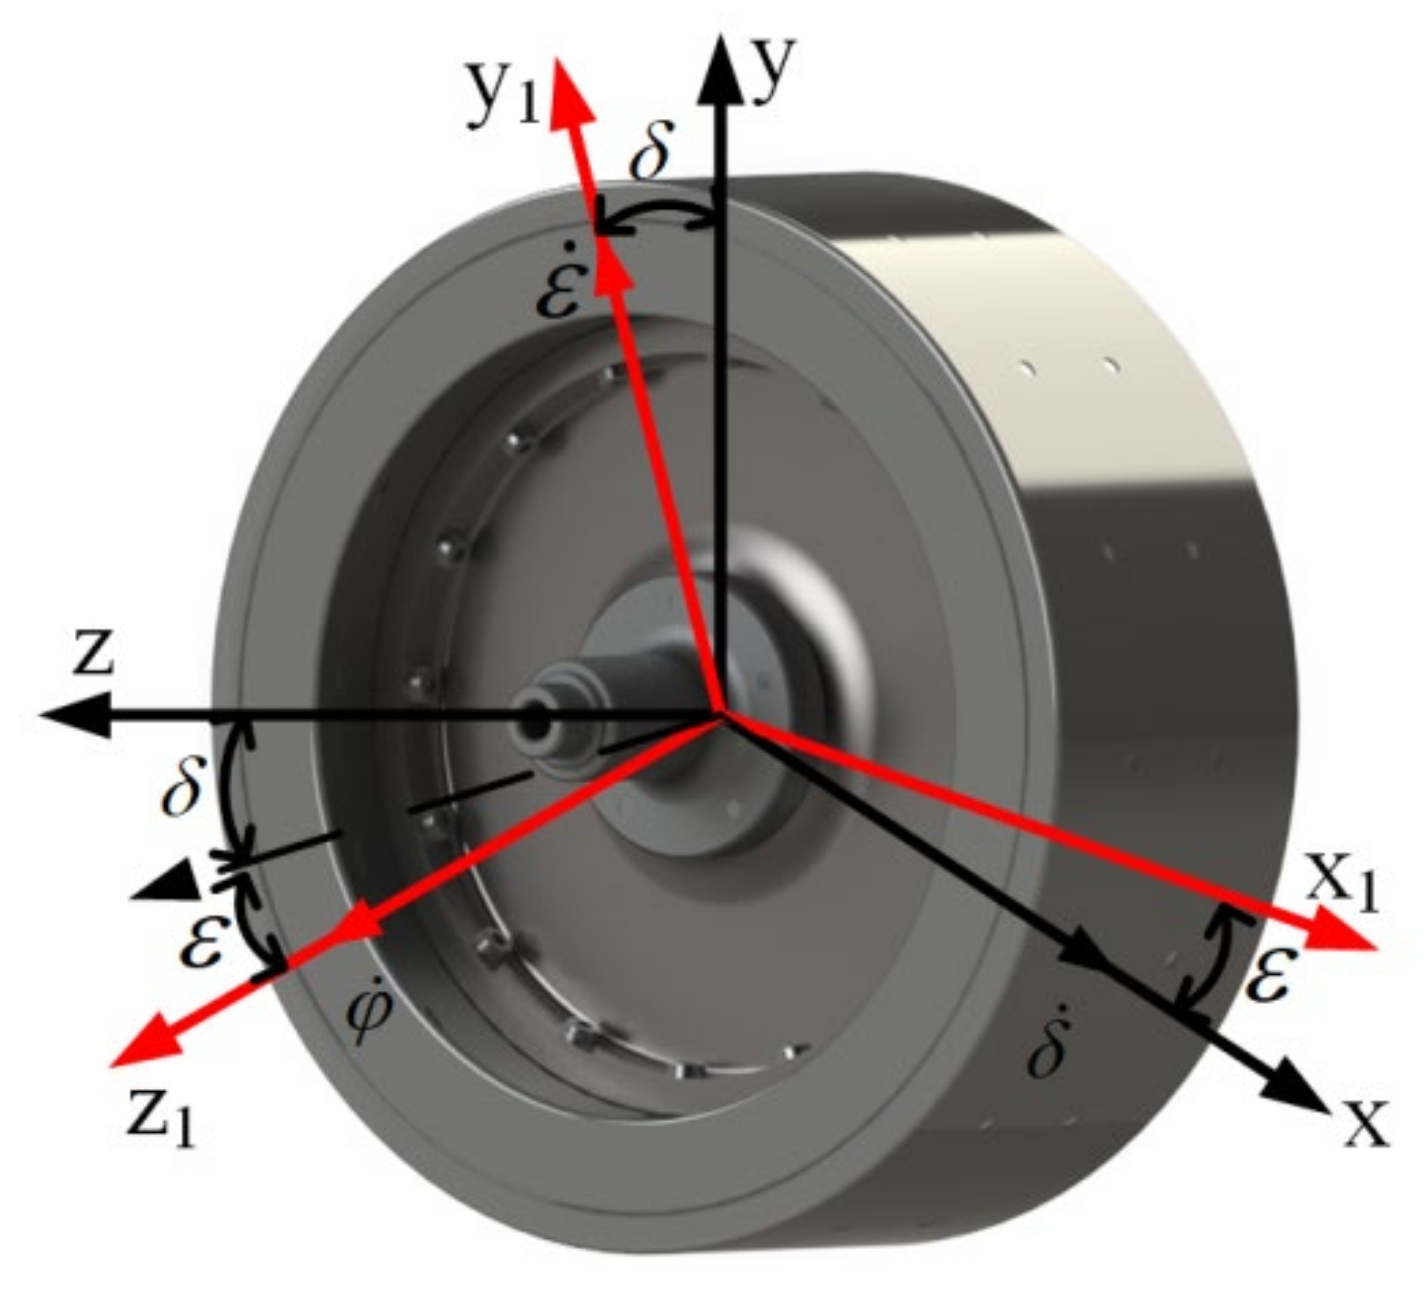
GWEC is a device that converts wave energy into electricity by gyroscope effect of the flywheel; its dynamic principle is shown in
Figure 1. In order to describe the energy conversion process clearly, two reference systems are introduced, where
x,
y,
z are the hull reference systems, and
x1,
y1,
z1 are the gyro reference systems. The origins of the two reference systems coincide with the flywheel’s center of gravity. In the initial position, the flywheel rotates at a certain speed along the
z-axis direction. Since there is no wave action,
and
are both null. When the hull is subjected to waves with an angular velocity
in the
x direction, the flywheel is affected by two angular velocities,
and
. At this time, the gyroscope effect produces torque in the
y1 direction perpendicular to the two angular velocities, and its precession angular velocity is
. Therefore, power take off (PTO) can extract energy from the torque in the
y1 direction, thus realizing the conversion of wave energy to electricity.
GWEC is less affected by the environment and geographical location because of its energy conversion principle, which is sensitive to external excitation. Unlike solar energy supply, it is not limited to the principle of charging during the day and stoppingat night; it can continuously provide energy for the AUV even under low wave energy underwater. From the technical point of view, the flywheel rotational speed as a controllable parameter can be used to optimize the coupling with the waves, thereby increasing the power generation production. It can be applied not only to AUVs, but also independently to provide energy for island residents or buoy lights in coastal areas.
2.1. System Equations
The angular velocity
and angular momentum
of the flywheel in the system are:
Among them,
,
,
are the unit vectors on the
x1,
y1, and
z1 axes, and
,
,
are the moments of inertia on the three axes, respectively. Among them,
due to the structure of the flywheel. Therefore, the torques around the three axes can be obtained.
where
,
,
are the torque on the three axes, respectively. Since the AUV will extract energy from the torque of the
y1 axis, the second formula will be regarded as the research focus. If the power take off (PTO) is regarded as a spring damping system, this formula can be rewritten as:
where
cy is the damping coefficient and
ky is the stiffness coefficient. From Equation (4), it can be found that the second term on the left side of the equals sign is two orders of magnitude smaller than the other terms, so ignore it from now on and Equation (4) can be rewritten as.
where
,
. When
, it can be deduced from Equation (5) that:
2.2. Power Extraction
In this paper, the torque extracted from the precession shaft damper is used to generate electricity.
It is obvious from Equation (7) that when the system resonates, the power
reaches the maximum. Therefore, under that condition, Equation (7) can be simplified as:
It can be derived from Equation (8) that the maximum output power is proportional to flywheel rotational speed , angular velocity of precession and angular velocity of pitch with the resonance.
2.3. Power Lost
Air resistance and friction are the main factors in energy loss from a flywheel rotating at high speeds. However, the aerodynamic drag is in the same order of magnitude as the energy produced by the device, so the flywheel is designed to be sealed at an internal pressure of 0.1% of atmospheric pressure to minimize aerodynamic drag. Equipped with corresponding vacuum bearings to reduce friction loss, then the frictional and aerodynamic loss is reduced to 5%.
The flywheel is raised to the rated rotational speed before being put into the marine experiment, so the power loss and friction during the start-up phase can be ignored. Considering that the rotational speed of the flywheel is constant during the working phase, then the torque
on the
z1 axis in Equation (3) can be rewritten as:
It can be concluded from Equation (9) that in the process of maintaining a constant rotational speed of the flywheel, only the z direction moment of inertia , the wave pitch angular velocity and the precession angular displacement need to be considered. Combined with aerodynamic drag and friction loss, it is also necessary to select an appropriate flywheel rotational speed to maximize output power.
3. Hydrodynamics
The dynamic equation of the AUV floating body under the action of various marine environments can be expressed as:
Among them, M is the mass matrix of the floating body, A is the additional mass matrix generated by the water dragging the floating body during its motion, B is the radiation damping and viscous damping matrix, and K is the hydrostatic stiffness.
FE is the generalized excitation force transmitted by the wave structure, obtained by Haskind expression [
37]. All the hydrodynamic parameters are evaluated by ANSYS/AQWA due to the complexity and strong coupling of wave conditions.
FL is the interaction force generated by the gyroscope.
X contains the six degrees of freedom (surge, sway, heave, roll, pitch, and yaw) that need to be considered for the motion of the floating body.
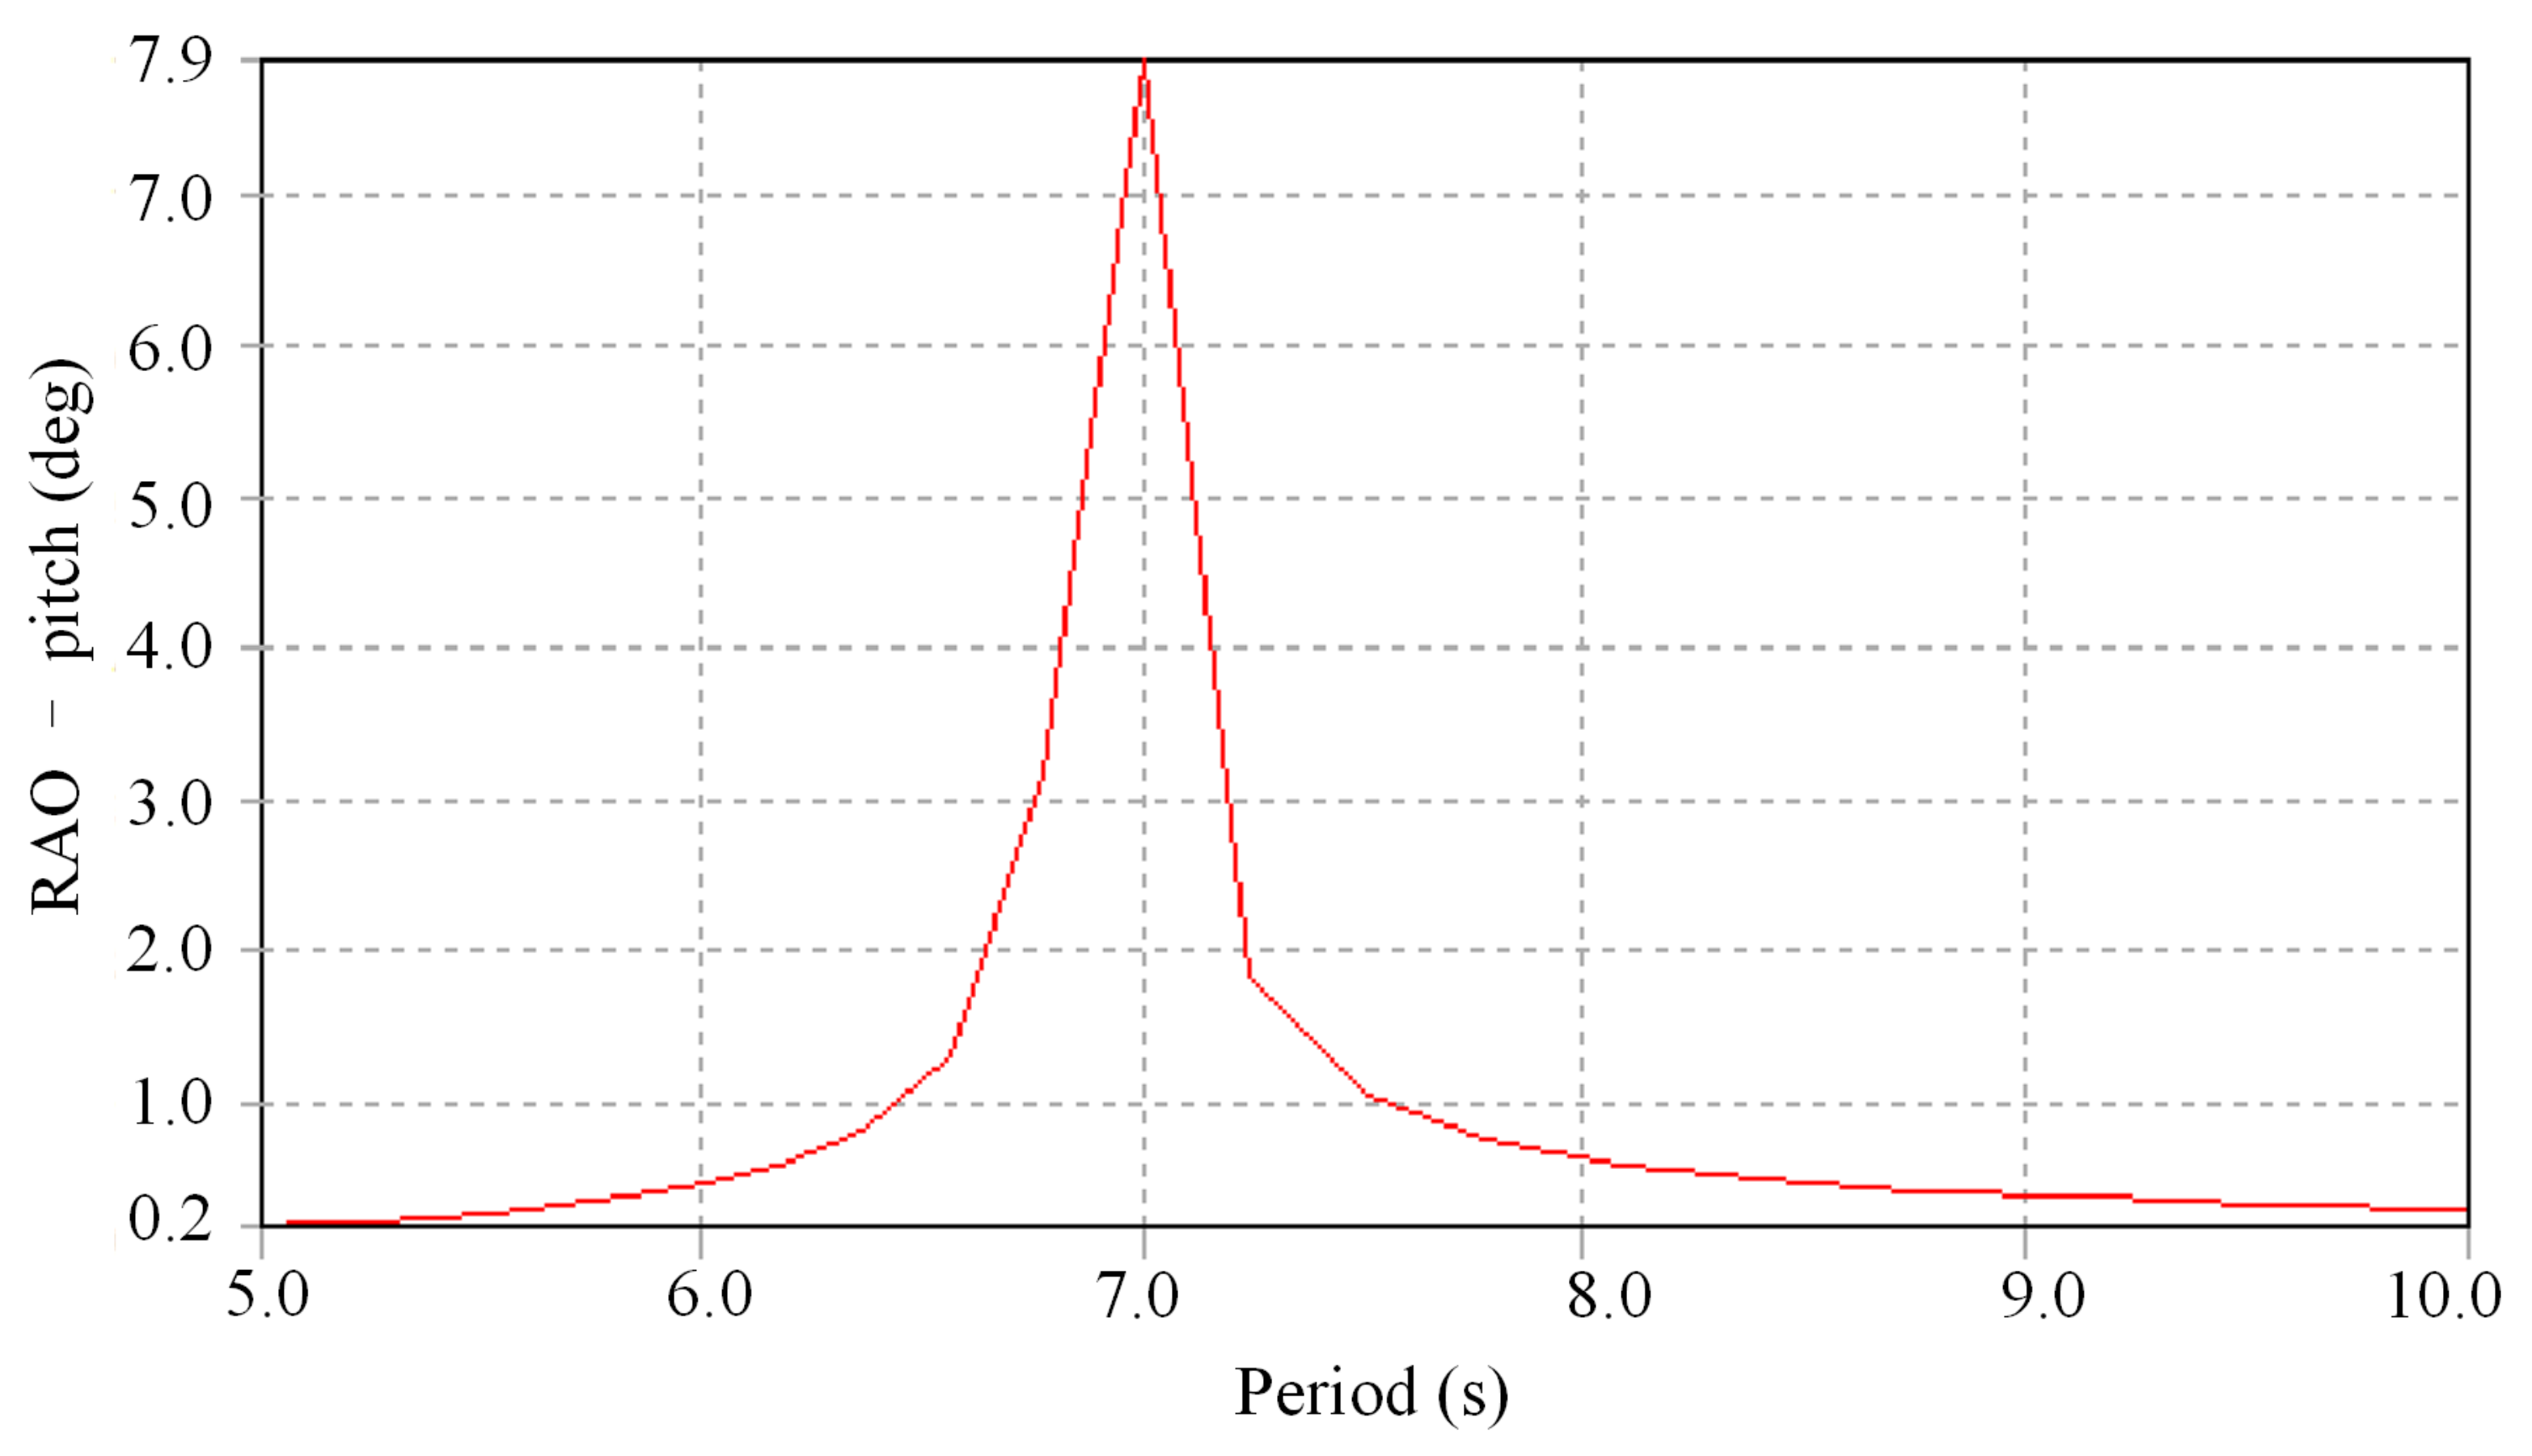
The maximum power output can be obtained when the GWEC resonates with the incident wave. The mass distribution and shape of the floating body have been optimized to ensure the device has pitch resonance at a wave period of 7 s.
Figure 2 shows the response amplitude operator (RAO) in the pitch direction when the float is subjected to wave impact. The results show that the float has the largest pitch response when the wave period is 7 s. The RAO will decay extremely rapidly as the wave period moves away from the rated period, so the device must be placed in a suitable sea area.
4. Test Environment
The prototype is designed based on the formulas described previously in this paper. The economic cost of actual at-sea or wave tank experiments is high. Therefore, the hardware-in-the-loop simulation can not only save costs but also obtain the general performance of the prototype before the actual marine test.
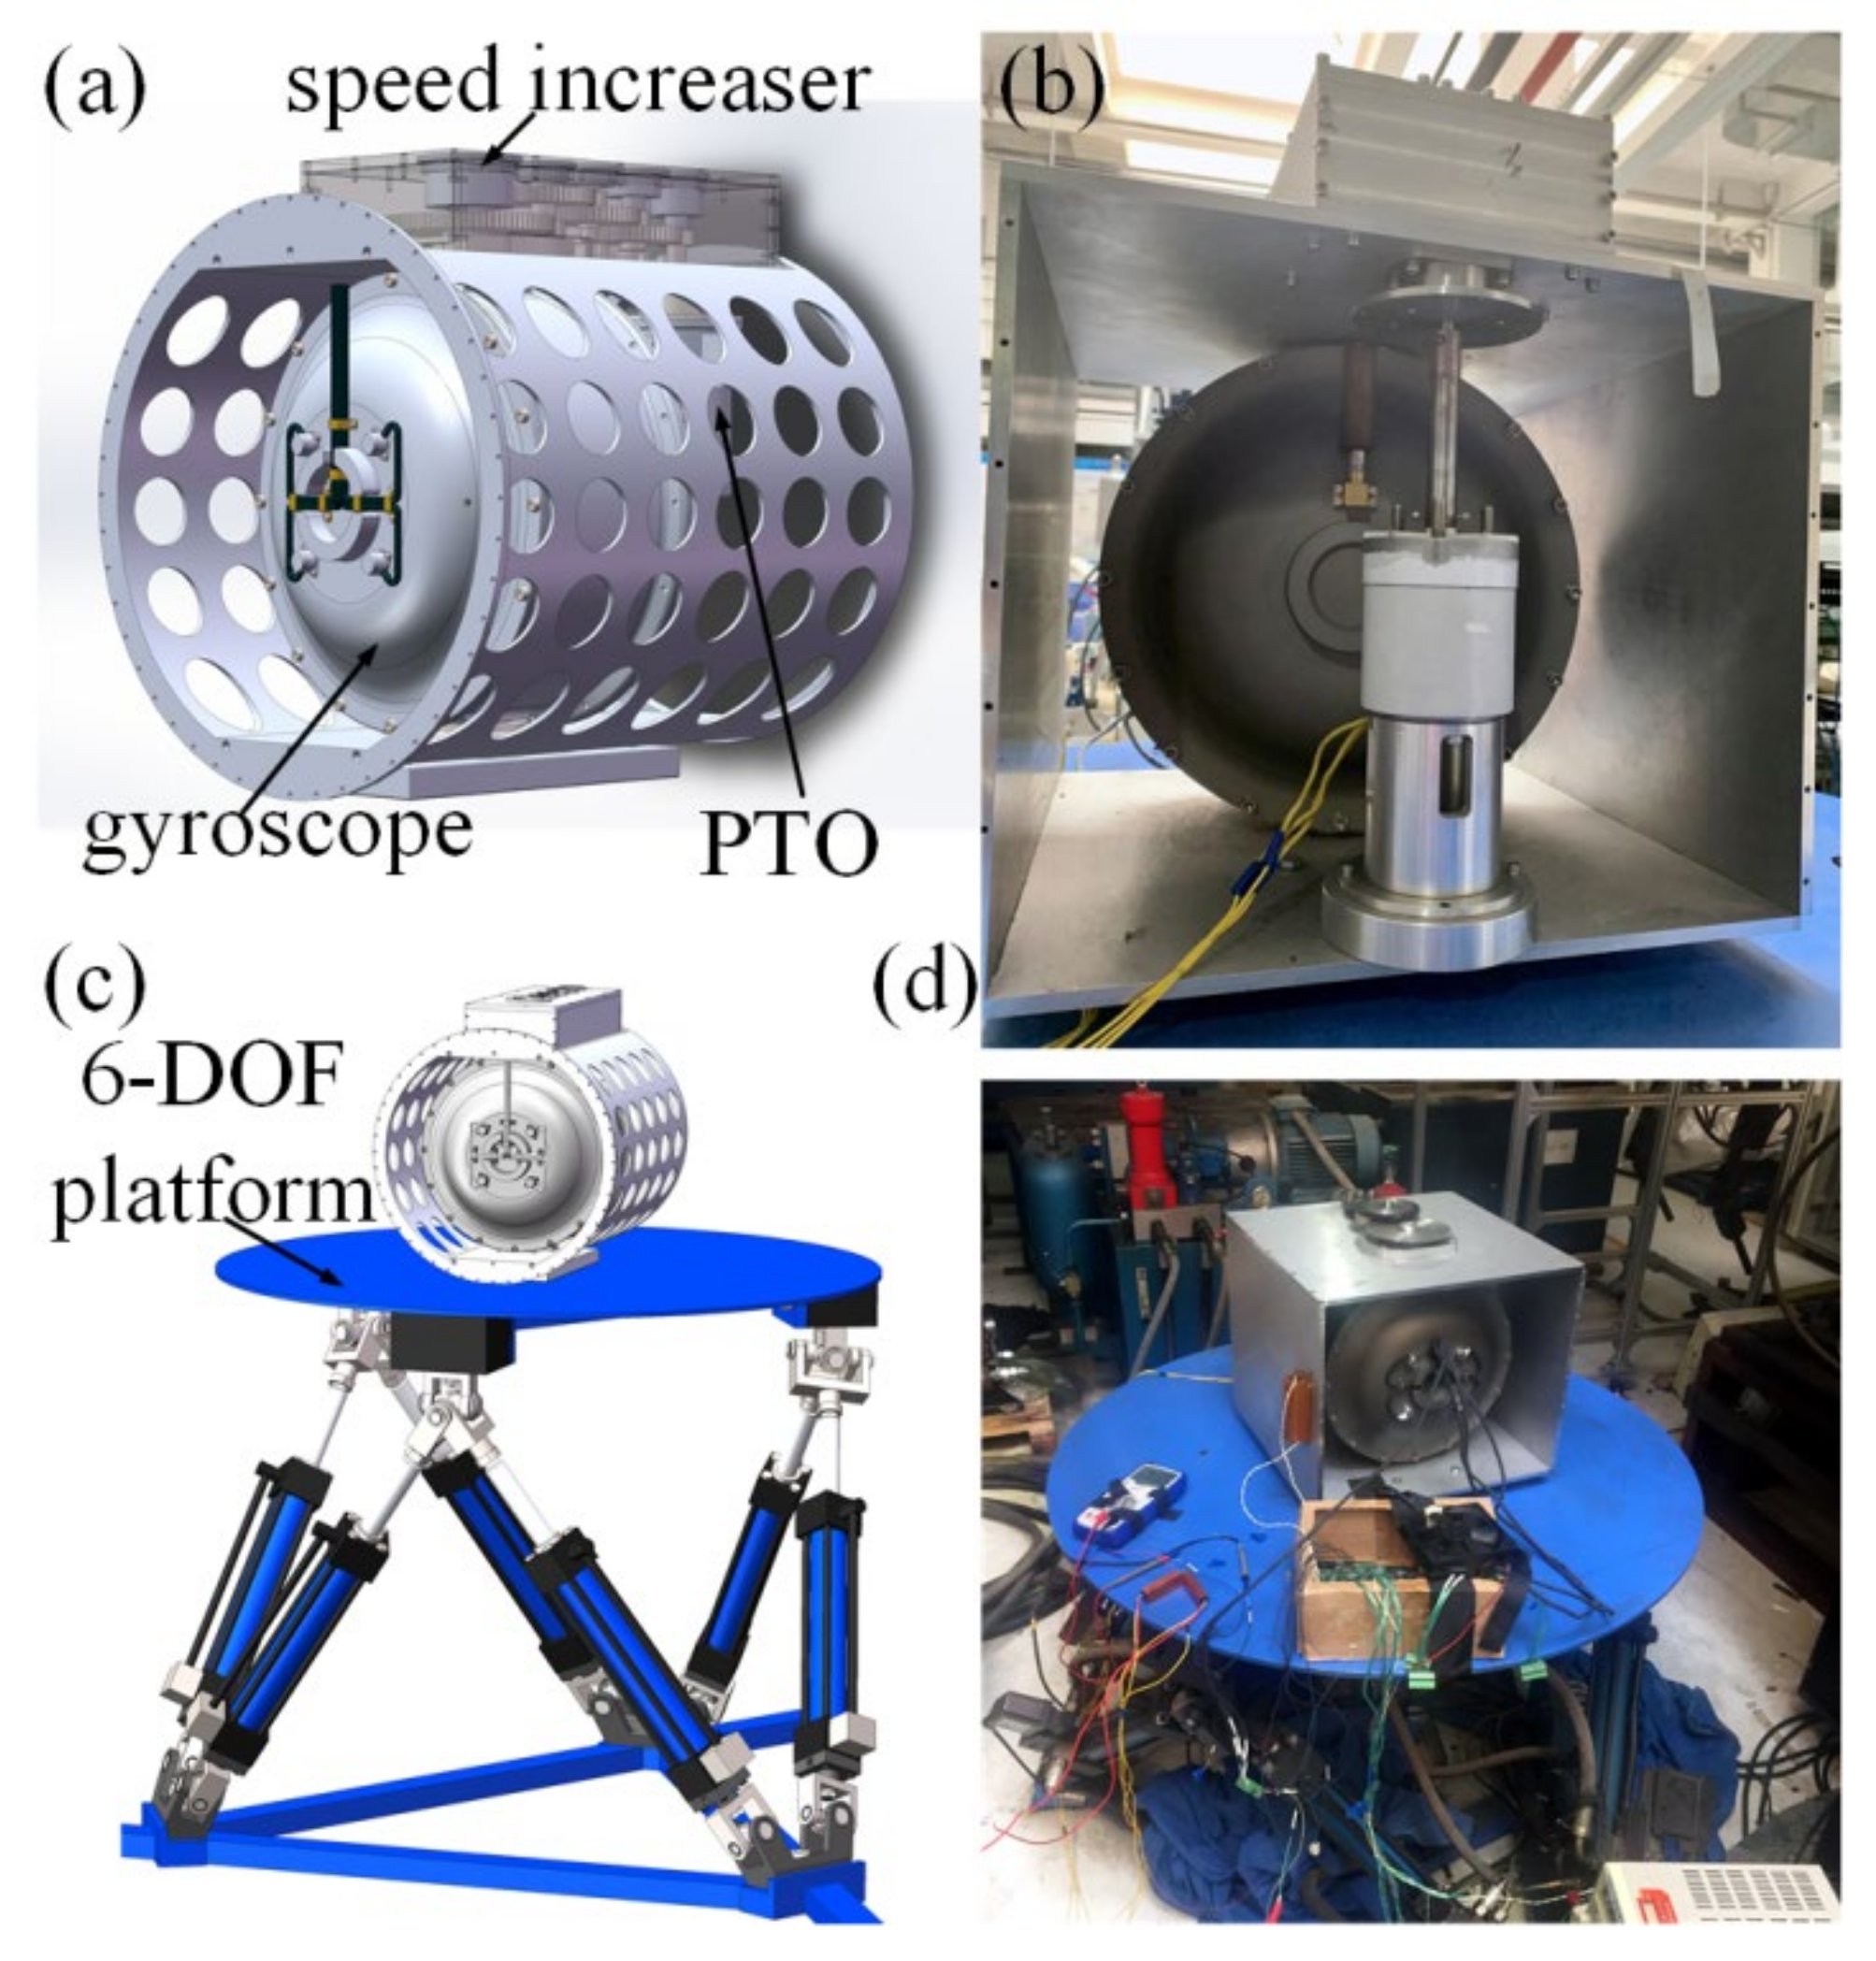
Figure 3 shows the prototype system and experimental configuration, where the CAD and physical models of the GWEC are shown in
Figure 3a,b, respectively.
GWEC is mainly composed of gyroscope, speed increaser and PTO. The flywheel rotates in vacuum flywheel housing at a high rotational speed in a single direction, thus minimizing air resistance. The function of the flywheel housing is to support the overall gyro structure and transmit its motion to the speed increaser. The lower precession angular velocity must be increased to a high speed through the speed increasing device to meet the rated velocity requirement of PTO. Therefore, a four-stage closed gearbox with a transmission ratio of 1:108 was chosen in this paper, which has the advantages of small backlash and smooth transmission. In addition, the sides of the GWEC frame are covered with circular matrix holes, which can effectively reduce stress concentration and unnecessary weight, thus improving conversion efficiency. The main parameters of GWEC are shown in
Table 1.
In order to reduce the testing time and cost of GWEC at-sea experiments, a six-degree-of-freedom (6-DOF) test rig capable of simulating regular wave motion is developed in this paper to evaluate the prototype capability and validate the GWEC numerical model. All the 6-DOF of the AUV will be affected by waves in actual sea conditions. However, from the gyroscope perspective and combined with Equation (8), only pitch and roll will directly affect the power absorption of the GWEC. Pitching motion stimulates the gyro system to produce precession, which is the main reason for the power output. The roll, on the other hand, is the result of the precession torque acting on the output shaft, which will cause the floating body to rotate and generate unnecessary water interaction forces. Therefore, the experimental platform was designed to provide only the pitching motion for the GWEC. The CAD and actual experimental scenes of the prototype experimental platform are shown in
Figure 3c,d. The technical parameters and rated operating conditions of the experimental platform are shown in
Table 2.
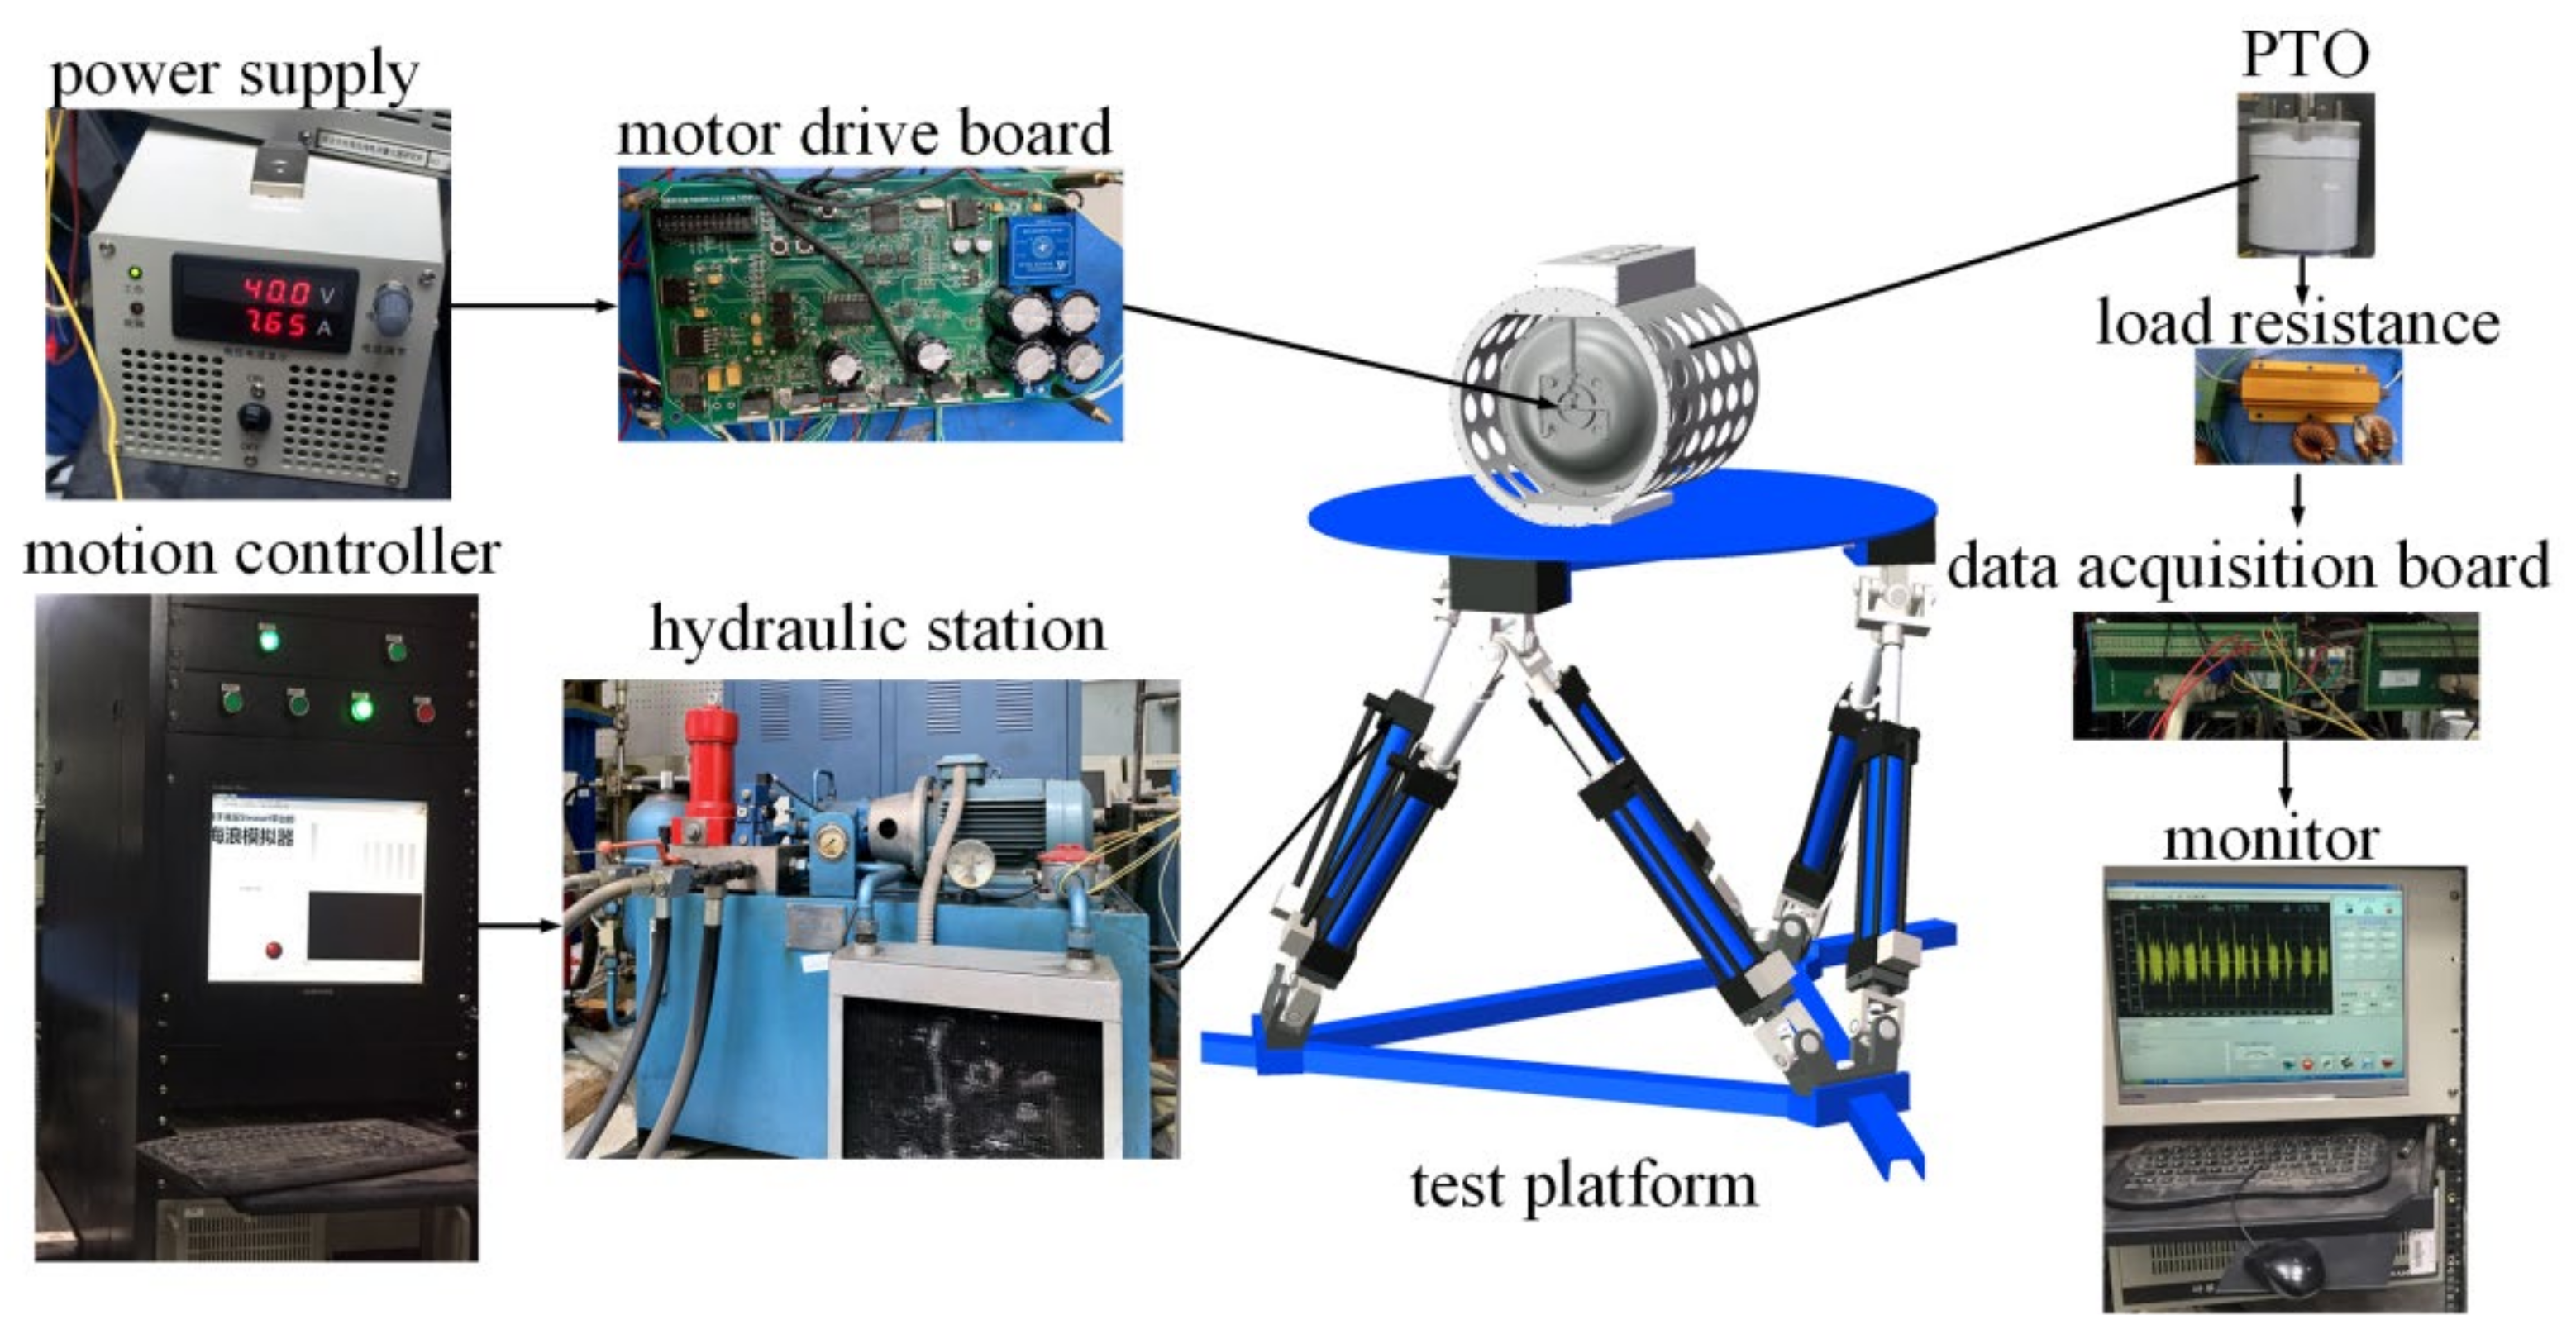
The workflow of the dry test is shown in
Figure 4. The drive board is powered by the power supply to rotate the flywheel. At the same time, the hydraulic station controls the 6-DOF platform to simulate regular wave motion under the instructions of the motion controller. The angular velocity of precession generated by GWEC is transmitted to PTO through the speed increaser to generate electric energy. Finally, the monitor displays the voltage across the load resistance obtained by the data acquisition board. The supporting parameters of the dry test platform are shown in
Table 3.
5. Parametric Analysis
A wave period of 7 s was selected as the rated period in this paper, according to the RAO curve in
Figure 2. This section analyzes the influence of different parameters on the output power of GWEC with the aim of increasing the energy conversion capability of GWEC as much as possible.
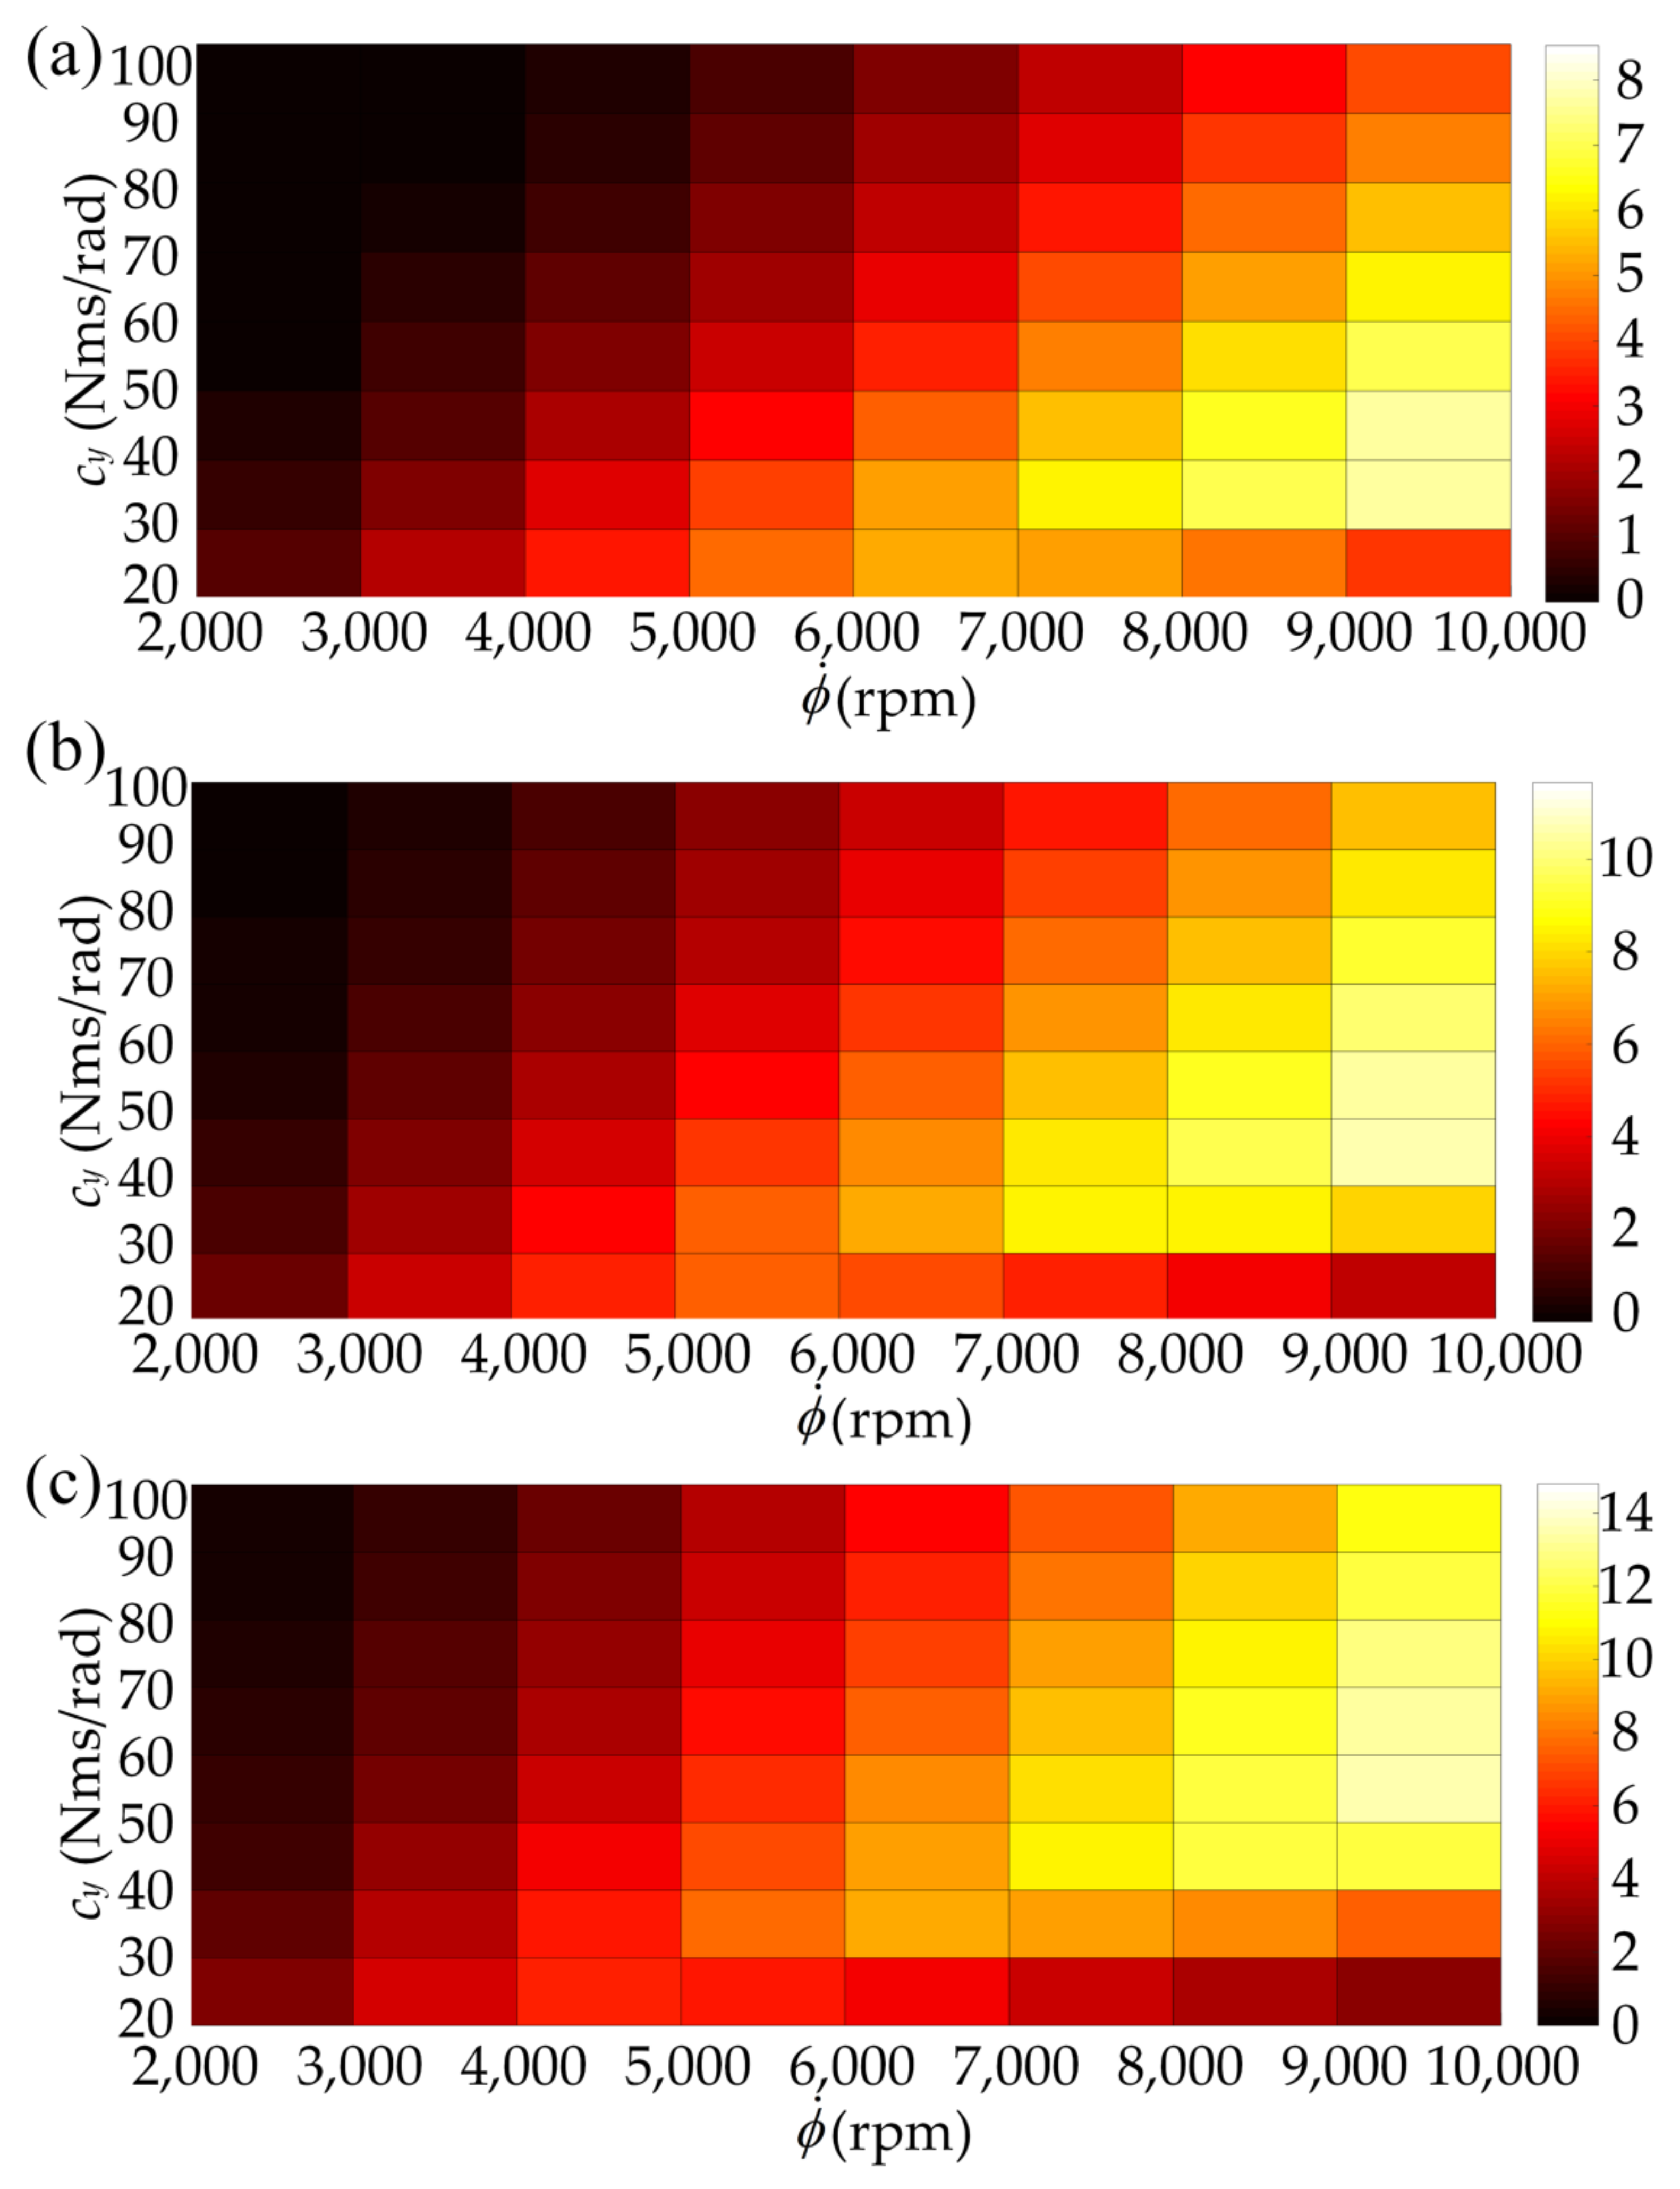
Figure 5 shows a series of hot colormap arrays, which are all about the extracted average power of rotational speed and damping coefficient. The damping coefficient varies from 20 to 100 Nms/rad, and the flywheel rotational speed varies from 2000 to 10,000 rpm. The three sub-pictures are obtained under different wave amplitudes (
A = 8°, 10°, and 12°).
As expected, the energy output power increases as the pitch amplitude increases. As can be seen in
Figure 5, for different wave amplitudes (
Figure 5a
A = 8°;
Figure 5b
A = 10°;
Figure 5c
A = 12°), the damping coefficient is between 30 and 40, and the rotational speed is
= 8000 rpm, which results in a higher power. Therefore,
cy = 35 Nms/rad is taken as the rated damping coefficient in this paper. An appropriate rotational speed can not only ensure the ideal output power, but also reduce the angular momentum and the power loss for maintaining the rotation of the flywheel compared to a larger rotational speed. The wave amplitude
A = 10° is selected and combined with the above conditions, and from now on is defined the rated condition.
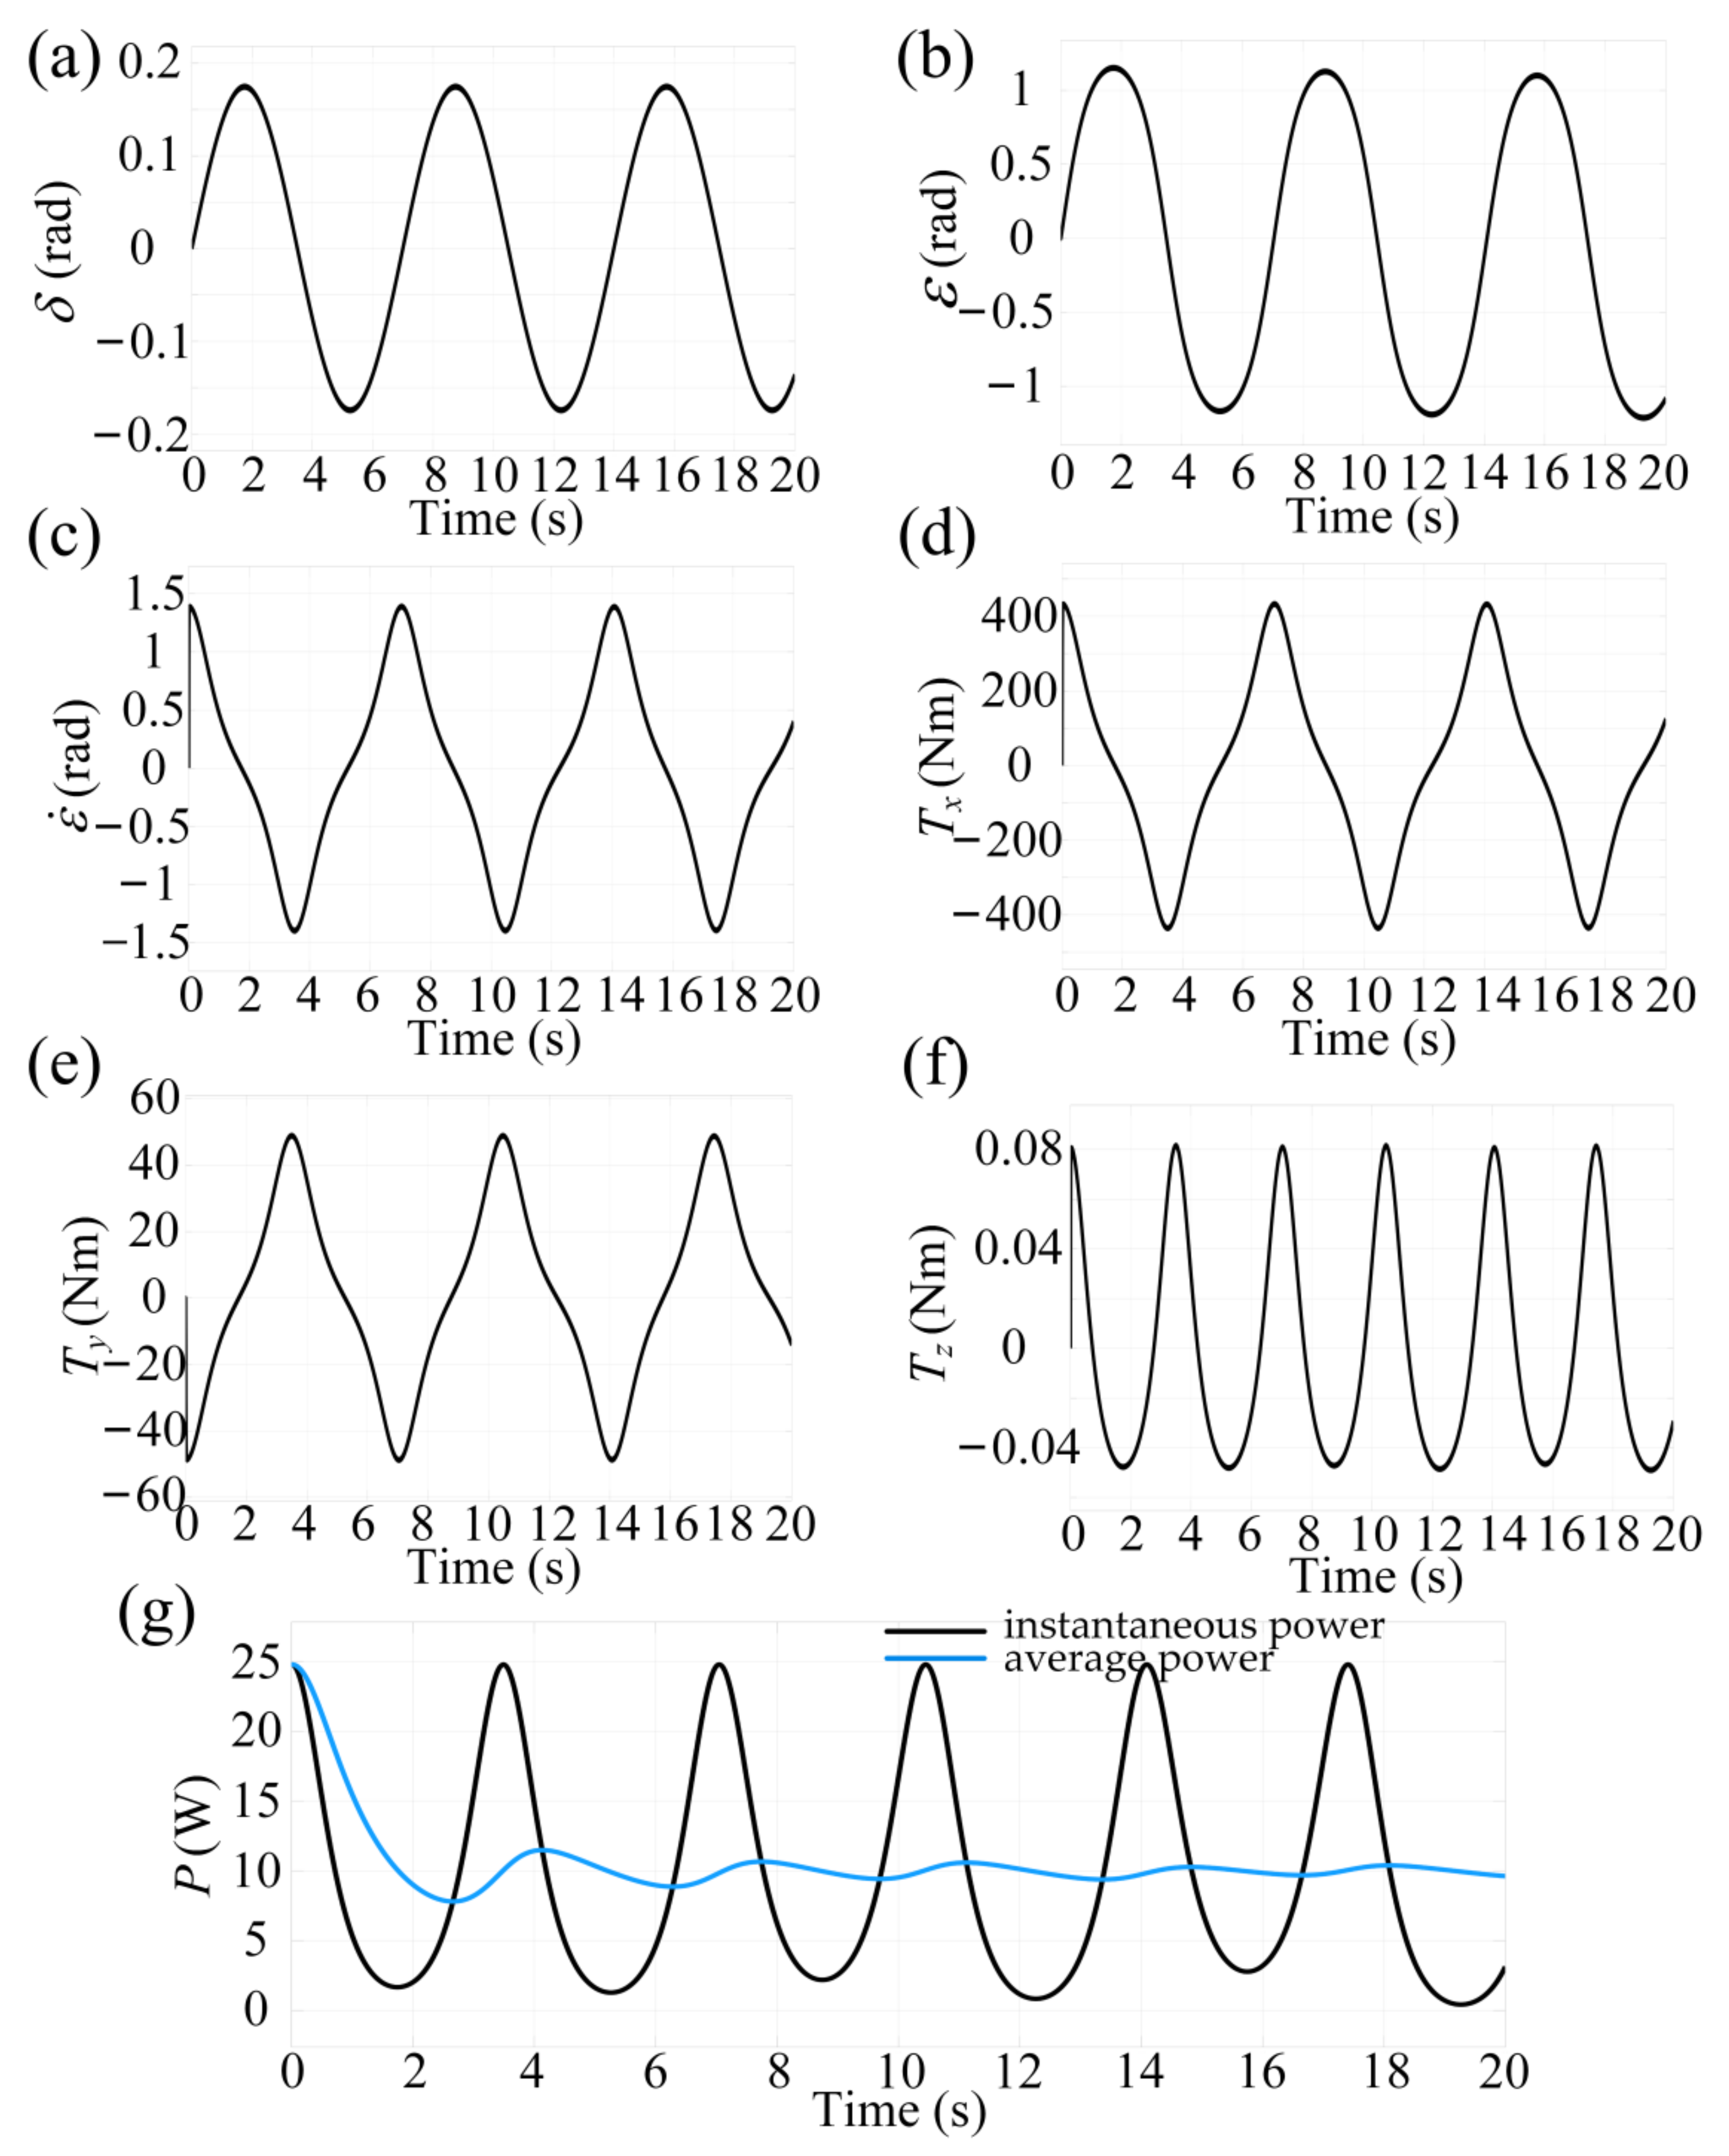
Figure 6 shows the performance of the system under wave period
T = 7 s, pitch amplitude
A = 10°, flywheel rotational speed
= 8000 rpm and damping coefficient
cy = 35 Nms/rad. The torque is maximum in the
x axis at 433 Nm, while the torque in the
z axis is negligible compared to the other two axes. Under the influence of wave motion, the system’s precession angular displacement, angular velocity and the period of the torque in the
x and
y directions are all the same as the wave period. It is worth noting that the periods of
Figure 6f,g are both half of the wave period, while
Figure 6g shows the output power of the system under rated conditions (the black line is the instantaneous power, and the blue is the average power), the peak power is 24.77 W and the average power is 9.66 W. In this paper, energy is obtained through a rotating PTO whose damping allows the conversion of wave energy into active power through the device, while reactive power is related to the spring effect. Therefore, from the perspective of power acquisition, the system output can also be improved by adjusting the stiffness and damping coefficient.
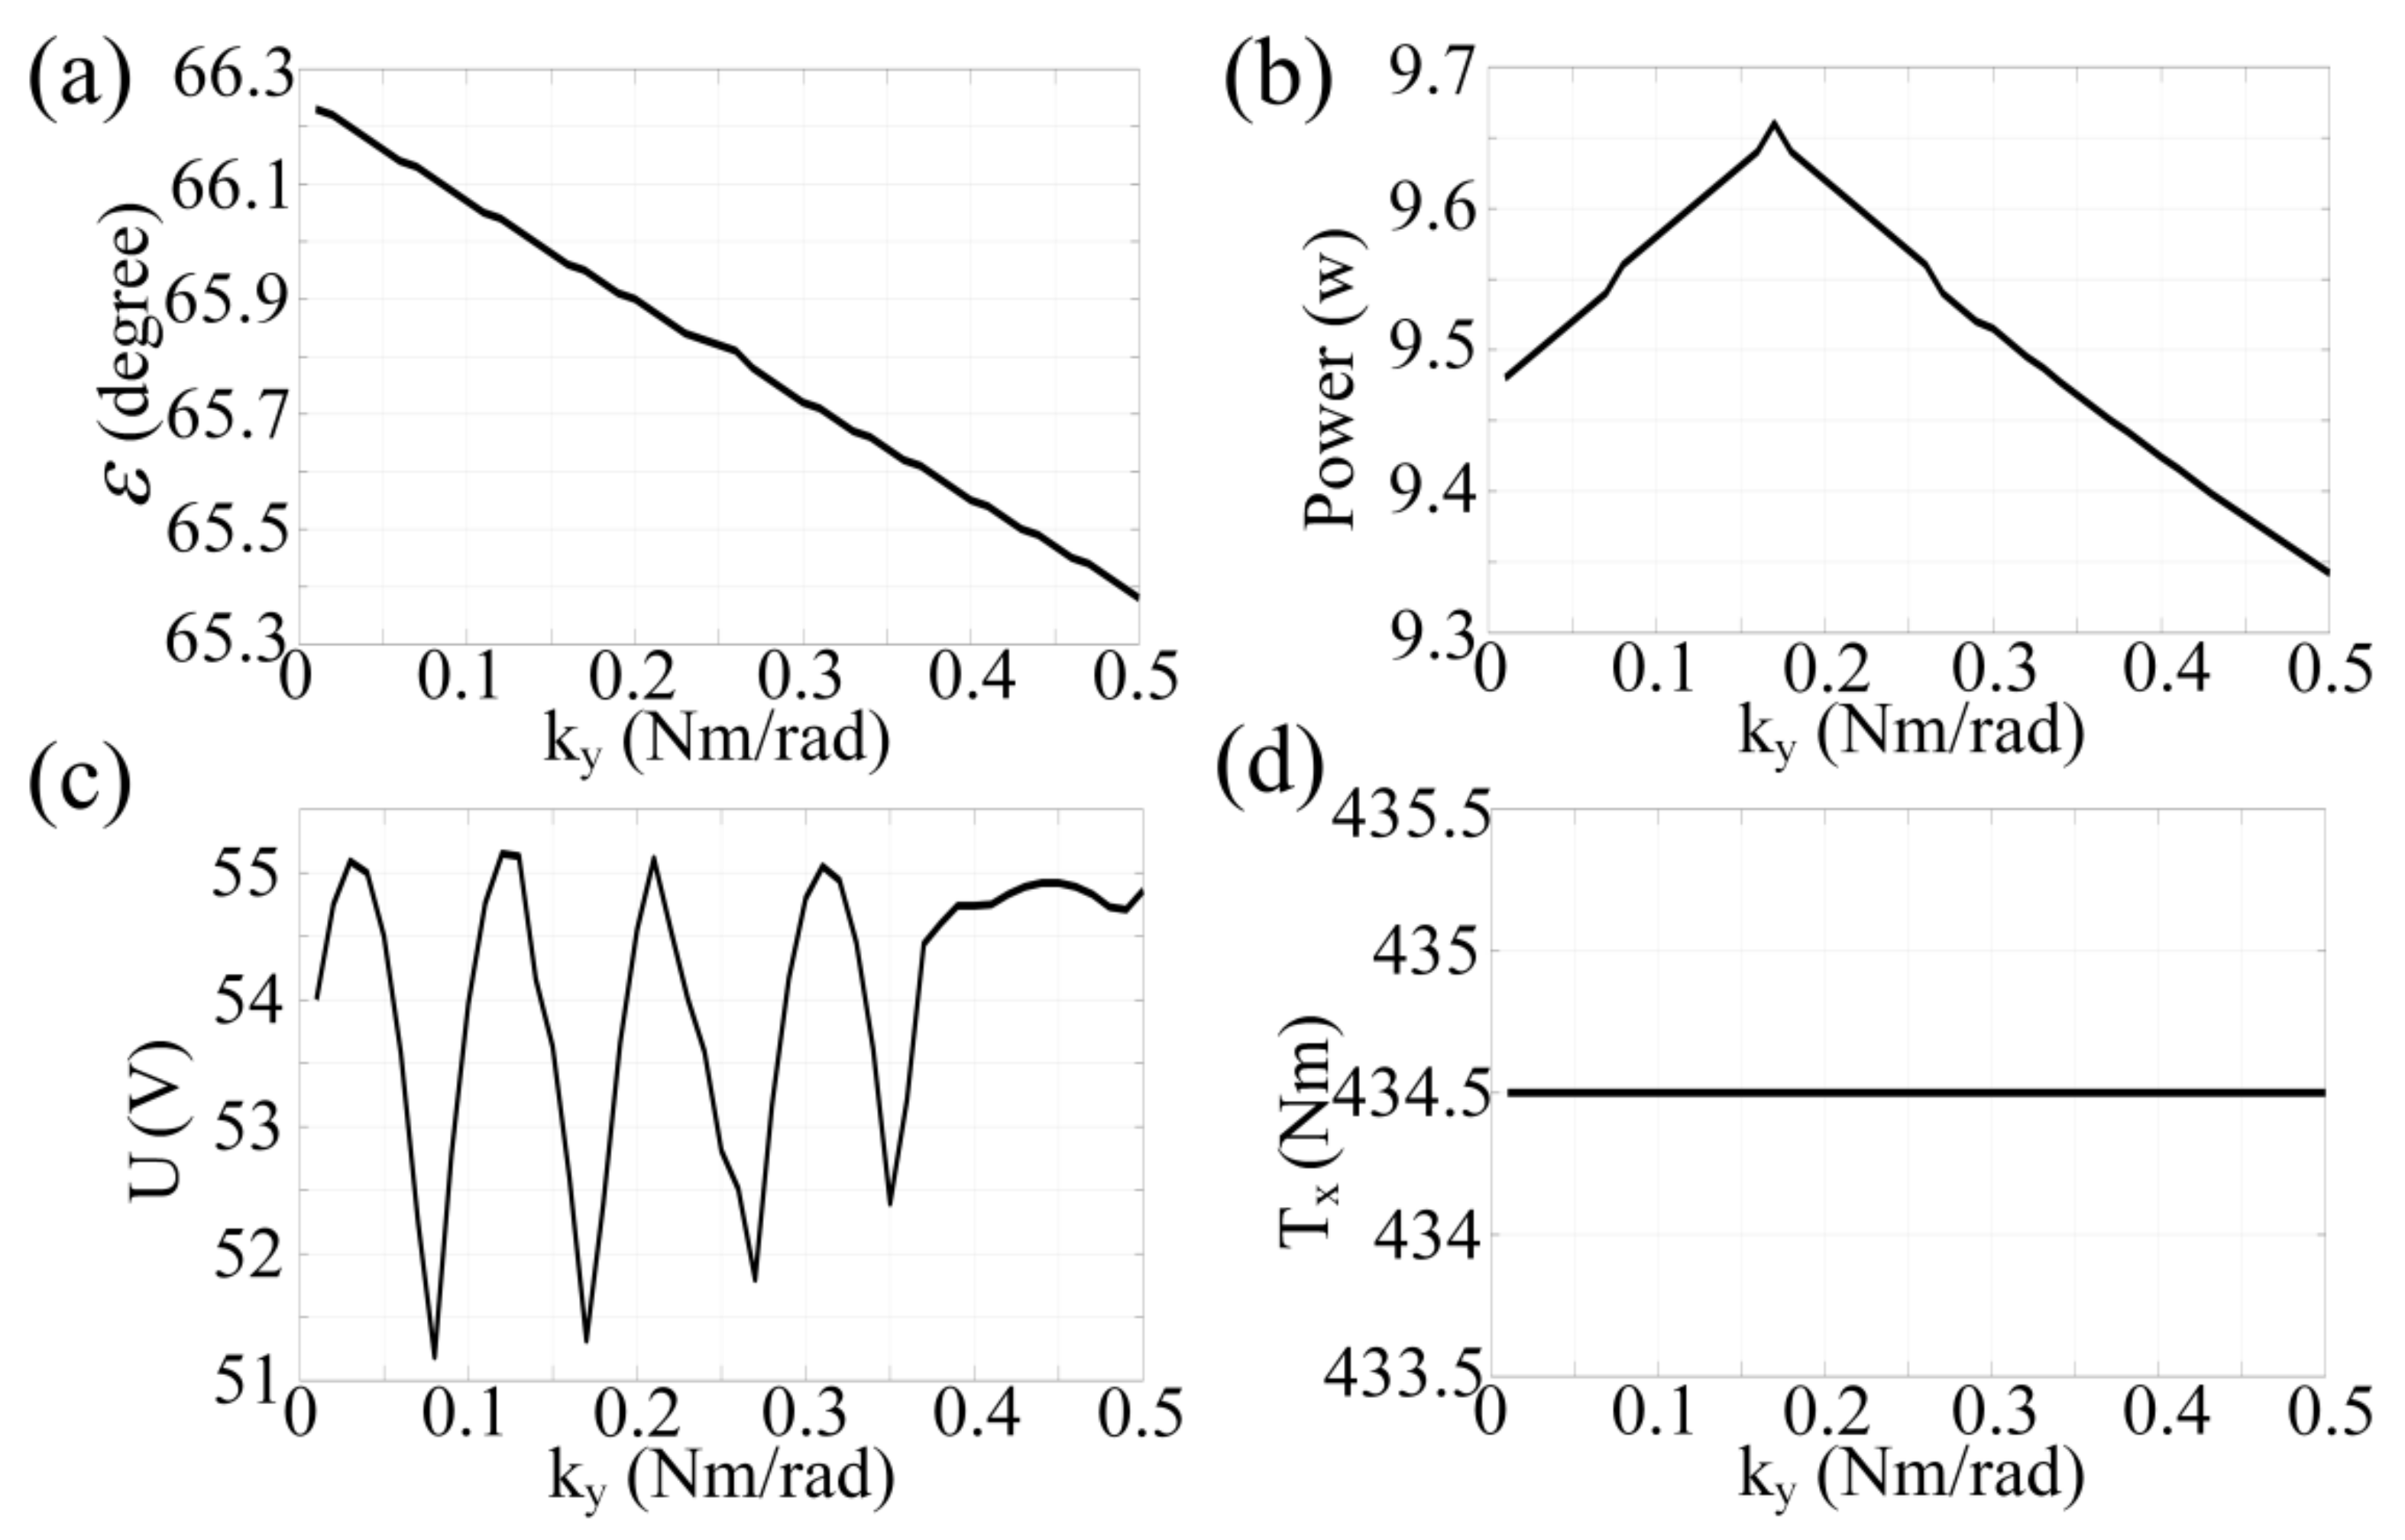
5.1. Stiffness Coefficient
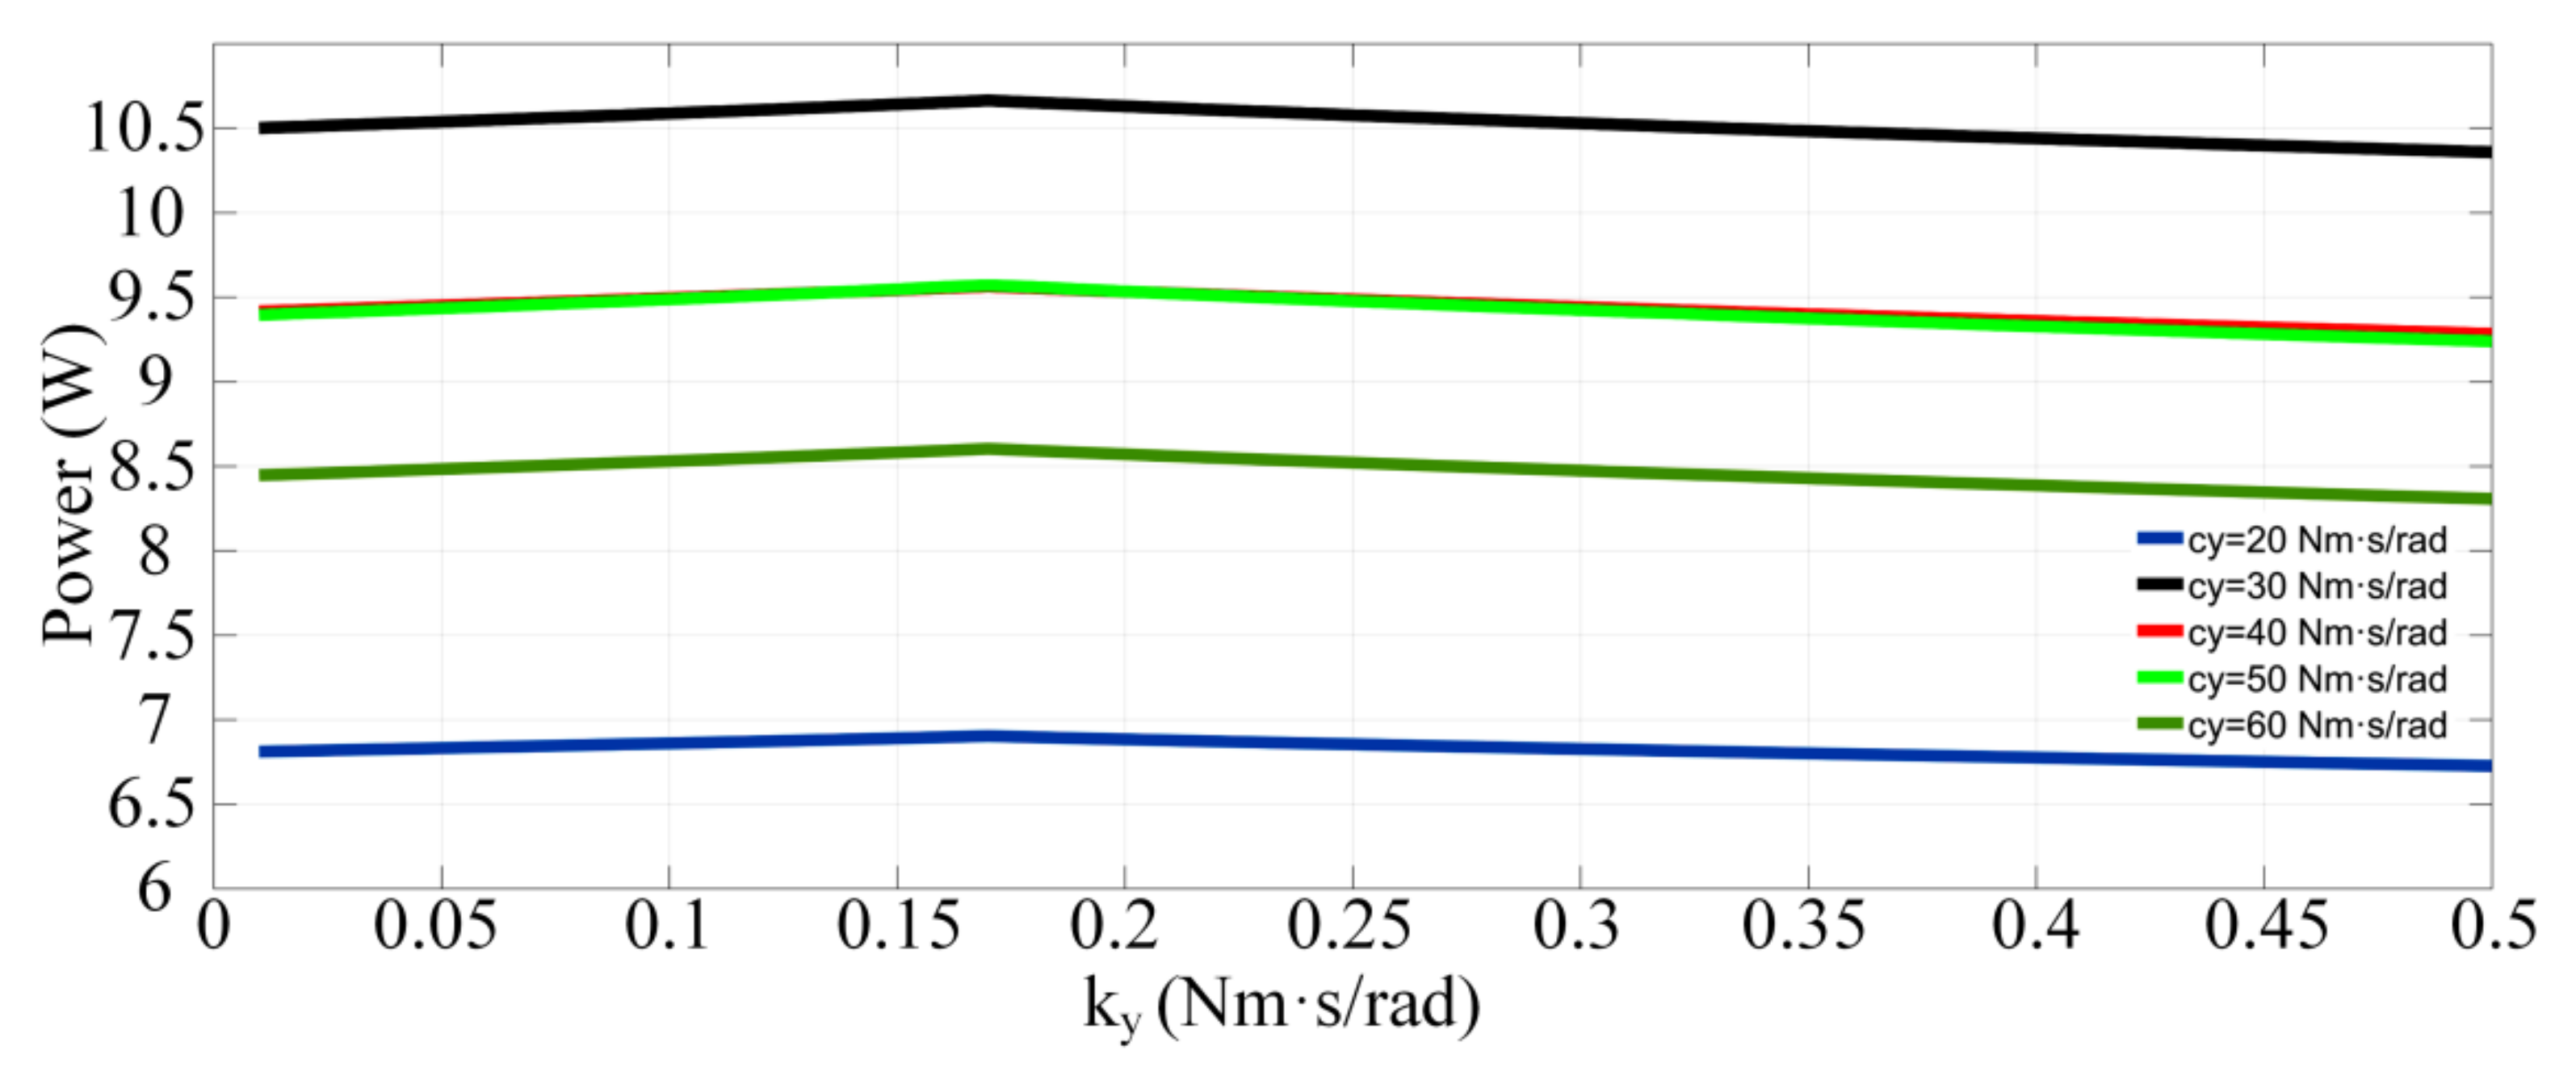
Figure 7 shows the effect of stiffness on the output power for different damping coefficients. The stiffness coefficient behaves the same for the different damping coefficients chosen, and the output power peaks at
ky = 0.17 for all of them. However, the further the stiffness is away from the optimum, the lower the output of the system is. Additionally, when the damping coefficient is near the optimal value,
ky has a greater effect on the output power, while when
cy is far from the optimum,
ky has an insignificant effect on the output. It is also worth noting that if the PTO had no stiffness, the system would stabilize at a 90-degree angle of precession, and the gyroscopic effect would disappear and no precession torque or power would be generated.
Figure 8 shows the effect of the stiffness coefficient on the main parameters of the system at rated condition. The precession angular displacement decreases as the stiffness coefficient increases, but the output power still reaches its maximum at
ky = 0.17. The peak voltage fluctuates with a sinusoidal cycle at the beginning of the simulation and stabilizes gradually with time. The torque in the
x direction is completely independent of
ky.
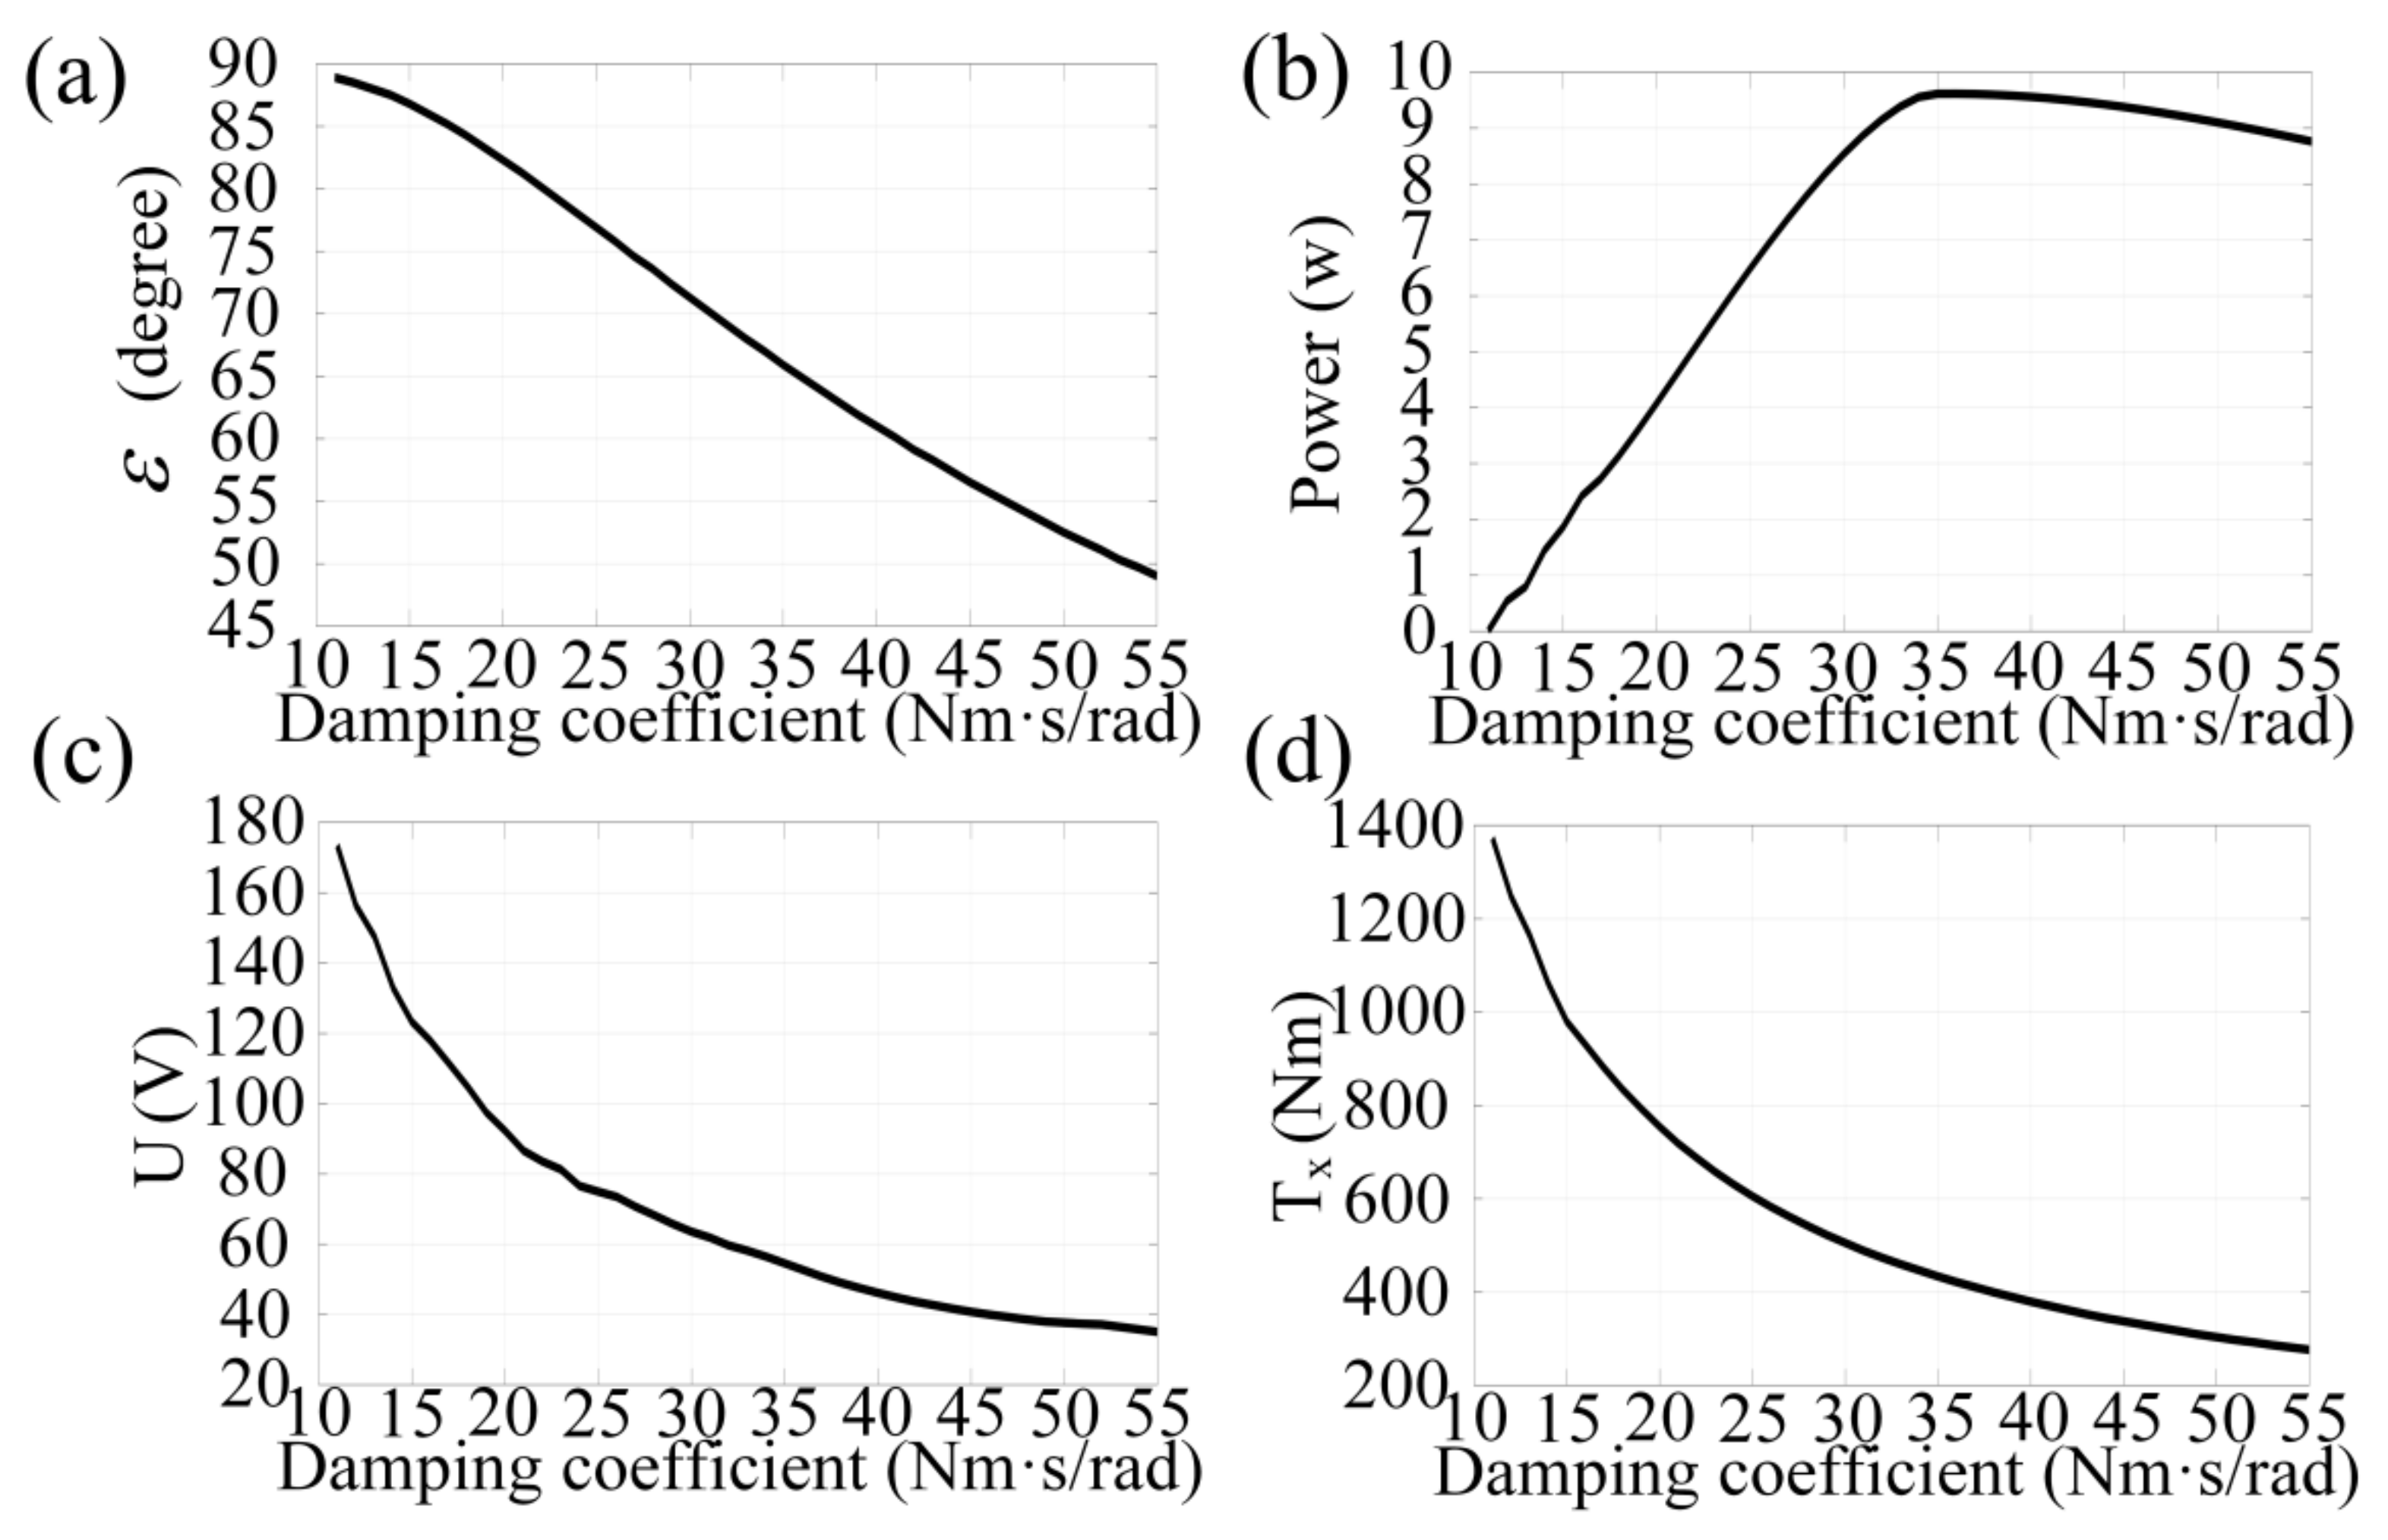
5.2. Damping Coefficient
Figure 9 shows the effect of the damping coefficient. It can be found from the expression of Equation (7) and combined with
Figure 7 that the damping coefficient
cy is crucial for the output power. The maximum angular displacement of precession will decrease as the damping coefficient increases. From the perspective of output power, when the damping coefficient is less than the rated value, the system output will drop sharply, while the maximum voltage and
x-axis torque increase significantly, which is not conducive to the stability of the system. When the damping coefficient is greater than the rated value, the output power, peak voltage and torque on the
x axis will all decrease slowly.
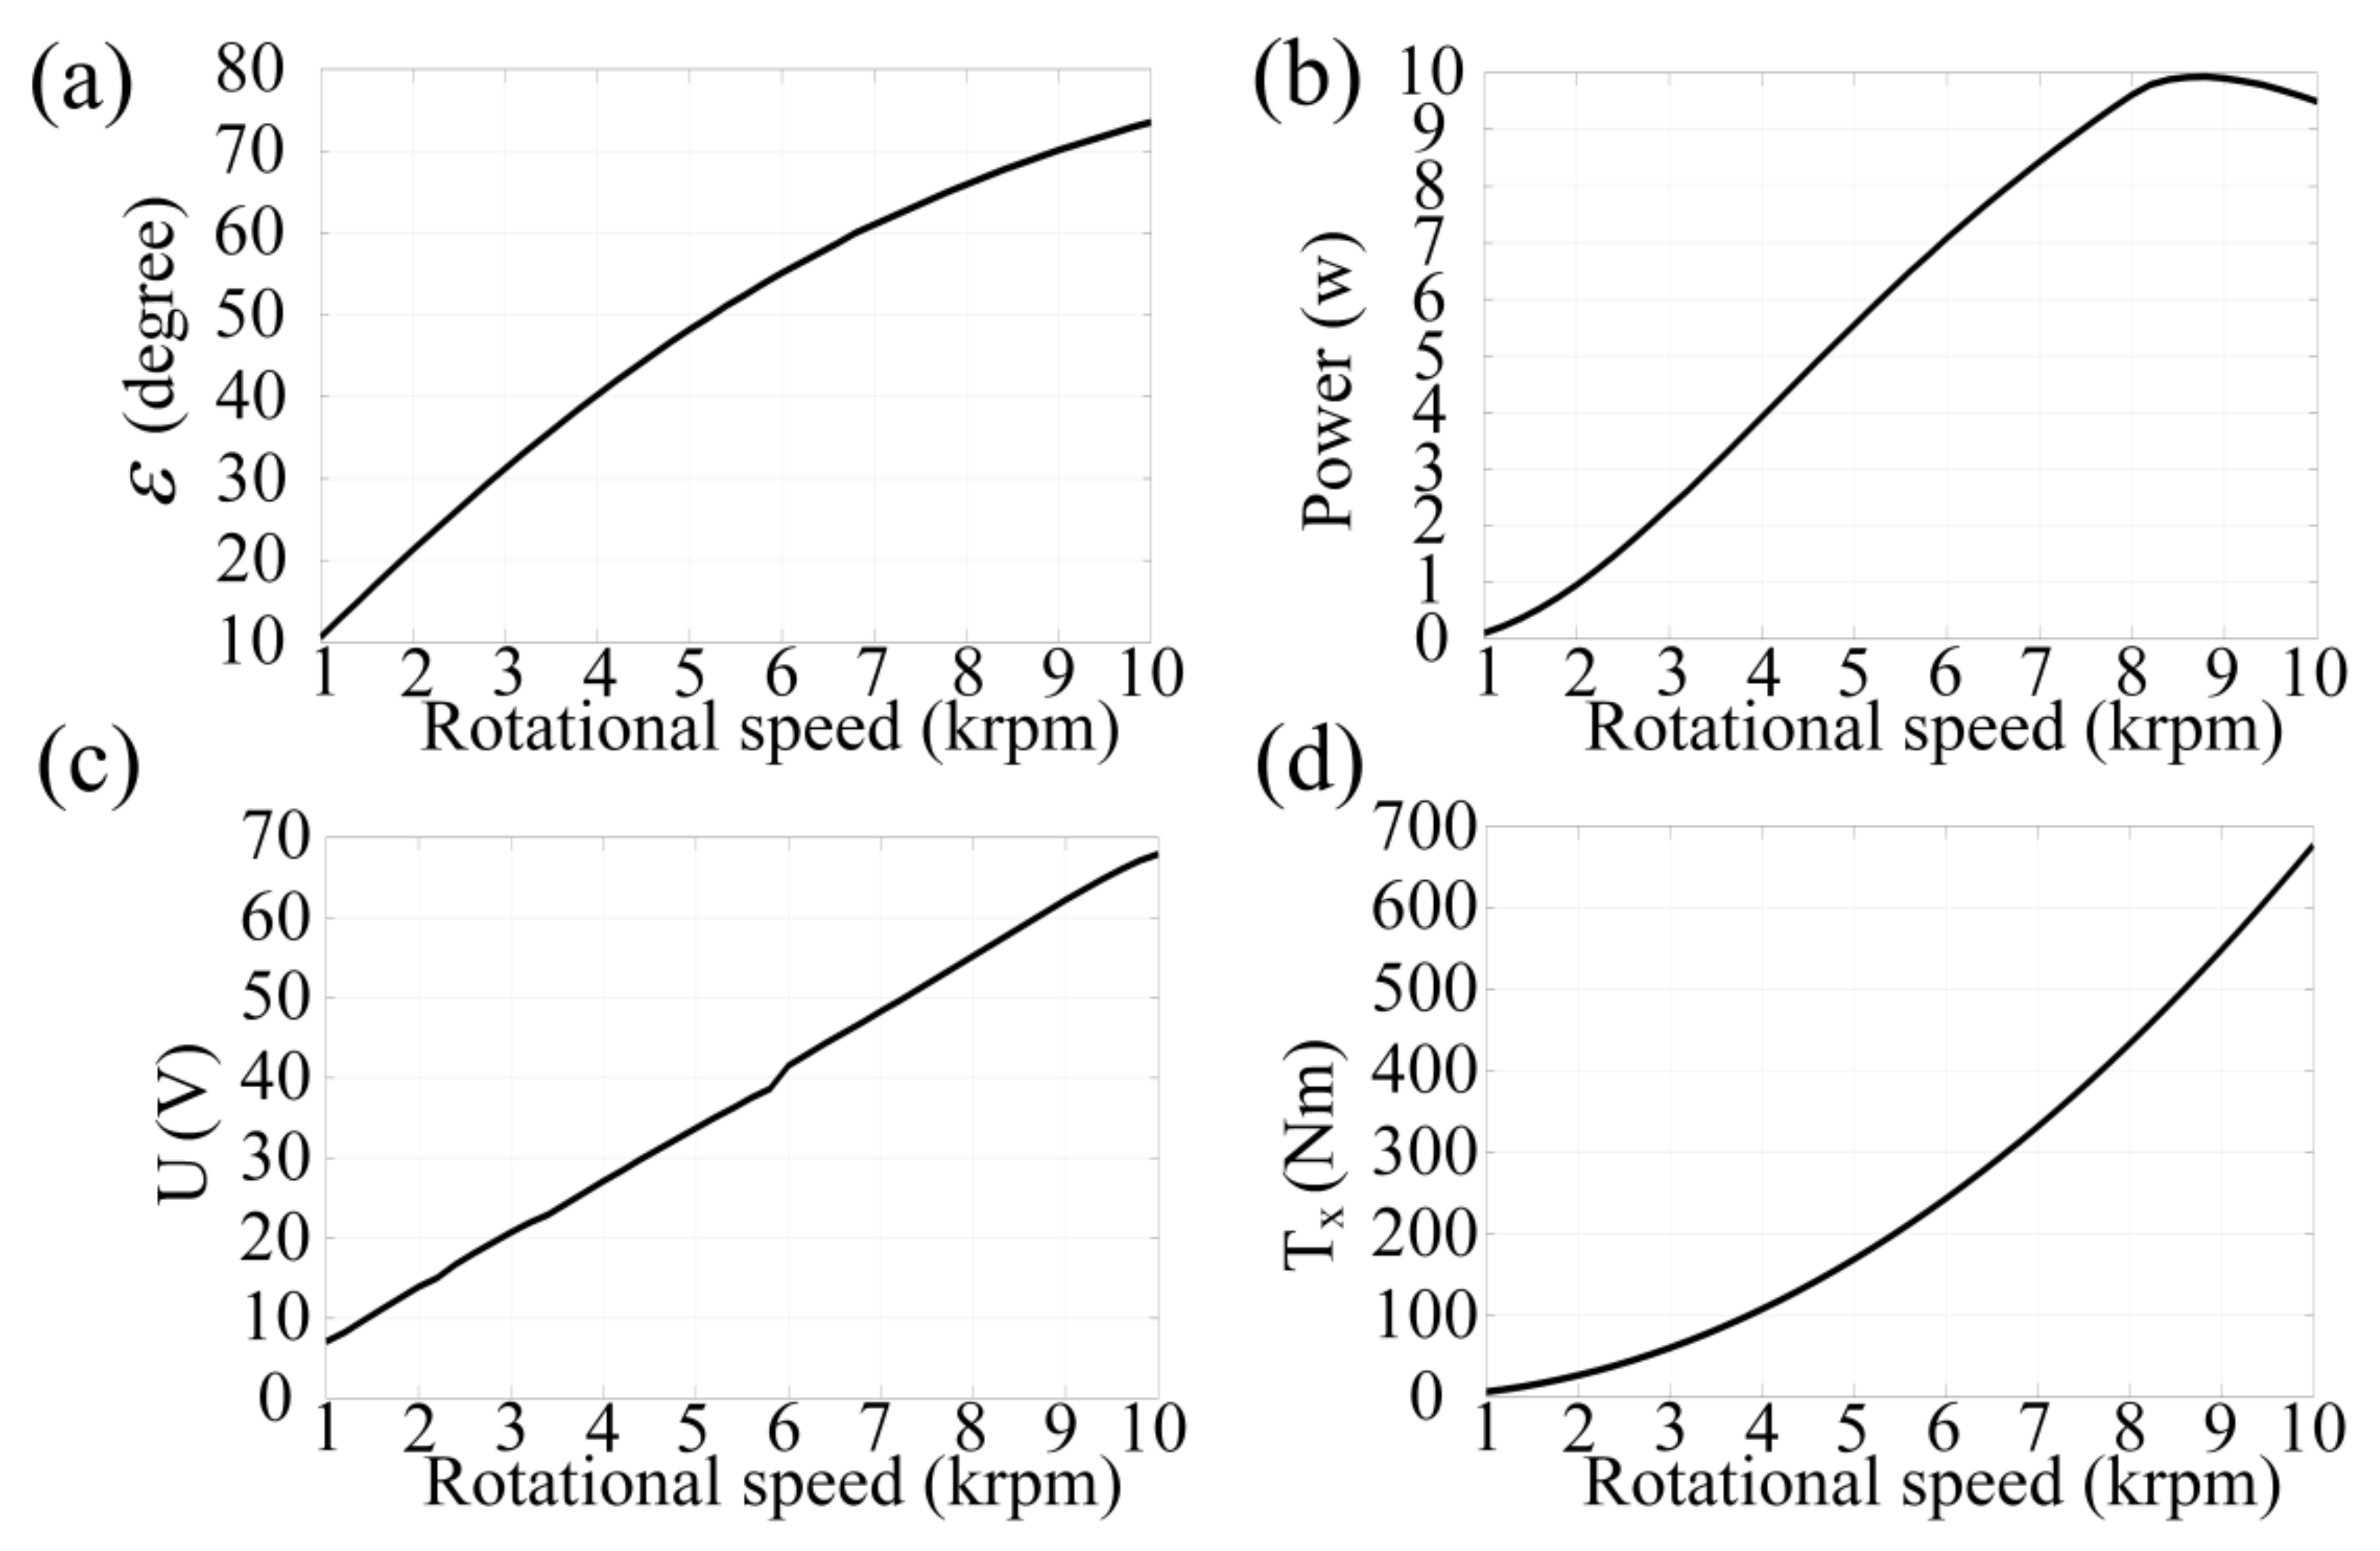
5.3. Flywheel Rotational Speed
Figure 10 shows the importance of flywheel rotational speed. The angular displacement of precession will increase as the flywheel rotational speed increases. A smaller rotational speed will cause a sudden drop in power, and a larger flywheel speed will cause a slow drop in output due to the need to overcome air resistance and maintain flywheel rotation. Additionally, the output voltage is almost linear with the flywheel rotational speed. The torque on the
x-axis, on the other hand, increases rapidly with flywheel rotational speed, which will make the entire system behave as a space stabilizer, and higher rotational speed means greater air resistance and maintenance power, and is not suitable for power output.
5.4. Wave Period
The analysis in
Section 3 and
Section 5.1 concludes that the output of the system is maximum when the system frequency is the same as the wave frequency. However, in the hardware design of this paper, GWEC is solidly connected to the experimental platform, which means GWEC obtains the maximum response of the simulation platform under any circumstances. Therefore, the performance of GWEC under different wave cycles can be observed by changing the platform motion cycle.
Figure 11 shows the influence of the wave period on the system when the GWEC obtains the complete response to the wave amplitude. The increase in the wave period can only increase the maximum precession angular displacement slightly. Although a small wave period can obtain an ideal power output, it will produce a huge peak voltage and torque for the system, which will cause a shock to the system and significantly increase the hardware requirements and experimental costs of the platform. Therefore, too small a wave period is not suitable for wave energy generation, even if the system can fully respond to waves. A larger wave period reduces the system demand but also reduces the output power, so there is a trade-off between wave period and system output to determine a suitable system frequency according to the ocean conditions.
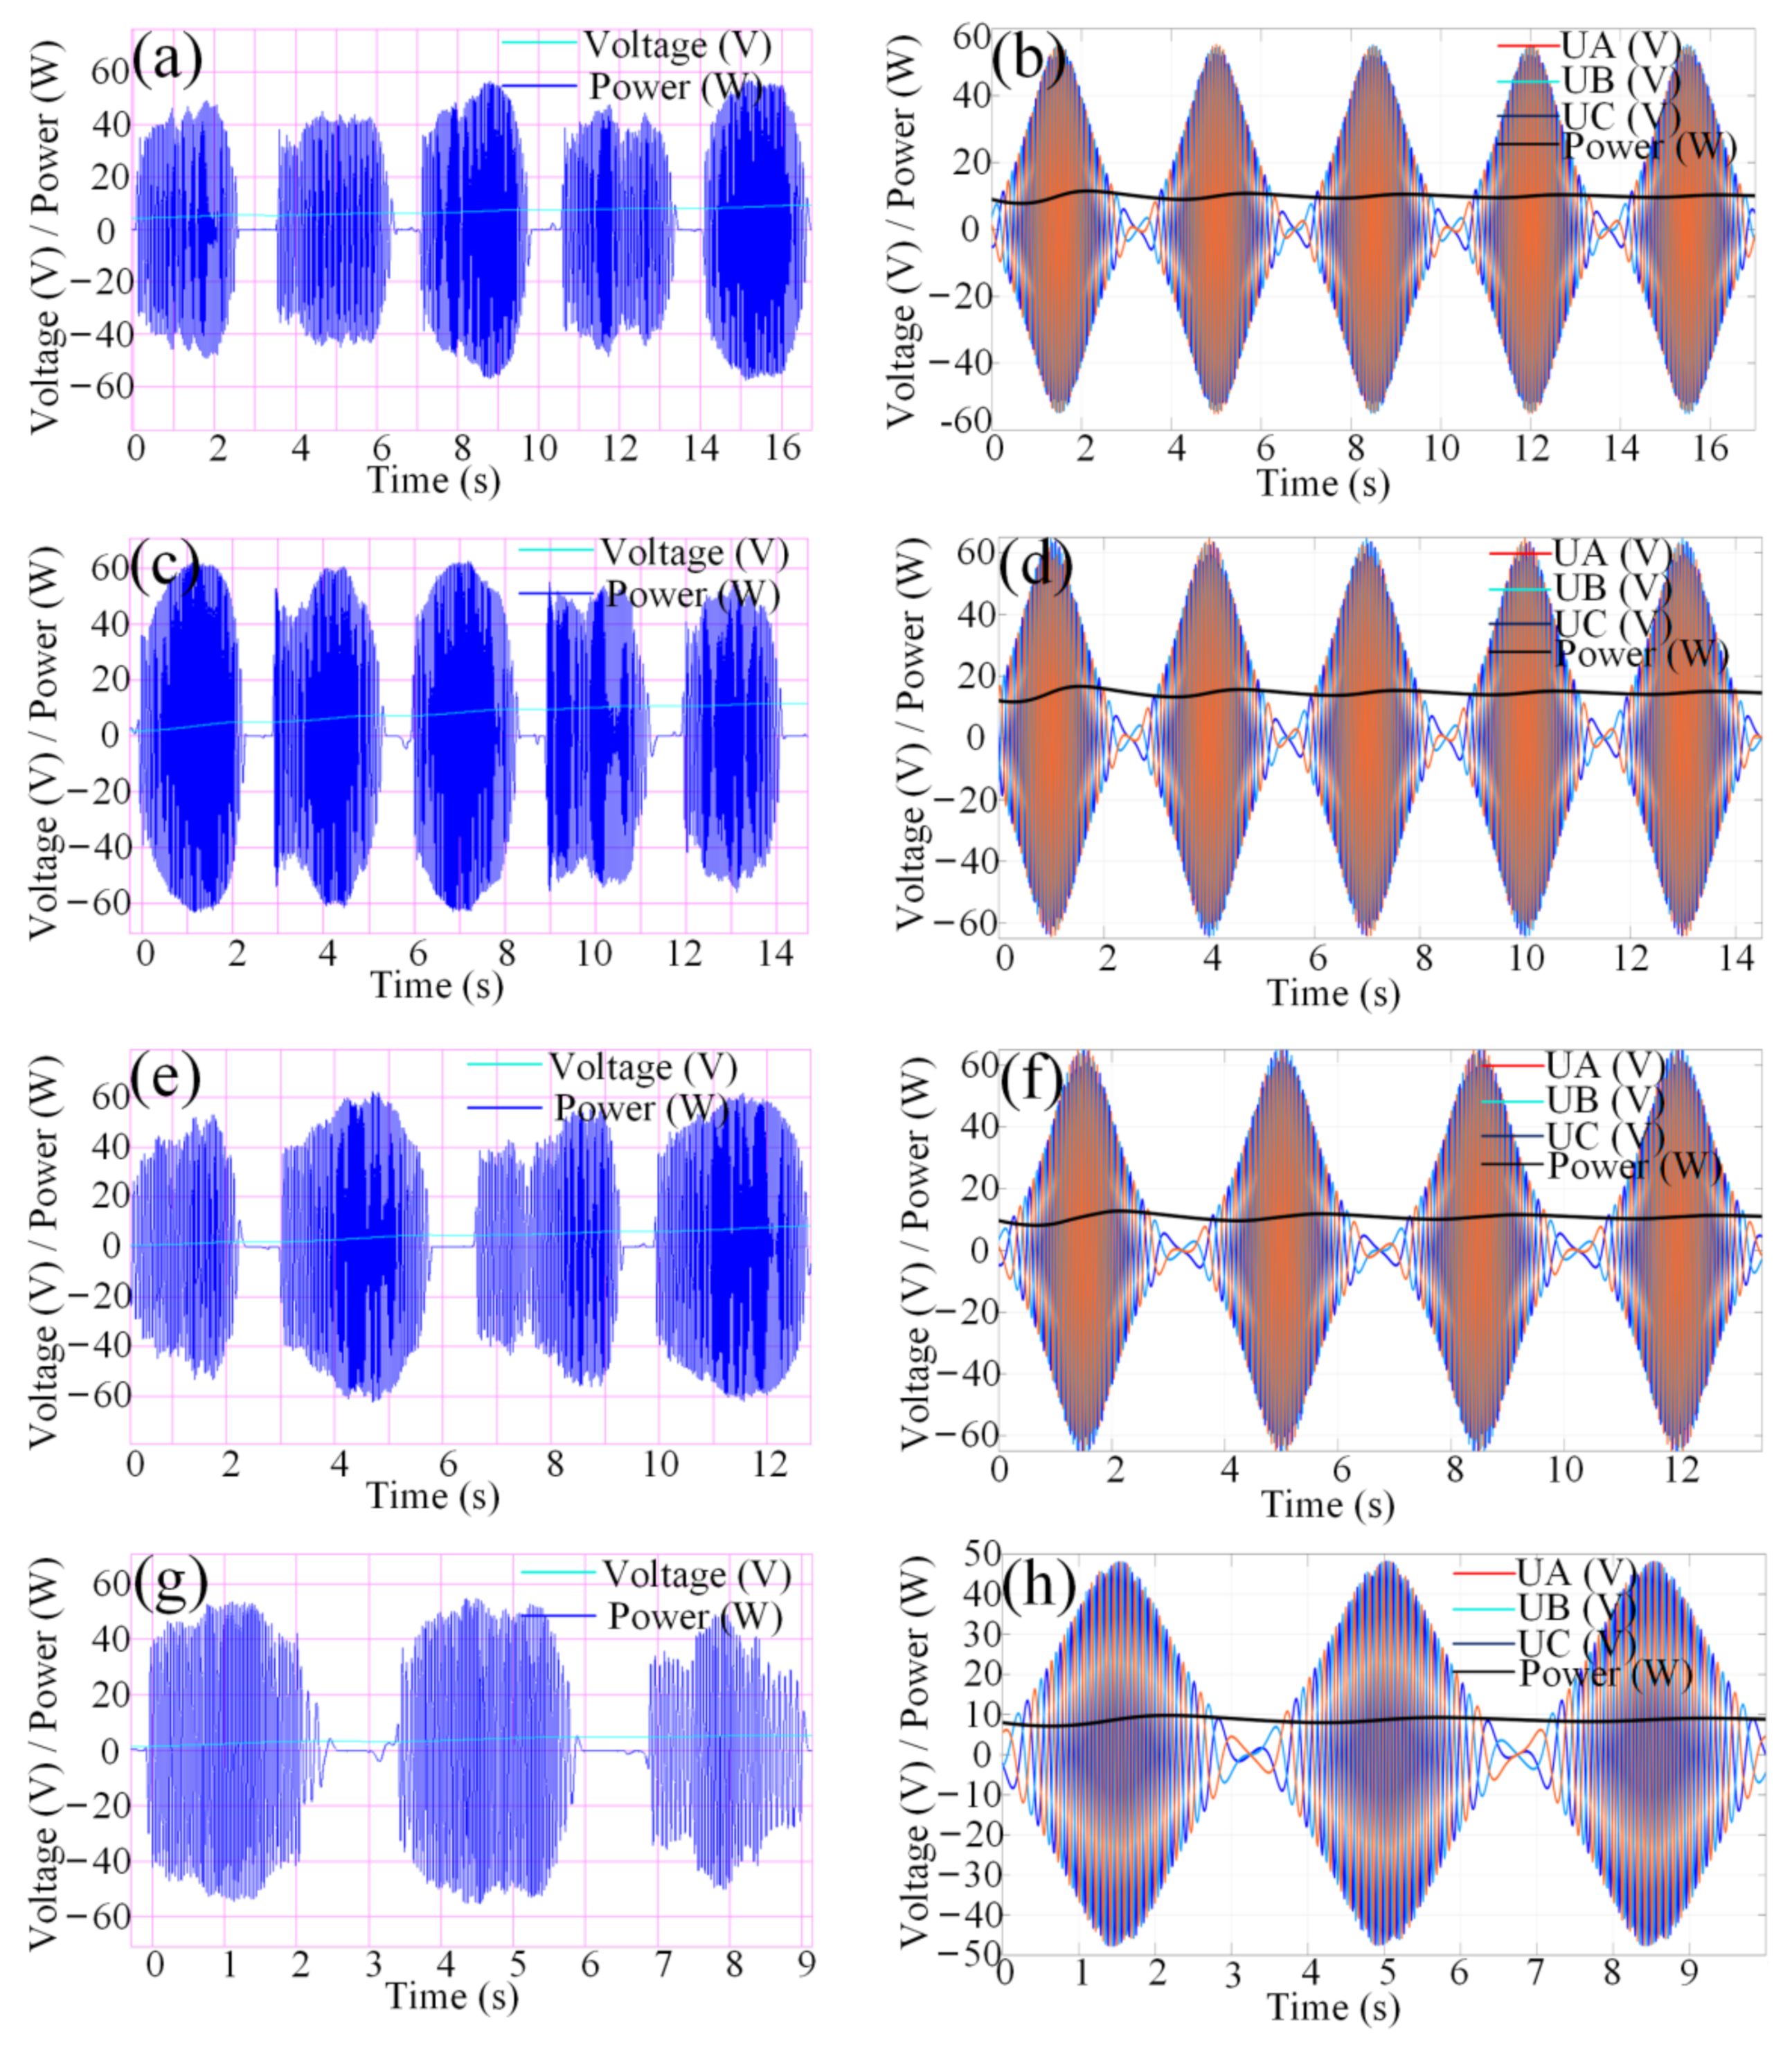
6. Experimental Tests
The purpose of this experiment is to validate the proposed numerical model using the designed hardware facilities and to explore the theoretical operating conditions of the GWEC. Regular waves in the design range are simulated in experimental tests, limited by the physical conditions of the test platform. The controlled variable method was used in this experiment, which means only one parameter was changed for each experiment relative to the rated operating state. The voltage of the resistor at the output of the PTO was collected and the actual output power of the system was obtained to verify the power generation performance of the GWEC.
Figure 12 shows the comparison plots of voltage and power between the experiment and simulation under different conditions (experimental curves on the left and simulation plots on the right). Where
Figure 12a,b show the curves for rated conditions,
Figure 12c,d decrease the wave period, while
Figure 12e,f increase the wave amplitude and
Figure 12g,h decrease the flywheel rotational speed compared to rated condition. It can be concluded that the voltage and power curves of the PTO output under each experimental condition are similar to the simulation from
Figure 12, but the experimental graphs are not as smooth as the theoretical curves due to the limitation of the experimental environment and hardware facilities.
Table 4 summarizes the errors and percentage errors of voltage and power between the models for each condition. The maximum percentage error of voltage is 6.06%, while the maximum percentage error of power is 12.63%, and the average voltage output percentage error is 3.62% and the power output percentage error is 9.91%. The results show that the theoretical numerical model is verified by the experimental data under this experimental condition exploration, and the energy output performance of the proposed device in this paper can be evaluated accurately by this model.


