
A Systematic Improvement Model to Optimize Production Systems within Industry 4.0 Environments: A Simulation Case Study


Abstract
:Featured Application
Abstract
1. Introduction
2. Methodology, Fundamentals, and Materials
2.1. Methodology
- Literature research on:
- (a)
- Evolution of industrial revolutions and production systems.
- (b)
- LM and strategies for improvement.
- (c)
- Challenges of LM and strategies for improvement.
- The development of a conceptual model describing a systematic sequence for optimization. It was designed as a framework for informed decision making when selecting the appropriate strategies, concepts, techniques, and steps for the improvement of organizational processes.
- The design of simulation models and the assessment of the different stages and their improvements along the optimization sequence, as described in the conceptual model. In addition, the models simulated the potential impacts of the main steps.
- A discussion of results in regard to the potential projects that may be selected as well as the project management required for business improvement strategies and Industry 4.0 outcomes.
- A critical reflection of the research performed as well as suggestions for potential future research based on the research and results of this paper.
2.2. Industrial Revolutions and Production Systems
2.3. Lean Production System and Improvement Strategies
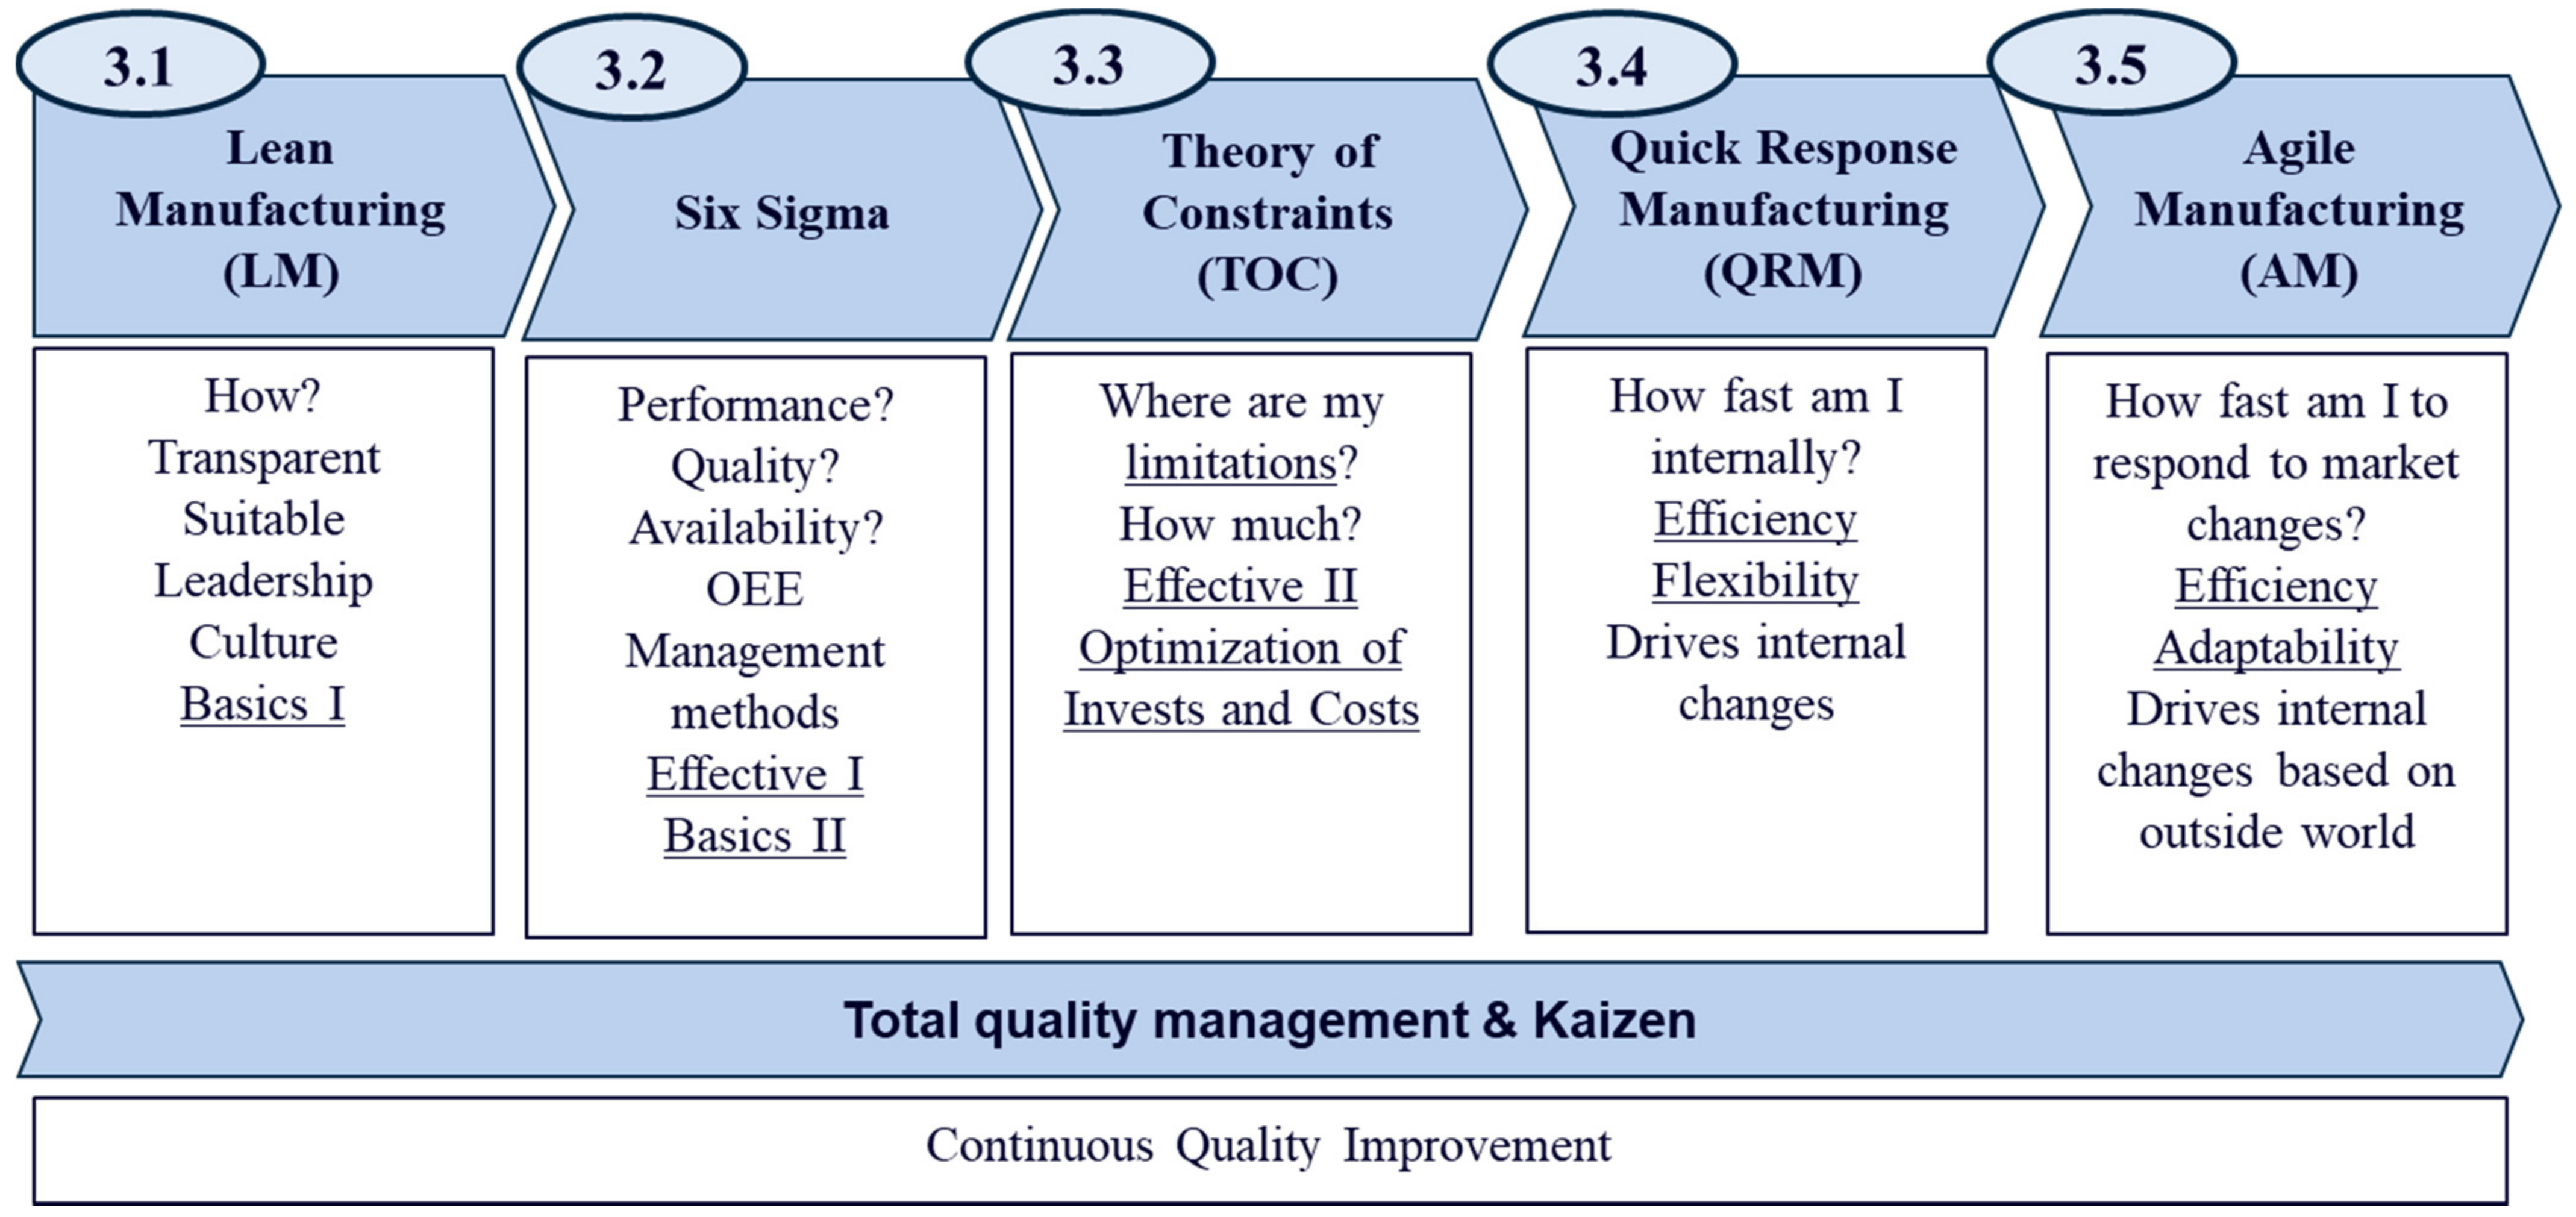
- Lean manufacturing places two management goals above any other: continuous improvement and the constant need for waste reduction [16] to reduce costs [6]. LM seeks to continuously decrease costs, defects, and inventories while increasing product variety [38]. The principles of LM eliminate waste in every function within a company; although, at the very beginning, it had been focused on production [6]. To achieve this goal, Toyota applied the scientific method to all levels of the workforce, ensuring that people shared a common goal and vision of what the production system should be [39]. Without using lean methods and improving processes, the processes could become unstable. Stability is defined as the capability to produce consistent results over time. Instability is the result of process variability. The first step in creating lean processes is to achieve a basic level of process stability that can be consistently maintained [40].
- Six sigma is a management philosophy developed by Motorola in 1986 that requires setting extremely high objectives, collecting data, and analyzing results to reduce defects in products and services. Today, it is used in many industrial sectors. It has also been referred to as a systematic approach to the quality improvement of process outputs with variability minimization in manufacturing and business processes [15]. Six sigma helps to manage the challenge of complexities in products and processes by minimizing the risk of low quality by controlling variability. After inception of TQM in the early 1980s, six sigma arrived as an element of TQM that was seen an evolution in quality management [19]. Six sigma is a systematic methodology aimed at operational excellence through continuous process improvements that have been successfully implemented worldwide for over 20 years, producing significant improvements to the profitability of many large and small organizations [41]. Six sigma has been called the best-known approach to process improvement. It was initially introduced in manufacturing processes; today, it is applied in all areas of organizations [41].
- The origins of TOC date back to the late 1970s when Eli Goldratt helped to develop a scheduling program that increased a plant’s output through optimized production technology (OPT), and it was officially introduced in the U.S. in 1980. The theory of constraints involves a continuous-improvement approach that identifies, exploits, and manages the constraints on a system to increase its throughput [42]. TOC can respond to an increasing number of variants in the production processes that can bottleneck resources. By identifying a constraint or bottleneck in a system that affects the throughput, TOC converts into a “pacemaker” [8]. According to Goldratt, while dealing with constraints, managers are required to make three decisions. These are [4]:
- o
- Decide what to change by identifying core problems;
- o
- Decide what to change to develop simple, practical solutions;
- o
- Decide how to cause the change by implementing solutions.
- Quick response manufacturing (QRM) was introduced in 1998 by Suri, and it was derived from the concept of time-based competition (TBC) [8]. QRM answers the challenge of low-volume–high-variety production systems, which required a different approach to process improvement and performance [7]. It reduces the lead time of the provided products to satisfy customers and respond rapidly to the actual demand, which is why it is often used in dynamic production with high variety and customization. However, it is a company-wide strategy that strives to reduce lead times in all operations across the whole organization, leading to improved quality, reduced costs, and quick response [8]. The QRM approach uses a mathematical foundation that explores the concepts of queuing theory and systems dynamics [16]. QRM principles reduces lead time using a step-by-step methodology, manufacturing techniques, as well as analysis methods and tools that take into consideration fundamental principles of system and manufacturing dynamics [6].
- The concept of agile manufacturing was proposed in 1991 at the end of a government-sponsored research effort at Lehigh University. Being “agile” refers to the capability to manage change and uncertainty as well as to integrate a business’ employees and information tools in all aspects of production. For businesses, agility translates into cooperation that enhances competitiveness. An agile partnership crosses company borders and works together [43]. Agile manufacturing is an approach for remaining competitive in a global business world by using market knowledge and virtual corporations to exploit profitable opportunities in a dynamic marketplace [15]. While agile manufacturing is responsive to survive in continuously and unpredictably changing environments, it focuses on a fast response throughout the supply chain to mitigate the effects of variability [8].
2.4. Materials
- Books, conferences, and articles: a selection of books, conference proceedings, and articles were procured by searching using keywords for improvement strategies, business and process improvement, lean manufacturing, six sigma, lean sigma, theory of constrains, quick response manufacturing, agile manufacturing as well as combinations of the terms, such as “lean manufacturing” and “six sigma” in order to discover existing research methodologies and use cases for their combination.
- System dynamics: system dynamics (SD) is a computer-guided approach for studying, managing, and solving complex feedback problems with a focus on policy analysis and design [44]. It is a methodology for the simulation of dynamic models by studying the characteristics of the information feedback of industrial systems. SD has been applied to various systems from corporate strategy to the dynamics of diabetes, and it can be applied to any dynamic system with any time and spatial scale [45]. In an organizational context, SD assists in determining which policies should be used based on the organizational system results over time [46]. It was the perfect methodological tool to validate and quantify the steps of the systematic improvement model.
- Vensim: Simulation is the only practical way to test models [45], and for this reason, simulation was used to reproduce our model. In the market, there are different software packages and languages that enable system dynamics modeling, such as AnyLogic, Dynamo, iThink, Powersim, Stella, and Vensim [47]. VENSIM simulation software was selected for this research work. Vensim is a registered trademark of Ventana Systems Inc. (Harvard, MA, USA) and serves as a platform to build stock and flow model diagrams as well as causal loop diagrams.
3. Conceptual Development for Systematic Improvement Model
3.1. Characterization of Improvement Strategies
3.2. Optimization Sequence Steps
- What are the means that can be used for improvement?
- What is the current organizational status?
4. Production System Case Study
- A generic simulation model that would serve as a basis for developing specific simulation models. It would provide the required complexity level as well as implement the criteria for later comparisons.
- Specific simulation models for each main step in the optimization sequence determined by the data generated in Section 3, which included LM, SS, TOC, QRM, and AM (i.e., five simulation models plus a model into which no lean method had been introduced). The scope of these models did not include all methods, techniques, and systems within the concepts, but only a selection of them.
- The improvement of all relevant indicators along the improvement transformation line; this means that a better response of the target indicators is expected after each optimization step starting from the LM implementation and finishing with the AM implementation.
- Definition of the objective, scope, hypothesis, and methodology including a general description of target simulation models and scenarios;
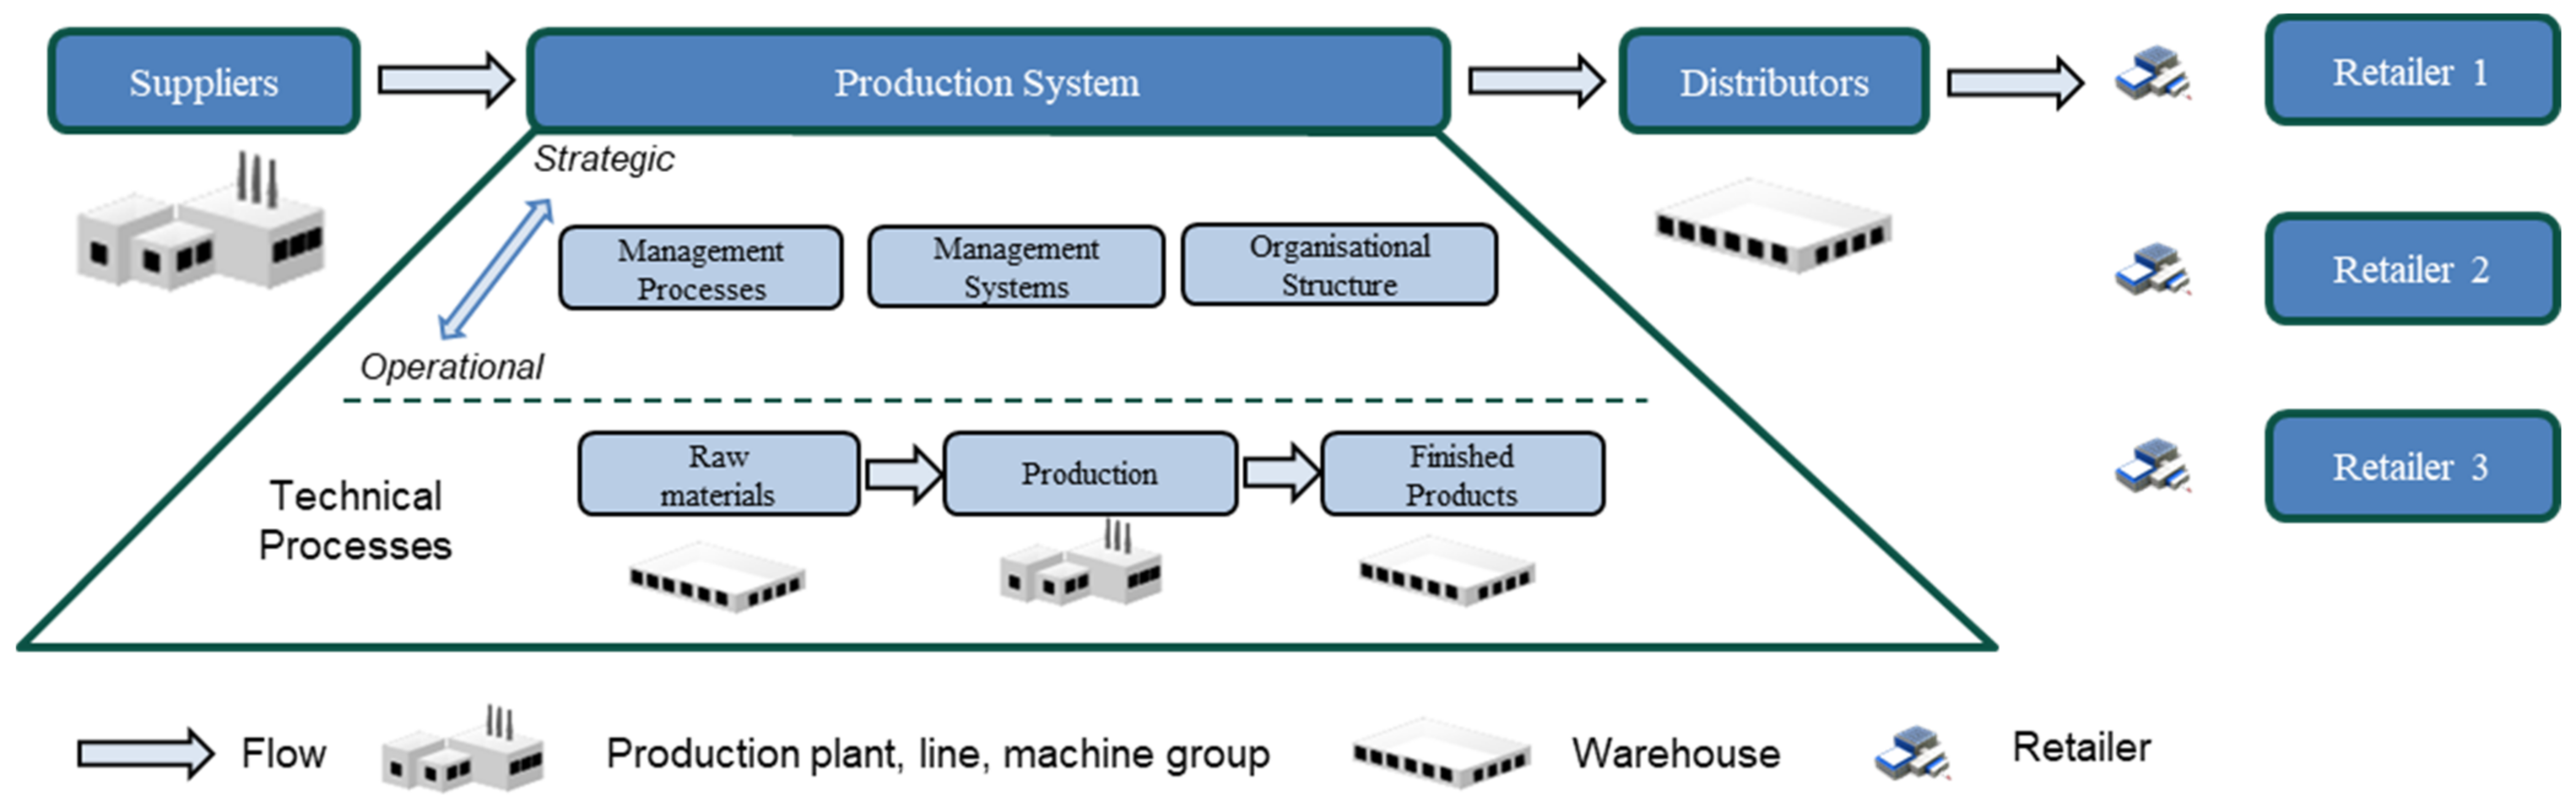
- Definition of the production system and its flow and characteristics;
- Definition of quantitative parameters and key performance indicators (KPIs) to obtain results and compare models;
- Development of the interrelationship among variables within the model;
- Description of the main assumptions to simplify the complexity of the model;
- Conditions that made a comparison between models possible;
- Creation of the simulation models that were dependent on the improvement status;
- Validation of the behavior of the simulation models;
- Determination of scenarios;
- Simulation and extraction of results;
- Evaluation of the results and conclusions.
4.1. Design of the Generic Case Study
- Definition of the production system and its flow and characteristics;
- Definition of quantitative parameters and key performance indicators (KPIs) to obtain results and compare models;
- Development of the interrelationship among variables within the model;
- Description of the main assumptions to simplify the complexity of the model;
- Creation of a generic simulation model based on the logic formulation;
- Conditions that made a comparison between models possible.
4.1.1. Structure of the Simulation Case Study: Production System Flow and Characteristics
4.1.2. Key Performance Indicators
- Cumulated market demand (# thousand products);
- Cumulated real demand (# thousand products);
- Cumulated production (# thousand products): the cumulative sum of all units produced over the 500 simulated-production weeks;
- Ø Availability of the production plant (%);
- Ø Performance at the final production step (# thousand products/week);
- Ø Quality at the final production step with one-way and no loops (%);
- Cumulated capacity utilization of the production plant (%);
- Ø Labor productivity (products/employee × week);
- Cumulated stocks (# million products);
- Ø Production lead time (# weeks);
- Cumulated service level (%);
- Profits ($ million);
- Cumulated operational costs ($ million);
- Cumulated investment ($ million);
- Return on investment (ROI) (%).
4.1.3. Assumptions
- Time restrictions: first, we defined a time horizon and units of time. In this study, we simulated ten working years, or 500 weeks, to evaluate influences in the medium and long terms.
- Production times for the two products in the supply chain were not variable.
- Times for material transport and employee movements were not variable.
- Distribution of finished products as given.
- Procurement of raw material as given.
- Demand change depended on service level. Therefore, market demand was reduced in quantity of units to real demand.
- Each order had a production unit.
- Bills of materials were not considered.
- The same demand using replication.
- Same initial situation with no backlog and the same conditions of WIP (products on their ongoing transportation to the customers), the same initial inventory in the different warehouses, and initial inventory ready to deliver to customers.
- Same number of employees with same initial distribution and same capacity to perform warehouse activities.
- Same supply chain distribution network (production facility, warehouses, etc.).
- The warehouses had no stock capacity limitations. It was assumed that outsourcing warehouses could be located with additional costs incurred.
- There were no transport limitations between the different production stages. It was assumed that additional third-party logistics could be found.
- One product unit was assumed to be in a mature stage with stable demand and provided USD 1000/unit of margin. The second product was in the process of being launched and provided USD 2000/unit. These values were used to calculate profits. It was assumed that the new model would have a loss in volume due to unknown future demand.
- The simulation model considered sales loss starting from a customer order lead time greater than 60 days.
- A product was considered a finished product after it left the production facility.
4.2. Design of the Simulation Models Depending on the Improvement Status
- SMs before lean (status 0);
- SMs with lean manufacturing (status 1);
- SMs with six sigma (status 2);
- SMs with TOC (status 3);
- SMs with QRM (status 4);
- SMs with AM (status 5).
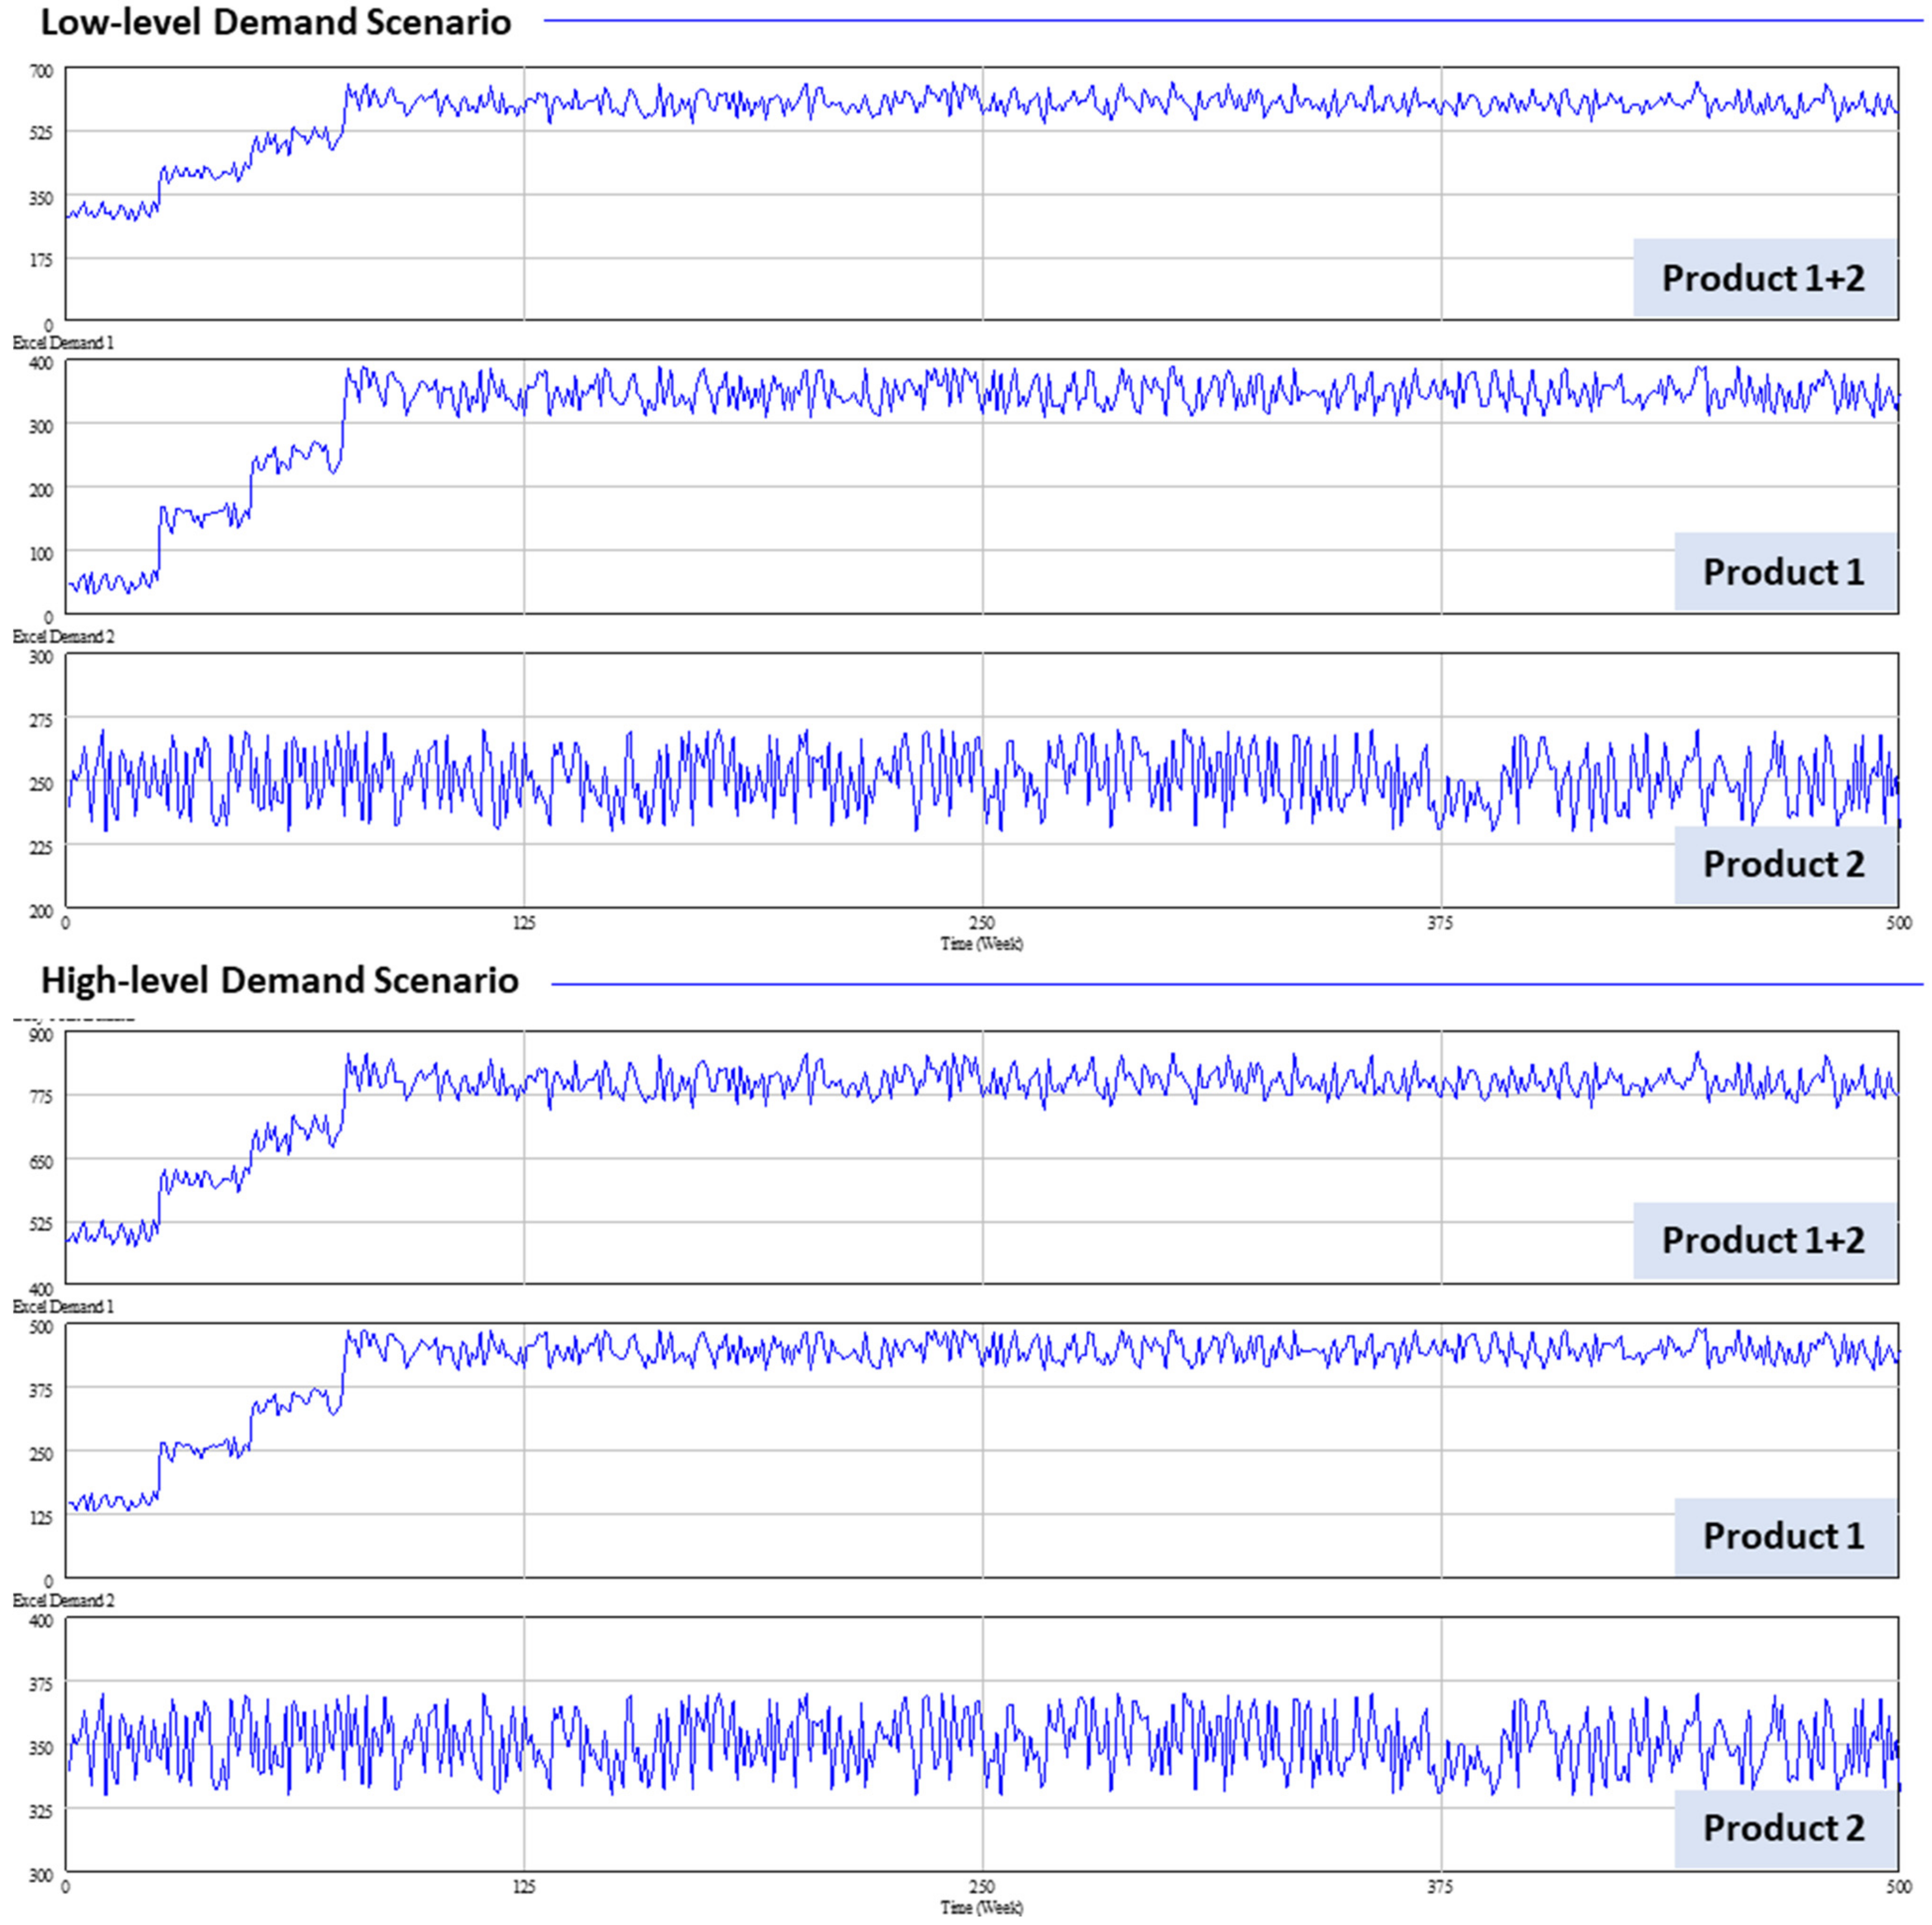
4.3. Simulation Scenarios
5. Simulation Results
6. Discussion
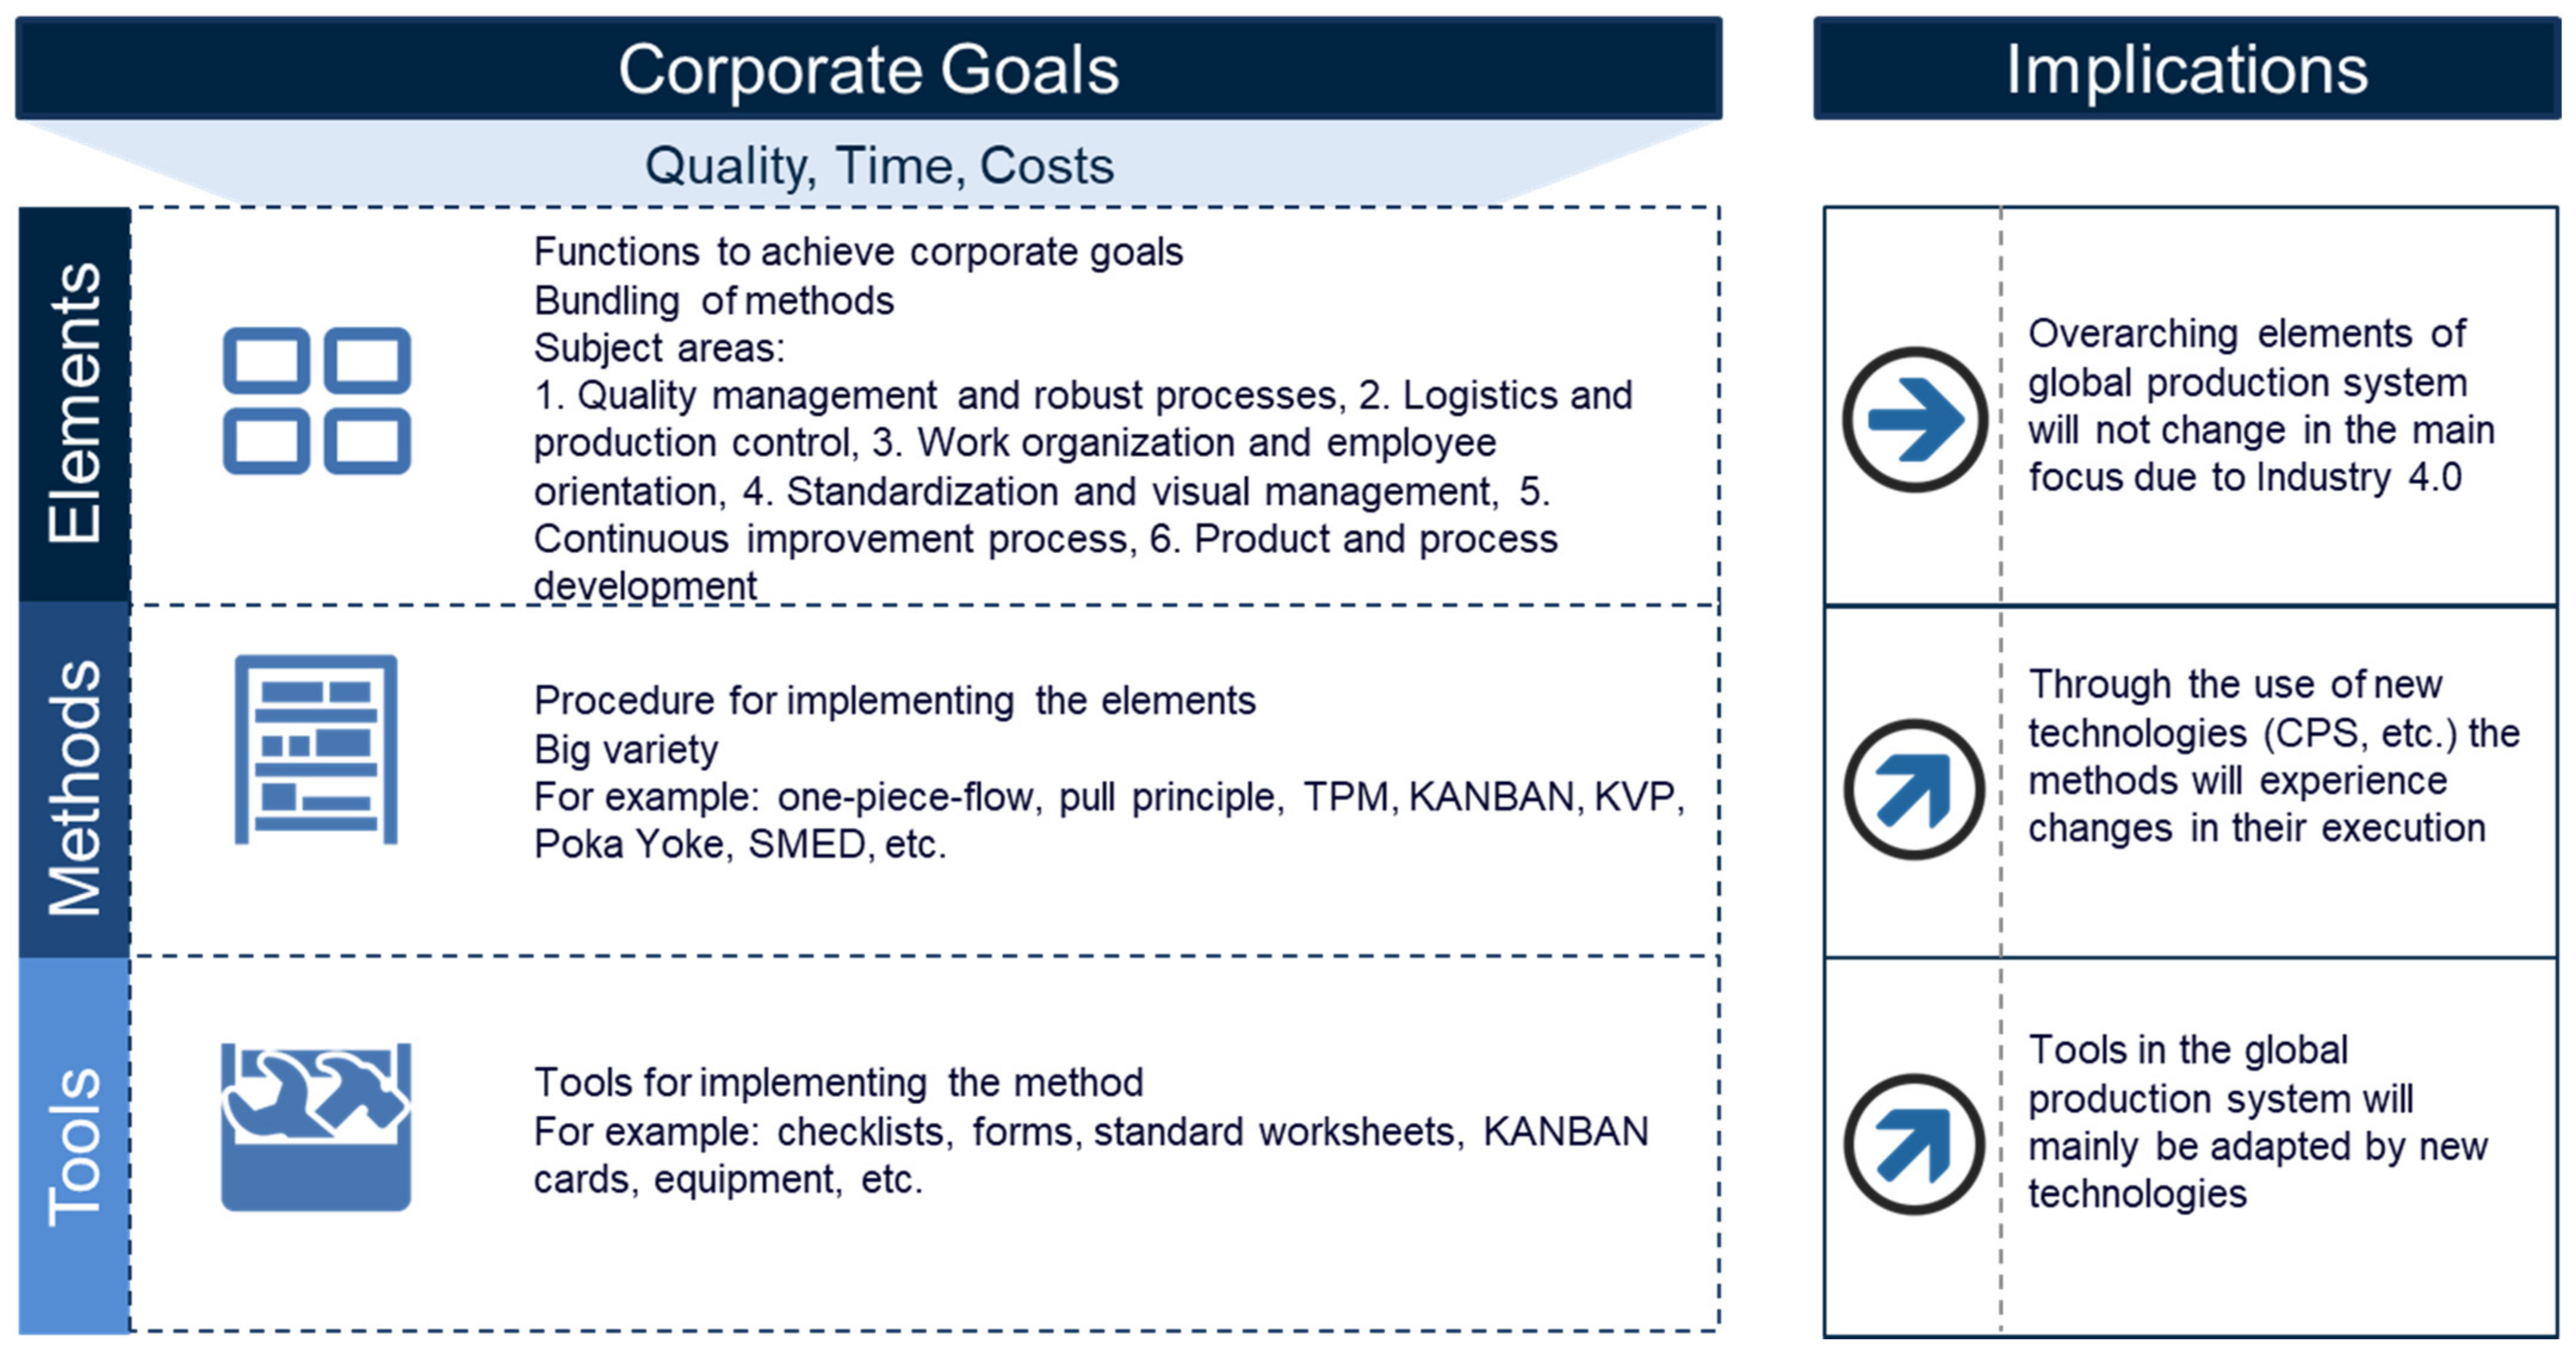
6.1. Industry 4.0 Impacts on the Production System Optimization Process
6.2. Improvement Strategies and Industry 4.0 in Project Decision Making and Management
- Describe the vision, strategy, and future scenarios.
- Examination of all functionalities or capabilities to reach the vision (e.g., top-down view).
- Compare target capabilities for all scenarios with actual capabilities.
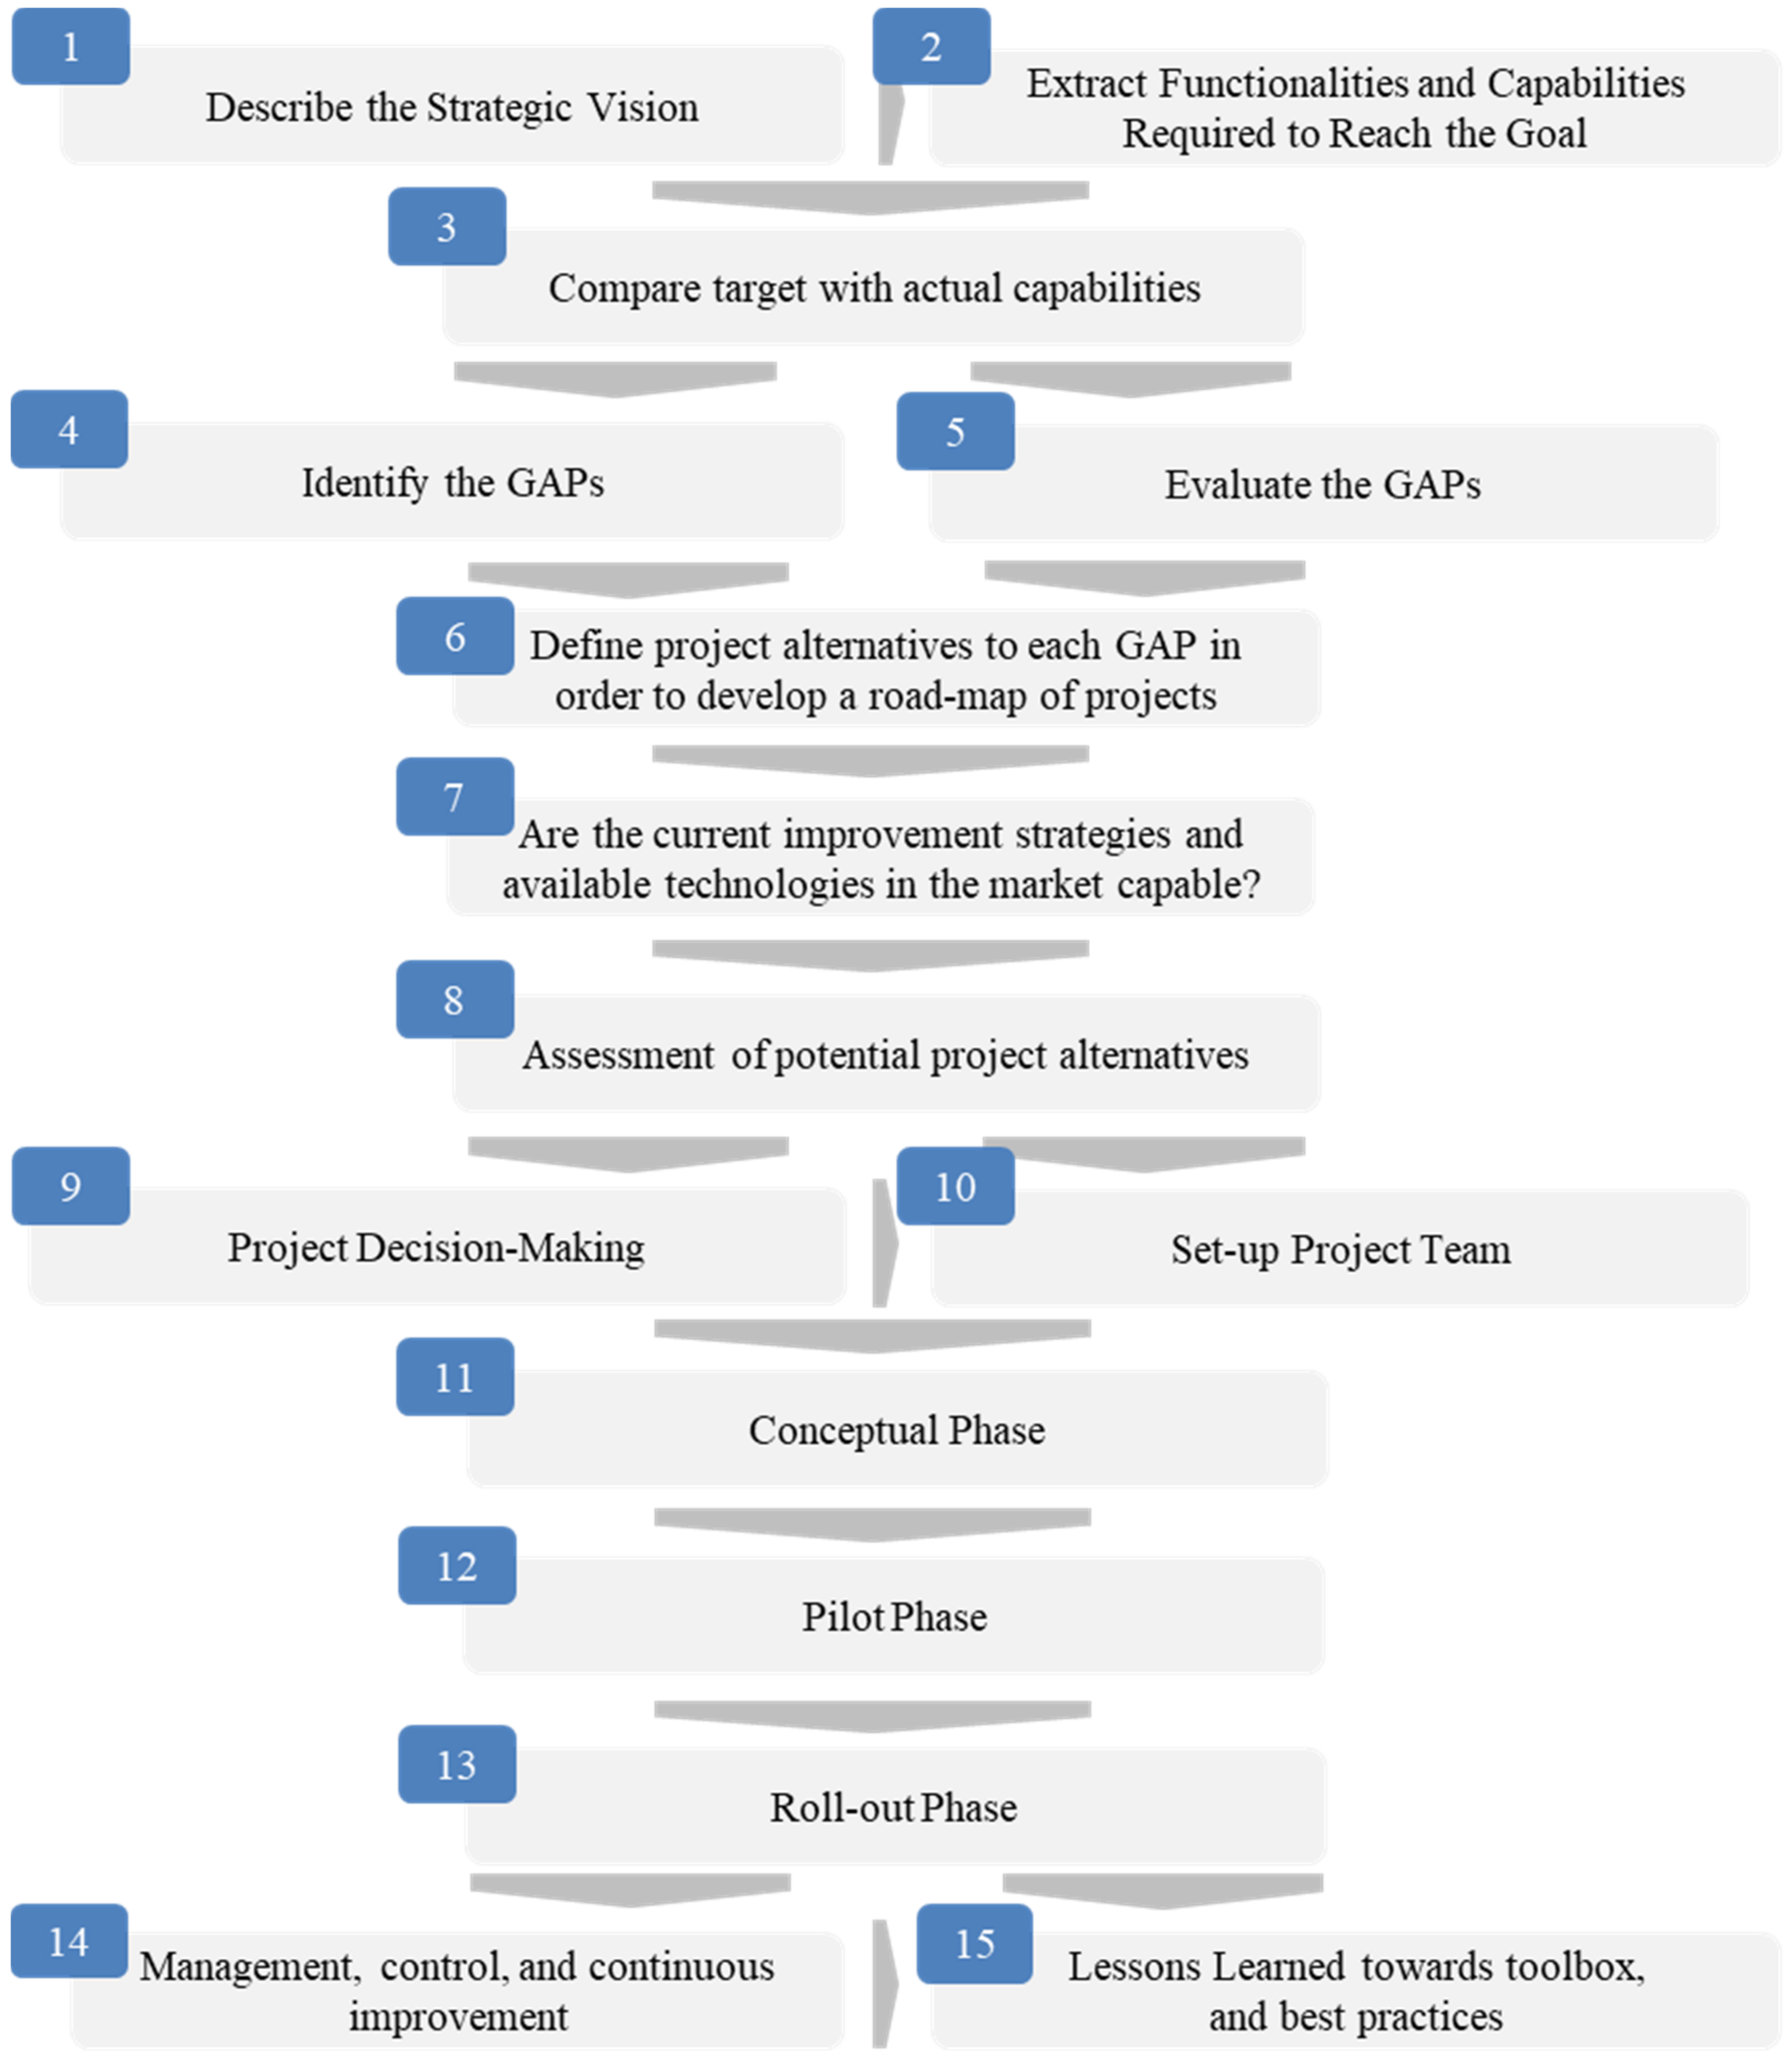
- Identify the gaps (e.g., bottom-up view): Based on the comparison, the deficits of the production system can be defined. The gaps could be specific problems of the organization, of a human or technical nature, or related to the manufacturing paradigms in place (e.g., LM or SS), or the current interface between the process and the implemented Industry 4.0 technologies. The gaps could refer to the sustainable interaction of employees with new technologies, to the security of new technologies, to the effectiveness and efficiency of business processes as well as to the information systems and software in use. Industry 4.0 has made digital innovations, products, and services accessible but has almost eliminated the human role in a company’s workflow. Industry 5.0, the fifth industrial revolution that is still in its infancy, focuses on human and device cooperation within a production process. Returning the human aspect to the very essence of industrial production leads to workers trained to provide value-added production tasks, thus achieving mass adaptation and personalization of products or services for the end-user. The establishment of a society based on information and communication technologies and focused on the human aspect is a fundamental determinant of the environment of Society 5.0, which will follow the development of Industry 5.0 [58]. Moreover, it is crucial to choose the optimal information and communication services that will be required for the process relationships among elements, people, and stakeholders, as it is fundamental for any future success in process improvement [59].
- Evaluate the gaps: The implications in the systems and in the different scenarios– priorities to them. Determine what needs to be addressed first in relation to organizational strategy and management goals.
- Define project alternatives to close each gap in order to develop a roadmap of projects according to the priorities and based on time and budget constraints. For that purpose, the developed systematic business improvement model can be applied. Identify if, for this specific business improvement process, Industry 4.0-related technologies are needed to reach the target level and if they are compatible in parallel or in sequence. Alternatives can be one of the following three types:
- Improvement strategies;
- Industry 4.0 technologies;
- A mix of improvement strategies and Industry 4.0 technologies, in sequence or in parallel.
- Determine if the current improvement strategies and availabel technologies in the market are capable of closing the gaps. If they can, assess which ones and how to implement them. If not, the development of an improvement strategy that will either address the deficiencies or work with them is required.
- Assess the potential project alternatives while considering expected sequence steps including related Industry 4.0 technologies, tools, or systems to be implemented as well as human resource requirements. In fact, the European industrial structure is undergoing a transformation in the management of digital and other new technologies and new business models. Smart manufacturing systems (SMS) have attempted to maximize the productivity, the agility, the sustainability, and the quality of manufacturing through the intensive use of advanced contemporary technologies, especially information and communication technologies, along with intelligent software applications [60].
- Employ decision making based on predefined criteria. For example, investments and costs with risk and viability levels should be assessed and defined. The risk concept has to be expanded as a consequence of technological development in order to consider security as one of the issues that need to be addressed continuously. Cyber threats are significant when adopting the Internet of Things technologies, and with its growth, the threats will continue to increase due to their dynamic nature, which implies the need for dynamic security solutions capable of adaptation [61].
- Coordinate a project team and project kick-off meeting.
- Conceptual phase: This involves the conceptual development of a solution for a specific problem or for a future capability that will be required and/or benefit the organization. Interviewing personnel at different levels and acquiring their insight will improve the overall outcomes and allow the organization to adapt more effective strategies based on a deeper awareness of the challenges that may be involved. Moreover, specialists and experts may need to be recruited as consultants to assist in designing a stronger foundational concept.
- Pilot phase: This phase consists of proving the benefits and increasing the likelihood of a successful outcome for potential improvements and technologies as well as revealing unexpected challenges and difficulties that will need to be addressed. The involvement of improvement and technology experts may be required to discuss and define the areas of action with higher potential as well as for the identification of high-impact and low-resource potentials. After the pilot or testing phase, the potentials can be compared with the target outcomes defined when the project was designed, such as the capabilities, the implementation time, investment and cost levels, etc.
- Roll-out phase: This phase establishes the appropriate processes and technologies for a global production system. There should be always a decision-making point after which the project will continue with the roll-out organization-wide, or it will be suspended. Factors may change or unexpected issues may arise that may highly influence this point of decision.
- Management, control, and continuous improvement: continuous improvement and review of the capabilities and cost–benefit application of each project is crucial for long-term success.
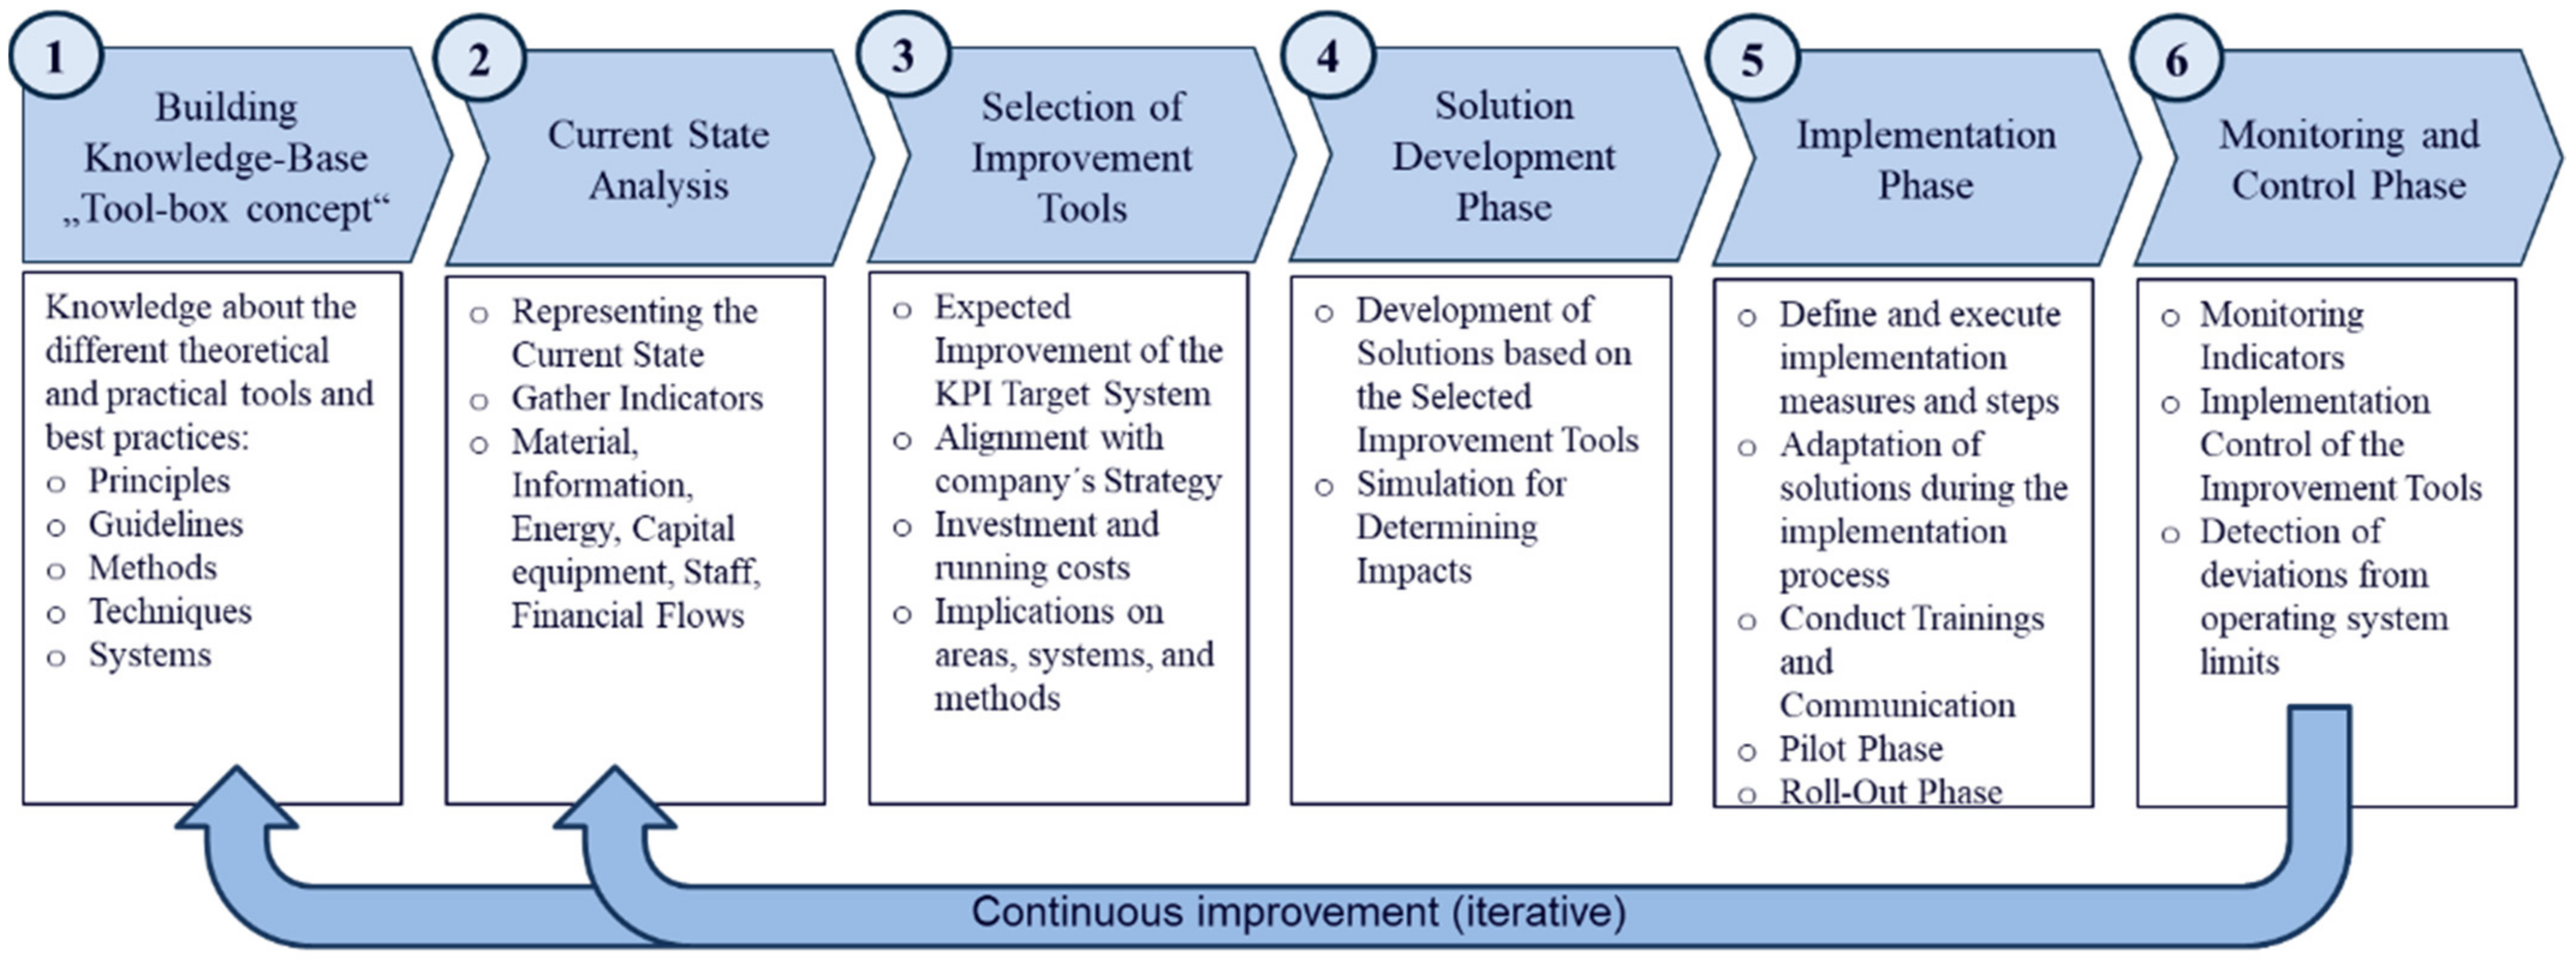
- Develop a knowledge base: Recording the progress and feedback during the implementation of an improvement project can support future improvements and enable organizations to more accurately predict their success. In addition, developing expert systems and customizable solutions as well as enacting industry best practices are critical elements for competitiveness in any industry.
7. Conclusions
- All the steps along the process provided an improvement in KPIs.
- Higher improvement was dependent on market need.
- When the internal capabilities were the constraint, the TOC as well as the QRM and the AM principles performed better overall on the experimental production system.
- When the market was the constraint, lower demand defined the capacity of the production system, and LM and SS provided better performance overall, as they improved the process effectiveness and efficiency as well as the quality, which are directly related to improved customer satisfaction, service levels, and experience and have the potential to increase the demand for more volume. In these cases, QRM also provided improvement if lead time was the cause of the low demand. Moreover, if the markets were not stable and major disruption had been indicated, AM provided the capability to react to them even while KPIs were required to improve.
Author Contributions
Funding
Institutional Review Board Statement
Informed Consent Statement
Conflicts of Interest
References
- Vaidya, S.; Ambad, P.; Bhosle, S. Industry 4.0–A glimpse. Procedia Manuf. 2018, 20, 233–238. [Google Scholar] [CrossRef]
- Oztemel, E.; Gursev, S. Literature review of Industry 4.0 and related technologies. J. Intell. Manuf. 2020, 31, 127–182. [Google Scholar] [CrossRef]
- Wang, S.; Wan, J.; Li, D.; Zhang, C. Implementing Smart Factory of Industrie 4.0: An Outlook. Int. J. Distrib. Sens. Netw. 2016, 12, 1–10. [Google Scholar] [CrossRef] [Green Version]
- Rahman, S.U. Theory of constraints: A review of the philosophy and its applications. Int. J. Oper. Prod. Manag. 1998, 18, 336–355. [Google Scholar] [CrossRef]
- Filho, M.G.; Saes, E.V. From time-based competition (TBC) to quick response manufacturing (QRM): The evolution of research aimed at lead time reduction. Int. J. Adv. Manuf. Technol. 2013, 64, 1177–1191. [Google Scholar] [CrossRef]
- Garza-Reyes, J.A.; Lim, M.K.; Zisis, S.; Kumar, V.; Lona, L.R. Adoption of operations improvement methods in the Greek engineering sector. In Proceedings of the 2015 International Conference on Industrial Engineering and Operations Management (IEOM), Dubai, United Arab Emirates, 3–5 March 2015; pp. 1–8. [Google Scholar]
- Godinho Filho, M. Complementing lean with quick response manufacturing: Case studies. Int. J. Adv. Manuf. Technol. 2017, 90, 1897–1910. [Google Scholar] [CrossRef]
- Stump, B.; Badurdeen, F. Integrating lean and other strategies for mass customization manufacturing: A case study. J. Intell. Manuf. 2009, 23, 109–124. [Google Scholar] [CrossRef]
- Demirci, T. A Model for Assessing and Evaluating Production Process Effectiveness When Applying Lean Production-A Case Study. Bachelor’s Thesis, Linnaeus University, Växjö, Sweden, 2012. [Google Scholar]
- Bamford, D.; Forrester, P.; Dehe, B.; Leese, R.G. Partial and iterative Lean implementation: Two case studies. Int. J. Oper. Prod. Manag. 2015, 35, 702–727. [Google Scholar] [CrossRef] [Green Version]
- Azevedo, S.G.; Govindan, K.; Carvalho, H.; Machado, V. An integrated model to assess the leanness and agility of the automotive industry. Resour. Conserv. Recycl. 2012, 66, 85–94. [Google Scholar] [CrossRef]
- Laureani, A.; Antony, J. Reducing employees’ turnover in transactional services: A Lean Six Sigma case study. Int. J. Product. Perform. Manag. 2010, 59, 688–700. [Google Scholar] [CrossRef]
- Atanas, J.P.; Rodrigues, C.; Simmons, R. Lean Six Sigma Applications in Oil and Gas Industry: Case Studies. Int. J. Sci. Res. Publ. 2015, 6. [Google Scholar] [CrossRef]
- Kim, Y.W.; Han, S.H. Implementing Lean Six Sigma: A case study in concrete panel production. In Proceedings of the 20th Annual Conference of the International Group for Lean Construction, San Diego, CA, USA, 18–20 July 2012; pp. 18–20. [Google Scholar]
- Ben Naylor, J.; Naim, M.M.; Berry, D. Leagility: Integrating the lean and agile manufacturing paradigms in the total supply chain. Int. J. Prod. Econ. 1999, 62, 107–118. [Google Scholar] [CrossRef]
- Filho, M.G.; Marchesini, A.G.; Riezebos, J.; Vandaele, N.; Ganga, G.M.D. The extent of knowledge of Quick Response Manufacturing principles: An exploratory transnational study. Int. J. Prod. Res. 2016, 55, 4891–4911. [Google Scholar] [CrossRef]
- Dombrowski, U.; Richter, T.; Krenkel, P. Interdependencies of Industrie 4.0 & Lean Production Systems: A Use Cases Analysis. Procedia Manuf. 2017, 11, 1061–1068. [Google Scholar] [CrossRef]
- Martínez-Jurado, P.J.; Moyano-Fuentes, J. Lean management and supply chain management: Interrelationships in the aer-ospace sector. In Operations and Service Management: Concepts, Methodologies, Tools, and Applications; IGI Global: Hershey, PA, USA, 2018; pp. 1208–1242. [Google Scholar]
- Gupta, V.; Jain, R.; Meena, M.L.; Dangayach, G.S. Six-sigma application in tire-manufacturing company: A case study. J. Ind. Eng. Int. 2018, 14, 511–520. [Google Scholar] [CrossRef] [Green Version]
- Siong, B.C.; Eng, C.K. Implementing Quick Response Manufacturing to Improve Delivery Performance in an ETO Company. Int. J. Eng. Technol. 2018, 7, 38–46. [Google Scholar] [CrossRef]
- Thombansen, U.; Schuttler, J.; Auerbach, T.; Beckers, M.; Buchholz, G.; Eppelt, U.; Klocke, F. Model-based self-optimization for manufacturing systems. In Proceedings of the 2011 17th International Conference on Concurrent Enterprising, Aachen, Germany, 20–22 June 2011; pp. 1–9. [Google Scholar]
- Qin, J.; Liu, Y.; Grosvenor, R. A Categorical Framework of Manufacturing for Industry 4.0 and Beyond. Procedia CIRP 2016, 52, 173–178. [Google Scholar] [CrossRef] [Green Version]
- Schuh, G.; Stich, V.; Wienholdt, H. Logistikmanagement; Springer: Berlin/Heidelberg, Germany, 2013. [Google Scholar]
- Scheer, A.W. Industrie 4.0: Wie Sehen Produktionsprozesse im Jahr 2020 aus; IMC AG: Saarbrücken, Germany, 2013. [Google Scholar]
- Siller, U. Optimierung Globaler Distributionsnetzwerke: Grundlagen, Methodik, Praktische Anwendung; Gabler Verlag: Wiesbaden, Germany, 2011. [Google Scholar]
- Stock, T.; Seliger, G. Opportunities of Sustainable Manufacturing in Industry 4. Procedia CIRP 2016, 40, 536–541. [Google Scholar] [CrossRef] [Green Version]
- Permin, E.; Bertelsmeier, F.; Blum, M.; Bützler, J.; Haag, S.; Kuz, S.; Özdemir, D.; Stemmler, S.; Thombansen, U.; Schmitt, R.; et al. Self-optimizing Production Systems. Procedia CIRP 2016, 41, 417–422. [Google Scholar] [CrossRef]
- Zelenović, D.M. Flexibility—a condition for effective production systems. Int. J. Prod. Res. 1982, 20, 319–337. [Google Scholar] [CrossRef]
- Santamaría Peraza, R. La cadena de suministro en el perfil del ingeniero industrial: Una aproximación al estado del arte. Ing. Industrial. Actual. Nuevas Tend. 2012, 3, 39–50. [Google Scholar]
- Friedli, T.; Schuh, G. Wettbewerbsfähigkeit der Produktion an Hochlohnstandorten. Wettbew. Prod. Hochlohnstandorten 2012. [Google Scholar] [CrossRef]
- Ohno, T.; Bodek, N. Toyota Production System: Beyond Large-Scale Production; Productivity Press: New York, NY, USA, 2019. [Google Scholar]
- Singh, A.; Ahuja, I.S. Review of 5S methodology and its contributions towards manufacturing performance. Int. J. Process. Manag. Benchmarking 2015, 5, 408. [Google Scholar] [CrossRef]
- Peraković, D.; Periša, M.; Cvitić, I.; Zorić, P. Internet of Things Concept for Informing Visually Impaired Persons in Smart Factory Environments. In Industry 4.0: Trends in Management of Intelligent Manufacturing Systems. EAI/Springer Innovations in Communication and Computing; Knapčíková, L., Balog, M., Eds.; Springer: Cham, Switzerland, 2019. [Google Scholar] [CrossRef]
- Bhamu, J.; Sangwan, K.S. Lean manufacturing: Literature review and research issues. Int. J. Oper. Prod. Manag. 2014, 34, 876–940. [Google Scholar] [CrossRef]
- Alcalá Gámez, A. Situando el SMED como una herramienta de “Lean Manufacturing” para mejorar los tiempos de preparación, ajuste y cambios de herramientas. Bachelor’s Thesis, Universidad de Sonora, Sonora, Mexico, 2009. [Google Scholar]
- Roser, C.; Nold, D. Practical Boundary Case Approach for Kanban Calculation on the Shop Floor Subject to Variation. In Proceedings of the Security Education and Critical Infrastructures, Austin, TX, USA, 1–5 September 2019; Springer: Singapore, 2019; pp. 12–20. [Google Scholar]
- Ashrafian, A.; Powell, D.J.; Ingvaldsen, J.A.; Dreyer, H.C.; Holtskog, H.; Schütz, P.; Holmen, E.; Pedersen, A.-C.; Lodgaard, E. Sketching the Landscape for Lean Digital Transformation. In Proceedings of the Artificial Intelligence in Theory and Practice III, Brisbane, Australia, 20–23 September 2010; Springer: Singapore, 2019; pp. 29–36. [Google Scholar] [CrossRef]
- Womack, J.P.; Jones, D.T.; Roos, D. The Machine that Changed the World: The Story of Lean Production—Toyota’s Secret Weapon in the Global Car Wars that is Now Revolutionizing World Industry; Simon and Schuster: New York, NY, USA, 2007. [Google Scholar]
- Spear, S.; Bowen, H.K. Decoding the DNA of the Toyota production system. Harv. Bus. Rev. 1999, 77, 96–108. [Google Scholar]
- Liker, J.; Meier, D. The Toyota Way Fieldbook; McGraw-Hill: New York, NY, USA, 2006. [Google Scholar]
- Antony, J.; Gijo, E.; Childe, S.J. Case study in Six Sigma methodology: Manufacturing quality improvement and guidance for managers. Prod. Plan. Control. 2011, 23, 624–640. [Google Scholar] [CrossRef] [Green Version]
- Goldratt, E.M. Theory of Constraints; North River Croton-on-Hudson: Westchester, NY, USA, 1990. [Google Scholar]
- Hinckeldeyn, J.; Dekkers, R.; Altfeld, N.; Kreutzfeldt, J. Bottleneck-based synchronisation of engineering and manufacturing. In Proceedings of the International Association for Management of Technology—IAMOT 2010 Proceedings, Cairo, Egypt, 8–11 March 2010. [Google Scholar]
- Angerhofer, B.; Angelides, M. System dynamics modelling in supply chain management: Research review. In Proceedings of the 2000 Winter Simulation Conference Proceedings (Cat. No.00CH37165), Orlando, FL, USA, 10–13 December 2002; pp. 342–351. [Google Scholar]
- Sterman, J.D. Business Dynamics: Systems Thinking and Modeling for a Complex World; Irwin/McGraw-Hill: New York, NY, USA, 2000. [Google Scholar]
- Coyle, R.G. System Dynamics Modelling: A Practical Approach; Chapman & Hall: London, UK, 2008. [Google Scholar]
- Campuzano, F.; Bru, J.M. Supply Chain Simulation: A System Dynamics Approach for Improving Performance; Springer Science & Business Media: Berlin/Heidelberg, Germany, 2011. [Google Scholar]
- Smętkowska, M.; Mrugalska, B. Using Six Sigma DMAIC to Improve the Quality of the Production Process: A Case Study. Procedia Soc. Behav. Sci. 2018, 238, 590–596. [Google Scholar] [CrossRef]
- García, S.G.; Reyes, R.R.; García, M.G. Design of a Conceptual Model for improving company performance based on lean management applying the viable system model (VSM). EJEF Eur. J. Eng. Form. Sci. Artic. 2018, 2. [Google Scholar] [CrossRef]
- Capítulo 2 Marco Teórico. Available online: http://virtual.urbe.edu/tesispub/0067589/cap02.pdf (accessed on 15 November 2021).
- Golmohammadi, D. A study of scheduling under the theory of constraints. Int. J. Prod. Econ. 2015, 165, 38–50. [Google Scholar] [CrossRef]
- Fernandes, N.O.; do Carmo-Silva, S. Generic POLCA—A production and materials flow control mechanism for quick re-sponse manufacturing. Int. J. Prod. Econ. 2006, 104, 74–84. [Google Scholar] [CrossRef] [Green Version]
- Dubey, R.; Gunasekaran, A. Agile manufacturing: Framework and its empirical validation. Int. J. Adv. Manuf. Technol. 2015, 76, 2147–2157. [Google Scholar] [CrossRef]
- Gunasekaran, A. Agile manufacturing: Enablers and an implementation framework. Int. J. Prod. Res. 1998, 36, 1223–1247. [Google Scholar] [CrossRef]
- Hasan, M.A.; Shankar, R.; Sarkis, J.; Suhail, A.; Asif, S. A study of enablers of agile manufacturing. Int. J. Ind. Syst. Eng. 2009, 4, 407. [Google Scholar] [CrossRef]
- García, S.G.; García, M.G. Industry 4.0 implications in production and maintenance management: An overview. Procedia Manuf. 2019, 41, 415–422. [Google Scholar] [CrossRef]
- Ustundag, A.; Cevikcan, E.A. Conceptual Framework for Industry 4. In Industry 4.0: Managing the Digital Transformation; Springer Series in Advanced Manufacturing; Springer: Cham, Switzerland, 2018; pp. 3–23. [Google Scholar] [CrossRef]
- Peraković, D.; Periša, M.; Cvitić, I.; Zorić, P. Information and Communication Technologies for the Society 5.0 Environment. Education 2014, 2016, 203–212. [Google Scholar]
- Perakovic, D.; Perisa, M.; Cvitic, I.; Zoric, P. Identification of the Relevant Parameters for Modeling the Ecosystem Elements in Industry 4. In Proceedings of the 13th EAI International Conference on Body Area Networks, Oulu, Finland, 2–3 October 2018; Springer: Singapore, 2020; pp. 111–123. [Google Scholar]
- Dobrilovic, D.; Brtka, V.; Stojanov, Z.; Jotanovic, G.; Perakovic, D.; Jausevac, G. A Model for Working Environment Monitoring in Smart Manufacturing. Appl. Sci. 2021, 11, 2850. [Google Scholar] [CrossRef]
- Gupta, B.B.; Tewari, A.; Cvitić, I.; Peraković, D.; Chang, X. Artificial intelligence empowered emails classifier for Internet of Things based systems in industry 4. Wirel. Netw. 2021, 1–11. [Google Scholar] [CrossRef]


| No. | Improvement Strategy | Characterization Criteria | |||
|---|---|---|---|---|---|
| Principles | Tools | Factors | Target KPIs | ||
| 1 | Lean Manufacturing (LM) | Value, value streams, continuous flow, pull, and perfection | Kaizen, cellular manufacturing, just-in-time (JIT), one-piece flow, Kanban, total productive maintenance (TPM), 5S, visual management, value stream mapping, SMED, Jidoka, Poka-Yoke, among others | 7 zeros: zero defects, inventory, accidents, delays, breakdowns, changeovers or setup times, and waste | Cost reduction, fewer resources, less human effort, and lower inventory |
| 2 | Six Sigma (SS) | Concentration on the customer, customers’ specifications, real data and facts, continuous improvement, proactive management, and cooperation | Define–measure–analysis–improve–control (DMAIC), statistical analysis, regression analysis, hypothesis testing, design of experiments, Taguchi methods, among others | Rejection rate, defect rate, delays in products, processes and transactions, process capability indices, and process yield and loss | Improve quality, reducing process deviations and defects, and process performance |
| 3 | Theory of Constraints (TOC) | The five steps of on-going improvement. Identify constraints for exploiting and elevating it to improve overall output, thinking process | Five steps, types of constraints, three questions of the thinking process, drum–buffer–rope scheduling, buffer management, among others | Capacity utilization, throughput time, variation, quality, and demand | Throughput, inventory, operating expenses, net profit, ROI, and cash flow |
| 4 | Quick Response Manufacturing (QRM) | Ten principles and four core concepts: power of time, organizational structure, exploiting system dynamics, and reduction in lead times globally | Time-based competition, manufacturing critical path time map, the QRM cell, multi-skilled cross-trained teams, market target sub-segments, paired-cell overlapping loops (POLCA), utilization under 80%, rapid modelling tools and system dynamics, among others | Quick design Quick manufacturing Lead times of all tasks Speed response | Lead time reduction, quality, product variety, costs, delivery times, and product introductions |
| 5 | Agile Manufacturing (AM) | Value to customer, ready for change, valuing human knowledge and skills, and virtual partnerships | Virtual enterprise, concurrent engineering, physically distributed teams, rapid partnerships, product–process integration, rapid prototyping, e-commerce, among others | Internal: technologies, staff, educated management, and information External: speed, flexibility, responsiveness, etc. | Adaptability, service, quality, cost, and lead time |
| No. | Simulation Models | Logic Formulation | ||
|---|---|---|---|---|
| Situation, Methods, and Techniques | Description of Impacts | Impact on KPIs | ||
| 1 | Non-Lean | 1.1. Processes non-transparent 1.2. Separated kingdoms 1.3. Push strategy 1.4. Reactive quality management (inspection) 1.5. Reactive maintenance management (breakdown-driven) | 1.1. Lead times unknown 1.1.–1.2. Information delays 1.1.–1.2. Suboptimal decision making 1.3. Gap between supply and demand 1.3. Unbalanced capacities along the production process 1.4. Unsolved quality problems—unknown root causes 1.5. Production stops, unknown machine condition 1.1–1.5. Lack of continuous improvement | Low availability, performance, quality, and OEE rates Low-capacity utilization Low labor productivity High stocks Long production lead times Low service level High operational costs Low profits High investments Low ROI |
| 2 | LM | 1. 2. 2.1. VSM 2.2. 5S 2.3. Pull strategy 2.4. TPM 2.5. Poka-Yoke 2.6. Kanban | 1. 2. 2.1. Process and lead times known, value is identified 2.2. Waste and condition are visible 2.3. Production system is driven by customer orders 2.4. Improve asset condition 2.5. Avoid production failures 2.6. WIP scheduling and control | Lower operational costs Higher labor productivity Higher profits Lower lead times Better customer service level Higher product quality Higher availability and performance rates |
| 3 | (Lean) Six Sigma | 3.1. SPC 3.2. TQM 3.3. PDCA-DMAIC | 3.1. Process stability and capability 3.2. Increase in customer satisfaction. 3.3. Predictability of production processes 3.1–3.3. Continuous improvement | Higher quality Higher performance Lower operational costs Higher profits Increased productivity |
| 4 | TOC | 4.1. Five-step TOC improvement process | 4.1. Identification of bottlenecks 4.1. Capacity levelling along the production process 4.1. Supply–demand matching | Higher service level Higher system performance Optimal investments or outsourcing costs |
| 5 | QRM | 5.1. Time-based competition (TBC) 5.2. Manufacturing critical path time map 5.3. QRM cell | 5.1. Time as critical resource 5.2. Knowledge of customer order processing 5.3. Development of the right organizational structure | Lead time reduction Quantification of lead times potentials, i.e., longest critical path 80% of the installed capacity |
| 6 | AM | 6.1. Rapid partnerships 6.2. Integrated product/production/business information system 6.3. Virtual enterprise | 6.1. Information interface with suppliers/customers 6.2. Internal information network 6.2. Adoption of advanced technology 6.4. Facilitates the reconfiguration of the organization | Customer-driven organization increasing its adaptability Improve customer service levels and internal productivity Reduction in response time to market needs |
| No. | Key Indicator | Simulation Models: Cumulative Process Improvements | |||||
|---|---|---|---|---|---|---|---|
| 1. Non-Lean | 2. LM | 3. Lean Six Sigma | 4. TOC | 5. QRM | 6. AM | ||
| 1 | ∑ Market demand (# 103 products) | 284.7 | 284.7 | 284.7 | 284.7 | 284.7 | 284.7 |
| 2 | ∑ Real demand (# 103 products) | 197.7 | 249.9 | 283.6 | 283.8 | 283.9 | 284.0 |
| 3 | ∑ Production (# 103 products) | 170.5 | 213.7 | 276.8 | 281.8 | 281.8 | 282.7 |
| 4 | Ø Availability rate (%) | 84.5 | 90.3 | 90.3 | 90.3 | 91.7 | 91.7 |
| 5 | Ø Performance rate (%) | 77.8 | 80.6 | 96.5 | 96.5 | 106.9 | 117.2 |
| 6 | Ø Quality rate (%) | 82.4 | 91.4 | 97.9 | 97.8 | 97.8 | 98.8 |
| 7 | ∑ Stocks (# 106 products) | 33.9 | 11.4 | 2.6 | 1.8 | 1.8 | 1.7 |
| 8 | ∑ WIP stock (# 106 products) | 1.0 | 1.1 | 1.4 | 1.4 | 1.4 | 1.4 |
| 9 | Ø Labor productivity (products/empl. x year) | 34.1 | 42.7 | 55.4 | 56.4 | 56.4 | 91.8 |
| 10 | Ø Production lead time (# days) | 145.6 | 131.3 | 43.4 | 35.9 | 35.8 | 34.7 |
| 11 | Cumulated service level (%) | 88.7 | 85.9 | 95.4 | 96.7 | 97.2 | 97.8 |
| 12 | ∑ Profits (million USD) | 270.1 | 374.5 | 441.7 | 442.3 | 442.3 | 442.6 |
| 13 | ∑ Operational costs (million USD) | 2137 | 713 | 566 | 528 | 526 | 421 |
| 14 | ∑ Investment (million USD) | 20 | 20 | 20 | 40 | 40 | 30 |
| 15 | Return on investment (ROI) (%) | 3.5 | 4.3 | 5.0 | 5.0 | 5.0 | 6.9 |
| No. | Key Indicator | Simulation Models: Cumulative Process Improvements | |||||
|---|---|---|---|---|---|---|---|
| 1. Non-Lean | 2. LM | 3. Lean Six Sigma | 4. TOC | 5. QRM | 6. AM | ||
| 1 | ∑ Market Demand (# 103 products) | 384.7 | 384.7 | 384.7 | 384.7 | 384.7 | 384.7 |
| 2 | ∑ Real Demand (# 103 products) | 206.6 | 281.7 | 339.0 | 367.5 | 381.5 | 382.5 |
| 3 | ∑ Production (# 103 products) | 171.3 | 216.1 | 283.7 | 325.7 | 358.9 | 367.1 |
| 4 | Ø Availability rate (%) | 84.5 | 90.3 | 90.3 | 90.3 | 91.7 | 91.7 |
| 5 | Ø Performance rate (%) | 77.7 | 80.5 | 96.4 | 96.1 | 106.3 | 116.5 |
| 6 | Ø Quality rate (%) | 82.3 | 91.3 | 97.8 | 97.4 | 97.2 | 98.5 |
| 7 | ∑ Stocks (# 106 products) | 33.5 | 22.0 | 17.4 | 11.0 | 5.5 | 4.8 |
| 8 | ∑ WIP stock (# 106 products) | 1.0 | 1.2 | 1.5 | 1.7 | 1.8 | 1.8 |
| 9 | Ø Labor productivity (products/empl. x year) | 34.3 | 43.2 | 56.7 | 65.2 | 71.8 | 119.1 |
| 10 | Ø Production lead time (# days) | 171.6 | 201.6 | 124.8 | 92.1 | 55.9 | 43.4 |
| 11 | Cumulated service level (%) | 85.4 | 77.1 | 81.8 | 85.8 | 90.7 | 92.4 |
| 12 | ∑ Profits (million USD) | 237.8 | 387.9 | 502.6 | 559.6 | 587.6 | 589.6 |
| 13 | ∑ Operational Costs (million USD) | 2122 | 1247 | 1315 | 1011 | 754 | 613 |
| 14 | ∑ Investment (million USD) | 20 | 20 | 20 | 40 | 40 | 30 |
| 15 | Return on investment (ROI) (%) | 3.5 | 4.3 | 5.0 | 5.0 | 5.0 | 6.9 |
Publisher’s Note: MDPI stays neutral with regard to jurisdictional claims in published maps and institutional affiliations. |
© 2021 by the authors. Licensee MDPI, Basel, Switzerland. This article is an open access article distributed under the terms and conditions of the Creative Commons Attribution (CC BY) license (https://creativecommons.org/licenses/by/4.0/).
Share and Cite
Groten, M.; Gallego-García, S. A Systematic Improvement Model to Optimize Production Systems within Industry 4.0 Environments: A Simulation Case Study. Appl. Sci. 2021, 11, 11112. https://doi.org/10.3390/app112311112
Groten M, Gallego-García S. A Systematic Improvement Model to Optimize Production Systems within Industry 4.0 Environments: A Simulation Case Study. Applied Sciences. 2021; 11(23):11112. https://doi.org/10.3390/app112311112
Chicago/Turabian StyleGroten, Marcel, and Sergio Gallego-García. 2021. "A Systematic Improvement Model to Optimize Production Systems within Industry 4.0 Environments: A Simulation Case Study" Applied Sciences 11, no. 23: 11112. https://doi.org/10.3390/app112311112
APA StyleGroten, M., & Gallego-García, S. (2021). A Systematic Improvement Model to Optimize Production Systems within Industry 4.0 Environments: A Simulation Case Study. Applied Sciences, 11(23), 11112. https://doi.org/10.3390/app112311112