1. Introduction
This study concentrates on different patterns of street networks in sprawled areas versus compact areas in South Asian cities. The main research topics in this study are street-length density in sprawled and compact neighborhoods, active mobility, and urban travel behavior in two different urban forms in Pakistani cities. Although there is a considerable body of literature on urban sprawl and its relationship with urban mobility, most of our knowledge comes from American and Western studies. While urban sprawl is well known as the dominant pattern of development in the United States [
1], it has also emerged as a pattern of new development in other countries, low-income as well as high-income. As a result, urban sprawl has become an urban challenge in emerging markets. Scholars have identified a range of characteristics defining urban sprawl, such as low-density, car-dependent areas; single land uses; street networks with low connectivity; and leapfrogging and discrete new development areas in the periphery of cities [
2,
3,
4,
5]. The pattern of streets corresponds to the level of sprawl [
6,
7]. A large number of studies have related sprawl with the use of motor vehicles, long-distance commuting trips, high-energy consumption, and greenhouse gas emissions. This literature has discussed street structure as one of the most important determining features of urban sprawl. Urban scholars have therefore calculated a “connectivity variable” as a metric for assessing a street network, with urban sprawl characterized by low street connectivity [
1,
6]. In other words, sprawled areas are defined by longer streets, discontinuous development areas, fewer intersections, and lower levels of accessibility. The idea of using different structures of street networks to influence travel is well known among urban planners. Capitalizing on the relationship between urban forms and transportation planning to reduce car dependency and greenhouse gas emissions can lead to more effective policies in this field. More particularly, studying different patterns of street networks in sprawled urban areas and their association with travel behavior in the context of developing countries can help planners avoid the generalization of strategies in developing countries. Cities in emerging economies and developing counties face rapid growth in various aspects of life. Rapidly growing urban populations has led to the mass proliferation of discrete settlements with lower street connectivity in emerging economies. However, there are differences in the causes, characteristics, forms, and consequences of urban sprawl in Western countries compared to those of emerging nations, such as India and Pakistan. Increasing urban sprawl, new patterns of street networks, and the deteriorating physical environment in the developing world cause complex multifaceted problems never experienced before. For this reason, scholars have recently begun to pay attention to urban sprawl in emerging economies [
8,
9], but there continues to be a lack of investigations on urban sprawl and its relationship with socioeconomic features, travel behavior, patterns of the street network, and its contextual definition in emerging markets. For such areas, there is a need for modeling and analysis of street connectivity and urban mobility features. It is crucial that urban planners and decision-makers consider different countries’ socioeconomic, cultural, historical, and geographical aspects when creating policies to address the disadvantages of urban sprawl for these policies to be effective.
To investigate urban sprawl in the socioeconomic setting, the objective of this paper is to investigate the relationships between street connectivity and mobility patterns of residents in two large Pakistani cities. Street-length density was selected as an indicator for assessing this connectivity in street networks. In addition, one goal of this paper is to calculate and determine the levels of street-length density at which the behavior of active mobility in Pakistani cities begins to change. Comparing residents’ different mode choices in the various types of neighborhoods is the third goal.
The remainder of this paper is as follows:
Section 2 briefly reviews the literature on urban sprawl, street networks, and their travel behavior determinants in high-income countries and emerging economies, particularly South Asia and Pakistan. Methodology, data and variables, research questions, and hypotheses are presented in
Section 3.
Section 4 provides a brief explanation of the findings of this paper. The discussion presented in
Section 5 compares the findings in this paper with the international urban sprawl literature and proposes policies for urban transport planning in Pakistan. Finally, the conclusion is set out in
Section 6.
2. Literature Review
Urban sprawl is related to the pattern of streets [
10]. Studies in high-income countries have shown that the pattern of the street network is different in sprawled areas. In other words, sprawled areas have different street structures, with different levels of connectivity and accessibility. Areas of new development have appeared with large residential blocks and with them large streets and fewer intersections. These new development areas are designed more for driving cars than for walking and cycling. Urban scholars have paid attention to this relationship between street connectivity, urban sprawl, and travel behavior in Western and high-income countries [
1,
6,
11,
12].
“Urban form” is a multidimensional concept, consisting of the street network, land use patterns, density, and urban design [
13]. Urban sprawl is one characteristic of urban form studied by urban planners. A growing number of studies have analyzed the association between urban form characteristics and travel behavior. [
14] showed that built environment features correlated with households’ vehicle miles of travel. García-Palomares (2010) applied multivariate regression analyses to assess the relationship between urban sprawl and commuting trips in the metropolitan area of Madrid. The results showed that the new sprawled developments there promoted unsustainable transportation modes [
15].
Urban sprawl as a specific urban form and its relationship with travel behavior has been investigated in several studies. Figueroa et al. (2014) discussed how density and diversity influenced travel behavior among elderly people in Denmark. Another study found that the total distance traveled, the distance traveled for non-work purposes, and the distance traveled by car decrease in neighborhoods with high population densities and mixed land use structures in comparison with sprawled neighborhoods [
16]. Gan et al. (2019) used an ordinary least square (OLS) regression model for Nanjing, China to examine the relationship between urban forms and average travel distance. According to their research, there is a positive relationship between features of compact neighborhoods, such as mixed land use and the employment/entertainment/residential “balanced” areas and with average travel distance in Nanjing [
17]. Compact urban characteristics, including higher density and better street network connectivity, increase walking trips across all age groups in Singapore [
18]. Dill (2003) used block density, intersection density, street density, connected node ratio, link-node ratio, and grid patterns to measure connectivity and its association with active mobility for the Portland, Oregon, metropolitan area [
19]. Link-node ratios and accessibility have been used to analyze physical activity among adults in Australia [
20]. A similar study in 2010 looked at intersection density and link-node ratio and their relationships with physical activity and active mobility [
21].
Urban sprawl, with its low level of street connectivity, low-density areas, and disjointed areas of development, has increased in developing countries in recent years. Urban researchers have investigated the different forms and causes of urban sprawl in various developing countries. South African cities, for instance, have been affected by heavy migration, natural population growth, and economic development; hence, sprawl occurred as a pattern for urban expansion in formal as well as informal ways [
22]. This urban form was the dominant pattern in Nigerian cities due to uncontrolled urbanization. It is characterized by unplanned housing development in urban suburbs without any coordinated layout; this inefficient housing market along with rapid urban population growth creates sprawl in Nigerian cities [
23]. This pattern of development is rapidly consuming rural settlements on the outskirts of metropolitan Kumasi, Ghana, as well; [
24] argued that this resulted from individual housing preference, a poor planning management system, and the low price of land on the outskirts. Malaysia is one example of an Asian country that has faced urban and suburban sprawl due to the high rate of urban population growth and modernization [
25]. Herat, Afghanistan experienced dramatic growth of the city, and with it sprawl in all directions, after the fall of the Taliban in 2001 and the American invasion in 2002 [
26]. She noted that Herat expanded from 47 km
2 to 99 km
2 in just ten years, between 2002 and 2012 [
26]. There is a small body of literature on the relationship between street connectivity and travel patterns among emerging markets. In particular, the link between link-node ratio and mobility behavior is becoming a new topic among developing countries. Studies on urban sprawl literature in emerging markets and developing countries concentrate on the intensity and direction of sprawled expansion rather than the different characteristics of it. The various components of street networks, including street-length density, intersection density, and link-node ratio, have been studied rarely and superficially, if at all. Most studies that have investigated urban sprawl as a societal and environmental phenomenon and assessed its association with urban travel patterns have done so in developed countries. The literature emphasizes proof sprawl; and assesses the nature of it and impacts of urban sprawl in developing and emerging nations. The urban form attributes that characterize sprawled areas and their correlations to urban mobility are less studied topics in this context. The relationship between the street network system and the urban form of Baghdad has been explored using a multiple centrality assessment [
27,
28]. Molaei et al. (2021) found a positive correlation between the variables of street connectivity and walking time in Rasht, Iran [
28]. Mehriar et al. (2020) looked at two differently-sized cities in Iran and showed correlations of urban sprawl and street-length density with travel behavior [
29]. Asheampong (2020) investigated the spatial structure of urban forms and its relationship with travel patterns in metropolitan areas of Kumasi, Ghana; the result showed a strong relationship between urban forms (compact vs. sprawled) and the use of active modes of transport in commuting trips [
30].
Hence, there is still a need to investigate the characteristics of urban sprawl and its relationship to mobility in the context of the developing world. A few investigations have paid attention to urban travel behavior in Pakistani cities recently. Lee et al. (2021) analyzed the impacts of COVID-19 on urban mobility and the attitudes of residents in Pakistani cities [
31]. The desire and attitude of residents to use public transportation during COVID-19 were studied in Lahore by employing regression models. The reduction tendency in using public transit was seen during the pandemic in Lahore [
32]. The association of urban transportation and urban pollution was studied and compared before and after Coronavirus Pandemic in Pakistan by using the general regression model and Kruskal–Wallis H tests [
33]. One of the main objectives of this paper is to cover the above-mentioned gap in the context of Pakistani cities as an example of South Asia. South Asian cities, such as those on the Indian Subcontinent, have also experienced urban sprawl in recent years. The unprecedented growth and high rate of migration has driven this urban sprawl in Indian cities. Particularly, land use has changed in the vicinity of these cities or along transit corridors and highways [
34]. Economic growth and the transformation from an agricultural economy to a service-based economy have influenced urbanization and discontinuous developments on the outskirts of cities on the Indian Subcontinent [
25,
35]. Investigating the development of Pakistani cities is important because urbanization in this country has been affected by huge internal and international migration trends. The migration from India in 1947, the migration due to three wars in 1948, 1965, and 1971 between Pakistan and India, and the migration of refugees from Afghanistan stemming from the Soviet invasion in 1979, as well as migration from rural areas, resulted in rapid urbanization in Pakistan [
36]. In Pakistan, economic structure plays an influential role besides urbanization with respect to urban sprawl. The structural transformation from an agriculture-based to a service-based economy creates new opportunities in cities, while the high price of land in inner cities lead to leapfrog and discontinuous development on the outskirts, with low levels of street connectivity. In Pakistan, most migrants come from rural areas and earn low incomes, so they look to settle on cheap land far away from the main city and without any infrastructure. On the other hand, developers promote leapfrogging because they find it easy to build on vacant land [
37]. Infrastructure investments, particularly in the transportation system, directly affected urban sprawl in Pakistan and caused urban expansion [
37]. Sprawl brought about a new pattern of street networks in Pakistani cities, with lower connectivity. This new street network form has an impact on the choice of mode, and commuting distance. The contribution of this paper is to analyze the correlation between street-length density (as an indicator of street connectivity) and urban mobility to give urban planners a better understanding of the challenges for Pakistani cities. The characteristics of new development and sprawled areas, including the patterns of street networks in Southern Asian cities, are a less-studied topic that still needs to be analyzed. In addition to the structures of street networks in sprawled areas, our knowledge about the relationship between street networks in new development areas and urban mobility habits is still limited in the case of Pakistani cities. There is therefore a real need to assess the characteristics of street networks in sprawled areas and study the relationship with urban travel behavior in South Asia generally and Pakistan specifically.
According to shortcomings in urban sprawl, the built environment characteristics, and its interrelations with urban mobility in the contexts of emerging countries, the contribution of this paper is to provide a better understanding of the association of street network patterns with travel habits in two large Pakistani cities. Also, determining the optimal level of street connectivity for having more active mobility and sustainable transportation is the less or non-studied topic in the South Asian context, and also, in developed countries.
3. Materials and Methods
3.1. Research Question and Hypothesis
To address the main objectives of this paper, our research questions are:
(1) Which travel behavior factors are associated with street-length density as an indicator to assess compactness in the neighborhoods of large Pakistani cities? (2) How much is the connectivity of the street network correlated with active mobility in large Pakistani cities? (3) Are there any differences among the mode choice of residents in commuting and non-commuting trips between sprawled and compact neighborhoods in Pakistani cities?
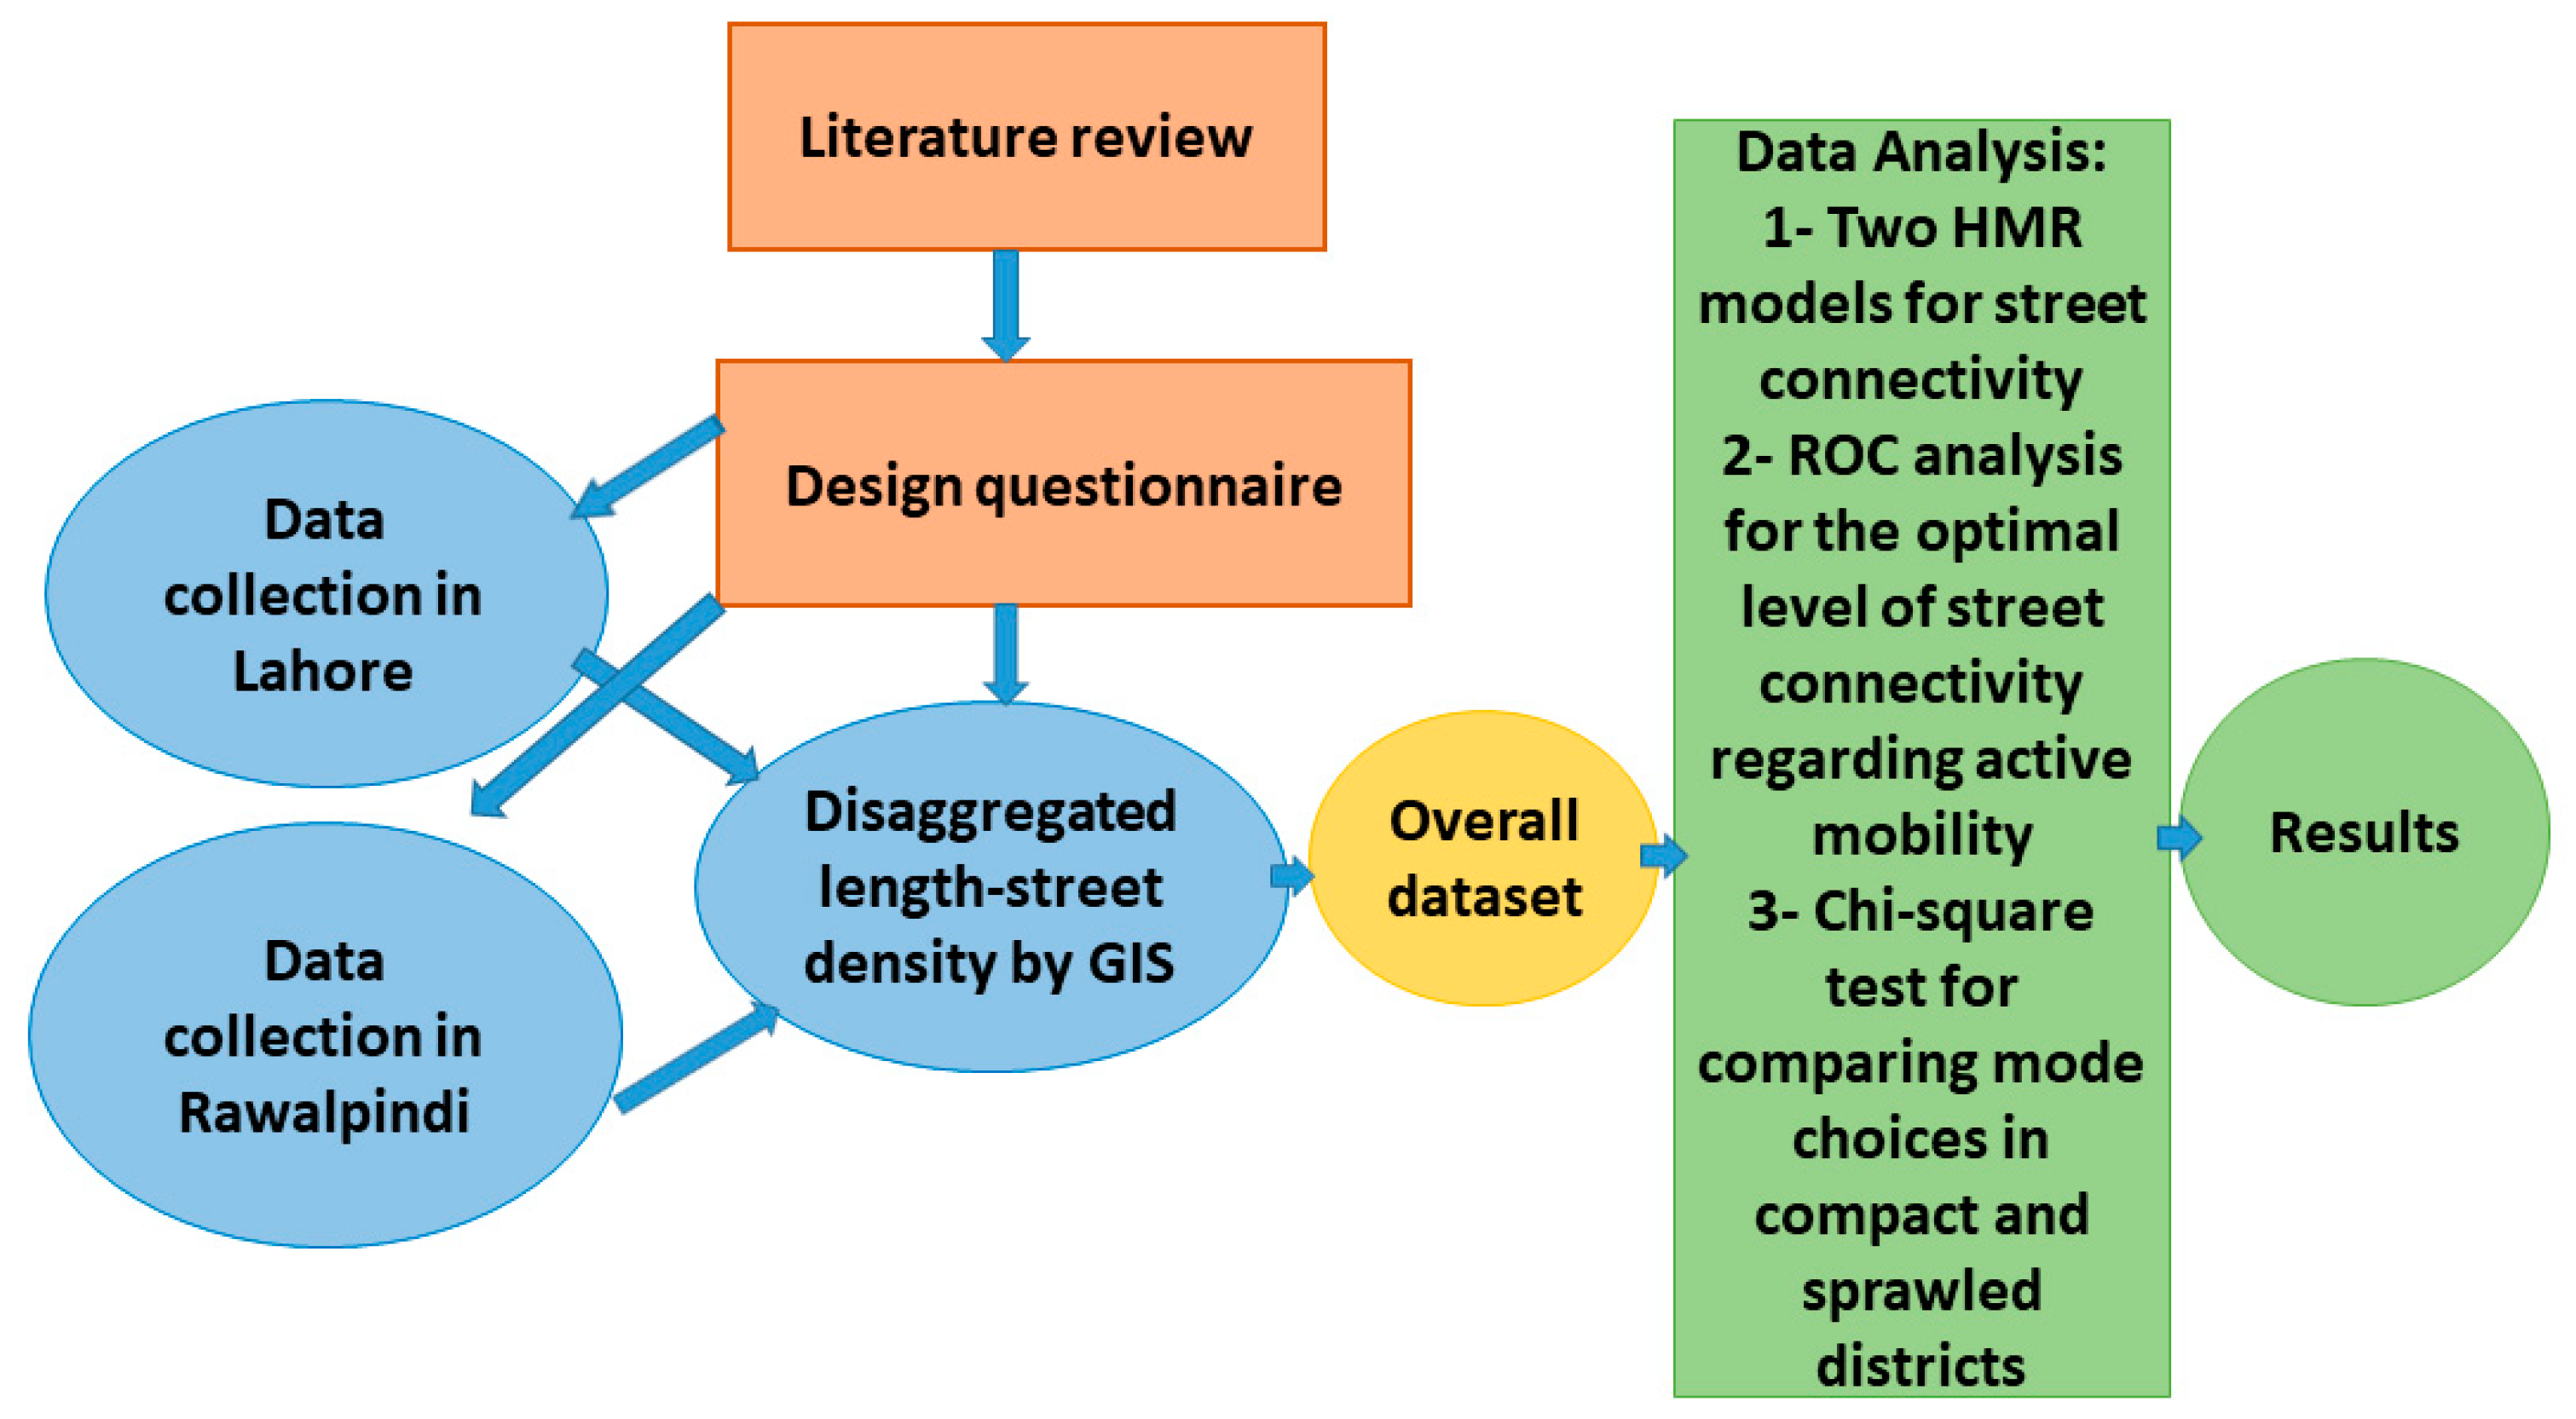
In this paper, we hypothesize that there is a correlation between street-length density (as a proxy for urban sprawl and an indicator of the street network) and travel behavior, including the number of commuting and non-commuting trips, the use of private motor vehicles in commuting and non-commuting trips, commuting distance, and the frequency of public transport use in two large Pakistani cities: Lahore and Rawalpindi. Also, we hypothesize that there is a minimum level of connectivity of the street network that leads residents to choose walking and cycling for commuting as well as non-commuting purposes. Nevertheless, residents who live in sprawled neighborhoods may choose a different mode of transportation for commuting and non-commuting trips compared to those who live in compact districts of these cities. The different steps for reaching this paper’s aims are shown in
Figure 1.
3.2. Case Study
To achieve the objectives of this paper, we selected two large cities in Pakistan, Lahore, and Rawalpindi, as case studies to get a clear understanding of urban sprawl in major South Asian cities and its relationship to socioeconomic and mobility characteristics.
Lahore is the second-largest city in Pakistan [
38], located in the northeast area of Punjab Province; it is also the provincial capital. Lahore experienced rapid urbanization over the past few decades. The urban population increased from 1.12 million in 1951 to 11 million in 2017 [
39]. The metropolitan area of Lahore has a very varied physical structure, including urban, peri-urban, and rural areas. One evaluation of land use and land cover change in Lahore indicated that agricultural areas and vegetation land were transformed into built-up areas in a peri-urban pattern in the outer areas of Lahore between 1999 and 2011. Correspondingly, 84% of the increase in built-up areas occurred in outer areas compared to 22% in the central urban region [
40].
Rawalpindi is the fourth-largest city of Pakistan by population [
38], and is located in the northern part of Punjab Province. It is located adjacent to Islamabad, the capital of Pakistan. As such, it is a part of the Islamabad-Rawalpindi metropolitan area. Rawalpindi is situated on the southern slopes of the northwestern Himalayas, known as the Margalla Hills, and the Indus River flows through the city [
41]. Rawalpindi experienced rapid urbanization between 1800 and 1940 when the urban population tripled. The city has experienced a great deal of in-migration as well as rapid urban development. Most of the growth has occurred outside of Rawalpindi, in a spider-web structure away from the main city [
41].
In addition to urbanization and an increasing growth footprint, Pakistani cities, particularly Lahore and Rawalpindi, have suffered from a lack of comprehensive urban development, an absence of integrated and consolidated urban administration, and inefficiency in the implementation of urban plans; these aspects have contributed to unplanned urban development and urban sprawl.
3.3. Data and Variables
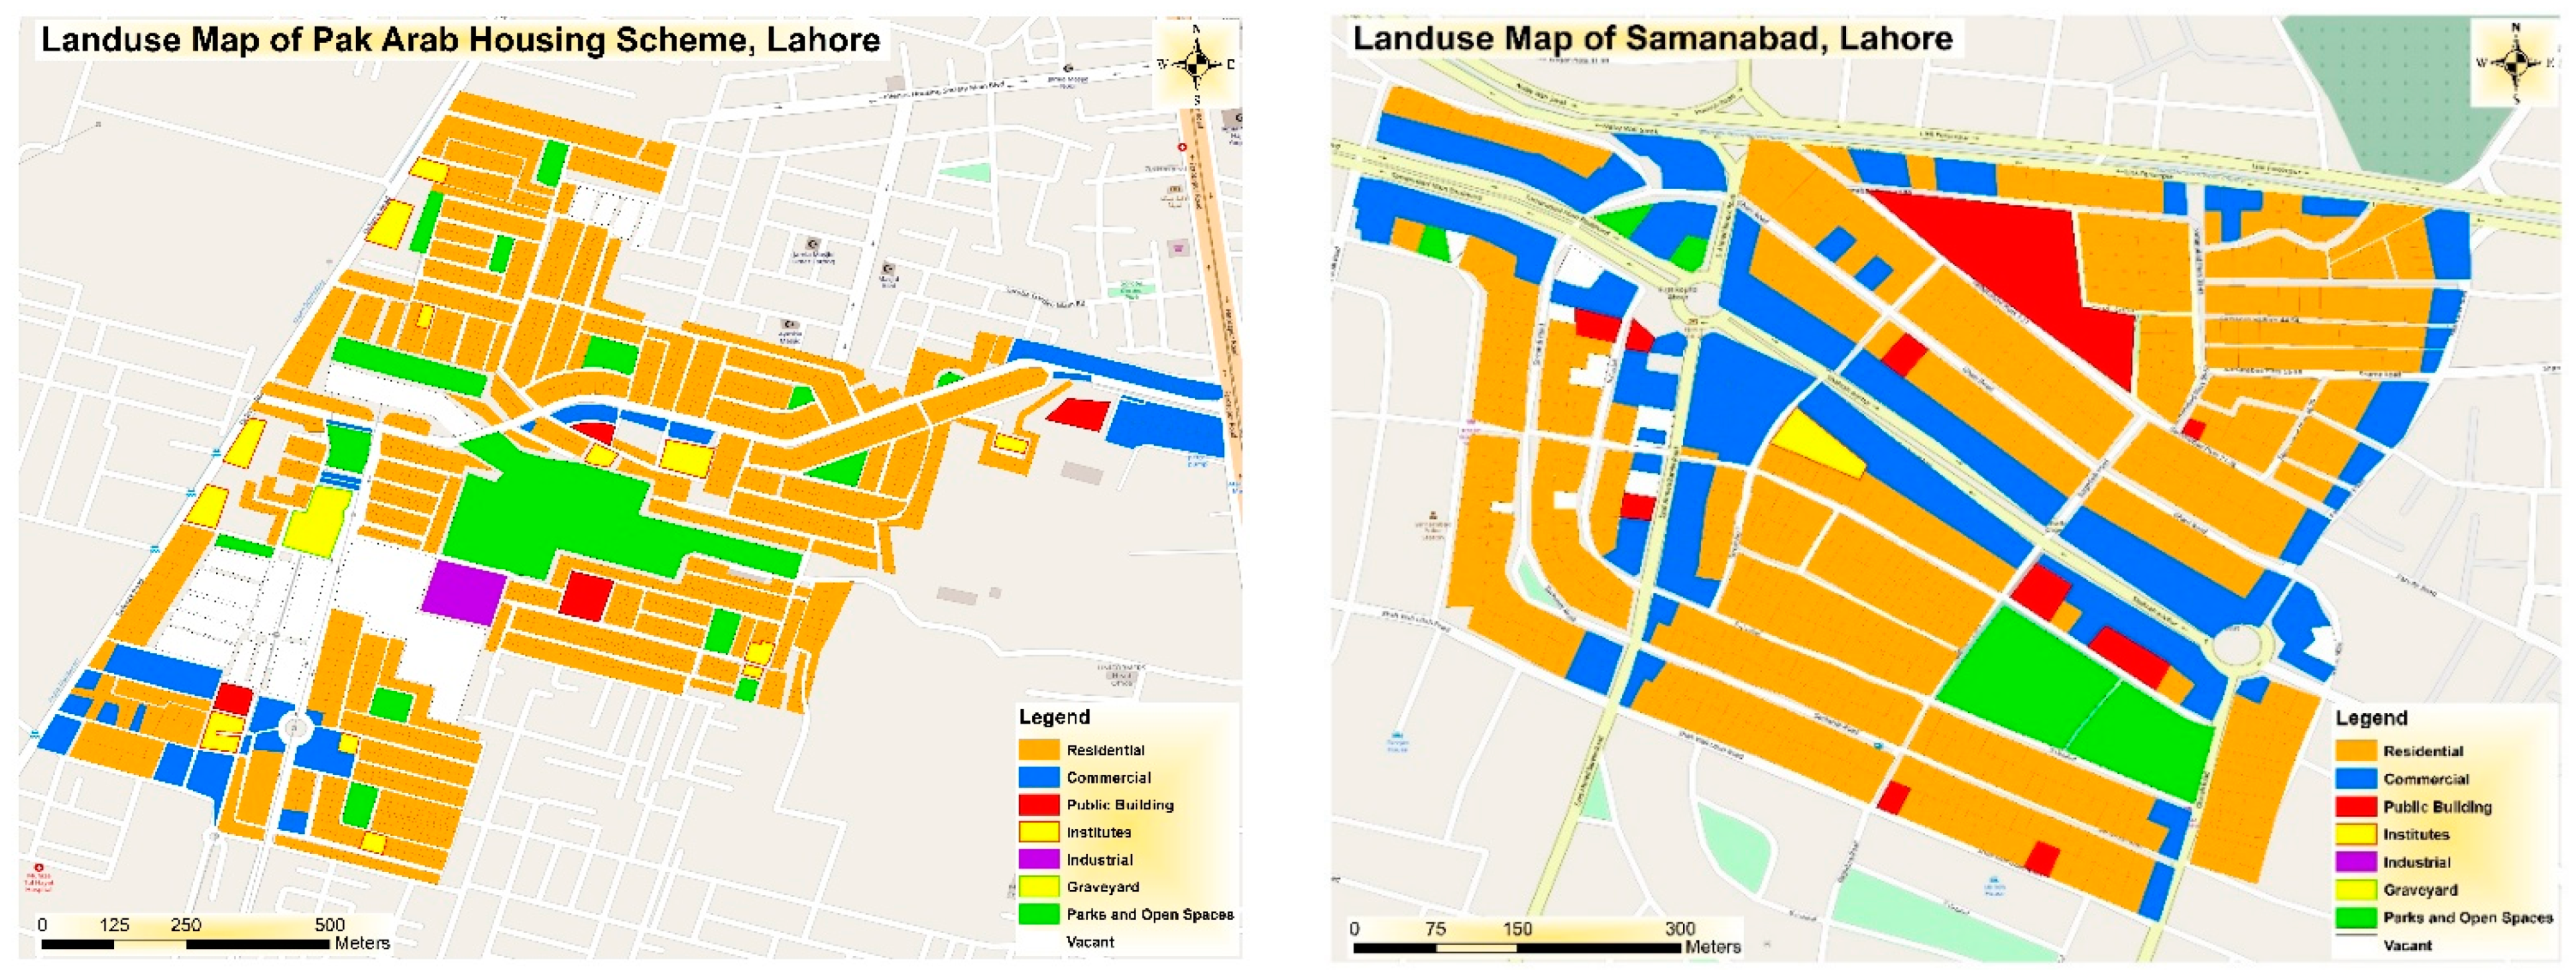
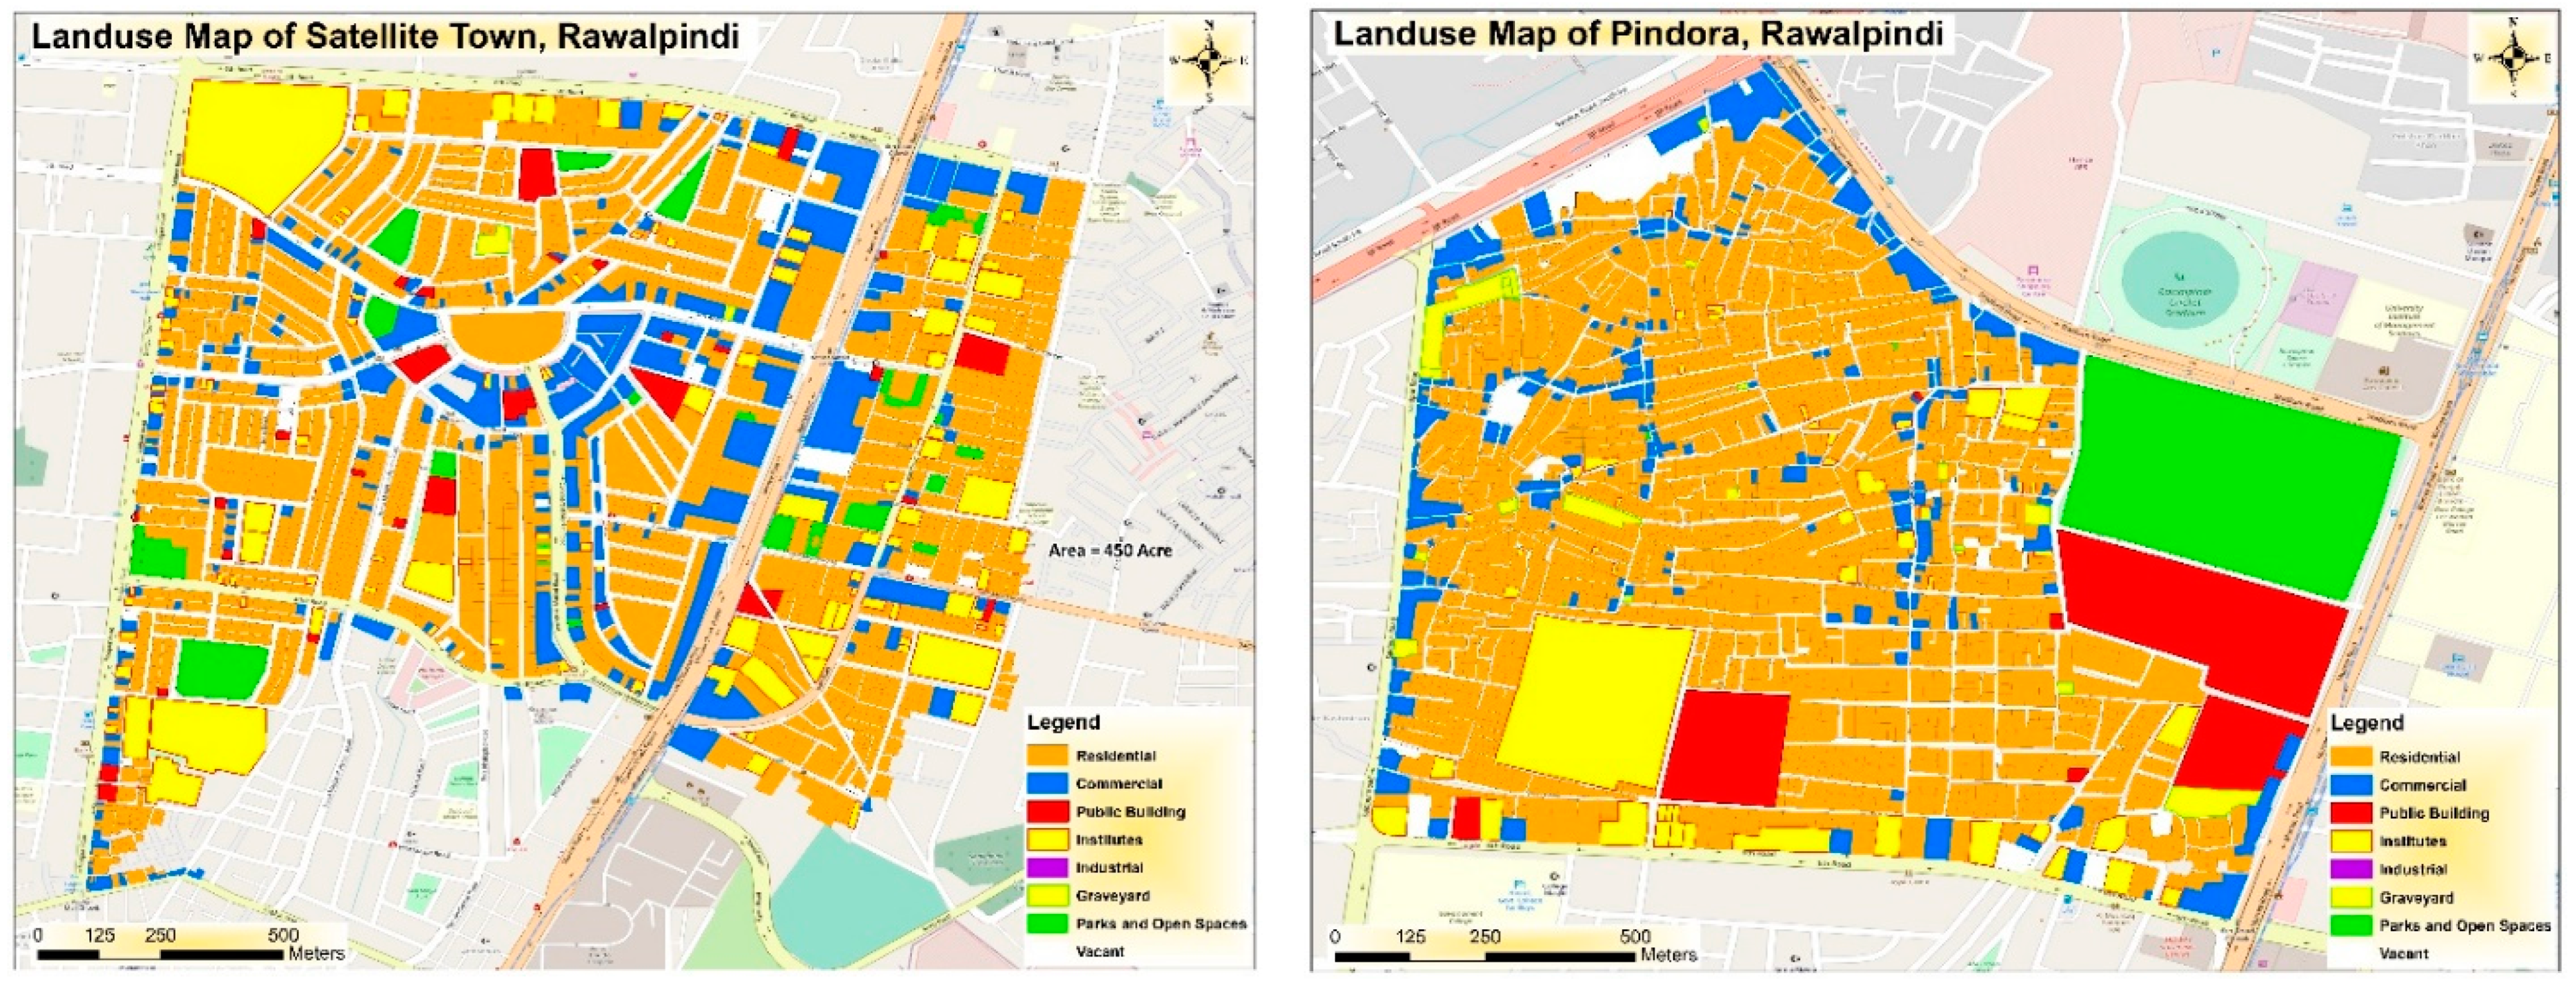
In order to answer the research questions and assess the hypothesis, the data for this paper were gathered from four neighborhoods in the two cities, i.e., two neighborhoods in each city, one representing sprawled districts and one representing compact districts. The local language of Urdu was used to conduct face-to-face interviews in Lahore and Rawalpindi, though the questionnaires were prepared in English. Samanabad and the Pak Arab Housing Scheme were selected as neighborhoods in Lahore; Samanabad is located within the central part of Lahore. It has a regular street pattern with a mixed land use structure. In contrast, Pak Arab is a new development area located in the suburbs of Lahore. It also has a regular street network dominated by residential development. Five hundred participants answered the questionnaire in autumn 2018, and then 461 questionnaires remained after validating the data. Satellite Town and Pindora were chosen in Rawalpindi. Satellite Town is a comparatively new development district, with a regular street pattern. Pindora is slightly older than Satellite Town and has an irregular street pattern and a more mixed land use structure. Four hundred respondents filled out questionnaires, which were then validated in Rawalpindi in summer 2020. Our sample size was altogether 861 for the two cities. This sample size is representative at the neighborhood level according to Cochran (Cochran, 1963). The confidence interval for Samanabad and Pak Arab is 6.59 and 6.38, respectively, based on a confidence level of 95% and a population of 45,518 and 3233, respectively. The figures are 6.91 and 6.6 based on a population of 39,693 and 21,119 for Satellite Town and Pindora, respectively, in Rawalpindi. Thus, the sub-samples are representative at the district level.
Each questionnaire included two maps: the map of the neighborhood and the map of the city. Participants were asked to determine the nearest intersection to their homes and workplaces on these maps. These intersections were defined as “home” and “work” locations to respect the participants’ privacy. Then all the points were pinned in Google Maps and converted to shape files in Arc Map 10.3. To calculate disaggregated street-length density, we set up 600-m catchment areas based on the street network and obtained street-length density by dividing the sum of the lengths of all streets by the total catchment area.
We calculated commuting distance according to the shortest distance between home and workplace for each participant who indicated these locations. Next, other travel-pattern and economic information came from questionnaires and included the number of commuting and non-commuting trips per week, the use of private motor vehicles in commuting and non-commuting trips, the frequency of public transport use, the use of active mobility modes, age, daily activity, and monthly household income. Variables are presented in
Table 1.
Figure 2 and
Figure 3 show selected neighborhoods in Lahore and Rawalpindi.
3.4. Methods of Analysis
For answering the first research question and modeling street connectivity, two hierarchical multiple regression models were selected to find out the relationship between street connectivity and urban mobility features in Pakistani cities when socioeconomic variables are fixed in the models. Regression models were used in urban mobility literature by scholars [
32,
43,
44]. Due to determine the optimal point in length-street density for having more active mobility (walking and cycling) and, answer the second research question, ROC analysis was applied and Youden Index was calculated. The chi-square test was used to assess whether there is a statistically significant difference between mode choice of residents and living in sprawled or compact districts (answer to the third research question).
3.4.1. Hierarchical Multiple Regression
We generated two hierarchical multiple regression models to model street connectivity around homes and workplaces based on the level of street-length density, while also controlling for age, daily activity, and monthly household income as socioeconomic variables. Hierarchical regression revealed a statistically significant amount of variance of the dependent variable (street-length density) while controlling for income, age, and daily activity. All independent variables with p-values less than 0.05 have statistically significant correlations with street-length density around homes and workplaces as dependent variables.
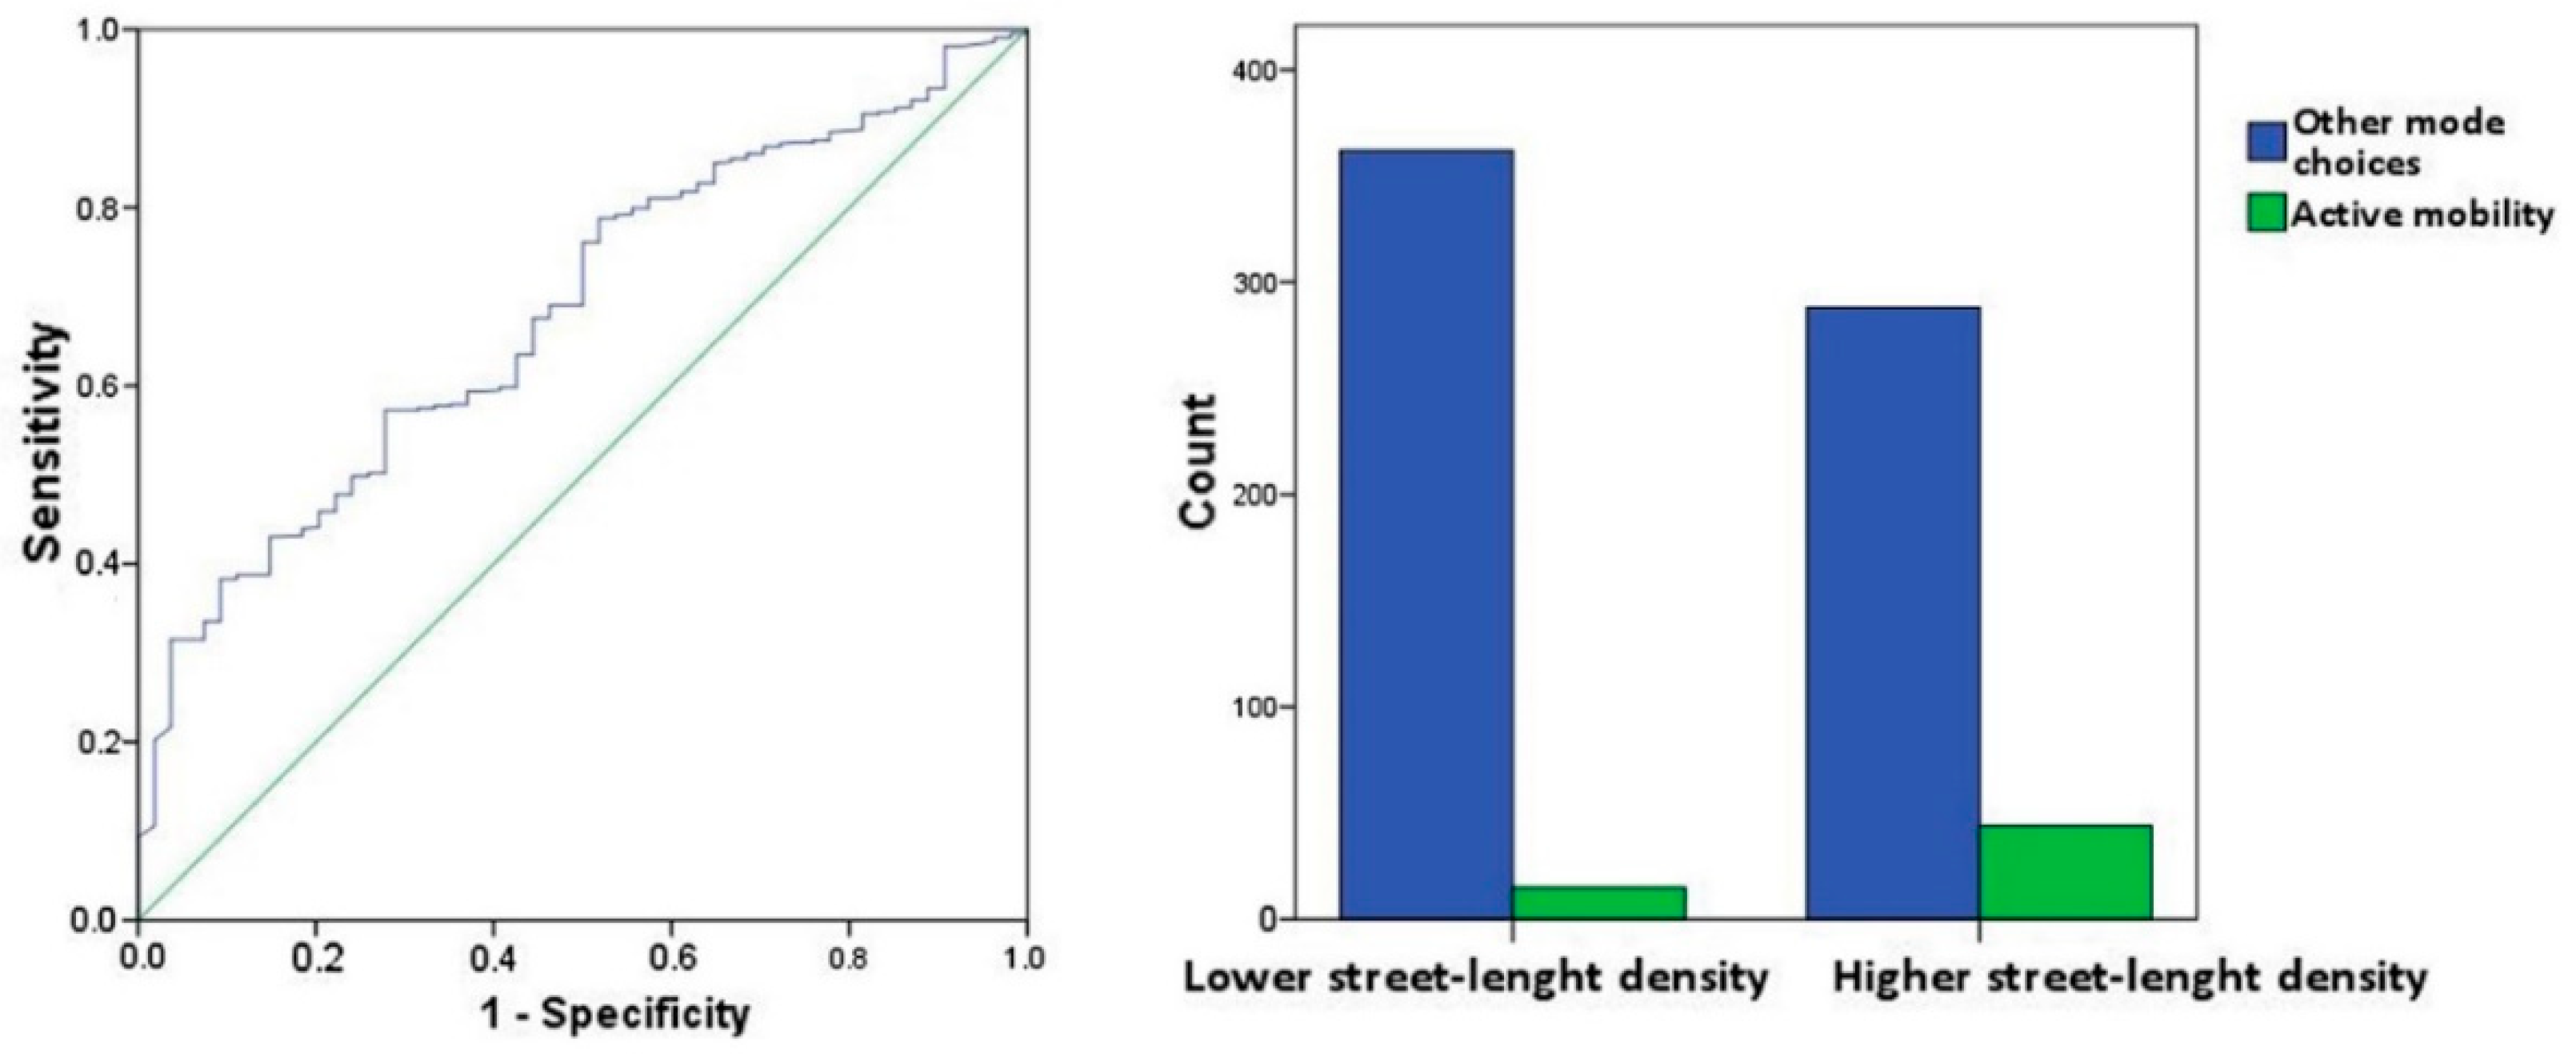
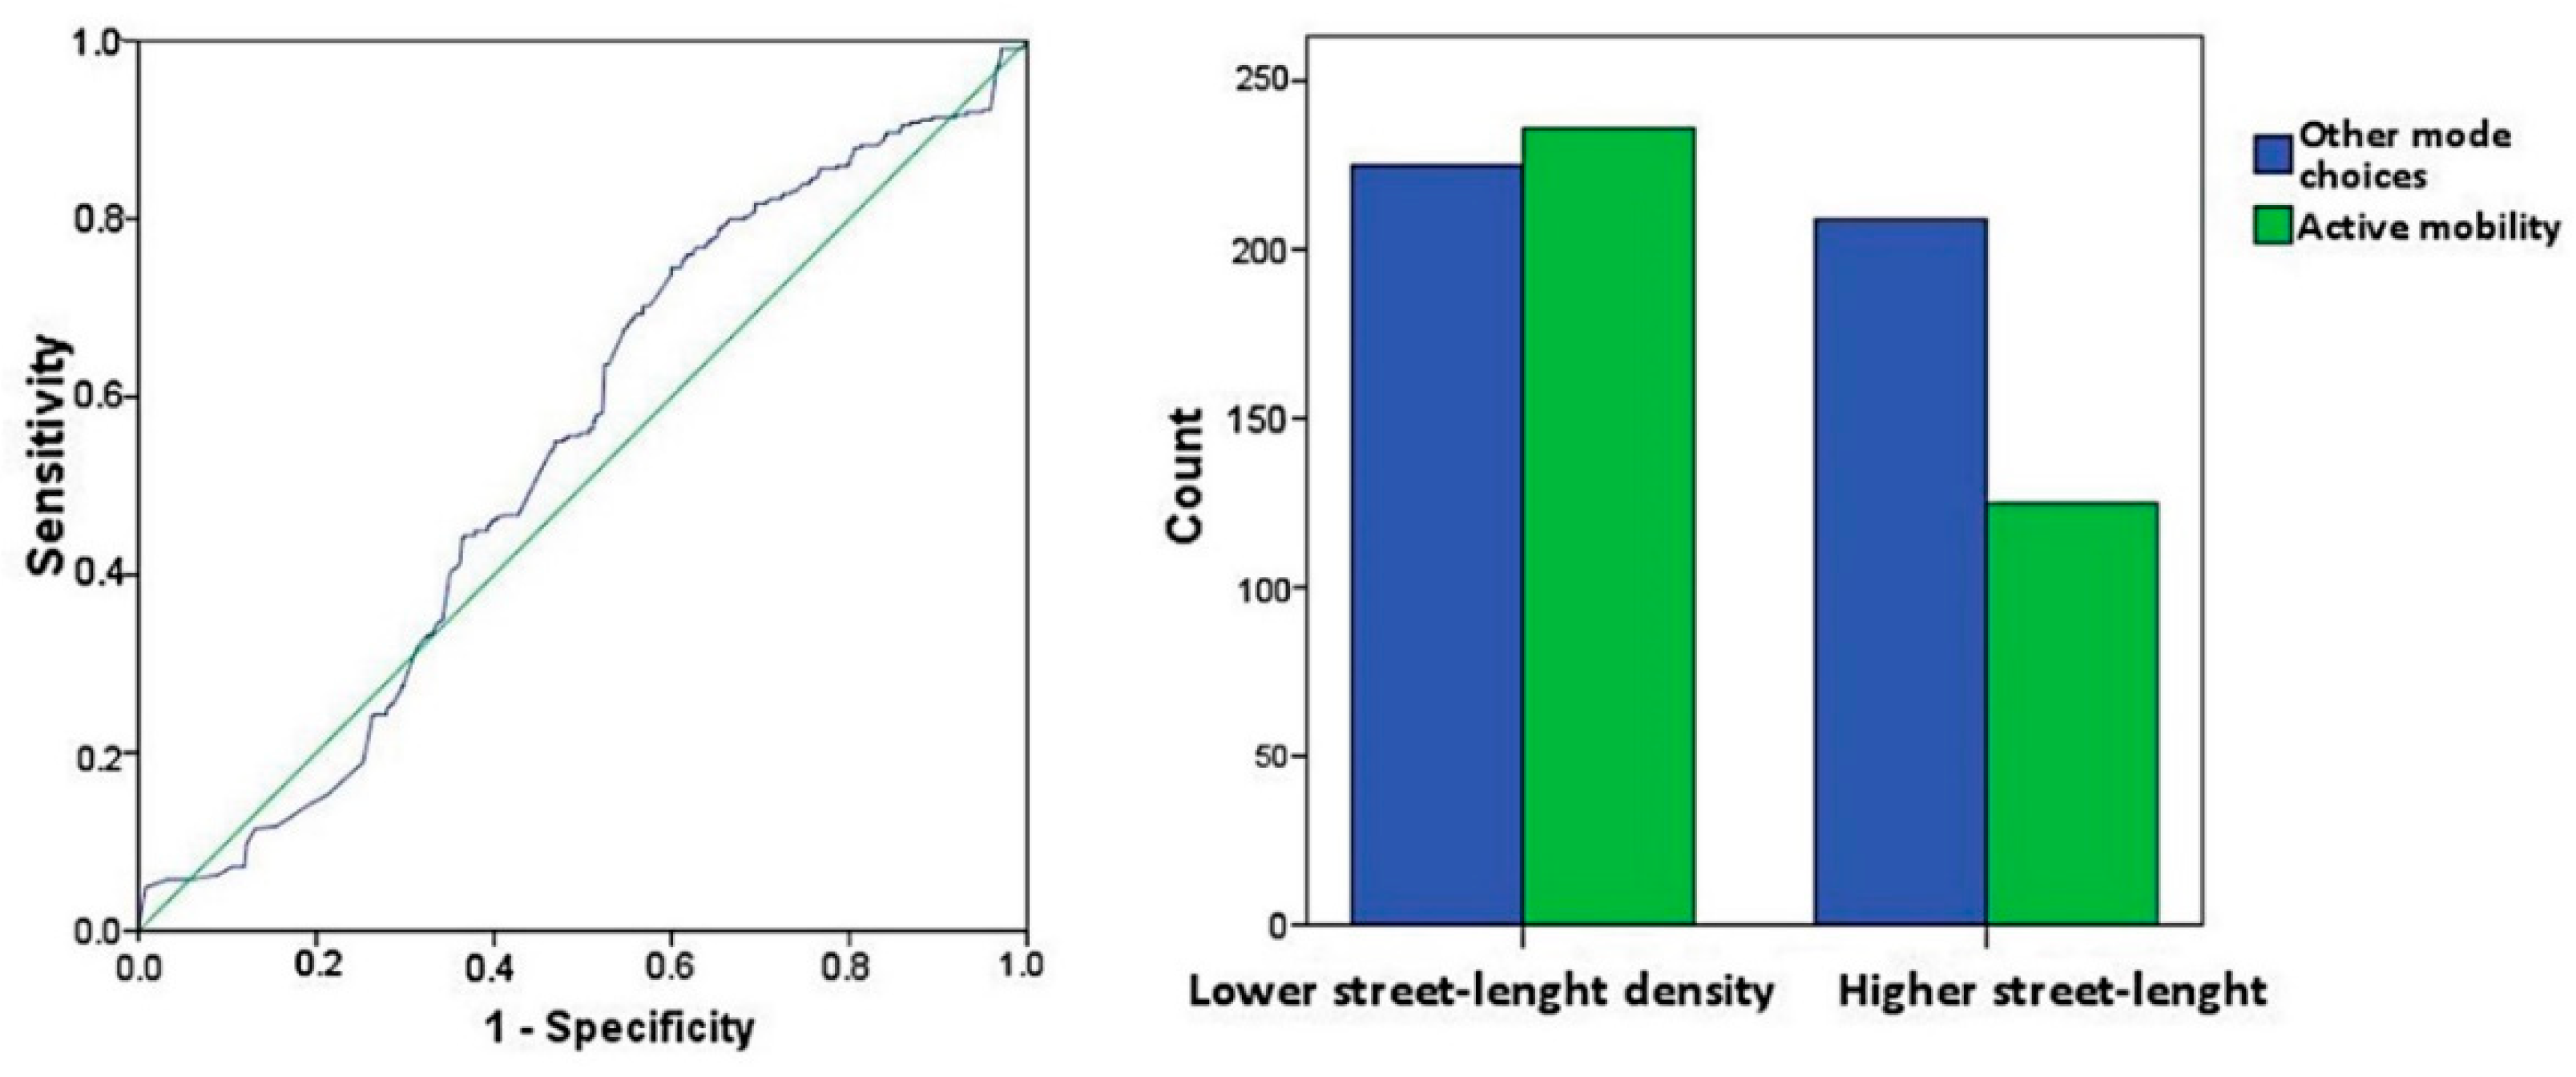
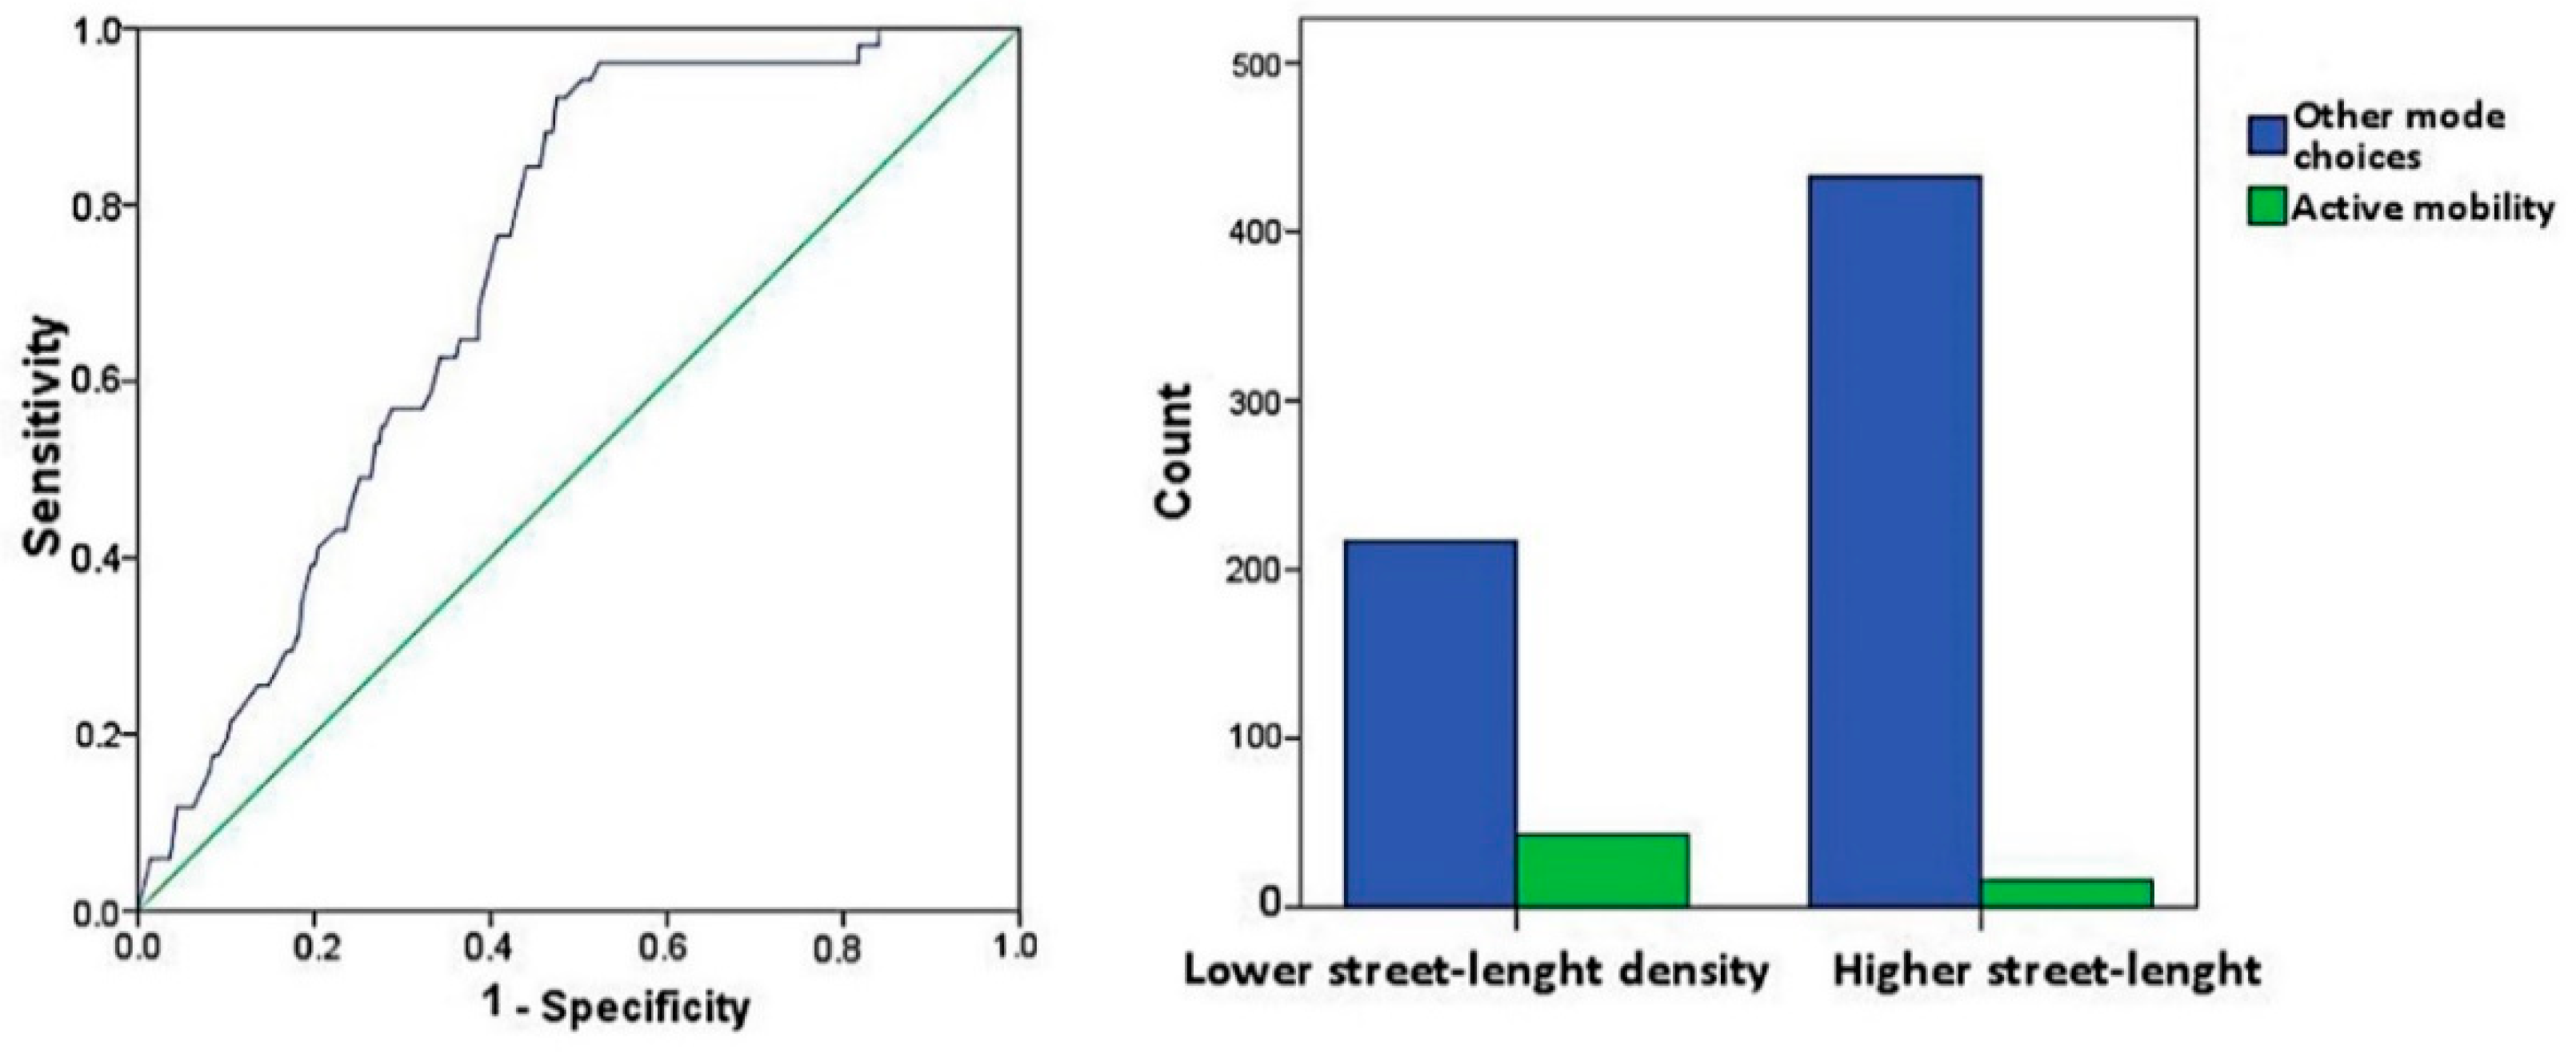
3.4.2. ROC Analysis
Statisticians use cutoff values to estimate optimal decision thresholds. Determining ROC curves is a non-parametric procedure designed to define the optimal point in a curve. The research covered in this paper applied ROC analysis in SPSS 22 to obtain ROC curves for street-length density and active mobility. The ROC curve, and the amounts of sensitivity and specificity were calculated for street-length density around homes and active mobility in commuting and non-commuting trips. In addition, ROC analysis was generated for street-length density around workplaces and active mobility. Each ROC curve plot is the true positive rate (sensitivity) against the false positive rate (1-specificity) [
45]. Finally, we calculated the Youden Index for each ROC analysis based on sensitivity and specificity [
45].
Higher Youden Index values are better than lower ones. The maximum amount of the Youden Index can therefore reveal the optimal cutoff point. This meant obtaining the corresponding amount of street-length density for the optimal cutoff point for each analysis, which would show that active mobility behavior has changed as a result of the corresponding amount of street-length density. For this last step, we implemented three chi-square tests to determine changes in active mobility behavior based on the corresponding street-length density of optimal cutoff points.
3.4.3. Chi-Square Test
We applied chi-square tests as a statistical procedure to examine the differences between the categorical variable of mode choice for commuting and non-commuting purposes among different types of neighborhoods. The null hypothesis in this paper assumes that there is no significant difference between using different mode choices in the commuting or non-commuting trips of residents who live in either sprawled areas or compact neighborhoods. p-values of less than 0.05 caused us to reject the null hypothesis and accept the alternative hypothesis. In other words, accepting the alternative hypothesis means that the variables are independent and there is a relationship between the variables. To assess strangeness as a level of association between the categorical variable (mode choice) and the dependent variable (type of neighborhood), proportional reduction in error (PRE) was calculated to determine the level of association. We selected the lambda coefficient because the independent and dependent variables were nominal, and there is no order between variables. Lambda coefficients reflect the proportional reduction in error when the value of the independent variable (in our case, mode choice) predicts the value of the dependent variable (in our case, the type of neighborhood).
5. Discussion
The sprawl of an area is defined by the pattern of its street network and the land use structure [
46]. Improvements in the accessibility of street networks have changed the relative location of urban centers and new urban development areas [
47]. The relationship between long streets in new development and sprawling areas has been studied by landscape researchers [
6,
10,
48]. According to a 2016 EEA report, street-length density is one of the key drivers of urban sprawl in European countries [
10]. Road density is closely related to the dispersion of built-up areas and urban permeation [
10]. In other words, higher street-length density correlates with sprawl. Hamidi et al. (2015) emphasized street connectivity as a component when assessing sprawl in the United States. Large block sizes indicate a lack of street connectivity [
49]. The findings of this paper on street-length density around workplaces confirm the result of Hamidi et al. (2015), who asserted that there was a correlation between the compactness of an area and increased use of public transit in the United States. We in turn found that there is also an association between higher levels of active mobility for commuting as well as non-commuting trips and higher street-length density around homes and workplaces in Pakistani cities. Our findings are therefore consistent with the results of studies on the relationship between street connectivity and active transportation in American metropolitan areas [
50]. Street-length density around workplaces is inversely related to commuting distance, and so it is inconsistent with results from a study of the Portland, OR, metropolitan area that showed a positive correlation [
19]. However, our results indeed confirm Dill’s results on the relationship between street connectivity and the use of cycling and walking [
19]. Our findings on the correlation of street-length density around workplaces with active mobility, as well as the relationship between street-length density around homes and active mobility in non-commuting trips corroborate findings of a positive correlation between street connectivity and active mobility in New Zealand [
51]. Moreover, these findings on the association of active mobility and street connectivity also reinforce a study on Australian cities from 2008 [
20]. However, our findings on the relationship between street-length density around homes and commuting active mobility contradict the above-mentioned studies in Australia, New Zealand, and the United States. This can be explained by the fact that in most studies, street connectivity was determined using many variables, with street-length density only one of them. In this paper, we examined the correlation of street-length density with active transportation directly. In other words, a cutoff value shows at what point the active mobility of Pakistani residents might change as a result of street connectivity. Defining cutoff values in travel behavior studies is a new topic that needs more investigation in light of different urban conditions. Our results showing a significant association between street-length density and motor vehicle use corroborate studies that have discussed the relationship between the built environment and driving in commuting trips in China [
43]. Moreover, our results also show that street-length density around workplaces correlated negatively with commuting distance; this is consistent with an investigation conducted on Chinese cities [
52]. The findings of this paper on the positive correlation between street-length density around homes and the use of motor vehicles in commuting trips confirm the results of a study in the United States showing a link between higher road density and increased gasoline consumption (i.e., motor vehicle use) [
53]. Zlatkovic et al. (2019) applied statistical methods to simulate travel patterns in American cities. Their findings on the impact of increased street connectivity on the reduction in vehicle miles traveled are in line with our results on street-length density around homes and commuting distances [
54]. In other words, reduced street connectivity around homes in Pakistani cities is linked to increased commuting distances.
Studying different choices for transportation modes in various types of neighborhoods has attracted the attention of many urban travel scholars [
16,
55,
56]. Our paper, applying a chi-square test for two different types of neighborhoods, confirms the difference between neighborhood types and different mode choices.
Current scholarly knowledge of the urban built environment and street network variables largely comes from high-income and Western countries. However, the patterns of development, the characteristics of the built environment, the concept of neighborhoods, and the structure and configuration of street networks in developing countries follow different patterns, and thus influence travel behavior differently. There is a lack of studies that have captured the impacts that sprawled forms and low street connectivity have on urban mobility in developing countries, particularly South Asian and Central Asian cities. Pearce et al. (2021) compared variables of accessibility and connectivity in four Asian cities to develop a suitable pedestrian network [
57]. According to their study, street connectivity variables such as the link-node ratio and the length of blocks were related to increased levels of walking in Asian cities. This paper also reveals the same results as a corresponding study of Iranian cities concerning the relationship of street-length density around homes with active transport modes for non-commuting trips, and also street-length density around workplaces and commuting active mobility [
28]. Our results show that with longer streets around workplaces, people use active forms of mobility less in their commutes, which is in line with another investigation on mode choices in the Middle East and North Africa (MENA) [
58]. The findings of our paper regarding a positive correlation between street-length density around homes and commuting distance confirm similar results as those of another MENA city, Tehran [
59].
Street-length density is an indicator for assessing (the lack of) connectivity and also the sprawl of a district. There is therefore a need to model this variable while including urban mobility and socioeconomic attributes in both developed and developing countries. Decision-makers and urban strategists can develop more effective policies to create a more connected street network, which would promote active mobility and physical activity. Urban sprawl is linked to urban form variables such as street connectivity. Many other variables, including intersection density, road density, and link-node ratio, also influence street connectivity directly. Increased street-length density separates districts by establishing long lengths of streets and thus reducing connectivity. Street-length density around workplaces in Pakistani cities correlated with the frequency of using public transport. Hence, designing a more connected street network will lead to the use of public transit. In this paper, we estimated the corresponding street-length density of the optimal cutoff value for both homes and workplaces. Urban planners and decision-makers should consider these levels of street-length density when designing and modifying street networks in their revitalization and development plans. In other words, they should consider shorter lengths with more connections, which would improve the connectivity level of the street network and increase active transportation. As shown in chi-square tests, there are significant differences between sprawled and compact neighborhoods, and the way residents of such areas choose transit modes, for both commuting and non-commuting trips. Compact neighborhoods with mixed land use, a high level of street connectivity, high density, and shorter distances to the city center promote different mode choices for residents; this issue should be considered by decision-makers. In addition, street-length density around homes has a positive correlation with commuting distance and the use of private motor vehicles in both commuting and non-commuting trips. As a result, it is necessary to increase the connectivity of street networks with shorter streets to tackle problems such as traffic congestion, air pollution, greenhouse gas emissions, and energy consumption in large cities in South Asia; our study of Lahore and Rawalpindi demonstrates this.
Although the sample size of this investigation was representative of the level of neighborhoods. There is a limitation regarding collecting data in a larger sample size. So larger sample size can provide a clearer understanding of street network patterns in large South Asian cities and their relations to urban travel habits. In addition, the optimal level of connectivity for active mobility is a new and less-studied topic that needs more investigations in this area for better-determining connectivity regarding active mobility in both contexts of cities in developing and developed countries.
6. Conclusions
Street-length density is an indicator for assessing street connectivity as well as for urban sprawl. This study determined street-length density by dividing the total length of the street by the area of the catchment area for each case in the survey. In the two Pakistani cities under study, street-length density around homes was correlated with commuting distance, the frequency residents use public transit, and the frequency of private motor transport use in commuting and non-commuting trips. Also, street-length density around workplaces has negative associations concerning the frequency of public transport use, commuting distance, and the use of motor vehicles when age, daily activity, and monthly income are fixed in the model. Increasing street-length density around homes corresponded to lower connectivity and less non-commuting active mobility. This behavior was also seen for street-length density around workplaces and commuting active mobility. Three chi-square tests also showed that for sprawled and compact neighborhoods, there are differences between the type of neighborhoods and travel behavior.
Pakistani cities have recently faced rapid urbanization. Immigrants from rural areas chose dispersed areas with a lack of urban facilities and suitable street networks for housing. In Pakistan, these new development areas near the edges of cities have increased as a pattern for urban growth. There has been a need to study how these different street network structures and configurations affect urban travel patterns and socioeconomic variables to help policymakers develop sustainable policies and strategies in emerging areas, such as Pakistani cities. This paper covers the gap of South Asian cities, concentrating on street connectivity as a component for assessing sprawl patterns of an area. This paper also finds optimal points for street-length density related to active mobility. Defining the exact suitable street-length density can help urban planners to design a street network based on the needs of residents and to promote sustainable transport. This means investigating the details and different aspects of street networks for various contexts for urban planning systems. More studies concentrating on different indicators of street network are still necessary, particularly in developing countries; such networks define the form of a neighborhood, and the relationship of it with mobility habits and behavior. The optimal level of street connectivity for sustainable transportation is a less-studied topic among both developed and developing countries, but future studies that consider optimal levels of connectivity could provide knowledge in this area.


 ,
, 
