Article

Effect of Rotational Speed Variation on the Flow Characteristics in the Rotor-Stator System Cavity

1
Key Laboratory of Fluid and Power Machinery, Ministry of Education, Xihua University, Chengdu 610039, China
2
School of Energy and Power Engineering, Xihua University, Chengdu 610039, China
*
Author to whom correspondence should be addressed.
Appl. Sci. 2021, 11(22), 11000; https://doi.org/10.3390/app112211000
Submission received: 18 October 2021 / Revised: 15 November 2021 / Accepted: 16 November 2021 / Published: 20 November 2021

Abstract

:
In this paper, to study the effect of dynamic and static interference of clearance flow in fluid machinery caused by changes in rotational speed, the model was simplified to a rotor-stator system cavity flow. Investigating the flow characteristics in the cavity by changing the rotor speed of the rotor-stator system is of considerable significance. ANSYS-CFX was applied to numerically simulate the test model and the results were compared with the experimental results of the windage torque of the rotor-stator system. The inlet flow rate and geometric model remained unchanged. With an increase in the rotating Reynolds number, the shear stress on the rotor wall gradually increased, and the maximum gradient was within l* < 0.15. In addition to the shear stress, the tangential Reynolds stress R contributed partly to the torque on the rotor wall. The swirling vortex formed by entrainment in the cavity of the rotor-stator system tended to separate at ReΦ= 3.53 × 10⁶. As the rotating Reynolds number continued to increase, the secondary vortex finally separated completely. The strength of the vortex in the rotor turbulent boundary layer decreased with an increase in the rotating speed, but the number of vortex cores increased with the increase of speed. Depending on the application of the fluid machine, controlling the rotating speed within a reasonable range can effectively improve the characteristics of the clearance flow.

1. Introduction

With the popularization of frequency conversion technology in fluid machinery, the demand for variable-speed operation of fluid machinery, such as fans and compressors, is gradually increasing. Clearance flow in fluid mechanics is common in the small cavities formed by the rotor and stator, and using the fluid mechanics as a complete computational domain reduces the accuracy of calculations within the cavities. By simplifying this clearance flow to a rotor-stator cavity flow, the internal flow characteristics can be accurately analyzed and subtle changes can be more easily captured. When the rotating speed changes, the characteristics of the flow in the cavity change to varying degrees. Under the action of high-speed rotation and wall shear stress, the clearance flow of the rotor-stator system has an important impact on the system stability.
Many researchers have studied the cavity flow in the rotor-stator system. Faller and Alan [1] used a rotor-stator system experiment to analyze the critical Reynolds number of the Ekman laminar boundary layer quantitatively. Owen and Bayley [2,3] also studied the influence of different rotating speed discs on the flow in the cavity through experiments, obtained the torque coefficient of the disc, and made theoretical predictions. Serre et al. [4] indicated that the Ekman boundary layer has a stable three-dimensional axisymmetric structure at a critical speed. When the speed continues to increase, a second transition process to unsteady flow occurs.
In recent years, some research has focused on improving the calculation accuracy of turbulence models. Amirante and Hills [5] studied the boundary layer flow field distribution at different Mach numbers by using improved implicit large-eddy simulation. The results obtained by this improved turbulence model are basically consistent with the experimental data and direct numerical simulation (DNS) results. Eunok et al. [6] used DNS and linear stability analysis to analyze the boundary layer of a shrouded rotor-stator system and increased the rotational Reynolds number from 0 to 4 × 10⁵. The transition process of the boundary layer from laminar to turbulent flow can be clearly observed. Appelquist et al. [7,8] applied DNS to calculate numerically the rotor-stator system and quantitatively analyzed the value of the velocity change in the rotor boundary layer and the critical Reynolds number. Oguic et al. [9] simulated the model of an axial jet entering the rotor-stator cavity using high-precision DNS and obtained the distribution of the local Nusselt number along the rotor, which is basically consistent with the experimental results. Davies et al. [10] mathematically explained the problem in DNS simulation of rotating disc flow, that is, the rotating disc can still maintain global linear stability under the influence of strong instability. Pitz et al. [11] adopted high-precision DNS to compare the numerical simulation results of adiabatic rotor/stator and rotor/rotor cavities with experimental results, verifying the accuracy of the improved numerical calculation method.
Numerous researchers have used the method of combining the rotor-stator system test and numerical simulation to do in-depth study. Darvish and Nejat [12] selected the shear stress transport (SST) k-ω turbulence model for numerical calculations and increased the mass flow in the rotor-stator system by changing the cavity geometry to reduce the inlet static pressure. Luo et al. [13] tested the rotor-stator cavity, obtained the distribution of pressure and heat transfer on the rotor at different rotating speeds and flow rates, and estimated the windage torque coefficient. Based on the linearized complex Ginzburg–Landau equation and experimental results, Healey [14] concluded that there is a linear global instability in the boundary layer of the rotating disc, which may be caused by the local instability at the edge of the disc. Geis et al. [15] simplified the high-pressure part of the gas turbine model, conducted a rotor-stator system test, and obtained the influence of the heat generated by the windage on the surface temperature change in the cavity. Poncet et al. [16] divided the flow into Batchelor and Stewartson structures according to whether there is a rotating vortex core in the axial inlet cavity. Makino et al. [17] proposed that, in a certain range of rotational Reynolds numbers, the streamline curvature instability plays a leading role in the transition process from the rotor boundary layer to turbulence.
Clearance flow is more widely available in practical applications and many scholars have worked on various aspects of clearance flow. Abadi et al. [18] employed numerical and experimental studies to assess the variables influencing the energy efficiency of a new regenerative evaporative cooler utilizing indirect evaporative cooling at the dew point. Internal heat transfer and efficiency are investigated in the experiments by varying the size of the clearance. Gu et al. [19] addressed the problem of leakage and pressure distribution in centrifugal pumps and proposed a theoretical model for the direct prediction of leakage flow. He developed a pressure model for the simplified geometry of an open rotor-stator cavity by introducing Poncet’s K formula. Predictions from the new one-dimensional pressure model showed good accuracy and outperformed those from a pressure model using the conventional constant K, when compared with the measured casing wall pressure of an adjustable-speed centrifugal pump. Ghalandari et al. [20] quantitatively analyzed the underwater model using a numerical approach with a boundary element method-finite element method model. Based on the proposed model, a code has been developed which can be applied to any two- and three- dimensional water tank with an arbitrarily shaped elastic underwater structure. Wang et al. [21] proposed a rigid vortex transport equation based on vorticity decomposition, which can be used to distinguish rigid rotation from shear motion of a local fluid. This equation provides a practical method for the analysis and control of interstitial vortex flow. Yuan et al. [22] performed numerical simulations of three-dimensional compressible flow in a water poppet valve model and analyzed three types of cavitation at different locations within the valve based on vortex dynamics. It was calculated that the vortex cavitation within the free shear layer is due to vortex dynamics, while the additional cavitation at the trailing edge of the poppet valve and in the chamfered recess is caused by flow separation.
Based on the analysis of the flow characteristics in the rotor-stator system cavity, some researchers have studied the influence of the rotating speed on the flow field distribution and rotor torque. Zhe et al. [23] adopted the large eddy simulation method to numerically study an enclosed annular rotating static system. As the speed is incremented from 2000 rpm to 10,000 rpm, the flow structure varies from a torsional Couette type to a Batchelor type. In addition, the turbulence near the rotor side and near the stator side is highly anisotropic, as obtained by Reynolds stress analysis. By simplifying the clearance flow in fluid machinery into the cavity flow of a classical cylindrical inlet rotor-stator system, the internal flow was analyzed quantitatively by means of dimensionless parameters, and the variation law of disc torque at different rotating speeds was studied. Previous scholars tended to ignore the variation in swirling vortex within the cavity in their studies of the rotor-stator system. By monitoring different variables within the cavity, a correlation was found between the change in shear strain rate and the separation of the swirling vortex as the rotation speed increased. In order to be capable of monitoring the distribution of physical quantities within the turbulent boundary layer, shear strain rate data were extracted close to the rotor wall for processing and ultimately quantifying the flow parameters within the boundary layer. Under the action of high-speed rotation and wall shear stress in the rotor-stator system, the clearance flow characteristics directly affect the aerodynamic performance and efficiency of the entire machine. This is of vital importance for the optimal design of fluid machinery with a clearance flow.

2. Physical Model and Numerical Method

2.1. Physical Model and Computational Domain

The same cavity model of the rotor-stator system was established as that in the windage torque experiment of Luo et al. [13,24]. The basic principle of the experimental method uses the torque balance theory, with the turntable motor as a whole placed on the floating support bearing, the whole only being subject to windage torque between the turntable and the air, and on the side of the torque meter, the measurement obtained is the turntable in the process of rotation by windage torque. This method to achieve the turntable wind resistance torque is measured by the static torque meter. The static torque meter is a Lorenz–Messtechnik model 0150H small-range precision torque meter with the range of ±20 Nm and the measurement accuracy of 0.1%. The AD-AM-4018 module was used to collect signals and transmitted them to the IPC for real-time monitoring and data storage.
The fluid flows in from the axial direction and out from the radial direction. Figure 1 shows a specific structure. The relevant parameters defined in this study are mainly the geometric dimensions and physical quantities. The dimensionless parameter of the geometric dimensions is the outlet gap ratio, G, which is defined as
G = s r
where s is the outlet clearance, s = 27 mm, and r is the radius of the rotating disc (r = 225 mm). In addition to the dimensionless parameters, the inlet radius rin = 20 mm and the inlet section length lin = 150 mm. The dimensionless parameters of physical quantities include the rotational Reynolds number ReΦ, flow coefficient Cw, and torque coefficient Cm, which are defined as
R e Φ = ρ Ω r 2 μ
C w = m μ r
C m = T 1 2 ρ Ω 2 r 5
where ρ is the air density, Ω is the rotor angular velocity, μ is the dynamic viscosity coefficient, m is the mass flow rate, and T is the single side torque of the rotating disc.
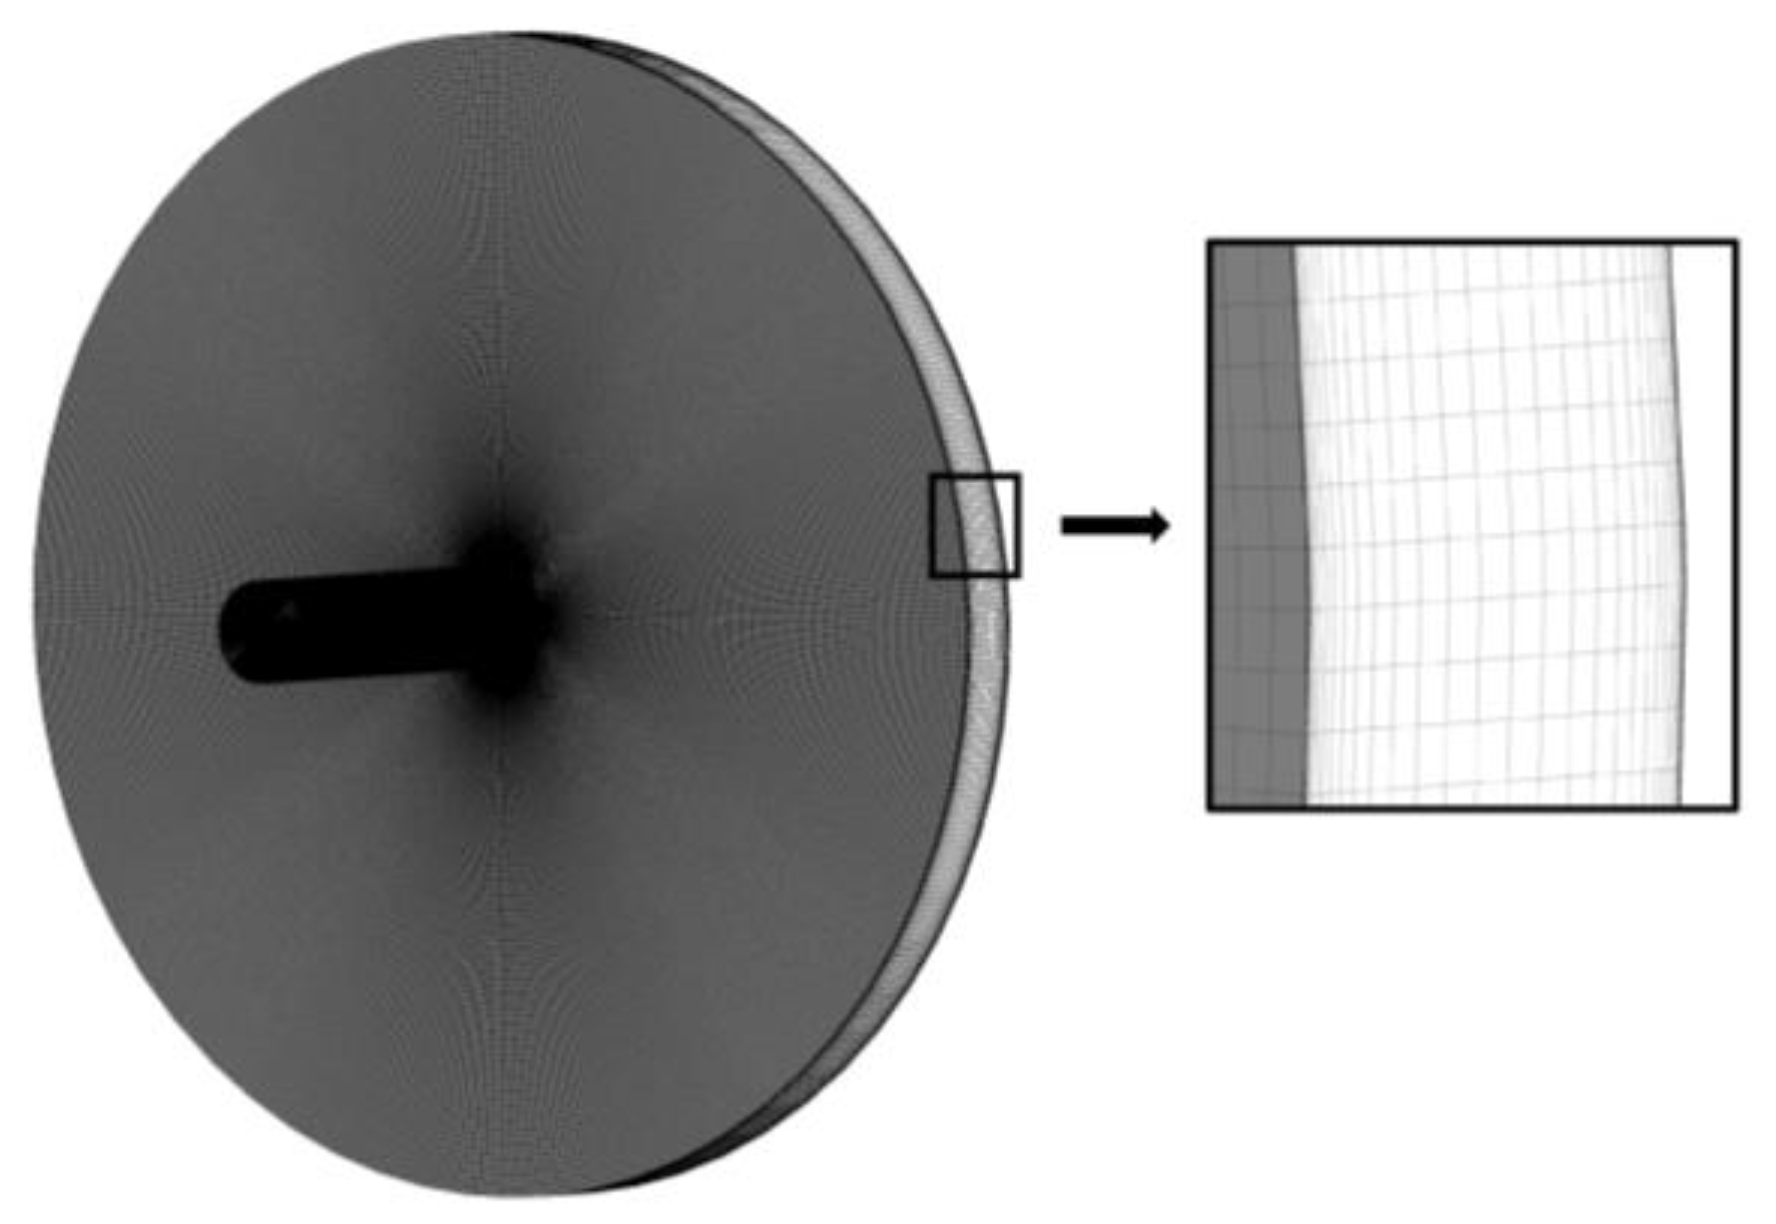
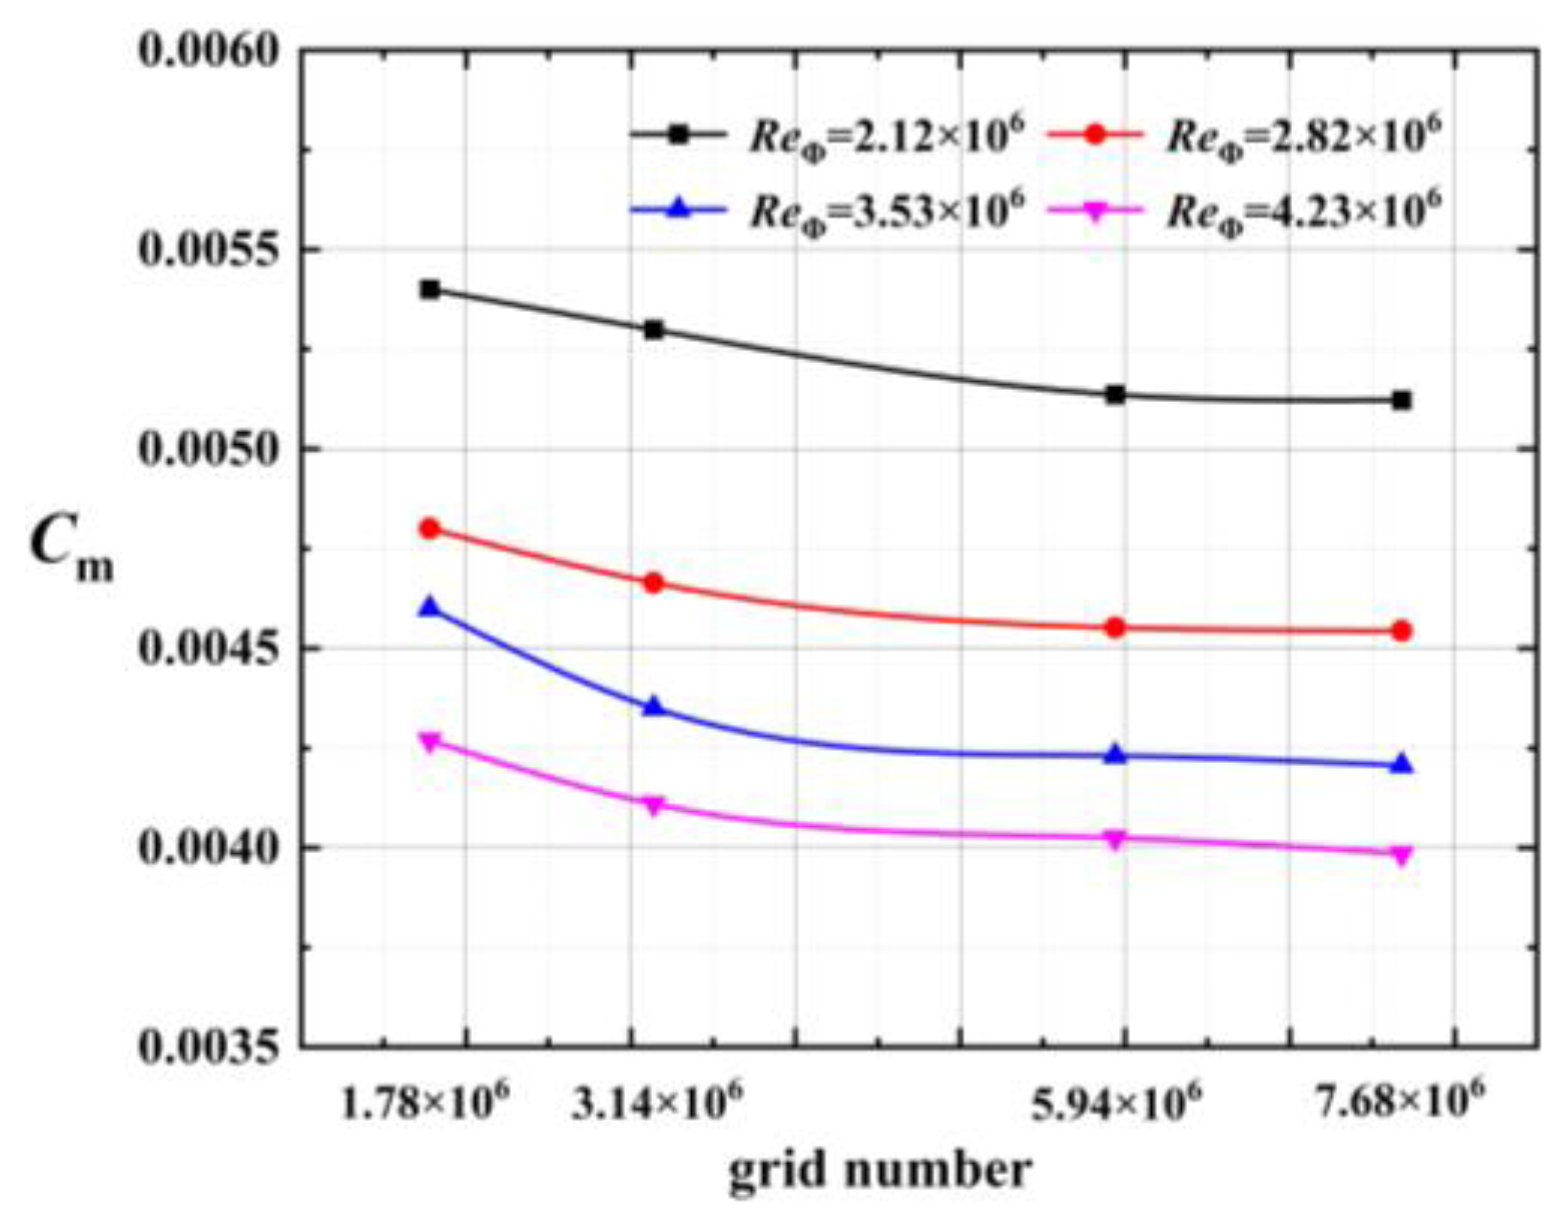
The grid of the computational domain is shown in Figure 2. The first grid height of the rotor and stator was 0.005 mm. Roache [25] proposed to use the grid convergence index (GCI) to calculate discrete errors, and the method requires the results to satisfy monotonic convergence conditions. The detailed principles and methods of GCI calculation can be found in the original literature. The number of grids and related data in the grid independence verification are shown in Table 1. Based on the experimental torque coefficient Cm, the influences of different numbers of grids on the calculation results were compared. As shown in Figure 3, with an increase in the grid number, the torque coefficient Cm decreases to different degrees at different rotational Reynolds numbers. When the grid number was increased from 5.94 × 10⁶ to 7.68 × 10⁶, the variation of Cm values is less than 1%. Considering the calculation accuracy and efficiency, 5.94 × 10⁶ grids were selected for calculation.
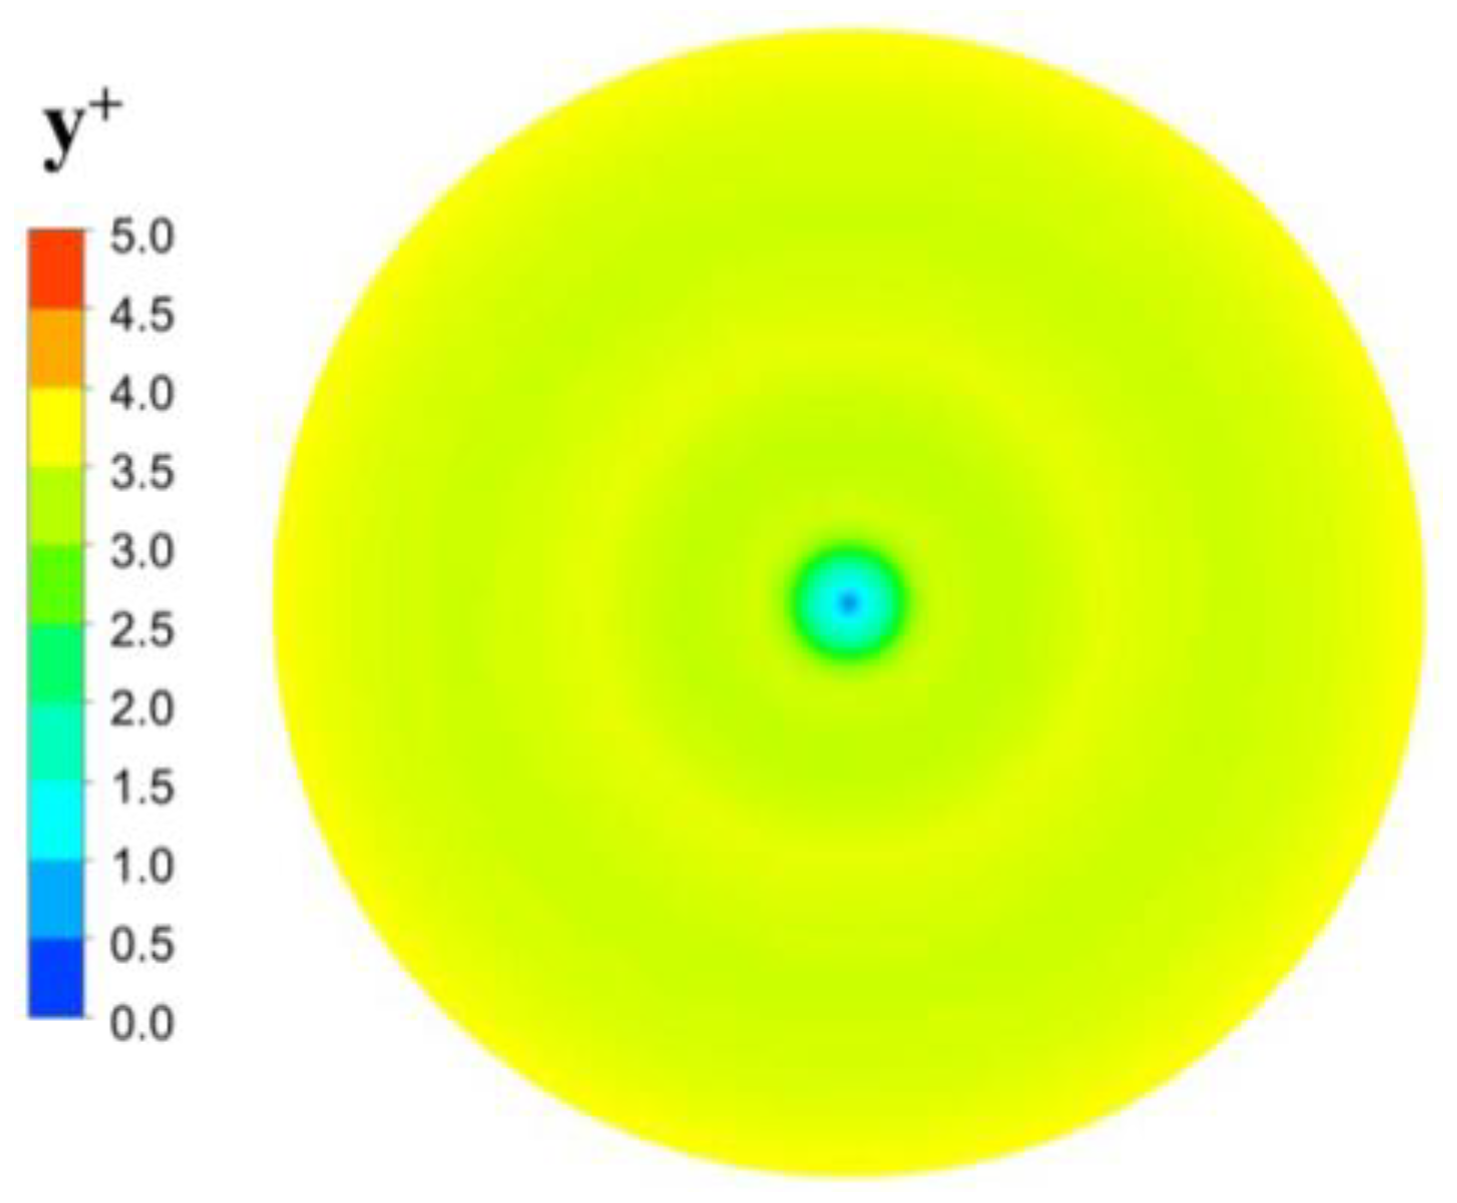
The number of boundary layer grids and the value of y+ are important for observing the formation and development of vortices in the rotor-stator system. Blocken et al. [26] analyzed the selection of the y+ value for a high Reynolds number flow. To ensure the accuracy of the near-wall fluid calculation, when y+ < 5, the flow law of the viscous sublayer can be obtained more accurately. The y+ value of the rotor wall is shown in Figure 4.

2.2. Turbulence Model

The scale adaptative simulation (SAS)-SST model, a hybrid Reynolds averaged Navier–Stokes (RANS) and LES method proposed by Menter [27], is based on the SST k-ω turbulence model [28] and introduces the von Kármán length scale. The von Kármán scale can be dynamically adjusted according to the characteristics of the local flow structure, so that the model maintains the performance of the original RANS model in the stable flow area and has a calculation performance similar to that of LES in the unstable flow area. The turbulence model is less sensitive to the grid, which improves computational efficiency. Mulu et al. [29] comprehensively considered a variety of turbulence models to simulate hydroturbines numerically. The SAS-SST turbulence model was used to calculate the accuracy of the near-wall flow field to meet the requirements.

2.3. Computational Setup

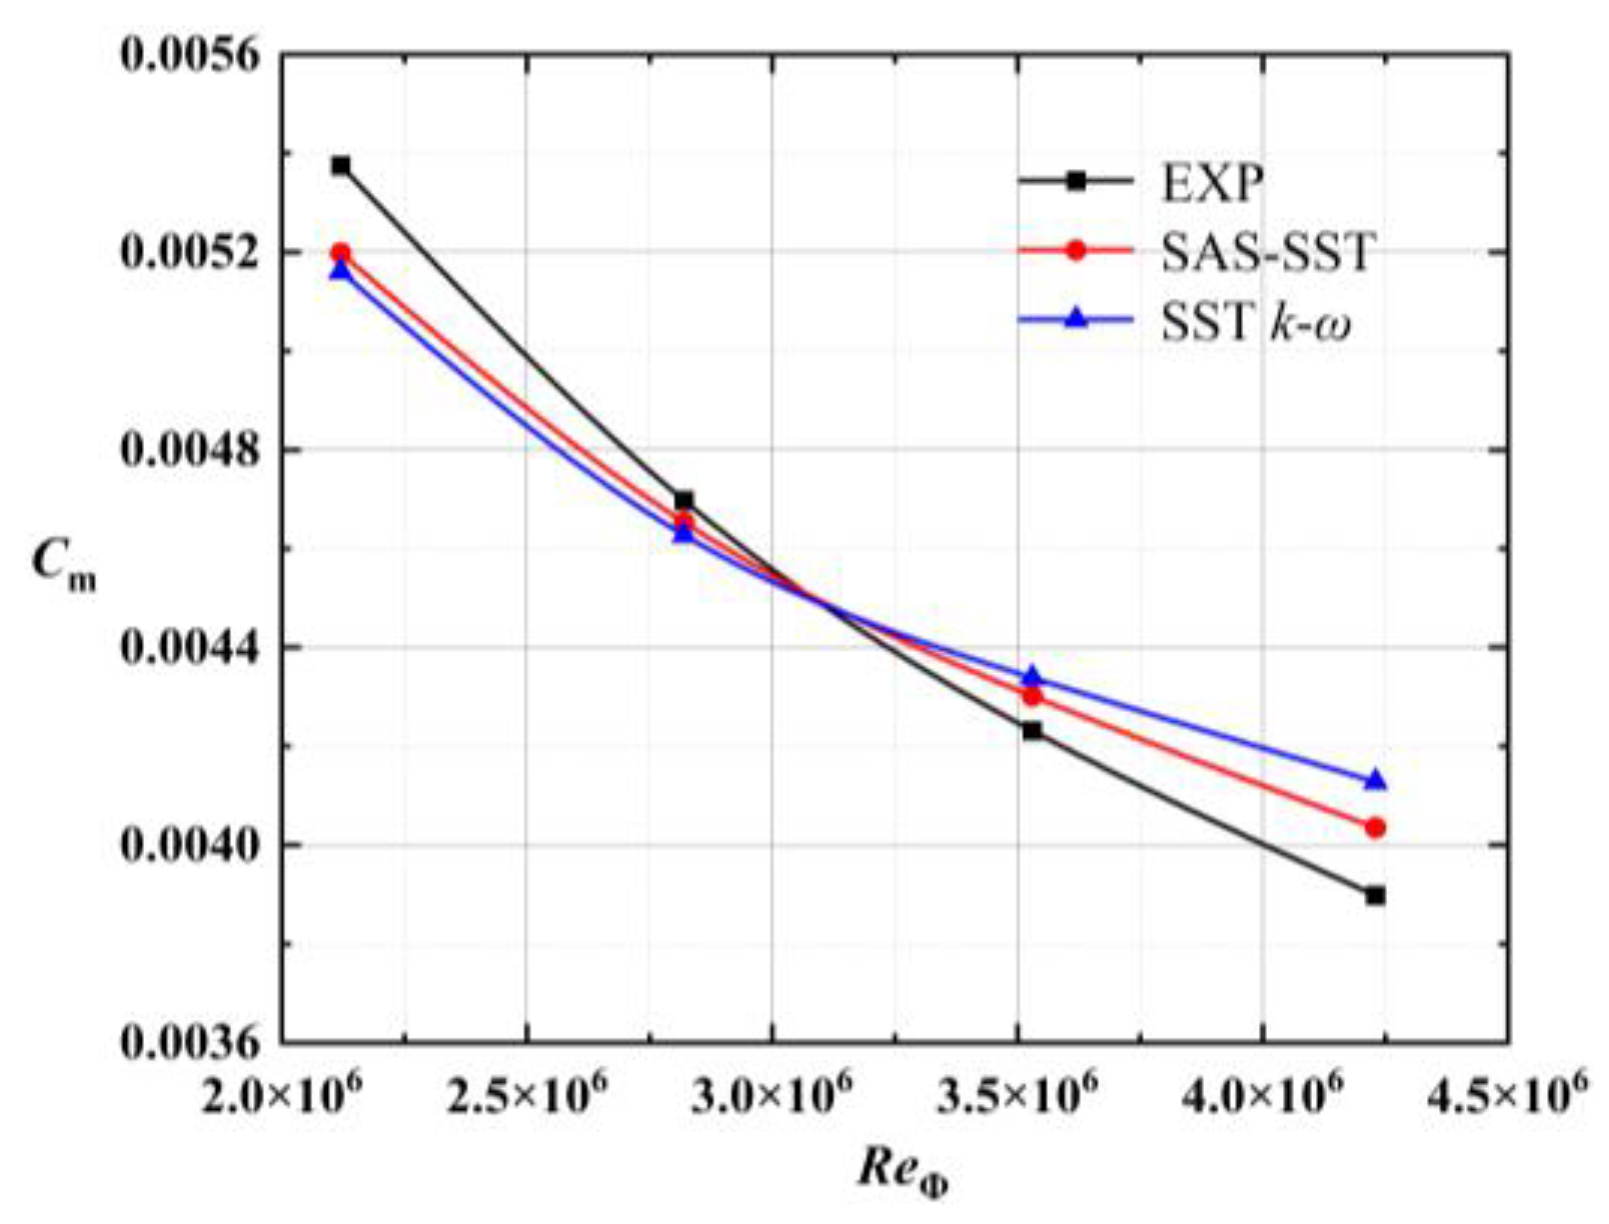
The flow field of rotor-stator system was solved using ANSYS-CFX in this article. The working medium in the computational domain was set as air at 298.15 K. According to the rotor-stator system experiment, the mass flow and turbulence intensity of 5% were imposed at the inlet, and the outlet was open. The rotating speed was gradually increased, and the numerical calculation was divided into four cases. The dimensionless parameters were presented in Table 2. All walls in the geometric model were set to the no-slip wall condition. The computational domain was set as a stationary part, and the disc was set as a rotating wall. The timestep selected for use is based on the size of the Courant number. After verification, it was concluded that a rotation of one degree per step can ensure that the root mean square Courant number was below 5, which could improve the efficiency of the calculation and also make the data more stable. Taking ReΦ = 2.12 × 10⁶ as an example, the total time of the unsteady calculation was 0.1 s, the timestep was 2.78 × 10⁻⁵ s, and the process file was saved every five timesteps in the last four rotation cycles. The numerical simulation adopted the SST k-ω and SAS-SST turbulence models, and unsteady calculations were performed for the flow coefficient Cw = 3.41 × 10⁴. The average value of the torque coefficient Cm of the last two rotation periods was processed. As Figure 5 shows, the calculation results of different turbulence models were compared with the torque coefficients of the experiment. The simulation results were compared with the experimental results based on the error analysis method. The relative error between the SAS-SST numerical calculation and the experimental result was 3.3%, and the relative error of the SST k-ω model was 4.9%. Therefore, the SAS-SST turbulence model was selected for the calculations.

3. Results and Discussion

To investigate the flow characteristics in the cavity of the rotor-stator system, we began with the windage torque, and then analyzed the flow field distribution characteristics, Reynolds stress, and vortex structure in the rotor-stator system. Combined with the characteristics of the external characteristics, the internal flow was analyzed in a targeted manner, and the reasons and laws that cause the changes in the external characteristics were summarized.
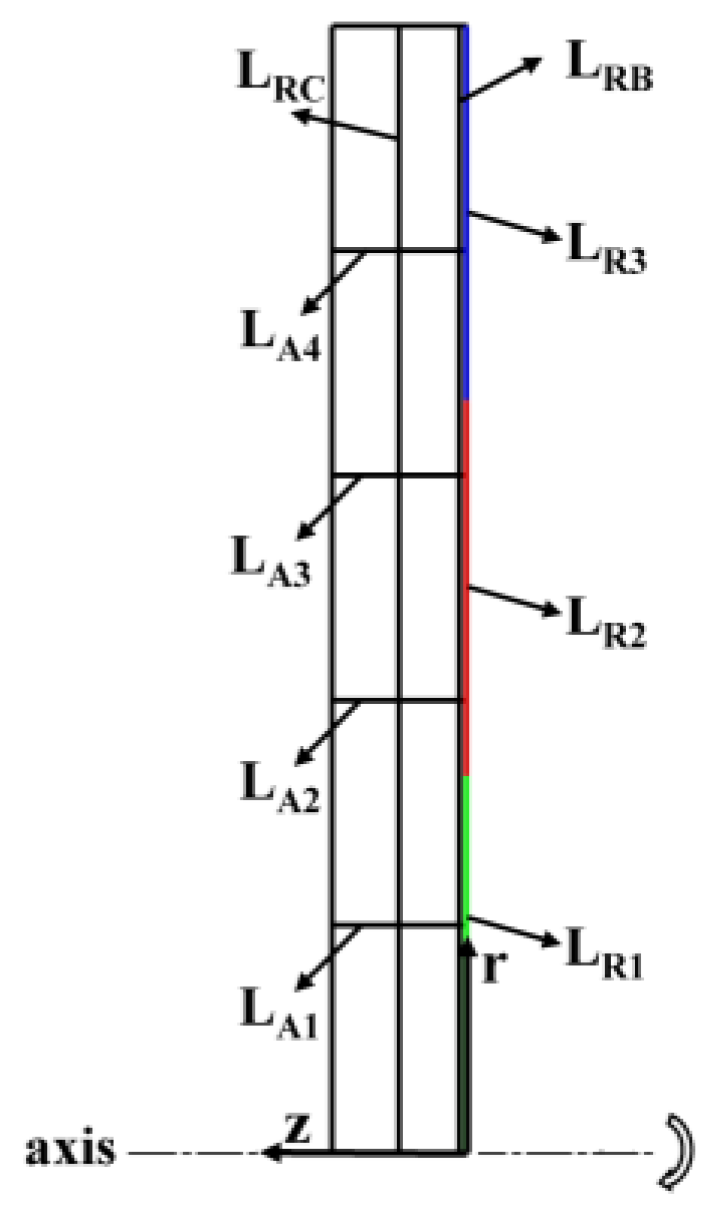
As shown in Figure 6, a monitoring line for the statistical physical quantity was arranged. The intersection line LR between the r-z plane and the rotor wall was drawn, and the intersection was divided into three equal parts, which were denoted as LR1, LR2, and LR3. These monitoring lines were used to count the radial variation of torque on the disc and the contribution of each component to the disc torque. The plane was divided into five parts along the radial direction on the r-z plane, and named LA1, LA2, LA3, and LA4 as the axial monitoring lines. These were statistics of the distribution of circumferential velocities along the axial direction at different positions and monitoring of changes in the rotor boundary layer and reflux zone. A monitoring line (recorded as LRB) 1.5 mm away from the rotor profile line in the +z direction was created to count the changes in the shear strain rate of the rotor boundary layer. This monitoring line is used to count the distribution of shear strain rate along the radial direction within the turbulent boundary layer and to determine the dominant factor generating the rotor torque. The midpoints of the two-line segments were connected with r = 0 and r = 225 on the r-z plane to monitor the physical quantity changes in the middle flow channel of the cavity.

3.1. Torque Distribution Characteristics of the Rotor Wall

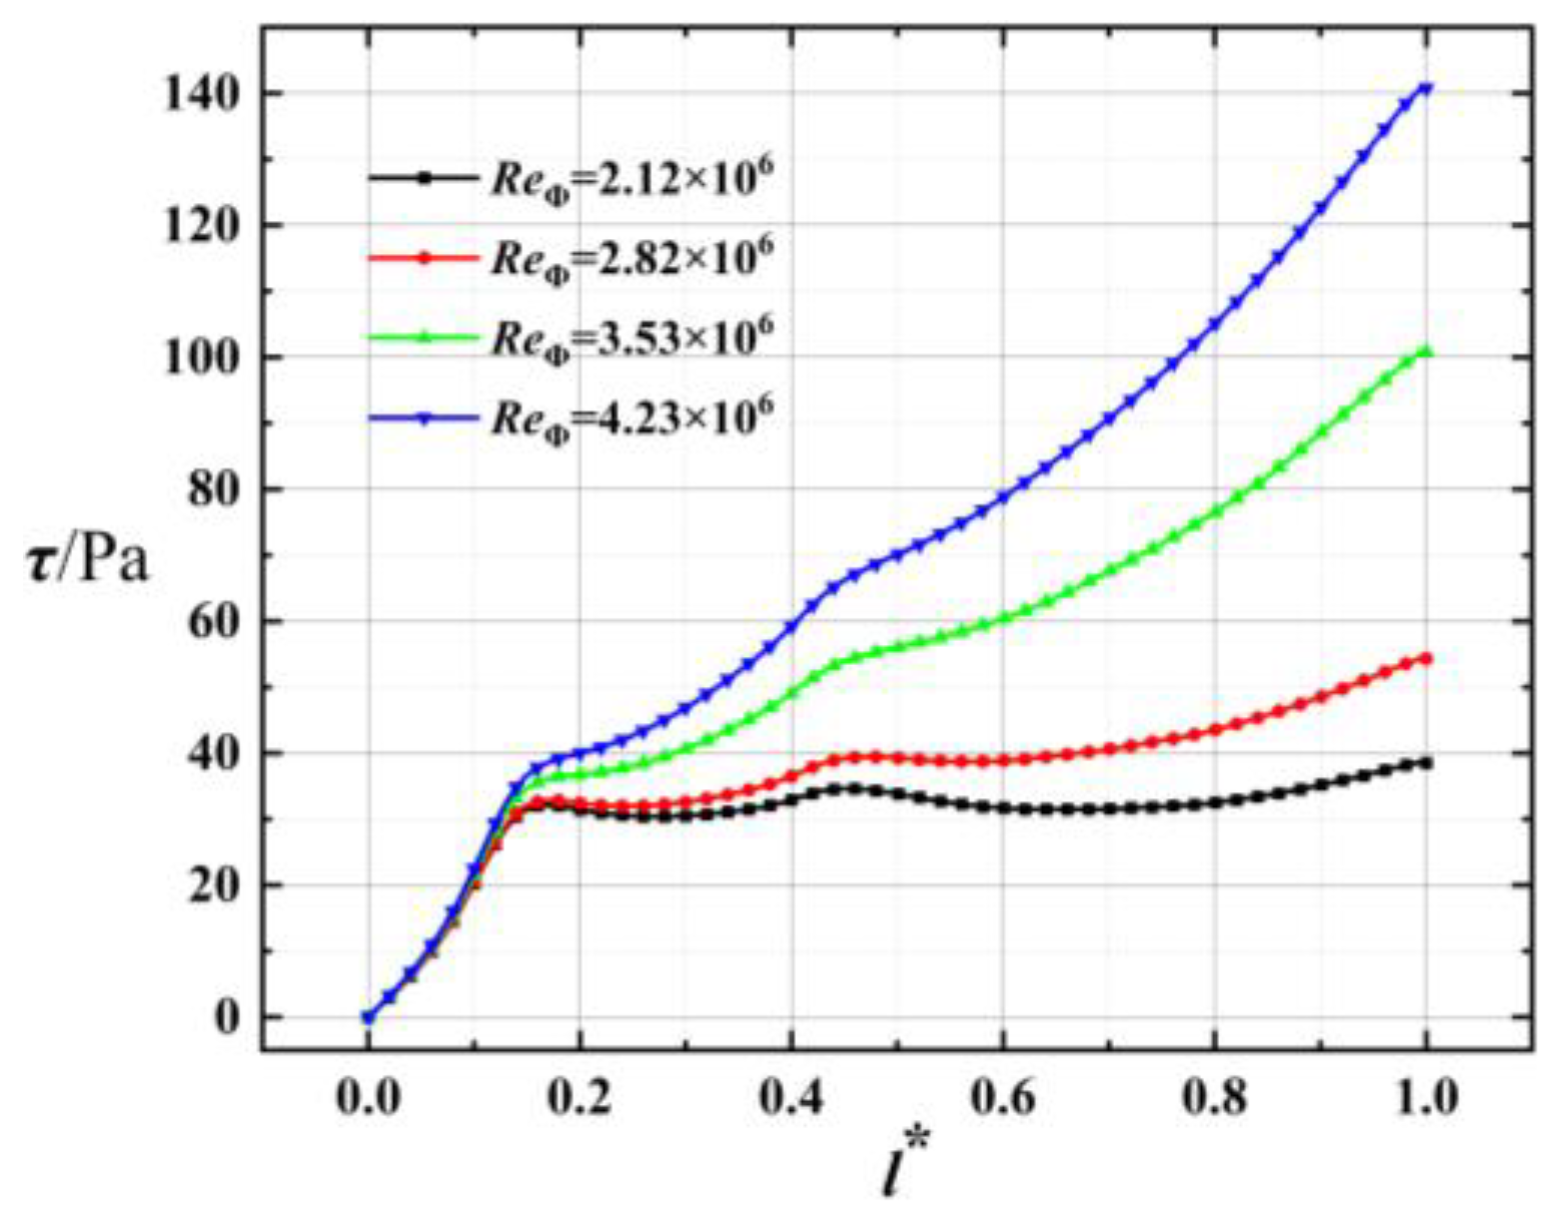
The unsteady calculation results for the time-averaged distribution of the wall shear stress on the rotor wall are shown in Figure 7. The LR length in the three cases is dimensionless, and l* is obtained. To combine the shear stress with the torque, the shear stress was integrated on LR, and the formula is
T = r · τ · 2 π r d r = 2 π τ · r 2 d r
where τ is the shear stress. Equation (5) shows that, when r is constant, the shear stress is proportional to the torque, and the torque is mainly formed by the shear force acting on the arm. Therefore, the torque of the disc increases with an increase in ReΦ.
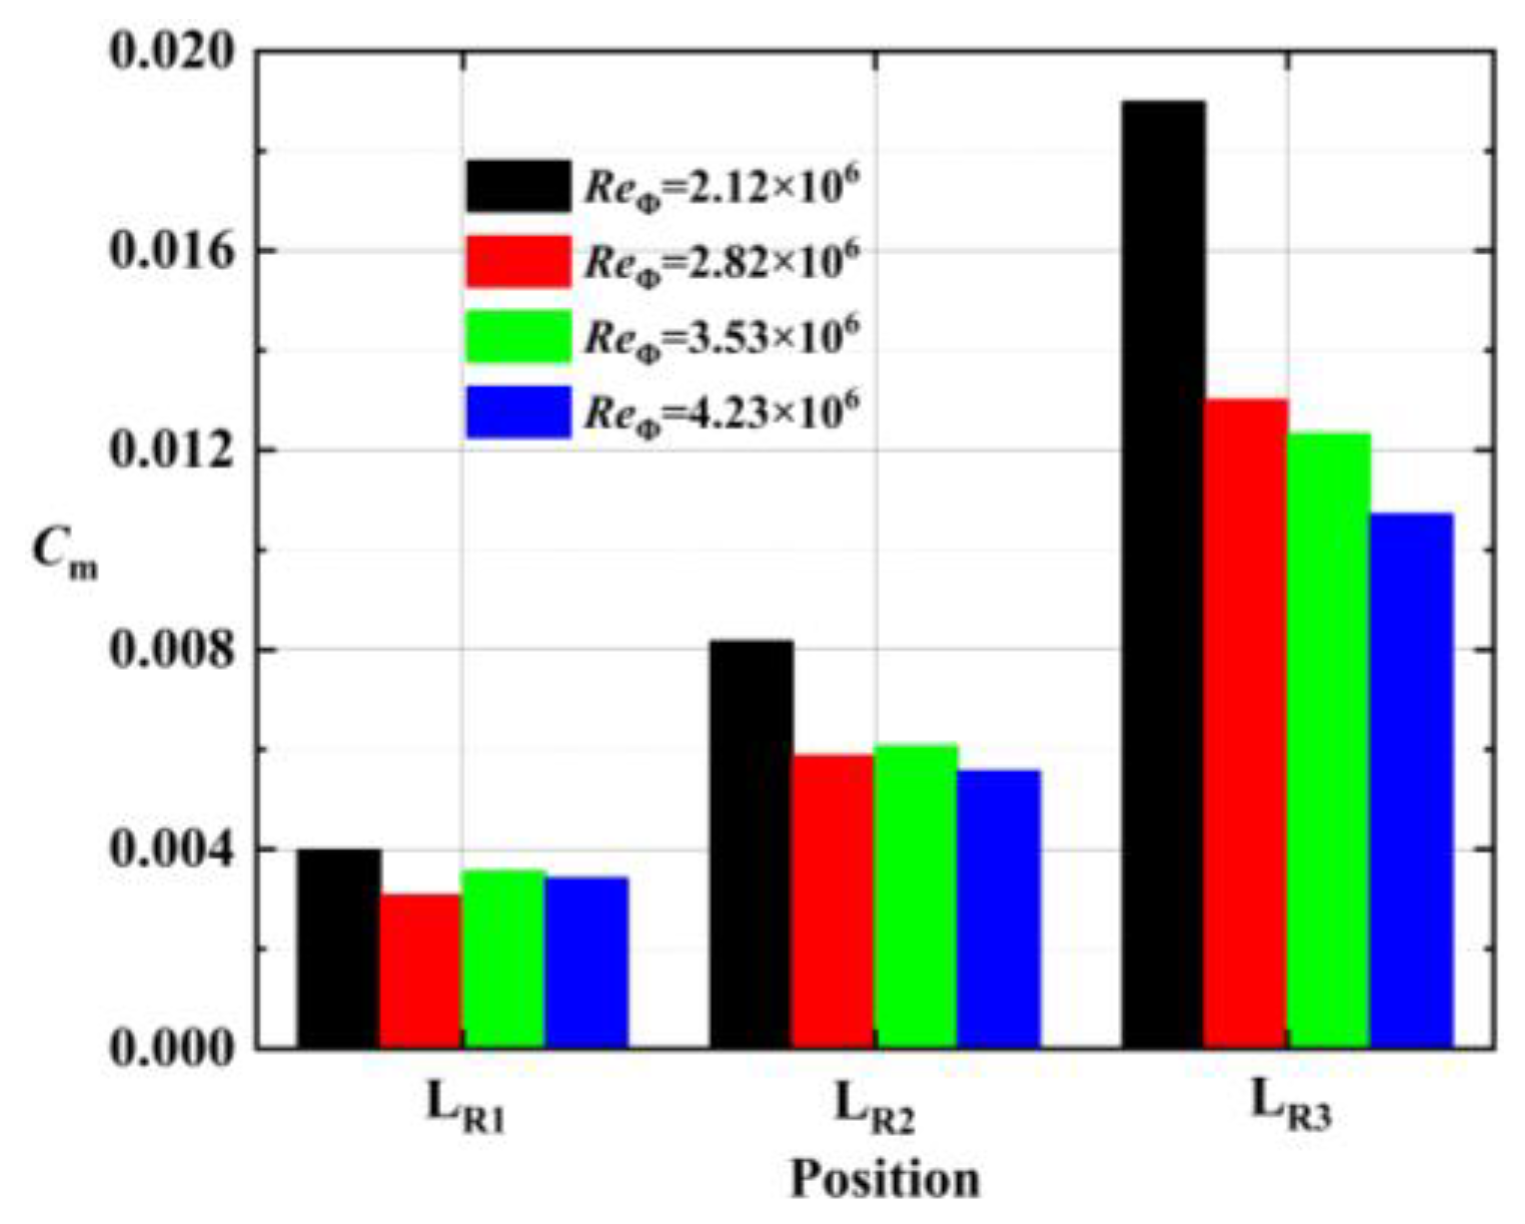
The torque generated on LR1, LR2, and LR3 is transformed into a dimensionless torque coefficient, Cm, as shown in Figure 8. The contribution of shear stress was generated by the fluid viscosity, and the rotor-stator interference to the torque was generated by the rotor in different regions. The torque coefficient gradually increased along the radial direction. The case of ReΦ = 2.12 × 10⁶ had the largest torque coefficient in each part of the rotating disc. With an increase in ReΦ, the gradient of variation of the torque coefficient in the radial direction gradually decreases.

3.2. Flow Field Distribution Characteristics

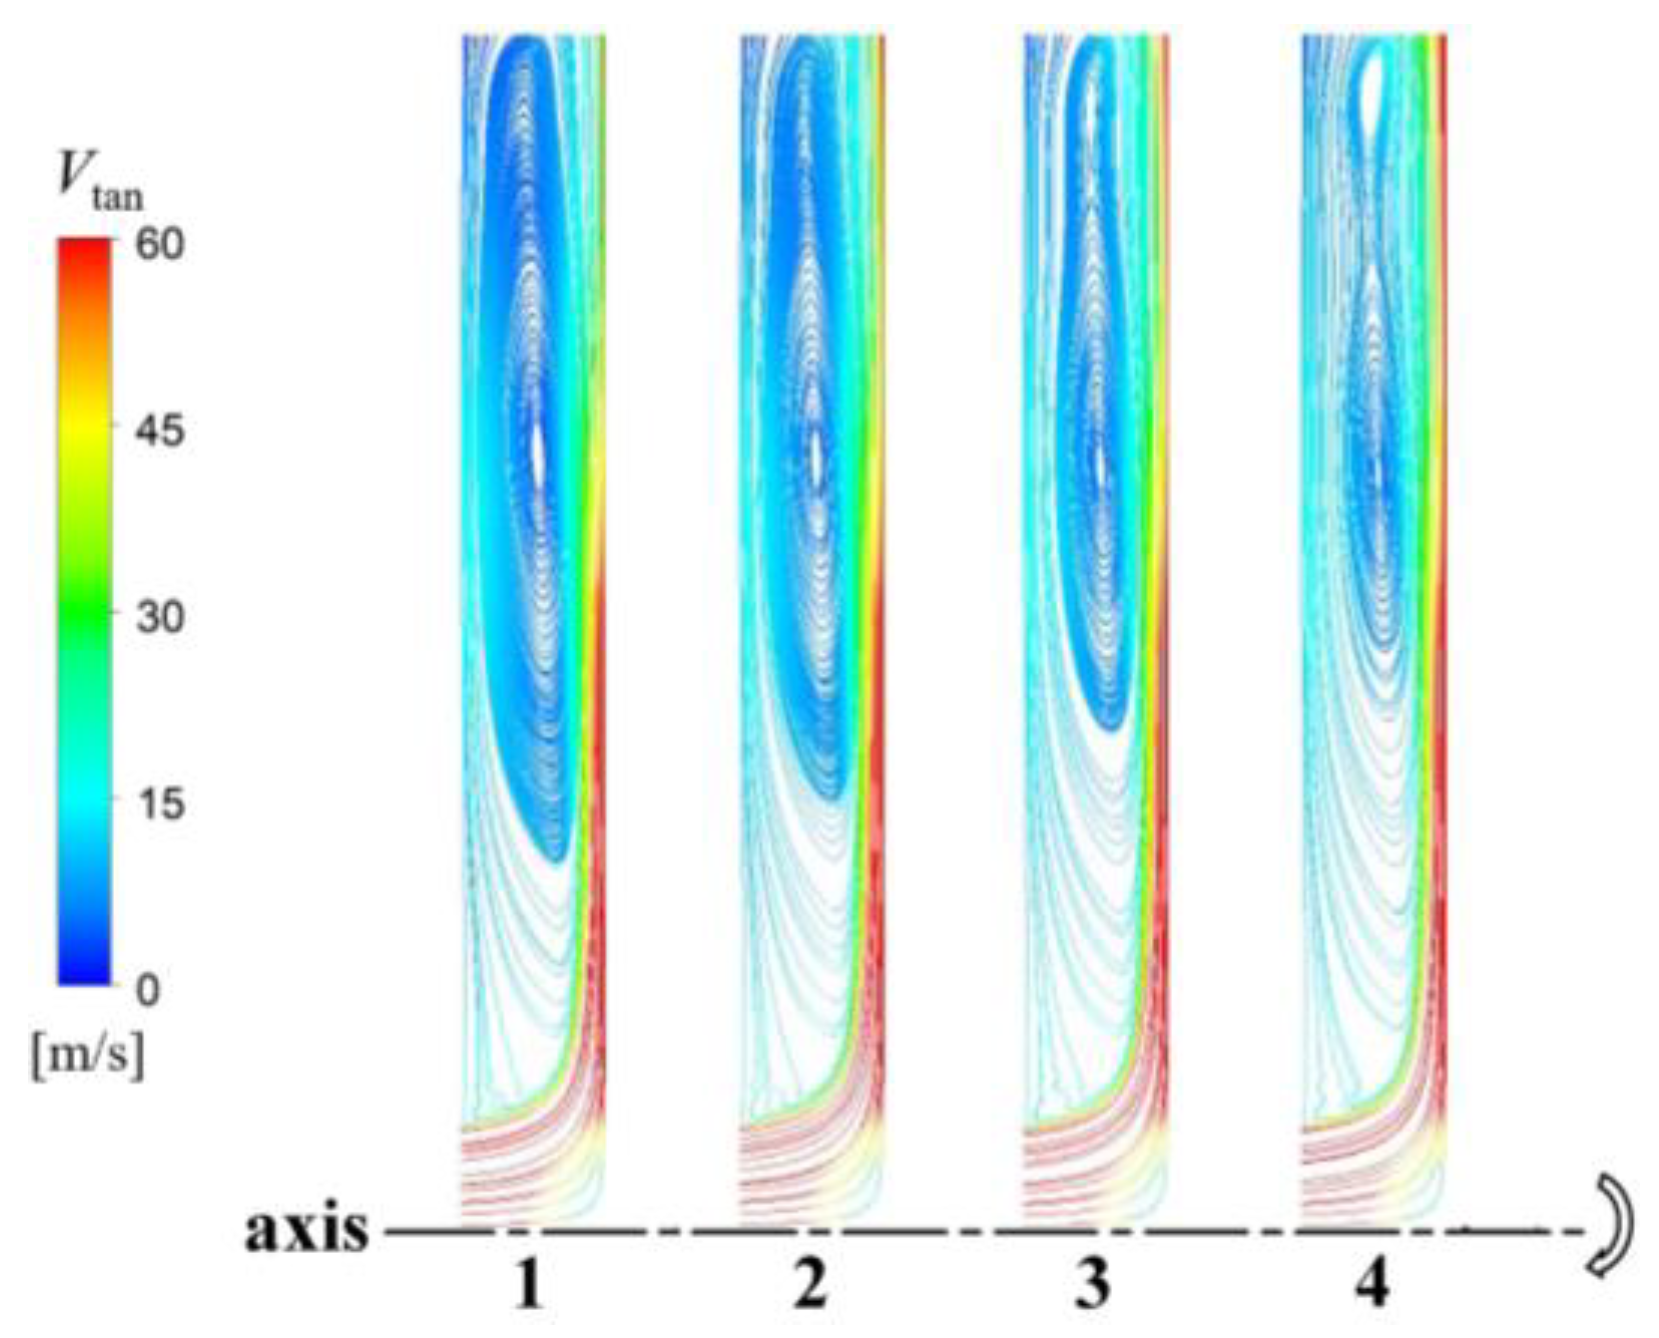
Under the condition of a constant inlet flow coefficient, ReΦ increases from 2.12 × 10⁶ to 4.23 × 10⁶. In Figure 9, the distributions of the r-z-plane streamlines in the cavity at different rotating speeds are compared. The legend represents the absolute velocity Vtan of the fluid microelement at this point:
V tan = ( V r 2 + V z 2 ) 1 2
Here, Vr is the radial component of the velocity vector, and Vz is the axial component of the velocity vector.
The figure shows that the vortex in the cavity is mainly the swirling vortex formed by the entrainment of the outlet and the interference of the rotor-stator wall, that is, the main vortex in the cavity. The position of the main vortex core hardly changes in the radial direction with an increase in ReΦ. However, under the action of inertial force, the trend of separating the secondary vortex can be seen in the streamline diagram of Case 3. Until ReΦ increases to 4.23 × 10⁶, the secondary vortex is completely separated. The distribution of Vtan on the streamline shows that the absolute velocity of the main vortex core corresponding to the position in the rotor boundary layer is smaller than that at other positions in the boundary layer. Therefore, Vtan in the rotor boundary layer decreases first and then increases along the radial direction as a whole. When the disc rotating speed increases, Vtan in the rotor boundary layer gradually increases under the action of wall adhesion and fluid viscosity. In addition, the streamlines near the stator wall become sparse with the increase in ReΦ, which indicates that the increase in the rotor rotating speed causes the structure of the main vortex formed by the entrainment of the fluid in the cavity to decrease gradually.
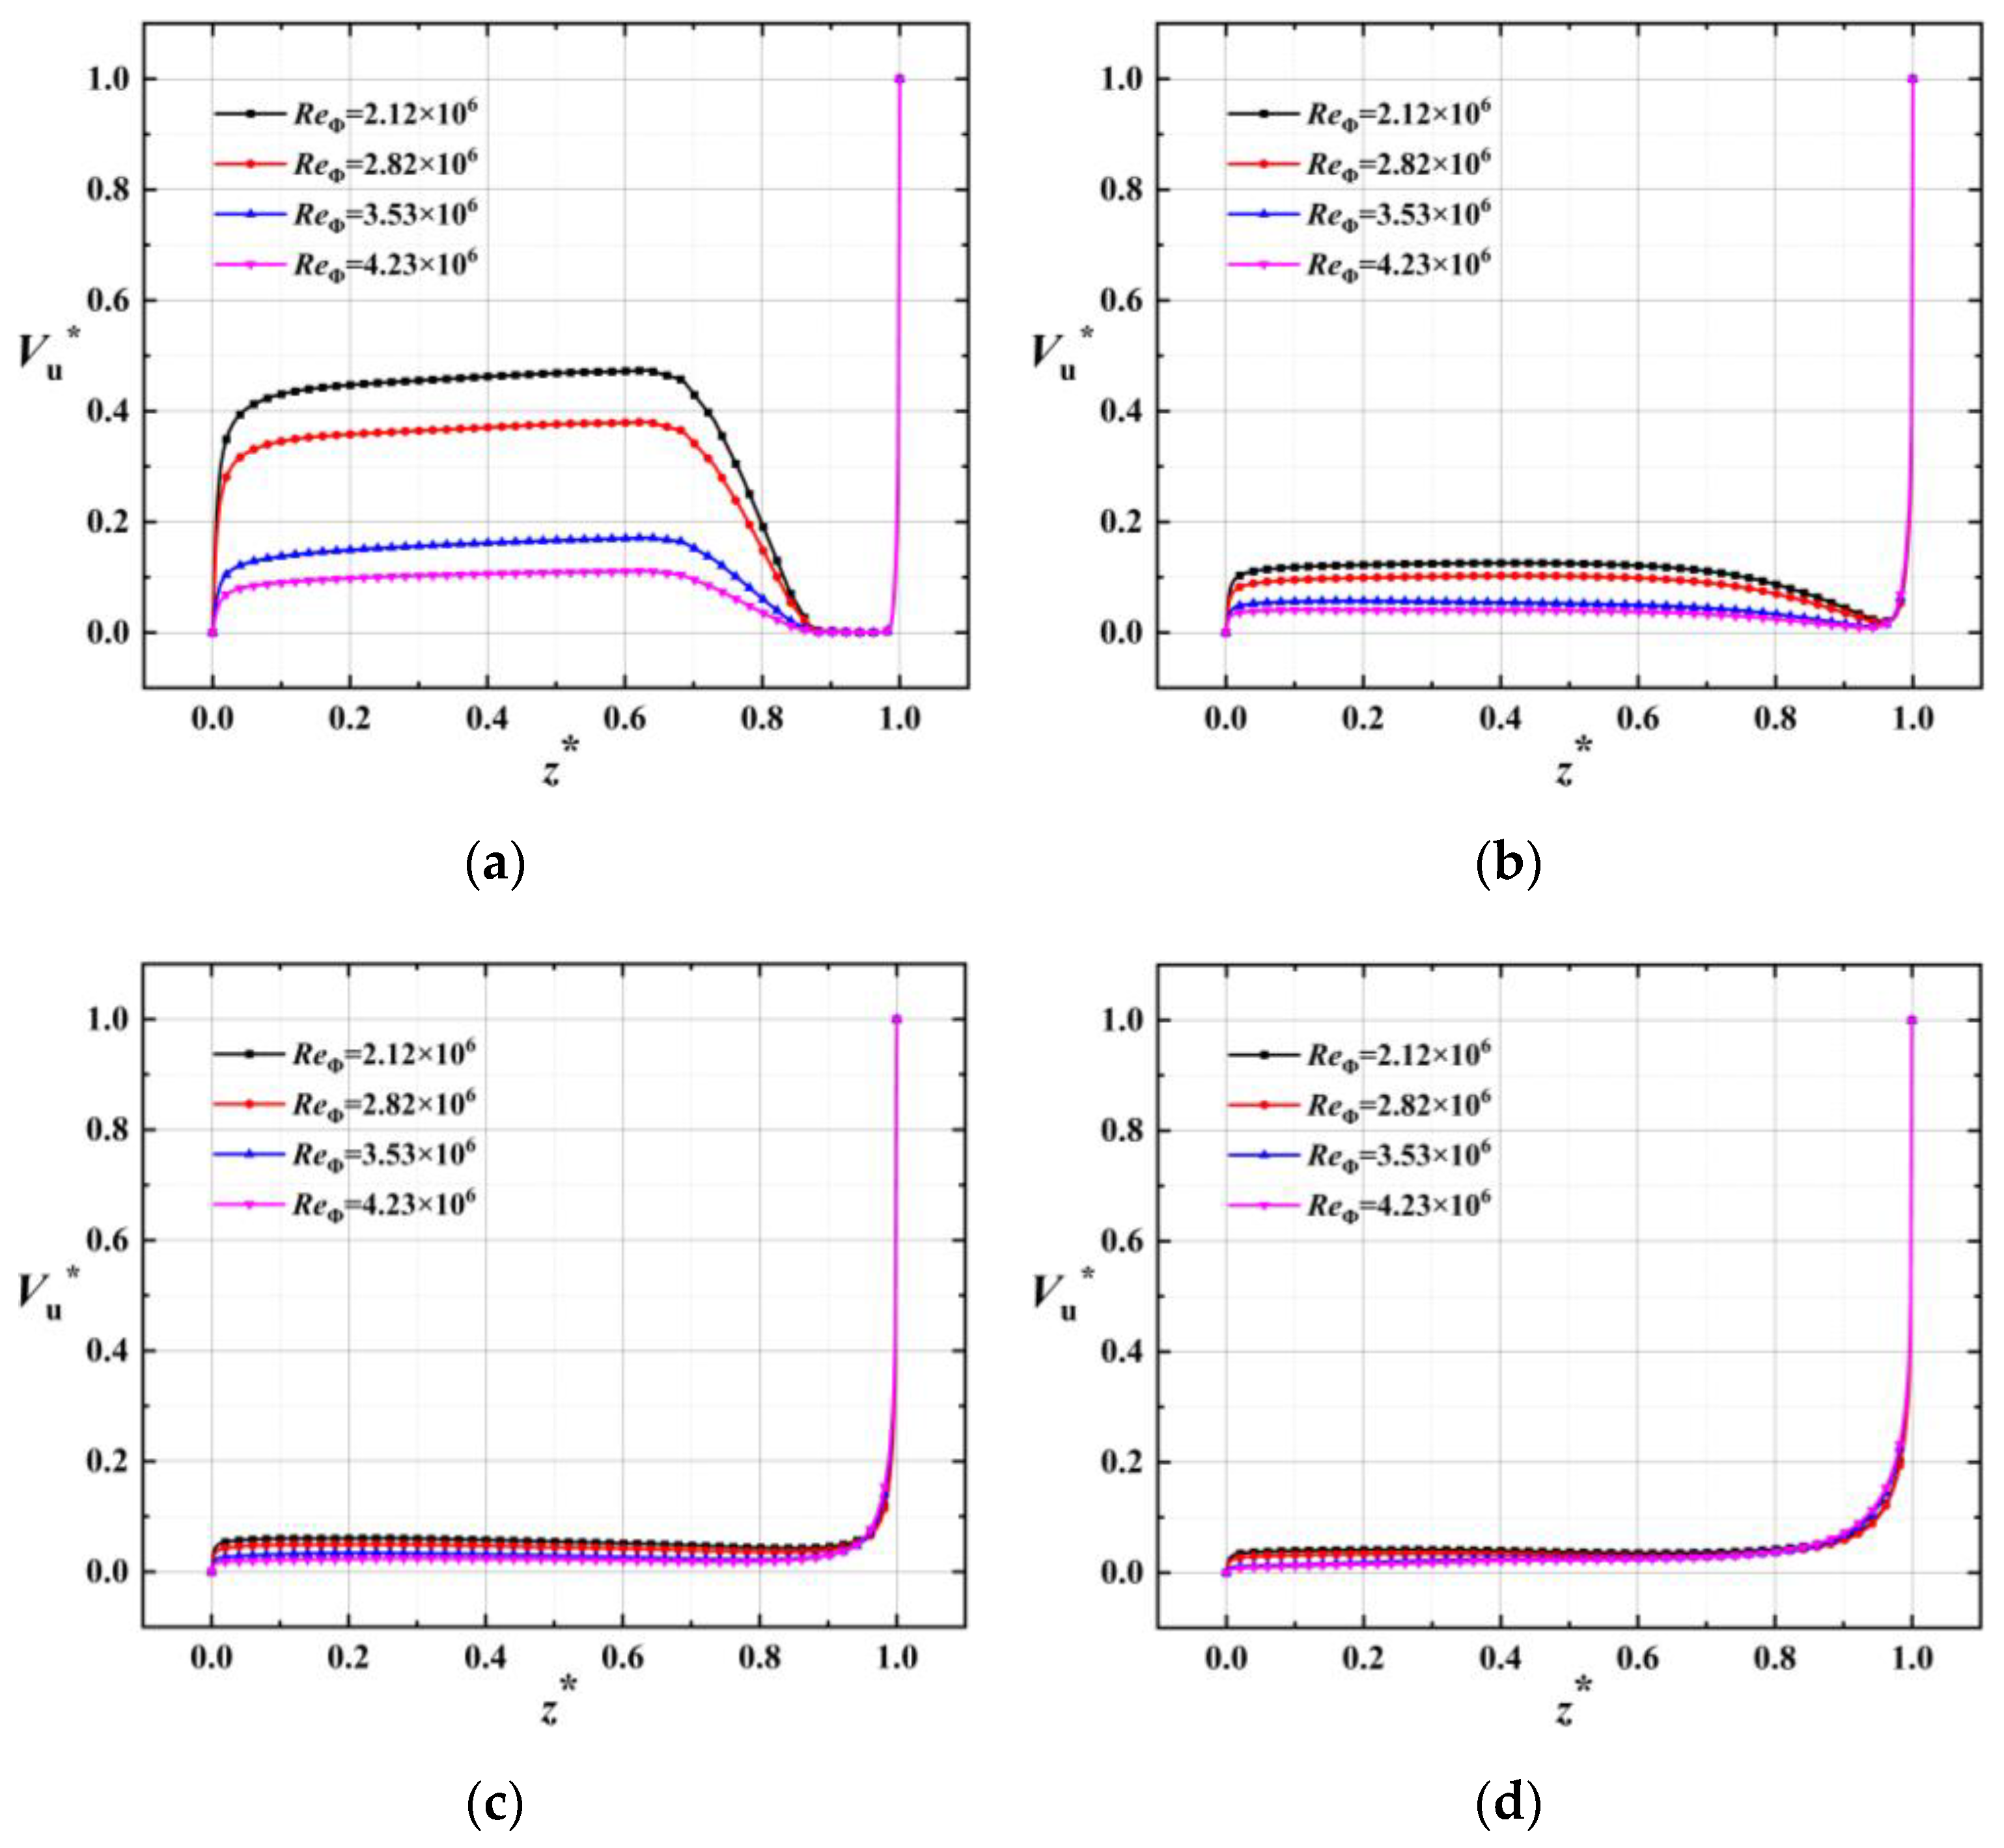
Figure 10 shows the distribution of the circumferential velocity along the axis of the rotor-stator system on the monitoring line. The abscissa indicates the position of a certain point on the line, and the ordinate indicates the circumferential velocity component of the fluid at that point. The abscissa and ordinate are subjected to the following dimensionless processing:
z = z h
V u = V u Ω r
where z is the distance between the point on the monitoring line and the stator wall, h is the length of the monitoring line, Vu is the circumferential velocity of the point on the monitoring line, and r is 1/5r, 2/5r, 3/5r, and 4/5r.
Observing the Vu* distribution on different monitoring lines, when z* < 0.7, the Vu* value order of the different cases does not change with the position of the monitoring line. It always decreases as ReΦ gradually increases, and Vu* in this area shows a monotonous increasing trend. At z* < 0.03, the stator wall and recirculation zone produce a more obvious dimensionless velocity gradient because the Vu* of the fluid near the wall becomes zero at the wall under the action of fluid viscosity and no-slip wall. A thin layer of fluid near the wall of the rotor has the same circumferential velocity as the rotating disc, so a large velocity gradient is generated when 0.95 < z* < 1. As Figure 10a,b show, when z* > 0.7, Vu* begins to decrease because the inertial force of the fluid in the rotor boundary layer plays a leading role in the flow direction, and the circumferential velocity of the fluid in the reflux area under the action of viscous force gradually decreases. A similar situation is not observed in Figure 10c,d. The inertial force of the superimposed flow formed by the main flow and the reflux gradually decreases along the radial direction, and the dynamic and static interference between the rotor and stator dominates the flow in the cavity. Therefore, starting from LA3, the fluid in the rotor boundary layer has a smooth transition between the circumferential velocity and the recirculation zone, and there is no large negative velocity gradient, as in LA1. The axial distribution of Vu* in the rotor-stator system shows a monotonous increasing trend.
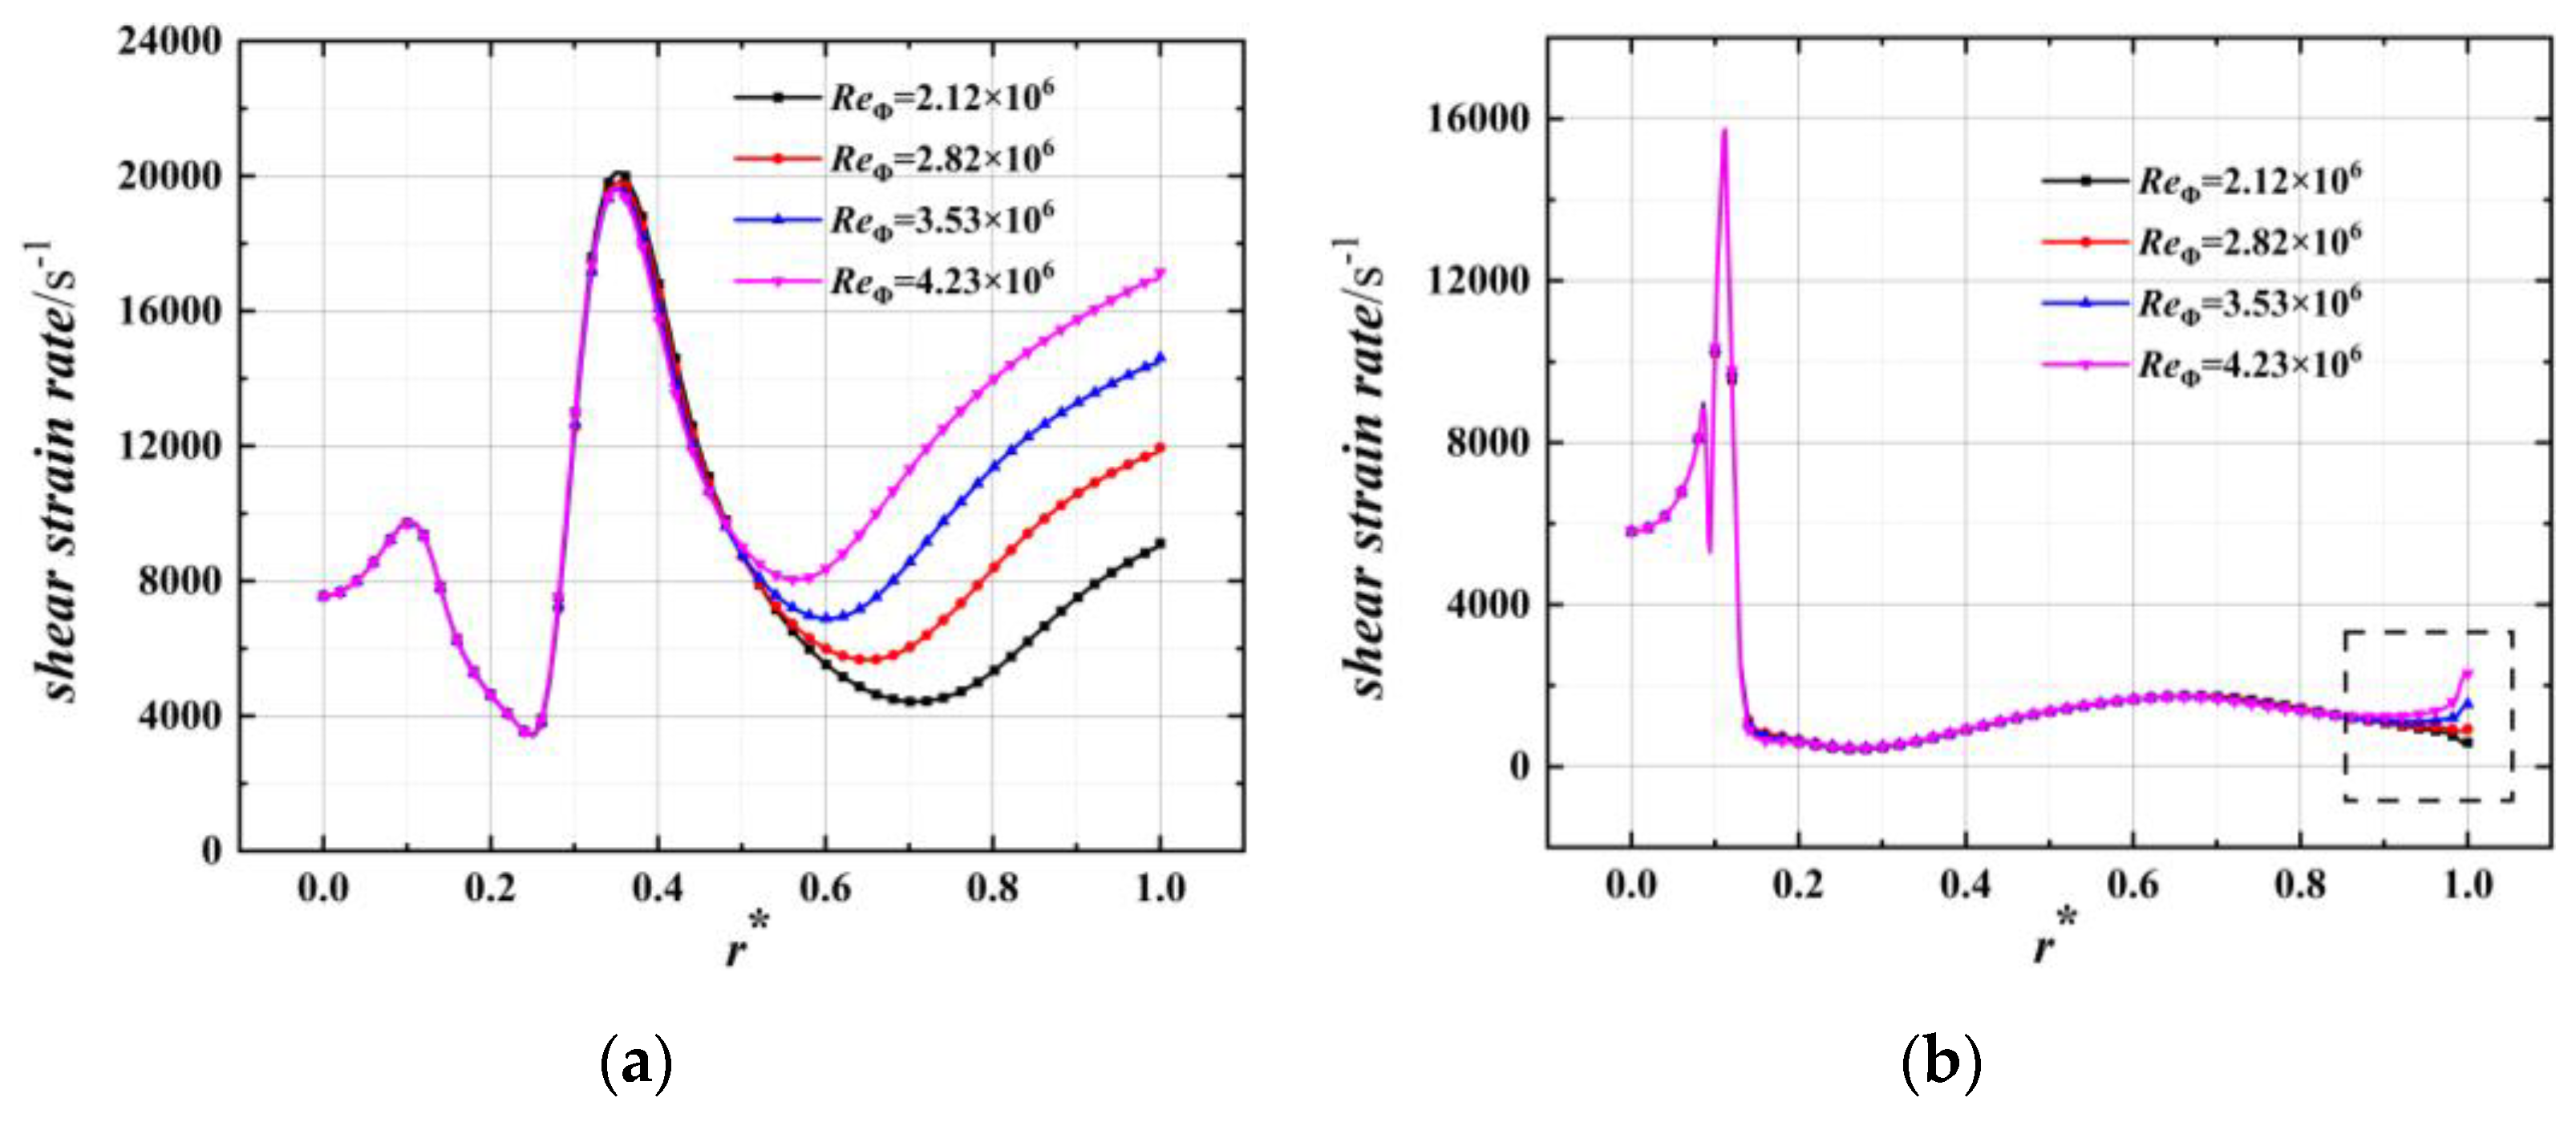
When the fluid is in motion, owing to the adhesion between the fluid and the solid surface and the interaction between the molecules in the fluid, the fluid undergoes shear deformation. The shear strain rate represents the gradient of fluid velocity along the thickness direction of the fluid. The distribution law of the shear strain rate along LRB and LRC of the rotor-stator system cavity under different rotating Reynolds numbers is shown in Figure 11.
Figure 11a reveals that, at the position of r* < 0.48, the shear strain rate in the rotor boundary layer basically does not change with an increase in the rotating Reynolds number. In the boundary layer of the rotor, the maximum peak appears at r* = 0.35. Because the axial flow is squeezed by the main vortex close to the stator, the flow path gradually becomes smaller, and the velocity of the fluid with inertial force reaches a maximum near this point. At r* > 0.48, as the fluid moves in the radial direction, the Vtan generated by the inertial force in the rotor boundary layer gradually decreases. However, the circumferential velocity of the fluid induced by the adhesion of the rotor surface has a gradually increasing influence on the flow in the boundary layer of the rotor, and the shear strain rate under different working conditions is inversely proportional to the rotating Reynolds number. As the figure shows, the flow within ReΦ = 2.12 × 10⁶ to 4.23 × 10⁶ produces a trough at r* = 0.5–0.7. After this point, the rotation in the rotor boundary layer plays a dominant role in the change in the shear strain rate.
The radial variation law of the shear strain rate at the center of the cavity is shown in Figure 11b. The variation trend under different working conditions is almost the same, and wave peaks appear near r* = 0.12. The reason for this peak is the velocity gradient between the fluid in the recirculation zone and the incoming flow from the inlet. In the dashed box near the outlet of the cavity, the shear strain rate of different rotating Reynolds numbers changes regularly, and this position roughly corresponds to the area where the secondary vortex is separated, as shown in Figure 9. The appearance of a vortex in the rotor-stator system cavity shows a trend of first increasing and then decreasing within a certain range on LRC. For example, the position of the main vortex in ReΦ = 2.12 × 10⁶ is r* > 0.25. The box shows that, when ReΦ = 3.53 × 10⁶, the gradient of the shear strain rate approaches zero, so there is a critical rotating Reynolds number that induces the separation of the secondary vortex.

3.3. Reynolds Stress Analysis

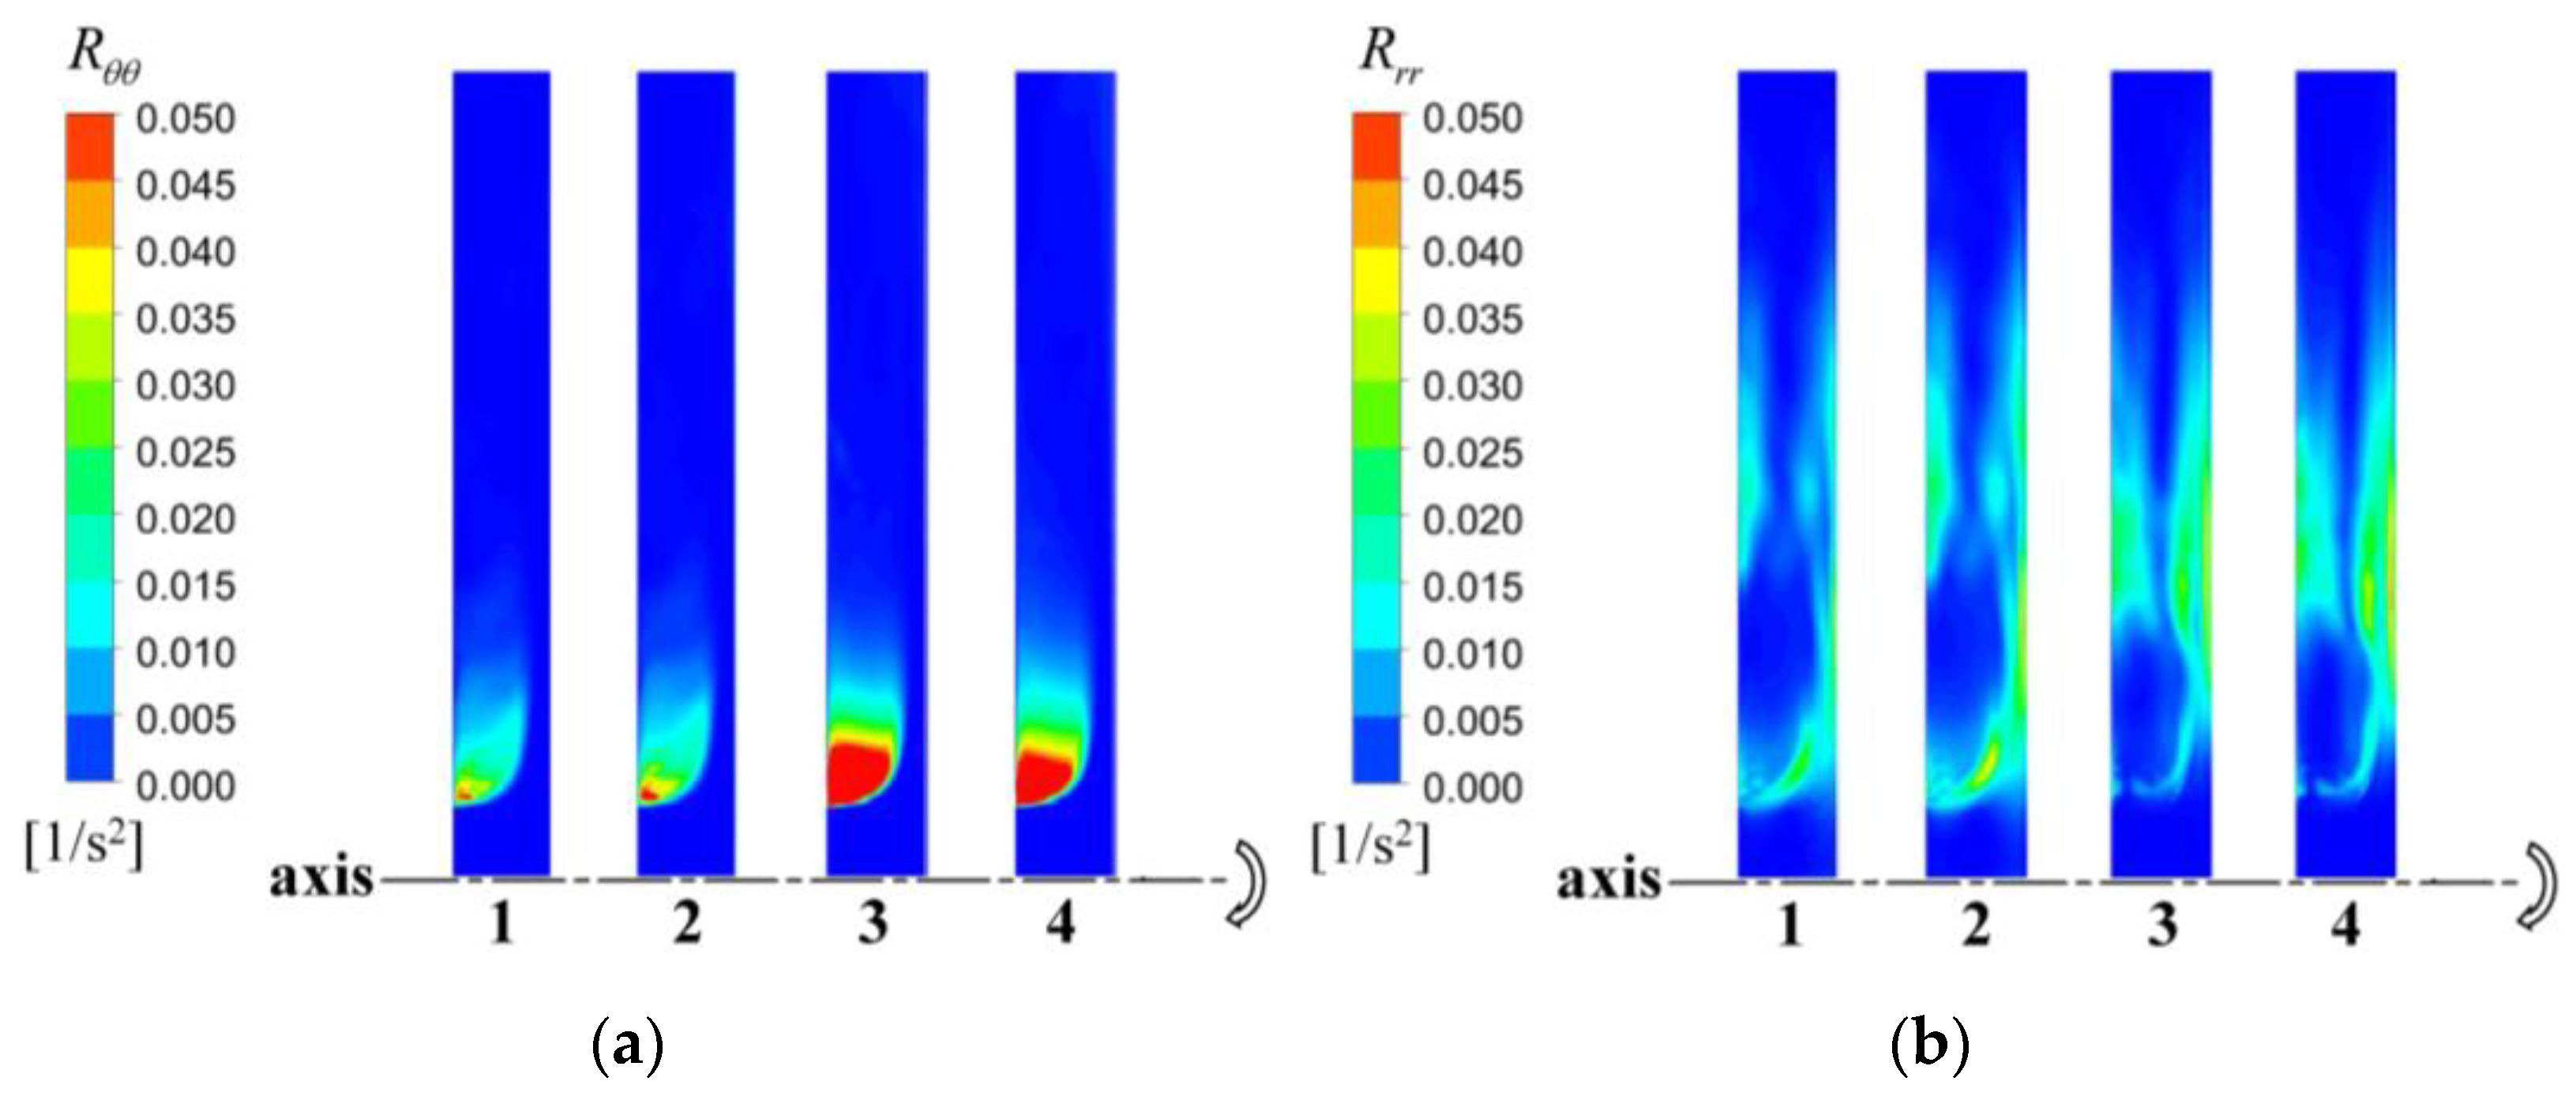
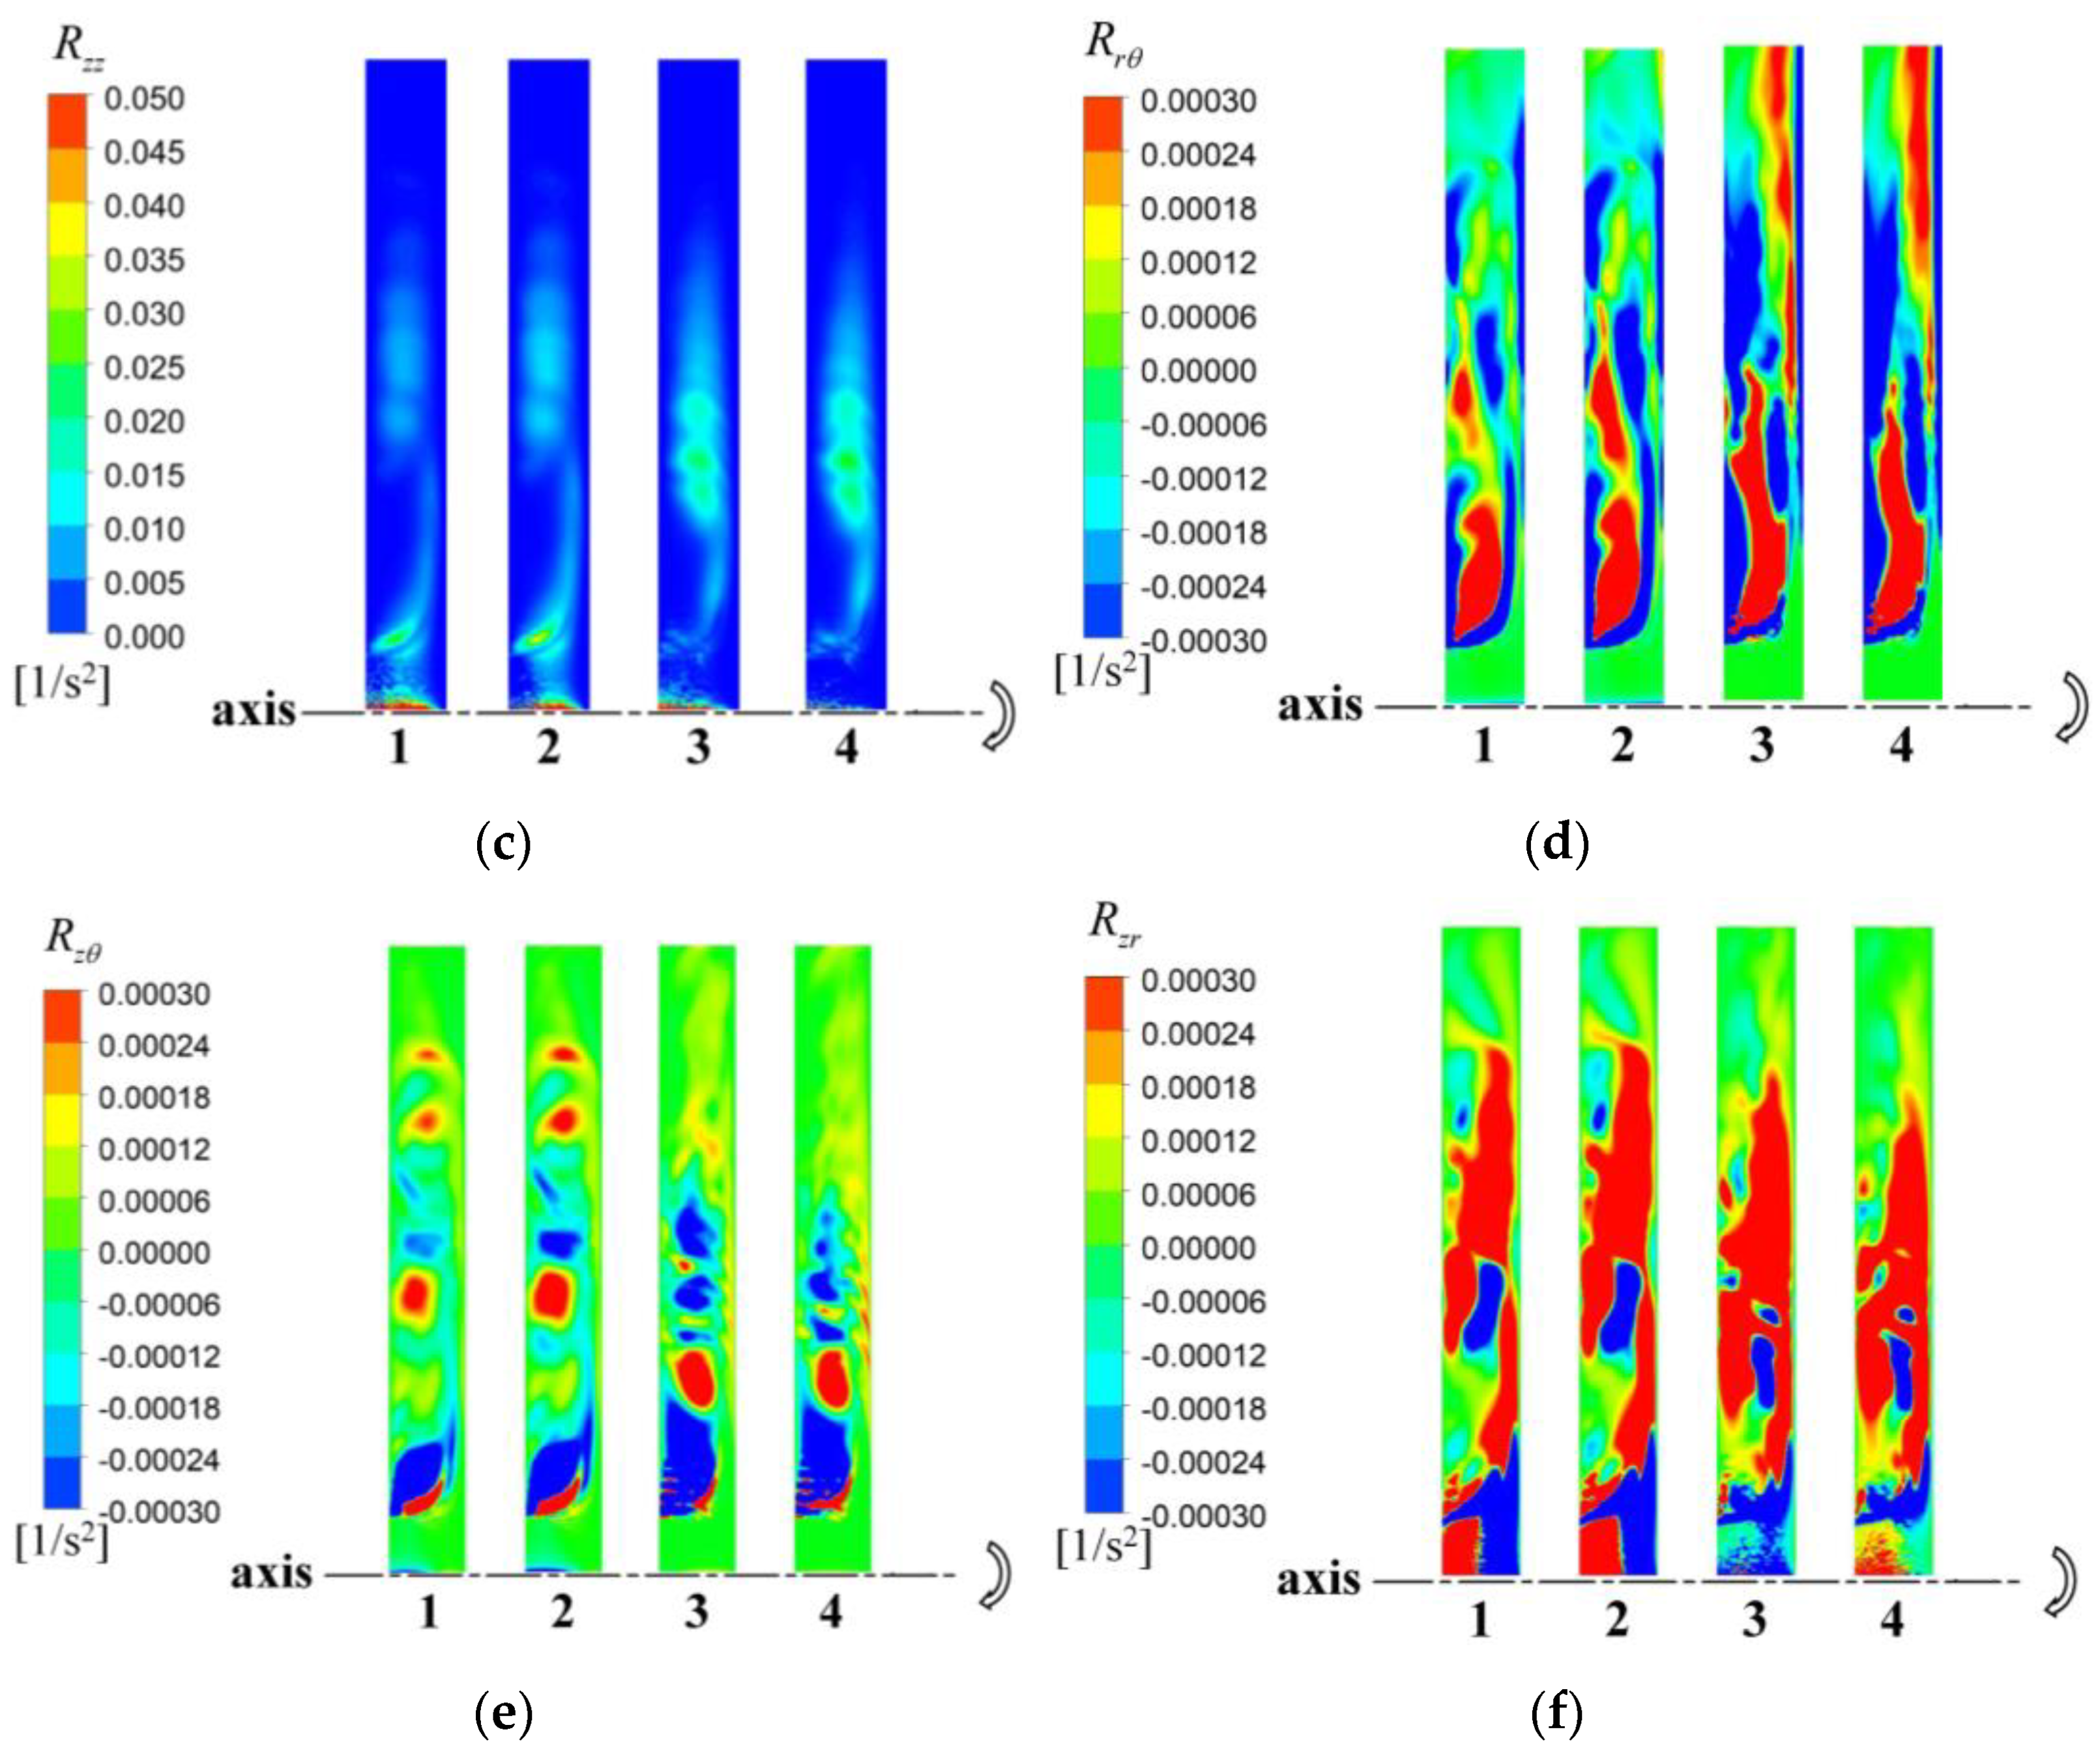
For the stress generated by the turbulent movement of the fluid, in addition to the viscous stress, the Reynolds stress is expressed by a second-order tensor, and the Reynolds stress represents the influence of the turbulent pulsation on the momentum equation. The normal Reynolds stress includes Rθθ, Rrr, and Rzz, and the tangential Reynolds stress includes R, Rzr, and R. According to Darvish and Nejat [30], the r-z-plane Reynolds stress of the rotor-stator cavity is analyzed to study the windage torque of the rotor-stator cavity. It is concluded that R has a significant influence on the wall shear stress; thus, the Reynolds stress, which has a major influence on the torque, is as follows:
R r θ = V r V θ ¯ ( Ω r ) 2
Here, V r V θ ¯ is the momentum in the θ direction transmitted through the unit area of the r-z-plane per unit time. The Reynolds stress distributions of Cases 1, 2, 3, and 4 on the r-z-plane are shown in Figure 12. The sign of the tangential Reynolds stress value represents only the direction and is unrelated to the magnitude.
The contour maps under different working conditions reveal that there are large absolute values of Reynolds stress in different directions at the junction of the axial incoming flow and the return flow. Figure 12d shows that the rotor wall surface under different rotation Reynolds numbers has a large R. The area with a larger tangential Reynolds stress in the turbulent boundary layer is caused by the increase in the rotating speed, which causes the fluid velocity pulsation in the boundary layer to be greater than the area outside the boundary layer. Because Equation (5) only considers the shear stress generated by fluid viscosity, the integral torque is slightly smaller than the rotor torque in the numerical calculation results. Therefore, the place where the tangential Reynolds stress R is larger also has a partial effect on the torque of the rotor.
With an increase in the rotating Reynolds number, the change in the Reynolds normal stress shown in Figure 12 has a certain law. When ReΦ < 3.53 × 10⁶, the area of normal stress concentration is mainly concentrated in the area of r* < 0.12—that is, the position where the axial incoming flow first enters the cavity and the junction of the incoming flow and the return flow. When ReΦ > 3.53 × 10⁶, the Reynolds normal stress is affected by dynamic and static interference and fluid viscosity, and its concentrated area gradually moves into the cavity center.

3.4. Vortex Structure Characteristics

The distribution of the vortex core in the cavity of the rotor-stator system is shown in Figure 13. In this study, the λ-2 method was used to extract the vortex structure on the isosurface. The surface contour map of the vortex structure shows the vorticity, which is used to describe the strength of the vortex. The r-z plane streamline shows that the position of the main vortex in the streamline corresponds to the vortex structure.
There was not much difference in the vortex structure in the cavities of the four cases. The increase in the rotating Reynolds number caused the flow in the cavity affected by the entrainment effect to increase. The cross-sectional area of the main vortex gradually decreased, and the return vortex structure near the outlet increased. The most obvious effect of the rotating speed of the turntable was the vortex in the turbulent boundary layer close to the rotor. When ReΦ = 2.12 × 10⁶, there were fewer vortex cores in the boundary layer, but the strength of the vortex was higher than in the other three cases. As the rotating speed increased, the distribution of vortex cores in the boundary layer gradually became dense, and relatively high-strength vortices were mainly concentrated at the position where the secondary vortex formed. Figure 13 shows that a vortex rope with greater annular strength also appeared at r* = 0.5–0.7 under different working conditions. Its appearance is similar to the position where the shear strain rate in the rotor boundary layer separates, as shown in Figure 11a. As mentioned earlier, after the separation occurs, the flow in the boundary layer changes the radial flow dominated by the inertial force, and the adhesion of the rotor wall to the fluid makes a greater contribution to the fluid in the boundary layer. Therefore, a vortex rope with a higher strength appears at this location.

4. Conclusions

In this study, the clearance inside a fluid machinery was simplified into a rotor-stator system cavity, and the experimental torque was compared with the numerical results. The numerical calculation model was expressed in a cylindrical coordinate system. The rotor ReΦ was gradually increased from 2.12 × 10⁶ to 4.23 × 10⁶, and air with a constant inlet flow rate was selected to flow in from the axial direction and flow out freely in the circumferential direction of the cavity. The main conclusions of this research are as follows:
  • In a rotor-stator system, the torque on the rotor wall is mainly produced by shear stress. With an increase in the Reynolds number, the shear stress on the rotor wall increases, and the torque coefficient Cm decreases.
  • In the range of the rotating Reynolds number selected for calculation, the main vortex separation occurs because of the inertial force of the fluid in the cavity, and the critical rotating Reynolds number at which separation begins is ReΦ = 3.53 × 10⁶.
  • The radial change in the shear strain rate in the rotor turbulent boundary layer is affected by different factors, and there is a turning point at r* = 0.5–0.7. At this point, the change in the shear strain rate is transformed from the leading role of the inertial force of the inlet flow to the leading role of the rotor rotation on the fluid adhesion.
  • The order of torque on the rotor under different rotating Reynolds numbers is as follows: Case 4 > Case 3 > Case 2 > Case 1. In addition to fluid adhesion, the Reynolds stress also contributes partly to the rotor wall torque.
  • The vortex structure of the rotor-stator system cavity mainly includes the main vortex, return vortex, secondary vortex, and vortex in the turbulent boundary layer. With an increase in the rotating Reynolds number, the intensity of the vortex in the turbulent boundary layer decreases, but the number of vortex cores increases.

Author Contributions

Conceptualization, Y.J. and W.S.; methodology, Z.Z.; software, Z.Z.; validation, J.L. and W.S.; formal analysis, Y.J.; investigation, W.S.; resources, Y.J.; data curation, Z.Z.; writing—original draft preparation, Y.J.; writing—review and editing, Z.Z.; visualization, W.S.; supervision, W.S.; project administration, W.S.; funding acquisition, Y.J. and J.L. All authors have read and agreed to the published version of the manuscript.

Funding

This work was supported by the Natural Science Foundation of China (Grant No. 52009115), the Open Research Subject of Key Laboratory of Fluid and Power Machinery (Xihua University), Ministry of Education (Grant No. LTDL2021-003), and the Talent Fund of Xihua University (Grant No. Z212007).

Institutional Review Board Statement

Not applicable.

Informed Consent Statement

Not applicable.

Data Availability Statement

The study does not report any data.

Acknowledgments

The authors express their gratitude and appreciation to Luo et al. for providing available data needed to carry out this research project.

Conflicts of Interest

The authors declare no conflict of interest.

References

  1. Faller, A.J. An experimental study of the instability of the laminar Ekman boundary layer. J. Fluid Mech. 1963, 15, 560. [Google Scholar] [CrossRef]
  2. Bayley, F.J.; Owen, J.M. Flow between a Rotating and a Stationary Disc. Aeronaut. Q. 1969, 20, 333–354. [Google Scholar] [CrossRef]
  3. Owen, J.M. Flow and Heat Transfer in Rotating-Disc Systems; John Wiley Sons Inc.: New York, NY, USA, 1989; Volume 90, pp. 81–103. [Google Scholar] [CrossRef]
  4. Serre, E.; Del Arco, E.C.; Bontoux, P. Annular and spiral patterns in flows between rotating and stationary discs. J. Fluid Mech. 2001, 434, 65–100. [Google Scholar] [CrossRef]
  5. Amirante, D.; Hills, N.J. Large-Eddy Simulations of Wall Bounded Turbulent Flows Using Unstructured Linear Reconstruction Techniques. J. Turbomach. 2015, 137, 051006. [Google Scholar] [CrossRef]
  6. Yim, E.; Chomaz, J.M.; Martinand, D.; Serre, E. Transition to turbulence in the rotating disk boundary layer of a rotor–stator cavity. J. Fluid Mech. 2018, 848, 631–647. [Google Scholar] [CrossRef]
  7. Appelquist, E.; Schlatter, P.; Alfredsson, P.H.; Lingwood, R.J. Global linear instability of the rotating-disk flow investigated through simulations. J. Fluid Mech. 2015, 765, 612–631. [Google Scholar] [CrossRef]
  8. Appelquist, E.; Schlatter, P.; Alfredsson, P.H.; Lingwood, R.J. On the global nonlinear instability of the rotating-disk flow over a finite domain. J. Fluid Mech. 2016, 803, 332–355. [Google Scholar] [CrossRef] [Green Version]
  9. Oguic, R.; Poncet, S.; Viazzo, S. High-Order Direct numerical simulations of a turbulent round impinging jet onto a rotating heated disk in a highly confined cavity. Int. J. Heat Fluid Flow 2016, 61, 366–378. [Google Scholar] [CrossRef]
  10. Davies, C.; Thomas, C.; Carpenter, P.W. Global stability of the rotating-disk boundary layer. J. Eng. Math. 2007, 57, 219–236. [Google Scholar] [CrossRef]
  11. Pitz, D.B.; Chew, J.W.; Marxen, O.; Hills, N.J. Direct Numerical Simulation of Rotating Cavity Flows Using a Spectral Element-Fourier Method. J. Eng. Gas. Turbines Power-Trans. ASME 2017, 139, 10. [Google Scholar] [CrossRef] [Green Version]
  12. Darvish Damavandi, M.; Nejat, A. Numerical investigation of fluid flow in a rotor–stator cavity with curved rotor disk. J. Braz. Soc. Mech. Sci. Eng. 2018, 40, 180. [Google Scholar] [CrossRef]
  13. Luo, X.; Han, G.; Wu, H.; Wang, L.; Xu, G. Experimental investigation of pressure loss and heat transfer in a rotor–stator cavity with two outlets. Int. J. Heat Mass Transf. 2014, 78, 311–320. [Google Scholar] [CrossRef]
  14. Healey, J.J. Model for unstable global modes in the rotating-disk boundary layer. J. Fluid Mech. 2010, 663, 148–159. [Google Scholar] [CrossRef]
  15. Geis, T.; Ebner, J.; Kim, S.; Wittig, S. Flow Structures Inside a Rotor-Stator Cavity. Int. J. Rotating Mach. 2014, 7, 285–300. [Google Scholar] [CrossRef] [Green Version]
  16. Poncet, S.; Chauve, M.P.; Schiestel, R. Batchelor versus Stewartson flow structures in a rotor-stator cavity with throughflow. Phys. Fluids 2005, 17, 253–668. [Google Scholar] [CrossRef]
  17. Makino, S.; Inagaki, M.; Nakagawa, M. Laminar-Turbulence Transition over the Rotor Disk in an Enclosed Rotor-Stator Cavity. Flow Turbul. Combust. 2015, 95, 399–413. [Google Scholar] [CrossRef]
  18. Abadi, A.M.E.; Sadi, M.; Farzaneh-Gord, M.; Ahmadi, M.H.; Chau, K.W. A numerical and experimental study on the energy efficiency of a regenerative Heat and Mass Exchanger utilizing the counter-flow Maisotsenko cycle. Eng. Appl. Comput. Fluid Mech. 2020, 14, 1–12. [Google Scholar] [CrossRef] [Green Version]
  19. Gu, Y.; Pei, J.; Yuan, S.; Zhang, J. A Pressure Model for Open Rotor–Stator Cavities: An Application to an Adjustable-Speed Centrifugal Pump With Experimental Validation. J. Fluids Eng. 2020, 142, 101301. [Google Scholar] [CrossRef]
  20. Ghalandari, M.; Bornassi, S.; Shamshirband, S.; Mosavi, A.; Chau, K.W. Investigation of submerged structures’ flexibility on sloshing frequency using a boundary element method and finite element analysis. Eng. Appl. Comput. Fluid Mech. 2019, 13, 519–528. [Google Scholar] [CrossRef]
  21. Wang, C.; Zeng, Y.; Yao, Z.; Wang, F. Rigid vorticity transport equation and its application to vortical structure evolution analysis in hydro-energy machinery. Eng. Appl. Comput. Fluid Mech. 2021, 15, 1016–1033. [Google Scholar] [CrossRef]
  22. Yuan, C.; Zhu, L.; Du, Z.; Liu, S. Numerical investigation into the cavitating jet inside water poppet valves with varied valve seat structures. Eng. Appl. Comput. Fluid Mech. 2021, 15, 391–412. [Google Scholar] [CrossRef]
  23. Jiao, Z.; Fu, S. Investigations of an enclosed annular rotor-stator system with LES method. Sci. China Phys. Mech. Astron. 2018, 61, 54–64. [Google Scholar] [CrossRef]
  24. Luo, X.; Zhang, D.; Xu, G.Q. Experimental study on windage torque in unshrouded rotor-stator system with central inflow. Tuijin Jishu/J. Propuls. Technol. 2015, 36, 1199–1205. [Google Scholar] [CrossRef]
  25. Roache, P.J. Quantification of uncertainty in computational fluid dynamics. Annu. Rev. Fluid Mech. 1997, 29, 123–160. [Google Scholar] [CrossRef] [Green Version]
  26. Blocken, B.; Stathopoulos, T.; Carmeliet, J. CFD simulation of the atmospheric boundary layer: Wall function problems. Atmos. Environ. 2007, 41, 238–252. [Google Scholar] [CrossRef]
  27. Menter, F.R.; Egorov, Y. The Scale-Adaptive Simulation Method for Unsteady Turbulent Flow Predictions. Part 1: Theory and Model Description. Flow Turbul. Combust. 2010, 85, 113–138. [Google Scholar] [CrossRef]
  28. Menter, F.R. Two-equation eddy-viscosity turbulence models for engineering applications. Aiaa J. 1994, 32, 1598–1605. [Google Scholar] [CrossRef] [Green Version]
  29. Mulu, B.G.; Cervantes, M.J.; Devals, C.; Vu, T.C.; Guibault, F. Simulation-based investigation of unsteady flow in near-hub region of a Kaplan Turbine with experimental comparison. Eng. Appl. Comput. Fluid Mech. 2015, 9, 139–156. [Google Scholar] [CrossRef] [Green Version]
  30. Darvish Damavandi, M.; Nejat, A. Flow Characteristics of Curved Rotor Stator Systems Using Large Eddy Simulation. Flow Turbul. Combust. 2019, 103, 111–140. [Google Scholar] [CrossRef]
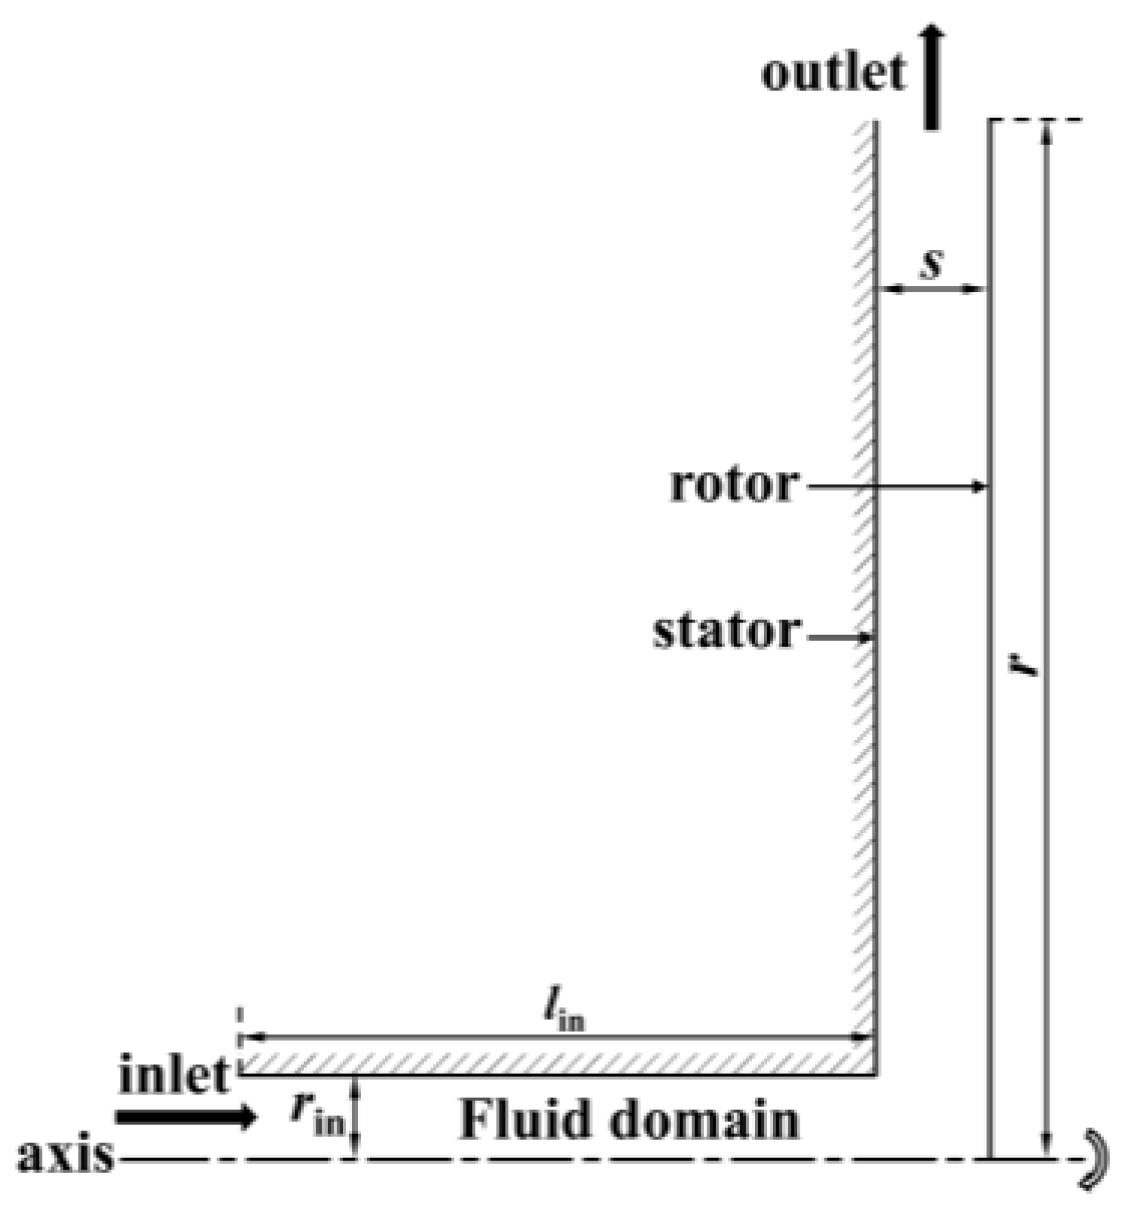
Figure 1. Physical model.
Applsci 11 11000 g001
Figure 2. Grid of computational domain.
Applsci 11 11000 g002
Figure 3. Verification of grid independence.
Applsci 11 11000 g003
Figure 4. Contour of y+ value.
Applsci 11 11000 g004
Figure 5. Comparison of turbulence models and experiment.
Applsci 11 11000 g005
Figure 6. Location diagram of monitoring lines.
Applsci 11 11000 g006
Figure 7. Distribution of wall shear stress on LR.
Applsci 11 11000 g007
Figure 8. Radial distribution of torque coefficient.
Applsci 11 11000 g008
Figure 9. Flow structure with increasing ReΦ.
Applsci 11 11000 g009
Figure 10. Distribution of circumferential velocity (a) monitoring line of LA1; (b) monitoring line of LA2; (c) monitoring line of LA3; (d) monitoring line of LA4.
Applsci 11 11000 g010
Figure 11. Distribution of shear strain rate (a) monitoring line of LRB; (b) monitoring line of LRC.
Applsci 11 11000 g011
Figure 12. Contour maps of Reynolds stress in the r-z plane (a) Reynolds normal stress Rθθ; (b) Reynolds normal stress Rrr; (c) Reynolds normal stress Rzz; (d) Reynolds shear stress R; (e) Reynolds shear stress Rzr; (f) Reynolds shear stress R.
Applsci 11 11000 g012aApplsci 11 11000 g012b
Figure 13. Vortex structure in cavity.
Applsci 11 11000 g013
Table 1. Main parameters for different meshes.
ComponentTotal ElementsMin Angle (°)Max Aspect RatioQuality (3 × 3 × 3)GCI (%)
11.78 × 10645190.689.30
23.14 × 10645640.653.26
35.94 × 106453490.581.84
47.68 × 106455580.491.67
Table 2. Dimensionless parameters.
CaseGReΦ/106Cw/104
10.122.123.41
20.122.823.41
30.123.533.41
40.124.233.41
Publisher’s Note: MDPI stays neutral with regard to jurisdictional claims in published maps and institutional affiliations.