Abstract
In medical image processing, magnetic resonance imaging (MRI) and computed tomography (CT) modalities are widely used to extract soft and hard tissue information, respectively. However, with the help of a single modality, it is very challenging to extract the required pathological features to identify suspicious tissue details. Several medical image fusion methods have attempted to combine complementary information from MRI and CT to address the issue mentioned earlier over the past few decades. However, existing methods have their advantages and drawbacks. In this work, we propose a new multimodal medical image fusion approach based on variational mode decomposition (VMD) and local energy maxima (LEM). With the help of VMD, we decompose source images into several intrinsic mode functions (IMFs) to effectively extract edge details by avoiding boundary distortions. LEM is employed to carefully combine the IMFs based on the local information, which plays a crucial role in the fused image quality by preserving the appropriate spatial information. The proposed method’s performance is evaluated using various subjective and objective measures. The experimental analysis shows that the proposed method gives promising results compared to other existing and well-received fusion methods.
1. Introduction
Medical image analysis plays a crucial role in clinical assessment. However, the success rate of the diagnosis depends upon the visual quality and the information present in medical images [1]. In real-world medical imaging, denoising [2,3] or texture information processing [4,5] is a necessary preprocessing step to improve the fused image’s visual quality further.
Nowadays, several imaging modalities are available to capture specific medical information of a given organ [6,7,8]. X-ray, MRI, CT, positron emission tomography (PET), and single-photon emission computed tomography (SPECT) of a human brain displayed in Figure 1 are crucial medical imaging modalities among them. For example, the magnetic resonance imaging (MRI) modality captures the anatomical information of the soft tissue. In contrast, computed tomography (CT) significantly provides hard tissue information such as bones structures and tumors [8]. Moreover, for clinical needs, the information provided by a single modality may not be sufficient, especially during the diagnosis of diseases [9]. The image fusion mechanism can effectively address this problem, enhancing the information by combining the complementary details provided by two or more modalities into a single image.
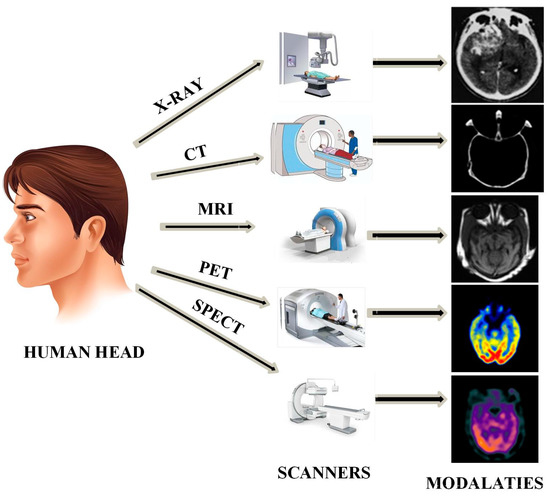
Figure 1.
Illustration of the classification of different medical brain imaging modalities.
Image fusion can be categorized into spatial and transform domain techniques [10]. In spatial domain methods, the fusion takes place between the pixels of the source images directly. The maximum, minimum, average, weighted average and PCA are examples of the spatial domain fusion methods, which are easy to implement and computationally efficient. Direct pixel-based fusion methods use a weighted pixel of input images to form a fused image [11]. The activity level of the pixels determines these weights. In the literature, various machine learning methods such as neural networks and support vector machines (SVM) are also used to select the pixels with the highest activity [12,13]. In [14], an iterative block-level fusion method is proposed. First, the source images are decomposed into small square blocks, and PCA is computed on those blocks. Next, weights are found using the average of the PCA components. Finally, a maximum average mutual information fusion rule is employed for the final blending of input images. In [15], a pixel-level image fusion method is proposed using PCA. Here, the first PCA components from both the input images are multiplied individually, and those weighted images are added for fusion. However, these methods might exhibit spatial color, information loss, and brightness distortions [16,17].
Image fusion methods based on the transform domain techniques are receiving much consideration [18]. Pyramid [19], wavelet [20], and multi-resolution singular value decomposition (MSVD) are examples of traditional methods [21] in this category. However, transform domain fusion methods have a few drawbacks [18]. For example, most pyramid methods suffer from blocking artifacts and a loss of source information, even producing artifacts around edges [22]. Wavelets suffer shift sensitivity, poor directionality, an absence of phase information, poor performance at edges and texture regions, and produce artifacts around edges because of the shift-variant nature [22]. Despite the reliable quantification results, MSVD fusion methods might result in poor visual quality [23].
To address the issues mentioned above, other transform domain fusion techniques such as À Trous wavelet transform (ATWT), curvelet transform (CVT), and ridgelet transform are suggested in [24]. These methods provide better results concerning the visual aspect, preserving spatial and spectral information. Nevertheless, these techniques suffer from artifacts around the edges in the fused image [25].
In [26], a new pixel-level image fusion approach using convolutional sparsity-based morphological component analysis (CS-MCA) is introduced. This method achieves sparse representation by combining MCA and sparse convolutional representation into the unified optimization method. This approach might suffer from a spatial consistency problem, resulting in the degradation of spatial details [27]. An NSST-based fusion scheme is proposed in [28].This approach used a blend of NSST with weighted local energy (WLE) and a weighted sum of eight- neighborhood-based modified Laplacian (WSEML) to integrate MRI and CT images. However, this method is a non-adaptive approach. A summary of different types of image fusion methods, their advantages and drawbacks are tabulated in Table 1.

Table 1.
Brief summary of the image fusion methods.
An adaptive transform-domain fusion technique might provide a better solution to the challenges mentioned above. In these fusion approaches, the basis function of the transform technique depends on the source image’s characteristics. With the help of adaptive wavelets, the image’s crucial features can be highlighted, which helps in the fusion process. Hence, adaptive wavelets turned out to be a preferable representation compared to standard wavelets. Similar works based on VMD decomposition-based techniques can be found in [35,36]. However, this paper proposes a new adaptive multimodal image fusion strategy based on the combination of variational mode decomposition (VMD) and local energy maxima (LEM) to address the challenges mentioned above. The highlights of the proposed method are as follows:
1. VMD is an adaptive decomposition scheme that decomposes the images as band-limited sub-bands called intrinsic mode functions (IMFs) without introducing boundary distortions and mode-mixing problems. Indeed, the band-limited sub-bands characterize the edge and line features of source images. This decomposition technique can effectively extract the image features from the other transform methods such as wavelet transform (WT), bi-dimensional empirical mode decomposition (BEMD), and empirical wavelet transform (EWT);
2. The LEM fusion rule extracts the local information from decomposed modes corresponding to two source images pixel by pixel using a windowing operation (3 × 3) and then measures the maximum information value. Hence, using the LEM fusion rule, we can preserve the required complementary visual, edge, and texture information in the IMFs;
3. The proposed approach aims to preserve the information and details of both MRI and CT images into the fused image using VMD and LEM. From visual perception and objective assessment of the fusion results, it is evident that our new image fusion method accomplishes good performance over other existing fusion methods.
The remainder of the paper is arranged as follows: The proposed framework and its mathematical representation are presented in Section 2. The detailed analysis of the simulation results and necessary discussion is presented in Section 3. A final note on the proposed method and future directions is given in Section 4.
2. Proposed Methodology
Our proposed work aims to integrate the details of the soft tissue and dense bone structure provided by MRI and CT medical imaging technologies into a unique image. For this, we have proposed a multimodal medical image fusion based on a blend of VMD and LEM, as shown in Figure 2.
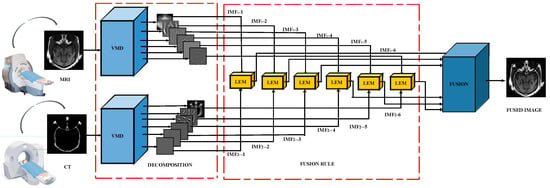
Figure 2.
Proposed MRI-CT medical image fusion scheme.
The main steps involved in our fusion methodology are:
- VMD-based image decomposition;
- A fusion strategy depending on the LEM;
- Synthesizing the fused image.
A. VMD-Based Image Decomposition
The traditional decomposition approaches, such as wavelets [37,38], BEMD [39], and EWT [40], suffer from various problems such as boundary distortions and mode-mixing. With these issues, we may fail to achieve an appropriate fusion result. To address these problems, we employed VMD [41], a robust adaptive decomposition approach, highlighting meaningful details in the form of sub-images.
The VMD finds applications in image denoising [42] and texture decomposition [43]. VMD is a non-stationary and adaptive signal processing technique. Unlike EMD and its variants, VMD is not a recursive analysis approach, and it decomposes the signal/image into bandlimited sub-bands based on its frequency content. This work uses VMD to obtain distinct and significant IMFs from the source images (MRI and CT). The derived IMFs reduce mode-mixing and boundary distortions, which are the major concerns in the above mentioned transform domain methods. With this VMD decomposition, we can extract prominent edge information. Initially, we decomposed the input images into six IMFs, which are illustrated in Figure 3.
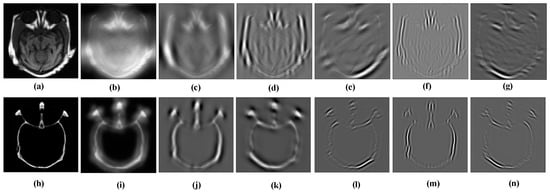
Figure 3.
IMFs obtained after VMD decomposition: (a) MRI image, (b) and (c–g) are approximation and detail images of (a), respectively. (h) CT image, (i) and (j–n) are approximation and detail images of (h), respectively.
From Figure 3, it can be observed that the first IMF ((b) and (i)) captures prominent information from the source images, whereas the remaining IMFs encompass the line and edge information. We can note from Figure 3 that as the mode number increases, the visual details are not significant.
Mathematical Details of VMD:
The main goal of VMD is to subdivide an input signal () into a specific number of sub-bands (IMFs or Modes) (), and each sub-band is bandlimited to specific frequencies in the spectral domain (Fourier domain) by maintaining sparsity. Each of the sub-bands is bandlimited to its center frequencies. VMD involves the following steps to get the bandlimited sub-bands [41]:
1. For each sub-band, its analytical counterpart needs to be computed using Hilbert transform to get the one-sided frequency spectrum;
2. An exponential is used to mix with each mode to shift its frequency spectrum to the baseband;
3. Finally, the bandwidth of the mode estimates using the squared L2-norm of the gradient. The constrained variational problem can be represented as below.
where indicates the sub-band and its center frequency, respectively. represents the Dirac distribution, is the symbol of the convolution.
The constrained problem in Equation (1) is solved using the quadratic penalty term and Lagrangian multipliers to make it an unconstrained problem given in Equation (2).
where represents augmented Lagrange matrix function, is the penalty factor parameter, indicates the Lagrange multiplier, and is the input signal.
Now the solution of Equation (1) can be computed as the saddle point of Equation (2) using the method called an alternating direction method of multipliers (ADMM).
Equation (3) can be further solved using an alternating direction method of multipliers (ADMM) [41]. Finally, the estimate of the sub-band is computed as [44]:
Similarly, the center frequency is updated as:
In this work, we used the two-dimensional (2D)-VMD [45] method to decompose the MRI and CT images. As stated above, 2D-VMD is a helpful method in extracting useful information such as edges and curves from the source images. Furthermore, VMD is a reliable method to deal with noisy images. Therefore, it can improve the quality of the fusion process even without employing additional preprocessing techniques.
B. Fusion Strategy Depending on LEM
As discussed before, the VMD adaptively decomposes the input images into bandlimited sub-bands called IMFs. Indeed, these IMFs characterize the image features of source images. To highlight and extract relevant features in the fused image, we require appropriate fusion rules. As discussed in Section 1, many fusion rules [46], such as minima, maxima, averaging, and PCA, have been widely explored for this purpose over the past few years. Among them, minima and maxima cause brightness distortions, averaging rule blurs the fused image, and PCA degrades the spectral information [15]. Furthermore, the fusion rules mentioned above may produce low spatial resolution issues [47]. The LEM-based [47] fusion rule is adopted to tackle the issues discussed above in this work.
We have demonstrated the influence of these fusion rules visually in Figure 4 and quantitatively in Table 2. As shown in Figure 4, the VMD with LEM fusion rule achieves visually satisfying results compared to VMD with other fusion rules. Similarly, as shown in Table 2, the fusion metric values calculated over 10 data sets proved the efficacy of the chosen LEM fusion rule.
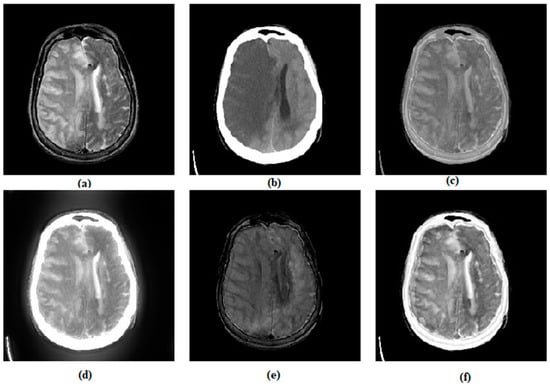
Figure 4.
Visual quality analysis of various fusion rules on MRI-CT image pair. (a) MRI image, (b) CT image, (c) VMD-AVG, (d) VMD-MAX, (e) VMD-MIN (f) VMD-LEM.

Table 2.
Average quantitative analysis of various fusion rules on 10 pairs of MRI-CT images.
The technical details of the LEM fusion rule are discussed as follows. The principal idea behind using LEM is to extract and preserve vital information with the help of local information constraints from both the images pixel by pixel [47]. The entire process of LEM is described in Algorithm 1.
| Algorithm 1 |
is evaluated using the following steps. . . |
C. Synthesizing the Fused Image
We linearly combine all the enhanced IMFs obtained from each LEM fusion rule to construct the fused image. The whole process of the proposed fusion framework is given in Algorithm 2.
| Algorithm 2 |
| Input: Image A (MRI), Image B (CT). Output: The fused image F. Step 1: Image decomposition using VMD: which are represented as using Equation (5). by Equation (6). with Equations (7) and (8). using Equation (9). Step 3: Reconstruct the fused image by summing all the fused sub-bands obtained from Step 2. |
D. Image Fusion Evaluation Metrics
In this paper, we used a few state-of-the-art image fusion metrics to estimate the information contribution of each source image in the fusion process. They are edge intensity (EI) [48], mutual information (MI) [49], visual information fidelity (VIF) [50,51], edge-based similarity measure () [52], structural similarity index measure (SSIM) [51,53], average gradient (AG) [54], root mean square error (RMSE) [15], peak signal-to-noise ratio (PSNR) [13,42]. EI represents the difference of luminance along the gradient direction in images. MI is used to measure the relative information between the source and the fused images. VIF estimates the visual information fidelity between the fused and source images depending on the Gaussian mixture model. The edge-based similarity () measure will be useful to provide the edge details in the fused image. RMSE computes a difference measure between the reference image and fused image. In this work, the maximum value of RMSE of MRI-fused images and CT-fused images is considered. Similarly, PSNR is also computed. Except for RMSE, the higher values of all these metrics imply better fusion. In the case of the RMSE, the lowest value yields a better result.
3. Results and Discussion
This section presents the experimental setup, results and analysis of the proposed method. First, we explain the experimental setup and methods, followed by data analysis using both qualitative and quantitative methods. Finally, we compare the proposed method with the existing literature for a fair assessment.
The experiments are conducted on a PC with Intel(R) Core (TM) i5-5200U CPU@2.20GHz and RAM 8GB using MATLAB2018b. We have considered a whole-brain atlas website (http://www.med.harvard.edu/AANLIB/home.html, accessed on 1 September 2021) to conduct our experiments. For this purpose, 23 MRI-CT medical image data sets are taken from this database. All these data sets are registered with a resolution of 256 × 256. Image registration [55] is a necessary step prior to image fusion. It is defined as the process of mapping the input images with the help of a reference image. Such mapping aims to match the corresponding images based on specific features to assist in the image fusion process. The database contains various cross-sectional multimodal medical images, such as MRI (T1 and T2 weighted), CT, single-photon emission computed tomography (SPECT), and positron emission tomography (PET).
Furthermore, it has a wide range of brain images ranging from healthy to different brain diseases, including cerebrovascular, neoplastic, degenerative, and infectious diseases. We have considered 23 pairs of MRI-CT from fatal stroke (cerebrovascular disease) to validate our proposed approach (Supplementary Materials). Interested readers can find more details of this database in [56].
The efficacy of any image fusion algorithm can be verified using subjective (qualitative) and objective (quantitative) analysis. In Section 3.1, we first verified the subjective performance of various fusion algorithms and then performed objective analysis using fusion metrics in Section 3.2.
3.1. Subjective Assessment
Visual results of various MRI and CT fusion methods are shown in Figure 5, Figure 6 and Figure 7. A good MRI- and CT-fused image should contain both the soft tissue information and dense structure information of the MRI and CT images. We can draw the following observations by examining the visual quality of the four sets of MRI-CT fusion results using various methods.
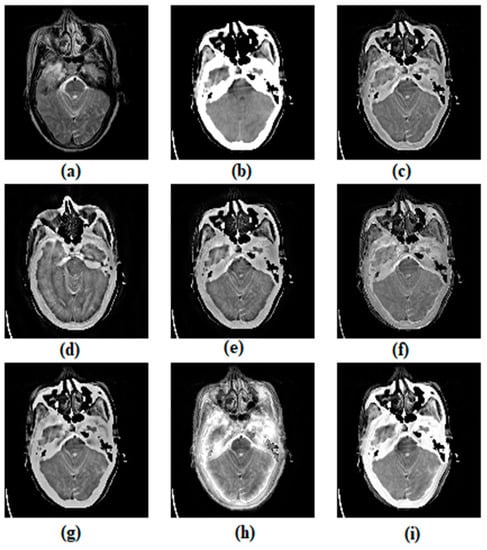
Figure 5.
Visual quality analysis of various fusion algorithms for MRI-CT (set-7). (a) MRI image, (b) CT image, (c) ASR, (d) CVT, (e) DTCWT, (f) MSVD, (g) CSMCA, (h) NSST, (i) proposed method.
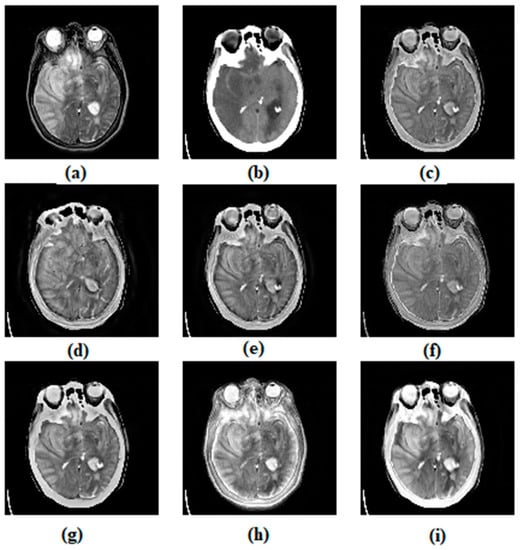
Figure 6.
Visual quality analysis of various fusion algorithms for MRI-CT (set-11). (a) MRI image, (b) CT image, (c) ASR, (d) CVT, (e) DTCWT, (f) MSVD, (g) CSMCA, (h) NSST, (i) proposed method.
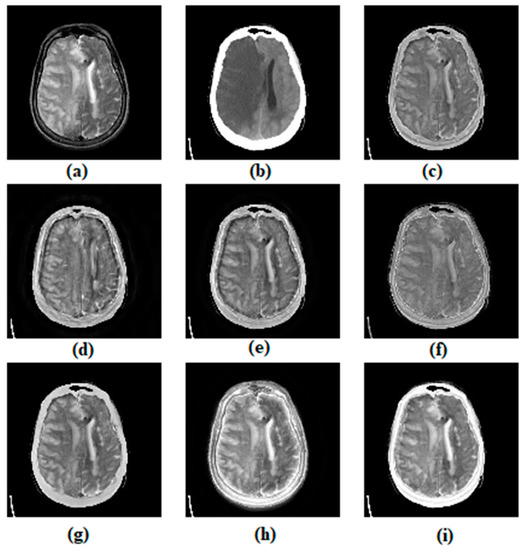
Figure 7.
Visual quality analysis of various fusion algorithms for MRI-CT (set-15). (a) MRI image, (b) CT image, (c) ASR, (d) CVT, (e) DTCWT, (f) MSVD, (g) CSMCA, (h) NSST, (i) proposed method.
1. Compared to all the other methods, our proposed algorithm provides a brighter outer region representing the CT image’s dense structure;
2. From Figure 5, Figure 6 and Figure 7, it can be seen that the fused images of methods (c)–(g) are yielding poor contrast;
3. Though the method (h) in all the Figure 5, Figure 6 and Figure 7 provides better contrast details; still, it is suffering from artifacts, especially in the CT region.
From Figure 5, Figure 6 and Figure 7, it can be noticed that the ASR method transfers both the CT and MRI information partially with low contrast. Next, coming to the CVT contains more MRI details than the CT. In the DTCWT method, we can find a few fusion artifacts in and around the CT region. Similarly, we can observe information fusion loss in the MSVD method. Compared with the methods mentioned above, CSMCA gives better visual quality, but the overall contrast of the image is reduced. The fused images with the NSST method are visually degraded due to both the fusion loss and artifacts. Overall, our proposed method retains the necessary information from the MRI and CT with minimum fusion losses. The comparison results of the MRI-CT fusion using various methods, including the proposed method on the 23 pairs of fatal stroke images, are shown in Figure 8 and Figure 9.
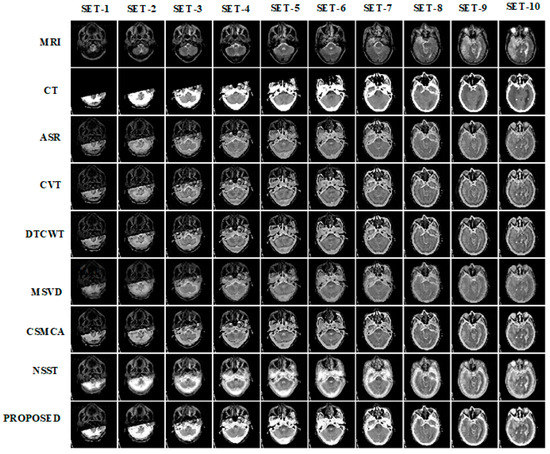
Figure 8.
The results of various methods on first 10 pairs of MRI-T images (fatal stroke).
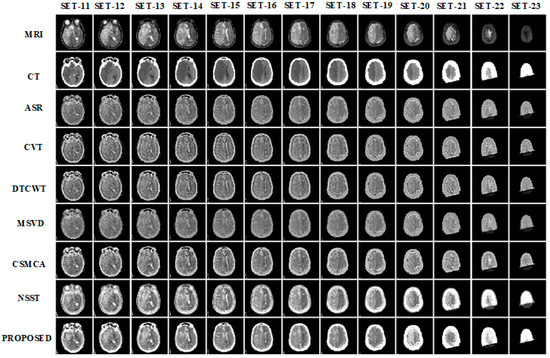
Figure 9.
The results of various methods on next 13 pairs of MRI-CT images (fatal stroke).
3.2. Objective Assessment
Here, we assess the fused image quality objectively using fusion metrics. Table 3, Table 4 and Table 5 demonstrate the objective assessment of the three fatal-stroke images proposed and other existing approaches (sets: 7, 11, and 15) subjectively analyzed earlier. In addition, we have presented the average objective metric scores of all the 23 sets (fatal-stroke)in Table 6. Fusion metrics except for RMSE with the first highest values are highlighted in bold font, and the second-highest values are underlined. The first-lowest value of the RMSE is indicated in bold, and the second-lowest value is underlined. A number within the bracket at the end of the quantitative metric scores represents the rank of the fusion algorithm. In these Tables, the ranking scheme is considered for better quantitative analysis of fusion algorithms.

Table 3.
Quantitative analysis of various fusion methods for MRI-CT (set-7).

Table 4.
Quantitative analysis of the various fusion methods for MRI-CT (set-11).

Table 5.
Quantitative analysis of the state-of-the-art methods for MRI-CT (set-15) dataset.

Table 6.
Average quantitative analysis of the proposed method (23 pairs of MRI-CT) and other state-of-the-art methods.
Comprehensively, the proposed framework is the only approach that occupies the first two ranks for all eight metrics among all the seven methods. It indicates that our method has robust performance (i.e., stable and promising performance) than other existing techniques. Specifically, our approach always remains in the first position on VIFF and RMSE for all four data sets, as shown in Table 3, Table 4 and Table 5.
Average quantitative analysis of the proposed and other state-of-the-art methods calculated over 23 pairs of MRI-CT (fatal stroke) are presented in Table 6. The proposed method occupied the first position by overperforming other fusion algorithms when average values are considered in fusion metrics.
In general, the consistent performance of any image fusion algorithm in quantitative results is mainly due to the good visual quality of fused images, fusion gain, and less fusion loss and fusion artifacts. We have already seen from the visual result analysis that the proposed method can transfer the source image information into the fused image with less fusion loss and artifacts compared to the other fusion algorithms. It is also evident from the fusion metrics that our method is giving a stable performance.
Hence, we can conclude that the proposed method is promising, stable, and efficient from qualitative and quantitative comparative analysis.
4. Conclusions and Future Scope
We proposed a multi-modal medical image fusion framework with VMD and LEM to fuse MRI and CT medical images in this work. By using an adaptive decomposition technique VMD, significant IMFs are derived from the source images. This decomposition process can preserve some details of source images. However, these details are not sufficient to fulfill the clinical needs of radiologists. Hence, we used a LEM fusion rule to preserve complementary information from IMFs, an essential criterion during medical image diagnosis. All the experiments are evaluated on the Whole Brain Atlas benchmark data sets to analyze the efficacy of the proposed methodology. The experimental results reveal that the proposed framework attained better visual perception. Even objective assessment in terms of average EI (64.582), MI (3.830), VIFF (0.498), (0.542), SSIM (0.6574), RMSE (0.020), AG (6.41), and PSNR (20.291) demonstrated quantitative fusion performance better than the existing multi-modal fusion approaches. In the future, we wish to conduct experiments with extensive data that contain images of MRI and CT with different disease information. Additionally, we consider extending this work to both 2D and 3D image clinical applications. Furthermore, we would like to verify the effectiveness of the proposed method for other image fusion applications such as digital photography, remote sensing, battlefield monitoring, and military.
Supplementary Materials
The following are available online at https://www.mdpi.com/article/10.3390/app112210975/s1. The qualitative (Figures S1–S23) and quantitative results (Tables S1–S23) of all the 23 pairs of images used in this work are given in the supplementary material.
Author Contributions
Conceptualization, S.P. and R.D.; methodology, S.P., D.P.B., R.D., K.N.V.P.S.R. and G.R.N.; software, S.P., D.P.B. and K.N.V.P.S.R.; validation, S.P., D.P.B. and K.N.V.P.S.R.; formal analysis, S.P. and G.R.N.; investigation, K.N.V.P.S.R. and G.R.N.; resources, S.P. and R.D.; data curation, K.N.V.P.S.R. and D.P.B.; writing—original draft preparation, S.P., D.P.B. and K.N.V.P.S.R.; writing—review and editing, S.P., D.P.B. and K.N.V.P.S.R.; visualization, S.P., R.D. and G.R.N.; supervision, R.D. and G.R.N.; project administration, K.N.V.P.S.R. All authors have read and agreed to the published version of the manuscript.
Funding
This research received no external funding.
Institutional Review Board Statement
Not applicable.
Informed Consent Statement
Not applicable.
Data Availability Statement
Imaging data can be downloaded from the link: https://www.med.harvard.edu/aanlib/, accessed on 15 November 2021.
Conflicts of Interest
The authors declare no conflict of interest.
References
- Vishwakarma, A.; Bhuyan, M.K. Image Fusion Using Adjustable Non-subsampled Shearlet Transform. IEEE Trans. Instrum. Meas. 2018, 68, 3367–3378. [Google Scholar] [CrossRef]
- Ouahabi, A. A review of wavelet denoising in medical imaging. In Proceedings of the 2013 8th International Workshop on Systems, Signal Processing and their Applications (WoSSPA), Algiers, Algeria, 12–15 May 2013; IEEE: New York, NY, USA, 2013; pp. 19–26. [Google Scholar]
- Ahmed, S.; Messali, Z.; Ouahabi, A.; Trepout, S.; Messaoudi, C.; Marco, S. Nonparametric Denoising Methods Based on Contourlet Transform with Sharp Frequency Localization: Application to Low Exposure Time Electron Microscopy Images. Entropy 2015, 17, 3461–3478. [Google Scholar] [CrossRef] [Green Version]
- Unser, M. Texture classification and segmentation using wavelet frames. IEEE Trans. Image Process. 1995, 4, 1549–1560. [Google Scholar] [CrossRef] [Green Version]
- Meriem, D.; Abdeldjalil, O.; Hadj, B.; Adrian, B.; Denis, K. Discrete wavelet for multifractal texture classification: Application to medical ultrasound imaging. In Proceedings of the 2010 IEEE International Conference on Image Processing, Hong Kong, China, 26–29 September 2010; IEEE: New York, NY, USA, 2010; pp. 637–640. [Google Scholar]
- Hatt, C.R.; Jain, A.K.; Parthasarathy, V.; Lang, A.; Raval, A.N. MRI—3D ultrasound—X-ray image fusion with electromagnetic tracking for transendocardial therapeutic injections: In-vitro validation and in-vivo feasibility. Comput. Med. Imaging Graph. 2013, 37, 162–173. [Google Scholar] [CrossRef] [Green Version]
- Labat, V.; Remenieras, J.P.; BouMatar, O.; Ouahabi, A.; Patat, F. Harmonic propagation of finite amplitude sound beams: Experimental determination of the nonlinearity parameter B/A. Ultrasonics 2000, 38, 292–296. [Google Scholar] [CrossRef]
- Dasarathy, B.V. Medical image fusion: A survey of the state of the art. Inf. Fusion 2014, 19, 4–19. [Google Scholar] [CrossRef] [Green Version]
- Zhao, W.; Lu, H. Medical Image Fusion and Denoising with Alternating Sequential Filter and Adaptive Fractional Order Total Variation. IEEE Trans. Instrum. Meas. 2017, 66, 2283–2294. [Google Scholar] [CrossRef]
- El-Gamal, F.E.-Z.A.; Elmogy, M.; Atwan, A. Current trends in medical image registration and fusion. Egypt. Inf. J. 2016, 17, 99–124. [Google Scholar] [CrossRef] [Green Version]
- Li, S.; Kang, X.; Fang, L.; Hu, J.; Yin, H. Pixel-level image fusion: A survey of the state of the art. Inf. Fusion 2017, 33, 100–112. [Google Scholar] [CrossRef]
- Li, S.; Kwok, J.T.; Wang, Y. Multifocus image fusion using artificial neural networks. Pattern Recognit. Lett. 2002, 23, 985–997. [Google Scholar] [CrossRef]
- Li, S.; Kwok, J.-Y.; Tsang, I.-H.; Wang, Y. Fusing Images with Different Focuses Using Support Vector Machines. IEEE Trans. Neural Netw. 2004, 15, 1555–1561. [Google Scholar] [CrossRef]
- Vijayarajan, R.; Muttan, S. Iterative block level principal component averaging medical image fusion. Optik 2014, 125, 4751–4757. [Google Scholar] [CrossRef]
- Naidu, V.; Raol, J. Pixel-level Image Fusion using Wavelets and Principal Component Analysis. Def. Sci. J. 2008, 58, 338–352. [Google Scholar] [CrossRef]
- Singh, S.; Anand, R.S. Multimodal Medical Image Fusion Using Hybrid Layer Decomposition with CNN-Based Feature Mapping and Structural Clustering. IEEE Trans. Instrum. Meas. 2020, 69, 3855–3865. [Google Scholar] [CrossRef]
- Du, J.; Li, W.; Lu, K.; Xiao, B. An overview of multi-modal medical image fusion. Neurocomputing 2016, 215, 3–20. [Google Scholar] [CrossRef]
- Kappala, V.K.; Pradhan, J.; Turuk, A.K.; Silva, V.N.H.; Majhi, S.; Das, S.K. A Point-to-Multi-Point Tracking System for FSO Communication. IEEE Trans. Instrum. Meas. 2021, 70, 1–10. [Google Scholar] [CrossRef]
- Mitianoudis, N.; Stathaki, T. Pixel-based and region-based image fusion schemes using ICA bases. Inf. Fusion 2007, 8, 131–142. [Google Scholar] [CrossRef] [Green Version]
- Toet, A.; van Ruyven, L.J.; Valeton, J.M. Merging Thermal And Visual Images By A Contrast Pyramid. Opt. Eng. 1989, 28, 287789. [Google Scholar] [CrossRef]
- Toet, A. Image fusion by a ratio of low-pass pyramid. Pattern Recognit. Lett. 1989, 9, 245–253. [Google Scholar] [CrossRef]
- Li, X.; Guo, X.; Han, P.; Wang, X.; Li, H.; Luo, T. Laplacian Redecomposition for Multimodal Medical Image Fusion. IEEE Trans. Instrum. Meas. 2020, 69, 6880–6890. [Google Scholar] [CrossRef]
- Li, H.; Manjunath, B.S.; Mitra, S.K. Multisensor Image Fusion Using the Wavelet Transform. Graph. Model. Image Process. 1995, 57, 235–245. [Google Scholar] [CrossRef]
- Lewis, J.J.; O’Callaghan, R.J.; Nikolov, S.G.; Bull, D.R.; Canagarajah, N. Pixel- and region-based image fusion with complex wavelets. Inf. Fusion 2007, 8, 119–130. [Google Scholar] [CrossRef]
- Nencini, F.; Garzelli, A.; Baronti, S.; Alparone, L. Remote sensing image fusion using the curvelet transform. Inf. Fusion 2007, 8, 143–156. [Google Scholar] [CrossRef]
- Yang, L.; Guo, B.L.; Ni, W. Multimodality medical image fusion based on multiscale geometric analysis of contourlet transform. Neurocomputing 2008, 72, 203–211. [Google Scholar] [CrossRef]
- Miao, Q.; Shi, C.; Xu, P.; Yang, M.; Shi, Y. A novel algorithm of image fusion using shearlets. Opt. Commun. 2011, 284, 1540–1547. [Google Scholar] [CrossRef]
- Yin, M.; Liu, X.; Liu, Y.; Chen, X. Medical Image Fusion With Parameter-Adaptive Pulse Coupled-Neural Network in Nonsubsampled Shearlet Transform Domain. IEEE Trans. Instrum. Meas. 2018, 68, 49–64. [Google Scholar] [CrossRef]
- Kirankumar, Y.; Shenbaga Devi, S. Transform-based medical image fusion. Int. J. Biomed. Eng. Technol. 2007, 1, 101–110. [Google Scholar] [CrossRef]
- Naidu, V.P.S. Image Fusion Technique using Multi-resolution Singular Value Decomposition. Def. Sci. J. 2011, 61, 479. [Google Scholar] [CrossRef] [Green Version]
- Hermessi, H.; Mourali, O.; Zagrouba, E. Multimodal medical image fusion review: Theoretical background and recent advances. Signal Process. 2021, 183, 108036. [Google Scholar] [CrossRef]
- Wan, H.; Tang, X.; Zhu, Z.; Xiao, B.; Li, W. Multi-Focus Color Image Fusion Based on Quaternion Multi-Scale Singular Value Decomposition. Front. Neurorobot. 2021, 15, 76. [Google Scholar] [CrossRef]
- Singh, S.; Anand, R.S. Multimodal Medical Image Sensor Fusion Model Using Sparse K-SVD Dictionary Learning in Nonsubsampled Shearlet Domain. IEEE Trans. Instrum. Meas. 2020, 69, 593–607. [Google Scholar] [CrossRef]
- Liu, Y.; Chen, X.; Ward, R.K.; Wang, Z.J. Medical Image Fusion via Convolutional Sparsity Based Morphological Component Analysis. IEEE Signal Process. Lett. 2019, 26, 485–489. [Google Scholar] [CrossRef]
- Maqsood, S.; Javed, U. Multi-modal Medical Image Fusion based on Two-scale Image Decomposition and Sparse Representation. Biomed. Signal Process. Control 2020, 57, 101810. [Google Scholar] [CrossRef]
- Pankaj, D.; Sachin Kumar, S.; Mohan, N.; Soman, K.P. Image Fusion using Variational Mode Decomposition. Indian J. Sci. Technol. 2016, 9, 1–8. [Google Scholar] [CrossRef]
- Vishnu Pradeep, V.; Sowmya, V.; Soman, K. Variational mode decomposition based multispectral and panchromatic image fusion. IJCTA 2016, 9, 8051–8059. [Google Scholar]
- Pajares, G.; de la Cruz, J.M. A wavelet-based image fusion tutorial. Pattern Recognit. 2004, 37, 1855–1872. [Google Scholar] [CrossRef]
- Ouahabi, A. Signal and Image Multiresolution Analysis; John Wiley & Sons: Hoboken, NJ, USA, 2012; ISBN 1118568664. [Google Scholar]
- Nunes, J.; Bouaoune, Y.; Delechelle, E.; Niang, O.; Bunel, P. Image analysis by bidimensional empirical mode decomposition. Image Vis. Comput. 2003, 21, 1019–1026. [Google Scholar] [CrossRef]
- Gilles, J. Empirical Wavelet Transform. IEEE Trans. Signal Process. 2013, 61, 3999–4010. [Google Scholar] [CrossRef]
- Dragomiretskiy, K.; Zosso, D. Variational Mode Decomposition. IEEE Trans. Signal Process. 2013, 62, 531–544. [Google Scholar] [CrossRef]
- Lahmiri, S.; Boukadoum, M. Biomedical image denoising using variational mode decomposition. In Proceedings of the 2014 IEEE Biomedical Circuits and Systems Conference (BioCAS), Lausanne, Switzerland, 22–24 October 2014; pp. 340–343. [Google Scholar] [CrossRef]
- Lahmiri, S. Denoising techniques in adaptive multi-resolution domains with applications to biomedical images. Health Technol. Lett. 2017, 4, 25–29. [Google Scholar] [CrossRef]
- Maheshwari, S.; Pachori, R.B.; Kanhangad, V.; Bhandary, S.V.; Acharya, U.R. Iterative variational mode decomposition based automated detection of glaucoma using fundus images. Comput. Biol. Med. 2017, 88, 142–149. [Google Scholar] [CrossRef]
- Konstantin, D.; Zosso, D. Two-dimensional variational mode decomposition. In Proceedings of the International Workshop on Energy Minimization Methods in Computer Vision and Pattern Recognition, Hong Kong, China, 13–16 January 2015; Springer: Berlin/Heidelberg, Germany, 2015; pp. 197–208. [Google Scholar]
- Polinati, S.; Dhuli, R. A review on multi-model medical image fusion. In Proceedings of the International Conference on Signal Processing, Communications and Computing (ICSPCC 2019), Liaoning, China, 20–22 September 2019; ICCSP: Tamilnadu, India, 2019. [Google Scholar]
- Du, J.; Li, W.; Xiao, B. Anatomical-Functional Image Fusion by Information of Interest in Local Laplacian Filtering Domain. IEEE Trans. Image Process. 2017, 26, 5855–5866. [Google Scholar] [CrossRef]
- Wang, Y.; Du, H.; Xu, J.; Liu, Y. A no-reference perceptual blur metric based on complex edge analysis. In Proceedings of the 2012 3rd IEEE International Conference on Network Infrastructure and Digital Content, Beijing, China, 21–23 September 2012; IEEE: New York, NY, USA, 2012; pp. 487–491. [Google Scholar]
- Hossny, M.; Nahavandi, S.; Creighton, D. Comments on ‘Information measure for performance of image fusion’. Electron. Lett. 2008, 44, 2–4. [Google Scholar] [CrossRef] [Green Version]
- Sheikh, H.R.; Bovik, A.C. Image information and visual quality. IEEE Trans. Image Process. 2006, 15, 430–444. [Google Scholar] [CrossRef] [PubMed]
- Ferroukhi, M.; Ouahabi, A.; Attari, M.; Habchi, Y.; Taleb-Ahmed, A. Medical Video Coding Based on 2nd-Generation Wavelets: Performance Evaluation. Electronics 2019, 8, 88. [Google Scholar] [CrossRef] [Green Version]
- Xydeas, C.S.; Petrović, V. Objective image fusion performance measure. Electron. Lett. 2000, 36, 308. [Google Scholar] [CrossRef] [Green Version]
- Wang, Z.; Bovik, A.C.; Sheikh, H.R.; Simoncelli, E.P. Image quality assessment: From error visibility to structural similarity. IEEE Trans. Image Process. 2004, 13, 600–612. [Google Scholar] [CrossRef] [Green Version]
- Singh, R.; Khare, A. Multiscale medical image fusion in wavelet domain. Sci. World J. 2013. [Google Scholar] [CrossRef]
- Oliveira, F.P.M.; Tavares, J.M.R.S. Medical image registration: A review. Comput. Methods Biomech. Biomed. Engin. 2014, 17, 73–93. [Google Scholar] [CrossRef] [PubMed]
Publisher’s Note: MDPI stays neutral with regard to jurisdictional claims in published maps and institutional affiliations. |
© 2021 by the authors. Licensee MDPI, Basel, Switzerland. This article is an open access article distributed under the terms and conditions of the Creative Commons Attribution (CC BY) license (https://creativecommons.org/licenses/by/4.0/).