1. Introduction
Nowadays, water pollution is a big concern for many countries in the world. Contaminant substances in wastewater might include recalcitrant organic compounds and/or metals which require breakthrough technology for treatment and purification processes. One of the technologies of high interest is photocatalysis, which is based on energy absorption of UV radiation from sunlight that in turn activates a photocatalyst to degrade the contaminant. One of the most promising photocatalysts in terms of reaction efficiency, in many environmental and energy applications, is titanium dioxide (TiO2). It is chemically stable and therefore almost inert to the environment and humans, abundant and inexpensive. Furthermore, it has a high ability to break molecular bonds, leading to their degradation. TiO2 in the form of nanoparticles is especially very attractive because it is more reactive than its bulk form as a result of the smaller particle sizes and thus larger surface area.
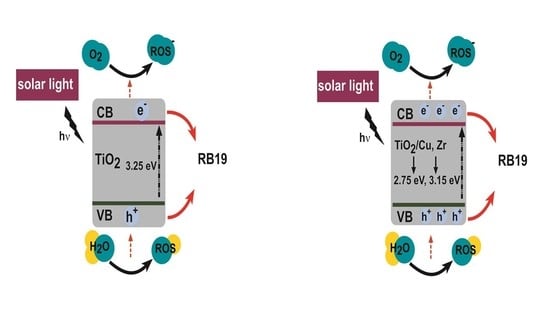
Unfortunately, the activation of TiO
2 occurs mainly due to UV irradiation, which represents only around 5% of the solar light spectrum, thus providing relatively low photocatalytic efficiency. This is a result of the large band gap (~3.2 eV) as well as the rapid recombination of the photogenerated electron–hole pairs. To increase its efficiency and enable activation also by visible light from solar radiation, TiO
2 must be modified by loading N, C, S, another semiconductor, dyes or metal particles (e.g., Cu or Zr) to reduce its band gap and, consequently, electron–hole recombination rates. The modification includes doping, decoration and structural modification of TiO
2 particles to enhance its photoactivity [
1,
2,
3,
4,
5]. A common approach to evaluate the capability of photocatalysts to act under visible light is by determining the apparent band gap of the material. This is usually performed using a UV–Vis spectrophotometer to record the sample’s absorption spectra over a chosen wavelength range. After plotting the graph of (α
)
n as a function of photon energy hυ (named a Tauc plot), it is possible to determine the values of band gaps as the intercept of extrapolation of the linear parts of the graphs to the abscissa axis, for which α
= 0. Parameters α,
,
and
n represent, respectively, an energy-dependent absorption coefficient, the Planck constant, the photon’s frequency and the factor depending on the nature of the electron transition, which is equal to 1/2 or 2 for the direct and indirect transition band gaps, respectively. Such a method does not provide sufficient sensitivity in case the samples are weakly absorbing.
Another factor that determines the material’s photocatalytic activity is the carrier lifetime of photogenerated electron–hole pairs that tend to recombine at different defects (e.g., interstitial atoms, vacancies and grain boundaries), which decreases materials’ photocatalytic activity but can be overcome by eliminating all the internal defects. Nanopowders are rich in defects because of their size and have many particle boundaries. Furthermore, the distance from bulk to surface is shorter compared to larger particles, causing faster migration and trapping of the charge carriers. This leads to low carrier mobility and reduces the lifetimes of photogenerated charge carriers. Nevertheless, in combination with a high surface area, it can result in enhancement of the overall photocatalytic activity since the photocatalytic reaction takes place on the surface of the material, and thus, particles with smaller sizes provide more reactive sites. Furthermore, the migration of photogenerated electron–hole pairs occurs through shorter distances, which reduces the carrier quenching rate. It is also important that the diffusion length of photogenerated electron–hole pairs should be longer than the material particle size. Due to this, the recombination of carriers on the surface of the photocatalyst is negligible, and thus, efficient charge carrier separation is provided.
The carrier lifetimes of photogenerated charge carriers are determined by time-resolved spectroscopy as time-resolved absorption/diffuse reflectance spectroscopy (TAS/TDRS) [
6], time-resolved photoluminescence spectroscopy (TPLS) [
7] and time-resolved IR spectroscopy (TIRS) [
8]. The measurements are based on analysis of the optical absorption, reflection or emission peaks of the material. Unfortunately, their position and intensity critically depend on the nature of the semiconductors (e.g., size, crystal phase and morphology), excitation wavelength, irradiation time and the measurement circumstances, which may disturb the measurements and give unreliable results. Thus, the use of more sensitive and reliable techniques is required, such as those based on photothermal effect [
9,
10,
11,
12,
13]. Among them, photothermal beam deflection spectrometry (BDS) is of high interest as it is suitable for the characterization of opaque and weakly absorbing samples. Furthermore, an additional advantage of the BDS technique is that it enables simultaneous determination of spectroscopic (e.g., extinction coefficients and band gap energies) and thermal parameters (e.g., thermal diffusivity, thermal conductivity and thermal effusivity) as well as other important parameters which are closely related to these properties (e.g., porosity) [
14,
15].
In the BDS technique, the examined sample is irradiated by a modulated excitation laser beam. The absorbed photon energy is converted into heat, inducing temperature oscillations (TOs) in the sample and further in an adjacent gas layer close to its surface. Subsequently, the generation of TOs leads to the creation of a density gradient in the adjacent gas layer and a change in its index of refraction. These changes are detected by a probe laser beam deflection measured by a position sensitive detector, which generates phase and amplitude signals related to the photothermal parameters of the sample. The BDS method has already been applied for determination of the optical, structural and transport properties of different materials that, in turn, define their photocatalytic activity [
12,
15].
The aim of this work was to develop Cu- and/or Zr-modified TiO
2 nanoparticles and characterize them by the use of the BDS technique, UV–Vis spectrophotometry, X-ray diffraction (XRD)and energy-dispersive X-ray (EDX) to determine their thermo-optical and transport parameters. The modification of TiO
2 materials exhibits induced spectral shifts into the visible spectral region, thus enhancing the absorption capacity of a photon under solar light. Additionally, a number of variables that affect the photocatalytic activity were examined. By knowing these parameters, it is possible to conclude about their potential application for photodegradation of various chemical and microbiological pollutants. Therefore, creating a proof of concept was the first step in testing the photodegradation activity of the characterized samples. In this regard, we used reactive blue 19 (RB19) dye as a test sample in the initial proof of concept and the thermal lens spectrometry (TLS) technique [
16] in order to monitor the rate of photocatalytic reaction.
3. Results and Discussion
XRD was performed to determine the crystal structure of TiO
2-based catalysts. The X-ray diffraction patterns of the reference TiO
2 compound as well as the Cu- and Zr-modified TiO
2 catalysts are presented in
Figure 3. The results indicate that only characteristic peaks belonging to TiO
2 were found for all modified TiO
2 samples. Therefore, no separate Cu or Zr phases formed in these catalysts during preparation, but 87% anatase and 13% rutile were present in the phase of TiO
2.
In order to test the loading of Cu and Zr in catalysts, EDX analysis was carried out on pressed powders.
Figure 4 shows the EDX spectra of the unmodified and P25/Zr (1%)Cu (0.05) catalysts. The analysis shows that in addition to Ti and O elements, copper and zirconium peaks exist. The STEM-EDX mapping of Cu/Zr-modified TiO
2 by Ni TEM grid confirmed the homogeneous distribution of Cu and Zr on the surface of TiO
2 (
Figure 5).
The results of BET measurements indicate that the addition of Cu to TiO2 decreased the surface area (46.5 m2/g) with respect to the specific surface area of the reference catalyst, which was 48.4 m2/g. On the contrary, zirconium increased the surface area (50.7 m2/g) and could contribute to enhancement of the photocatalytic properties of Zr-modified TiO2. Interestingly, there was no observed Cu effect on the surface area in the presence of Zr (50.7 m2/g).
To examine the band gap of TiO
2 materials, the absorption spectra were recorded and expressed as log α = f(λ), where α is the absorption coefficient and λ is the wavelength (
Figure 6). The α values were obtained from the measured (decadic) absorbances,
A, and thicknesses of samples,
d, according to the following relation.
It is shown in
Figure 6 that the absorption coefficient of TiO
2 for the 405–430 nm wavelength range increases relatively rapidly with the increase in the incident photon energy, which is an indication of a direct band gap. For λ < 405 nm, α increases relatively slowly with the increase in the photon energy, which indicates the presence of an indirect band gap (the maximum valence band (VB) energy occurs at a different momentum value to the minimum in the conduction band (CB) energy) in the TiO
2 material. The electronic band structure of TiO
2, therefore, shows both band gaps. Thus, the photoabsorption is dominated by direct band gap transitions when the photon energy becomes equal to or greater than the direct band gap. At higher photon energies, the transitions are dominated by indirect band gap transition and the absorption coefficient begins to increase relatively slowly compared to its increase in the case of direct band gap [
17,
18].
The indirect process proceeds at a much slower rate than direct transitions, as it requires three entities to intersect in order to proceed, namely an electron, a photon and a phonon, whereas in case of direct Eg, an electron–hole pair is produced quite easily since the electron does not need to receive very much momentum.
Determination of the band gap by UV–Vis spectrophotometry was based on the measurement of the diffuse reflectance of the examined samples (
Figure 7) [
17]. The sample thickness (~1 mm) ensured the condition of all light being absorbed or scattered before reaching the back surface of the sample [
9,
11]. Furthermore, the size of particles in the sample (~25 nm) was much smaller than the wavelength of incident light. Due to this, there were no secondary contributions of reflection, refraction and diffraction to the diffuse reflectance signal.
As shown in
Figure 7, the TiO
2-based materials showed strong absorption in the ultraviolet region, with the absorption edge located at around 400 nm.
The values of direct and indirect band gaps were obtained from the diffuse reflectance spectra of unmodified and Cu- or/and Zr-modified TiO
2 recorded on a UV–Vis spectrophotometer (
Figure 7) on the basis of the Kubelka–Munk theory [
17]. The indirect relationship between the band gap
Eg and the linear absorption coefficient α was obtained from a plot of (α
)
n versus the photon energy
using the following equation [
17]:
where
Eg is the band gap of allowed transitions (eV),
h is Planck’s constant (6.63 × 10
−34 Js),
is the frequency of the light (s
−1) and
n is the number characterizing the transition process (
n = 0.5 corresponds to the indirectly allowed transition and
n = 2 corresponds to the directly allowed transition).
In order to determine the values of the band gaps for examined TiO
2, as well as Cu- and/or Zr-modified TiO
2 samples, the graph of
as a function of photon energy E =
was plotted (
Figure 8). Extrapolation of the linear parts of the graphs gives the values of band gaps as the intercept to the abscissa axis, for which
. The determined values of both direct and indirect band gaps for the examined samples are presented in
Table 1, along with their 95% confidence intervals (CI). The fitting accuracy of the determined parameters (SDs) was estimated in both surface and frequency scan method by calculating the square root of the covariance matrix [
13,
19]:
where
P is the fitted parameters matrix and
where
σr is the variance on residuals:
where
N is the number of points in the dataset,
Jf denotes the Jacobian matrix and
P’ is the matrix of fitted parameters for which the minimum of error function was reached.
To determine the source of uncertainty, the repeatability of the method was also tested. For that purpose, the measurements were repeated three times and the desired parameters found by the use of the multiparameter fitting procedure described above. To determine if significant differences exist between the obtained parameters, the p-values were calculated for all examined parameters at 95% CI. For all the calculated cases, the p-value was smaller than 0.05, which means that there were not significant differences between parameters’ values in the single determination. Thus, the source of determination uncertainty results from the optical approach, but not from batch variations.
With consistently higher values for the indirect band gap in all materials, a trend of decrease in band gaps was observed for Cu- and/or Zr-modified materials with respect to pure TiO2. However, due to the relatively high standard deviations (5.9–7.3% RSD for direct band gap and 6.3–7.8% RSD for indirect band gap), no difference can be confirmed for the examined materials at 95% CI. For the same reason, the differences in direct and indirect band gaps for a given material fall within the 95% CI, except for TiO2/Cu (0.05%)Zr (1%), which shows a difference of 0.60 ± 0.25 eV.
Although a decrease in the value of
Eg for direct as well as indirect band gaps was expected after the TiO
2 modification, which leads to a decrease in the material’s grain size [
20,
21], these changes were not significant at 95% CI. Such insignificant differences can be attributed to insufficient measurement sensitivity, which results in larger standard deviations of the determined band gap values. Consequently, the differences in band gaps of the investigated materials could not be confirmed by UV–Vis spectrometry transmission mode measurements. For this reason, the BDS technique, which is known for its high sensitivity and is less affected by light scattering within the sample, was applied for determination of the band gaps and relevant thermal and transport parameters in the characterized samples. The BDS signal results from the conversion of absorbed energy into heat. The heat generated in the BDS experiment depends on the power density of internal heat sources, which, in turn, are governed by intra-band transitions in the bulk, non-radiative inter-band transitions and non-radiative surface recombination [
22]. Thus, only indirect band gaps can be determined in these experiments, since the indirect band gap is related to the non-radiative transitions between the energy levels with the presence of phonons in semiconductor material. Direct band gaps, on the other hand, are related to the radiative transitions with the emission of photons, which do not generate heat, and therefore, no BDS signal can be observed.
In the BDS measurements, the amplitude and phase of the signal were recorded as a function of modulation frequency of the pump beam (
Figure 9) for unmodified and Zr- and/or Cu-modified TiO
2 samples.
The BDS signal falls off with the increase in the modulation frequency. Furthermore, both the amplitude and phase of the BDS signal clearly differ between samples of different compositions since they have different thermal (thermal conductivity and diffusivity), transport (carrier lifetime) and optical (band gap) properties.
In fact, besides the band gap, BDS makes it possible to also determine the thermal and transport properties of materials. This can be accomplished by the multiparameter fitting process, in which the best fit of the theoretical model [
21,
22,
23,
24] to the experimental data is achieved by the least-squares procedure. The applied theoretical model interrelating the thermal, optical and transport properties of the material with the amplitude and phase of the BDS signal is presented in detail in the literature [
21,
22]. The best theoretical fits to the experimental data [
21,
22] were obtained for the values of the thermal diffusivities and conductivities, band gaps and carrier lifetimes presented in
Table 2.
It can be seen from the results presented in
Table 2 that modification of the TiO
2 surface leads to changes in the thermal, transport and optical properties of the material. The thermal properties are governed by the heat transport within the sample, as well as by the ability of the sample to exchange heat with the surroundings. Loading of Cu particles clearly increased both the material’s thermal diffusivity and thermal conductivity, since the heat transport within the modified material occurs through the network of metal particles. Copper is characterized by a higher thermal conductivity compared to TiO
2. For example, the thermal conductivity of Cu is over 40 times higher (~400 W/mK) than the thermal conductivity of TiO
2 (9.4 W/mK, as determined for TiO
2 powders in this work). Therefore, already a small amount of added Cu (0.05%) increased the thermal conductivity of the material. On the other hand, due to the relatively small difference between TiO
2 and Zr (thermal conductivity ~23 W/mK), the determined value of thermal conductivity did not change beyond the range of determination error by the addition of 1% Zr when compared to TiO
2 and TiO
2/Cu (0.05%). It must be stated that the sample preparation process (pressing of nanopowders) changed its original thermal properties. Generally, pressing increases the compactness of a material and thus also increases the thermal conductivity, leaving the optical and transport properties unchanged (band gap and carrier lifetime) since the original structure of the nanomaterial is not changed by the formation of pellets.
Comparison of the optical properties determined by BDS for different TiO2-based materials showed that the optical absorption properties were significantly affected (95% CI) only in the case of modification by Cu (0.05%), which caused a 9.5–10.8% decrease in the band gap as compared to the pure TiO2 or Zr-modified TiO2.
It can be also seen that the standard deviations of the measurements in the case of BDS (1–2% RSD) are much lower than for UV–Vis spectrophotometry (6.3–7.8% RSD). This is the consequence of BDS’ independence on light scattering, which is not the case for UV–Vis spectrophotometry. Nonetheless, the values of indirect band gaps determined by the BDS and UV–Vis techniques are in good agreement at 95% CI. Still, the differences in band gaps between materials could only be confirmed by BDS. The observed decreases in band gaps in the case of Cu-modified TiO2 can be explained by the penetration of the charge state function into the forbidden energy gap, which creates extra energy levels within the band gap. Furthermore, Cu creates a p-type semiconductor; thus, the Fermi energy level shifts from the center of the band gap toward the valence band. Loading of Zr particles into TiO2 had no significant effect on the composite’s band gap at 95% CI as compared to the pure TiO2 or Cu-modified TiO2.
The comparison of charge carrier lifetimes in
Table 2 reveals important effects of TiO
2 modified with Cu as well as with Zr. Charge carrier lifetimes can be deduced from BDS measurements because the charge carrier density affects the thermal diffusivity of the material, which is directly related to the amplitude and phase of the BDS signal.
The charge carriers were generated throughout the entire irradiated volume of the sample. The collisions of excited electrons with phonons resulted in energy transfer to the bulk of the material and its heating. These processes are strongly dependent on the band gap of the material but also on its thermal properties. The increase in thermal diffusivity is associated with the decrease in carriers’ lifetime as a result of the increase in carriers’ concentration according to the relation
[
10,
25], where
τ is the carrier lifetime and
n is the carriers’ concentration. Furthermore, the modification of TiO
2 introduced additional defects within the material, which in turn limited the carriers’ lifetime since they act as recombination centers in the band gap. In addition, the decrease in the carriers’ lifetime was also a consequence of collisions between the charge carriers, which increase with carriers’ concentration. This result confirms the predominance of free carriers’ contribution to heat transport.
The decrease in carriers’ lifetime (95% CI) was observed for both Cu-modified samples. The highest difference, i.e., a 20% decrease in charge carriers’ lifetime, was found in the case of TiO2 modification with 0.05% Cu. Within the determination uncertainty, the loading of TiO2 with 1% Zr did not result in a change in carriers’ lifetime when compared to unmodified TiO2. More importantly, the presence of 1% Zr in TiO2 containing 0.05% Cu significantly increased the charge carriers’ lifetime as compared to TiO2/Cu (0.05%) material and resulted in only a 15% lower charge carrier lifetime as compared to pure TiO2, which is of high importance for the efficiency of TiO2-based materials as photocatalysts.
It can be concluded that loading Cu into TiO2 material is effective for reducing the band gap of the photocatalyst. Unfortunately, at the same time, loading of Cu also reduces the carriers’ lifetime. This may have a negative effect on the material’s photocatalytic performance but can be compensated by additional Zr loading, which keeps the value of carriers’ lifetime nearly the same as in unmodified TiO2.
The carriers’ lifetime and the band gap are the factors that determine the photocatalytic activity of the material, which is reflected in the rates of photocatalytic reactions. In this work, we investigated the degradation of 5 mg L
−1 RB19 aqueous solution exposed to illumination by a simulated solar light in the presence of unmodified TiO
2 photocatalyst and TiO
2 photocatalyst materials modified with Cu and/or Zr. In this regard, it is crucial to determine the efficiency of the modified catalysts by studying the photocatalytic reaction rates using a highly sensitive technique. The rate of photocatalytic reaction was monitored using the TLS technique since the LOQs of the UV–Vis (4 mg L
−1) spectrophotometric technique were not sufficiently low to enable reliable determination of the RB19 concentrations used in this study. The rate law written in a differential form was used to describe the progress of the photocatalytic reaction, which follows first-order kinetics and is given by the following:
where
c0 and
c are the concentrations of RB19 at the beginning and at time
t of the photocatalytic reaction, respectively, and
Kp is the first-order constant of photocatalytic reaction rate.
The photocatalytic reaction rate, defined as the amount of RB19 degraded in an infinitely short time interval, can be found as the slope of the plot showing the dependence of
on time (
Figure 10). For short reaction times, the slope can be considered linear. The results are presented in
Table 3.
It can be seen that modification of TiO
2 increased the photocatalytic reaction rates. The highest value was obtained in the case of Cu and Zr/Cu introduction as a result of the highest decrease in band gap coupled with the longest carrier lifetimes; thus, the photocatalytic reaction rates are related to the slopes of the curves presented in
Figure 10.
The results summarized in
Table 3 show clear differences at the 95% confidence level between the slopes of regression lines for all samples (TiO
2/Cu (0.05%), TiO
2/Zr (1%) and TiO
2/Cu (0.05%) Zr (1%)).
This confirms that the modification of TiO
2 with Cu (0.05%), Zr (1%) and Zr (1%)Cu (0.05%) accelerates the photocatalytic degradation process of RB19, as indicated by the photocatalytic reaction rate constants presented in
Table 3. The results are in line with those presented in our previous paper [
26]. The photocatalytic reaction rates correspond to a 99.5% degradation efficiency as calculated previously using same experimental data [
26]. Moreover, these results indicate an improvement considering that the maximum efficiencies (98%, 100%) were achieved before with 20% longer (120 min) irradiation times [
27].
As expected, the decrease in the band gap by addition of 0.05% Cu increased the reaction rate since such materials are able to absorb a larger portion of the simulated solar light. Further improvement of the efficiency of the photocatalyst in degradation of RB19 dye was achieved by modification with 1% Zr, which increased the charge carrier lifetime. It has to be noted that despite the insignificant effect of Zr on the material’s band gap, as discussed above, the TiO2/Zr (1%) material showed an increased photocatalytic efficiency, reflected in the 10% increase in the reaction rate constant as compared to pure TiO2. This might be attributed in part also to the change in the specific surface of the material (50.7 m2/g), which might also play some role in other investigated materials.
The particle size of the pure TiO
2 crystallite material did not change substantially when introducing Cu and Zr particles, as demonstrated in a previous study [
28]. Their average size lies around 25 nm for both unmodified and modified samples.
The addition of Zr to the TiO
2 lattice results in an increase in the material surface area. This in turn enables better pollutant adsorption on the material and consequently more efficient photodegradation [
26,
27,
28,
29] and thus improves the photocatalytic properties. Additionally, an enhanced surface area favorizes the absorption of incoming photons, which results in higher light absorption at the surface of the photocatalyst. Thus, the presence of Cu and/or Zr particles is expected to increase the photocatalytic activity of TiO
2, which is well supported by the results presented in
Table 3.
TiO
2 modified with Cu and Zr demonstrated higher photocatalytic activity and better pollutant degradation performance, attributed to the lower band gap, higher absorption of light in the visible region, sufficiently long charge carrier lifetime as well as larger material surface area. It was demonstrated that transition metal ion-doped TiO
2 is considered an effective means to enhance the visible light-based photodegradation process. Nevertheless, the sustainability of the fabrication of TiO
2 photocatalysts is a parameter that should be considered, and it is thought that it can be affected by the transition metal ion. However, Fernandes et al. found that the addition of doping metals does not significantly affect the sustainability of TiO
2 fabrication [
30].


 ,
, 


