1. Introduction
We demonstrate a contactless vital sign monitoring (CVSM) system based on a near-infrared indirect time-of-flight (ToF) camera that can measure the heart rate (HR) and the respiratory rate (RR) of an individual at a stand-off distance. The system utilizes a vertical-cavity surface-emitting laser (VCSEL) illuminated indirect ToF camera, which measures both grayscale intensity and depth information simultaneously. We use grayscale intensity information as well as the distance information from two regions of interest (ROI) of a participant to determine the HR and RR. The HR is derived from periodic intensity change on a participant’s face induced by blood flow from the heartbeats, while the RR is determined by measuring the periodic change of chest wall movement during breathing. We find that the motion artifacts can dominate the underlying HR signal especially when an active illumination source such as VCSEL lasers are used. In this study, we use the depth information from the ToF camera to compensate for these motion artifacts since the depth information can be used to differentiate the grayscale intensity variations caused by underlying heartbeat versus the user’s motion.
We conducted a pilot human study with 29 participants of varying demographics to show that when using distance-based motion compensation, the success rate of HR measurement increases to 75%, as compared to only 35% when distance-based motion compensation is not used. The mean deviation from the reference HR measurement is −6.25 BPM if we apply the depth signal for motion compensation, while the deviation increases to 21 BPM when motion compensation is not used. At the same time, our study shows that the mean deviation of our RR measurement is 1.7 BPM, which is comparable to the pulse oximeter we used in this study. Our results further show that the system performs well among participants of various demographics such as skin color, gender, and age. Such systems could be useful in applications such as vehicle driver/occupant monitoring systems, remote and in-patient patient monitoring systems, telemedicine systems, or unobtrusive health screening systems.
2. Background and Motivation
Contactless physiological monitoring systems working at a remote distance have attracted much attention over the past decades. Especially after the COVID-19 pandemic in early 2020, there has been an increased demand for contactless physiological monitoring systems for health monitoring/screening at a safe distance to reduce the spread of viruses. Out of many potential physiological parameters, heart rate and respiration rate have attracted much attention.
Table 1 briefly summarizes the characteristics of various approaches in monitoring HR/RR. To date, most contactless HR/RR measurement systems rely on photoplethysmography (PPG) using RGB (red-green-blue) cameras with visible light illumination [
1,
2,
3,
4,
5,
6,
7,
8]. Several approaches, such as the skin-tone or blind-source separation-based algorithm, are proposed for the removal of external artifacts and considerably improve the reliability of HR measurement [
9,
10,
11,
12,
13,
14,
15,
16]. However, in some application scenarios such as vehicle driver monitoring or patient monitoring in hospitals, RGB camera-based systems face challenges from fluctuating or very low background illumination [
17]. Moreover, because melanin, which gives rise to skin color, has ~5X higher absorption in visible wavelength of 530 nm as compared to 850 nm [
18], the performance of RGB camera-based systems can vary among users of different skin colors [
6,
10,
17]. By using near-infrared illumination, such skin color dependence can be mitigated to achieve more uniform performance among wider demographics. Due to the benefits of being independent of background illumination and users’ skin color, remote HR and RR monitoring systems using a near-infrared light source can be a valuable alternative.
Over the past few years, HR/RR measurement systems using near-infrared cameras or even RGB/Depth cameras (such as Microsoft Kinect) [
19,
20,
21,
22,
23,
24,
28,
29] have been studied to show their capability of measuring HR/RR. In this study, we propose a system that leverages the existing ToF cameras in many consumer electronics and vehicles to perform HR and RR monitoring. The ToF camera used in this study is an indirect ToF using a modulated VCSEL laser as its light source [
30]. The benefit of this type of ToF camera is that it can extract the grayscale and depth information at the same time. The grayscale image is directly acquired through the exposure of the imaging sensor while the depth image is acquired by examining the phase change of the returned light [
30]. Compared to previous studies, one of the main advantages and technical advancements of this study is that we demonstrate a method that combines both the depth and grayscale intensity information from the ToF camera to compensate for motion artifacts. Motion artifacts are known to be a challenging issue for contactless PPG systems, but even more so for systems that operate in the near-infrared wavelengths because the absorption by hemoglobin is much weaker in the near-infrared compared to visible wavelengths [
31,
32]. As a result, the PPG signal strength between 850 nm to 1000 nm is only about 1/8th the peak amplitude at 530 nm. Since the ToF camera directly measures the body motion of a participant, we find this information useful in distinguishing intensity changes caused by body motion versus heartbeat, which would allow us to compensate for motion-induced artifacts. In addition, by measuring the motion of the chest wall using the ToF camera, we can at the same time directly measure the RR of a participant, instead of extracting RR from HR or other indirect body motion when an RGB camera is used [
26,
27]. Furthermore, to our knowledge, this is the first study that investigates the performance of a ToF-based HR/RR monitor system over larger and diverse demographics [
32]. A more detailed comparison between this study and previous studies using IR cameras is presented in
Table 2. Since indirect ToF cameras are being widely used in many consumer electronics, our CVSM system would enable low-cost, reliable, and multi-modality physiological signal monitoring on various platforms and application scenarios in the future. For example, such a system can be mounted in a vehicle to help monitor the physiological condition of the driver in a continuous manner. If any unexpected events such as falling asleep or heart attack were to happen, the CVSM system can then alert the autonomous/assisted driving system of the vehicle to bring the vehicle to a safe stop.
3. Experiment Setup
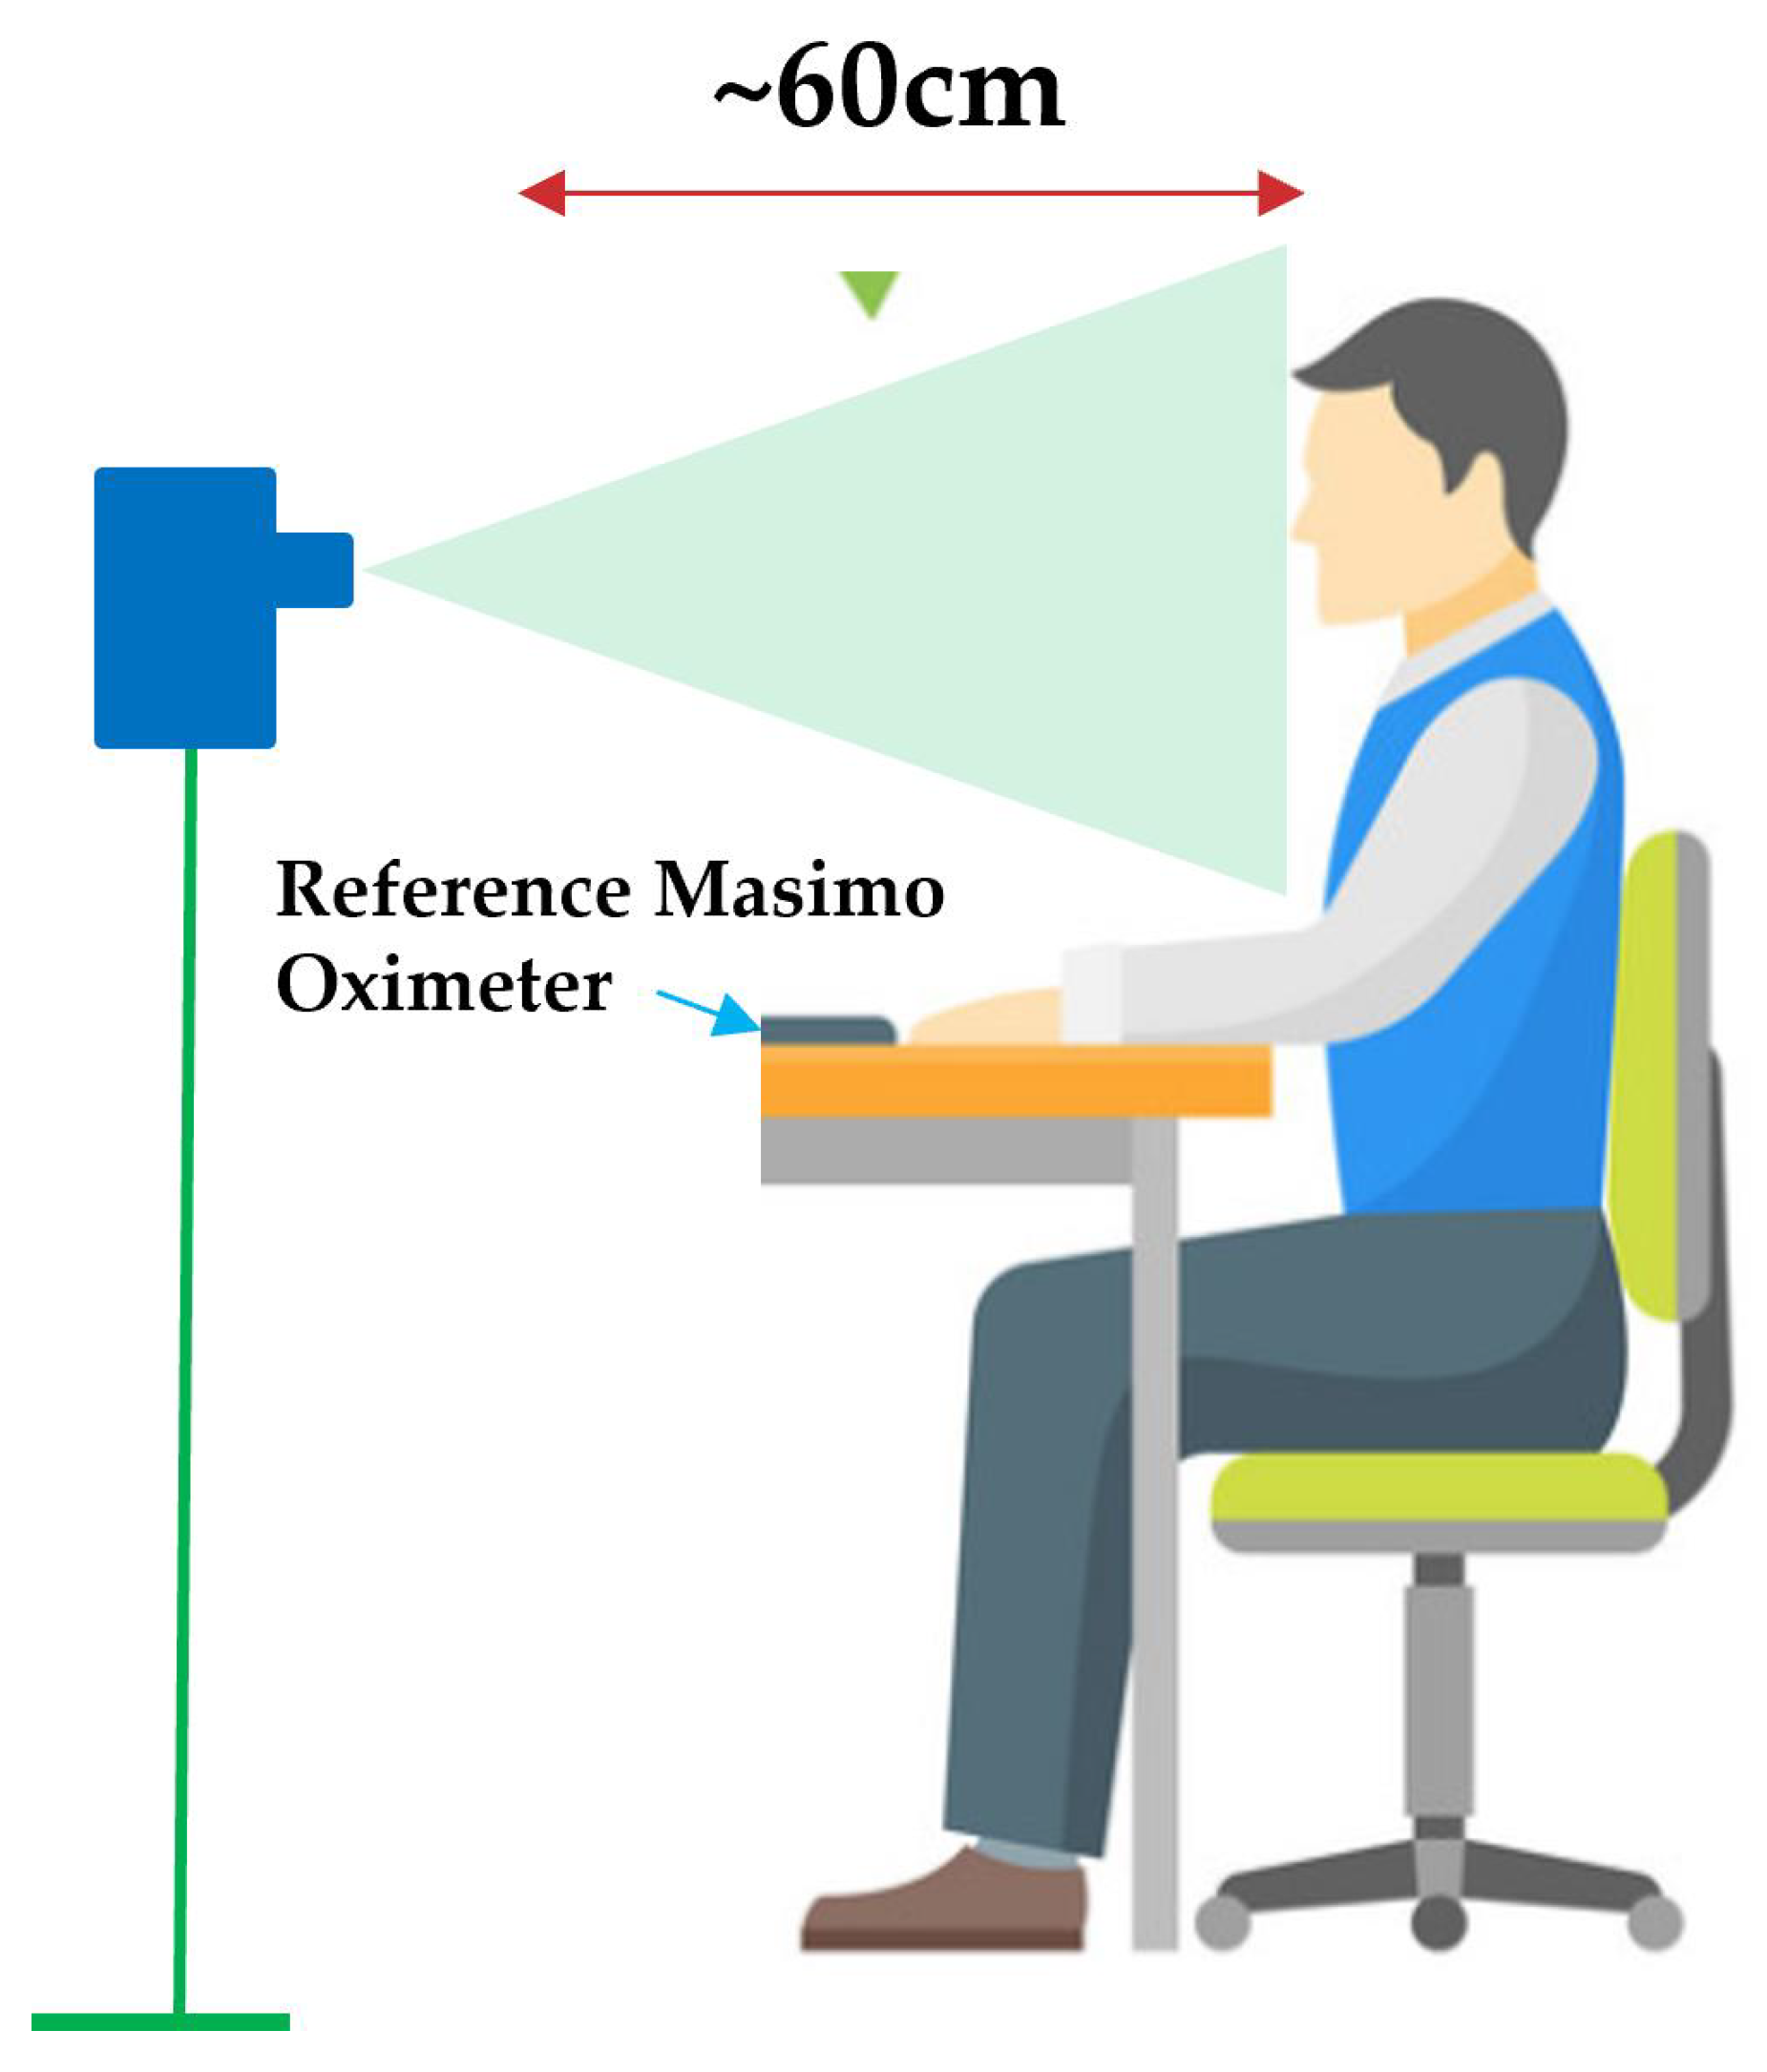
The indirect ToF camera used in this study is a CamBoard Pico Flexx camera (PMD Technologies AG, Siegen, Germany). This camera contains a 3D CMOS sensor with a resolution of 171 × 224, and a field of view of 62° × 45°. The illumination source on the camera is an 850nm VCSEL with eye-safe power output and an operating distance from 0.1 to 4 m. This ToF camera comes with a compact form factor of 68 mm × 17 mm × 7.35 mm and consumes only 300 mW average power, which makes it ideal for mobile application scenarios. In our experiment, the ToF camera is connected via USB to a laptop (2019 Lenovo X1 Extreme), which is used to both control the camera and process the recorded 3D video to extract HR and RR. The ToF camera is mounted on a stand positioned at the same height and ~60 cm away from the participants, which allows us to capture a participant’s face and chest region in one frame (
Figure 1). To provide a reference HR and RR reading, a contact-based finger pulse oximeter capable of recording both HR and RR with accuracy down to +/− 1 BPM (Mighty Sat Rx, Masimo, Irvine, CA, USA) is placed on one of the participant’s index fingers. All measurements are made under the illumination of fluorescent light (mounted on the ceiling, powered by AC electricity at 60 Hz), no special control of ambient light illumination is applied during the study.
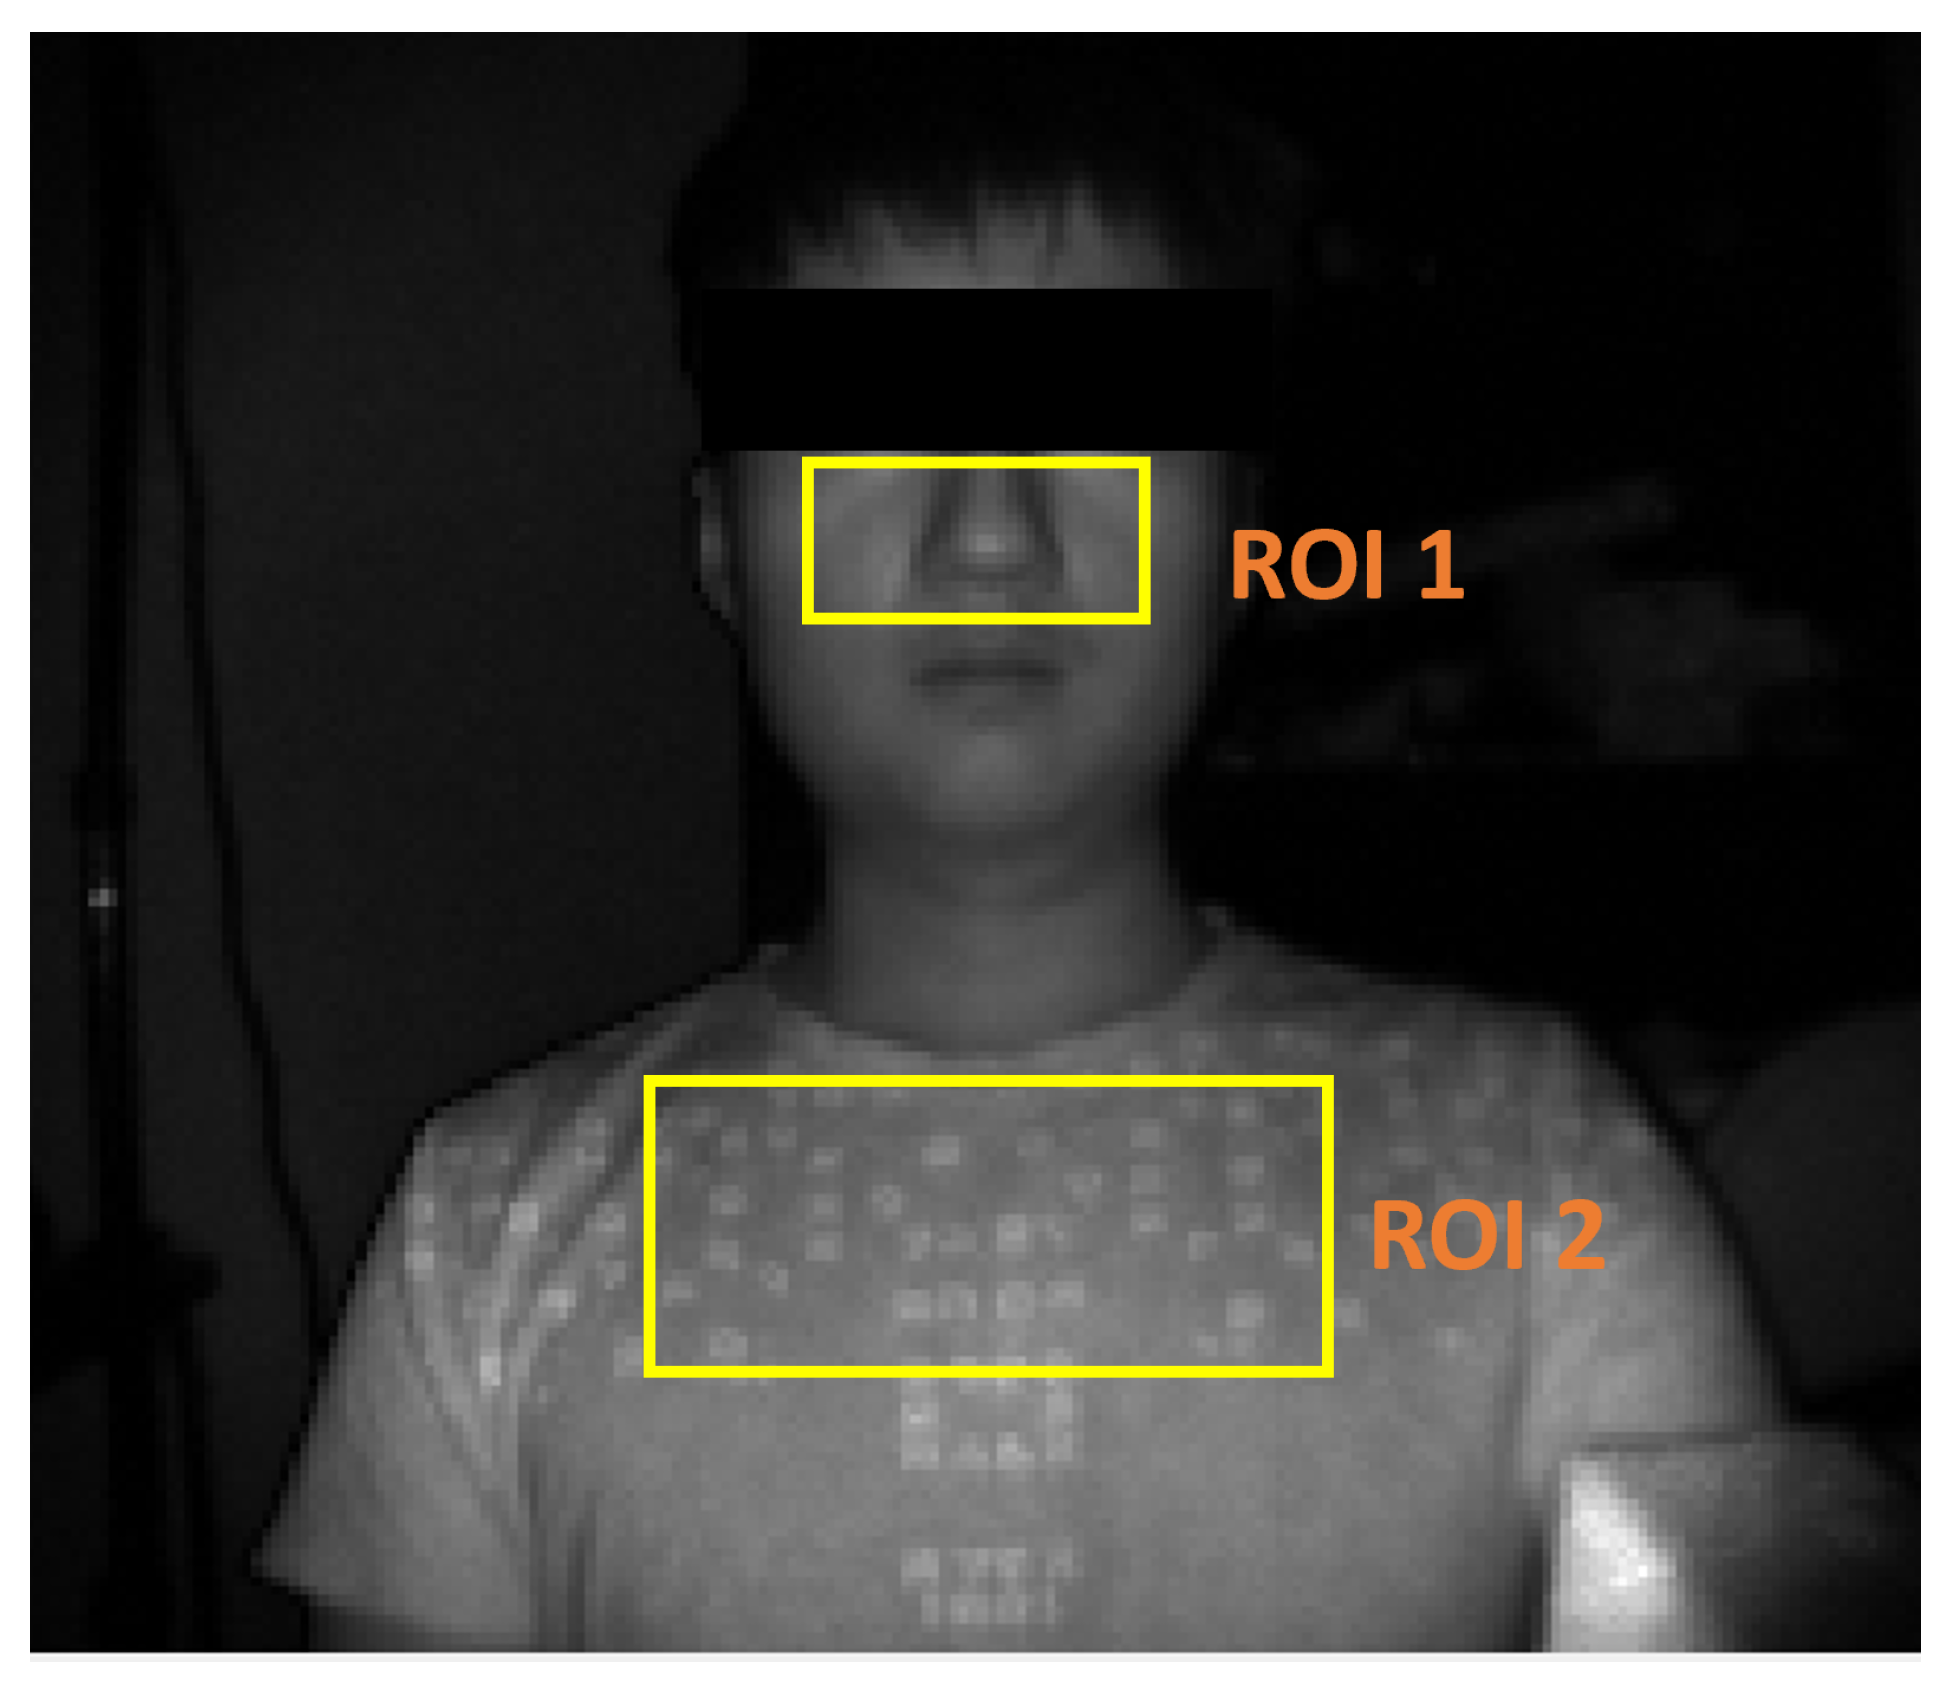
To determine the HR and RR of a participant, two ROIs are used to extract HR and RR of the participant (
Figure 2): ROI-1 is used for HR extraction while ROI-2 is used for RR extraction. The location of ROI-1 that covers both the nose and cheek is calculated by evaluating the relative position between the participant’s eyes and nose with a 66-point facial landmark detection algorithm [
33]. The ROI-2 region that represents the upper chest regions is determined from the relative position between the jawline and the shoulder using a pose estimator [
34]. Specifically, the system uses both grayscale intensity and depth information from ROI-1 to derive the HR while only the depth information from ROI-2 (upper chest) is used to derive the RR.
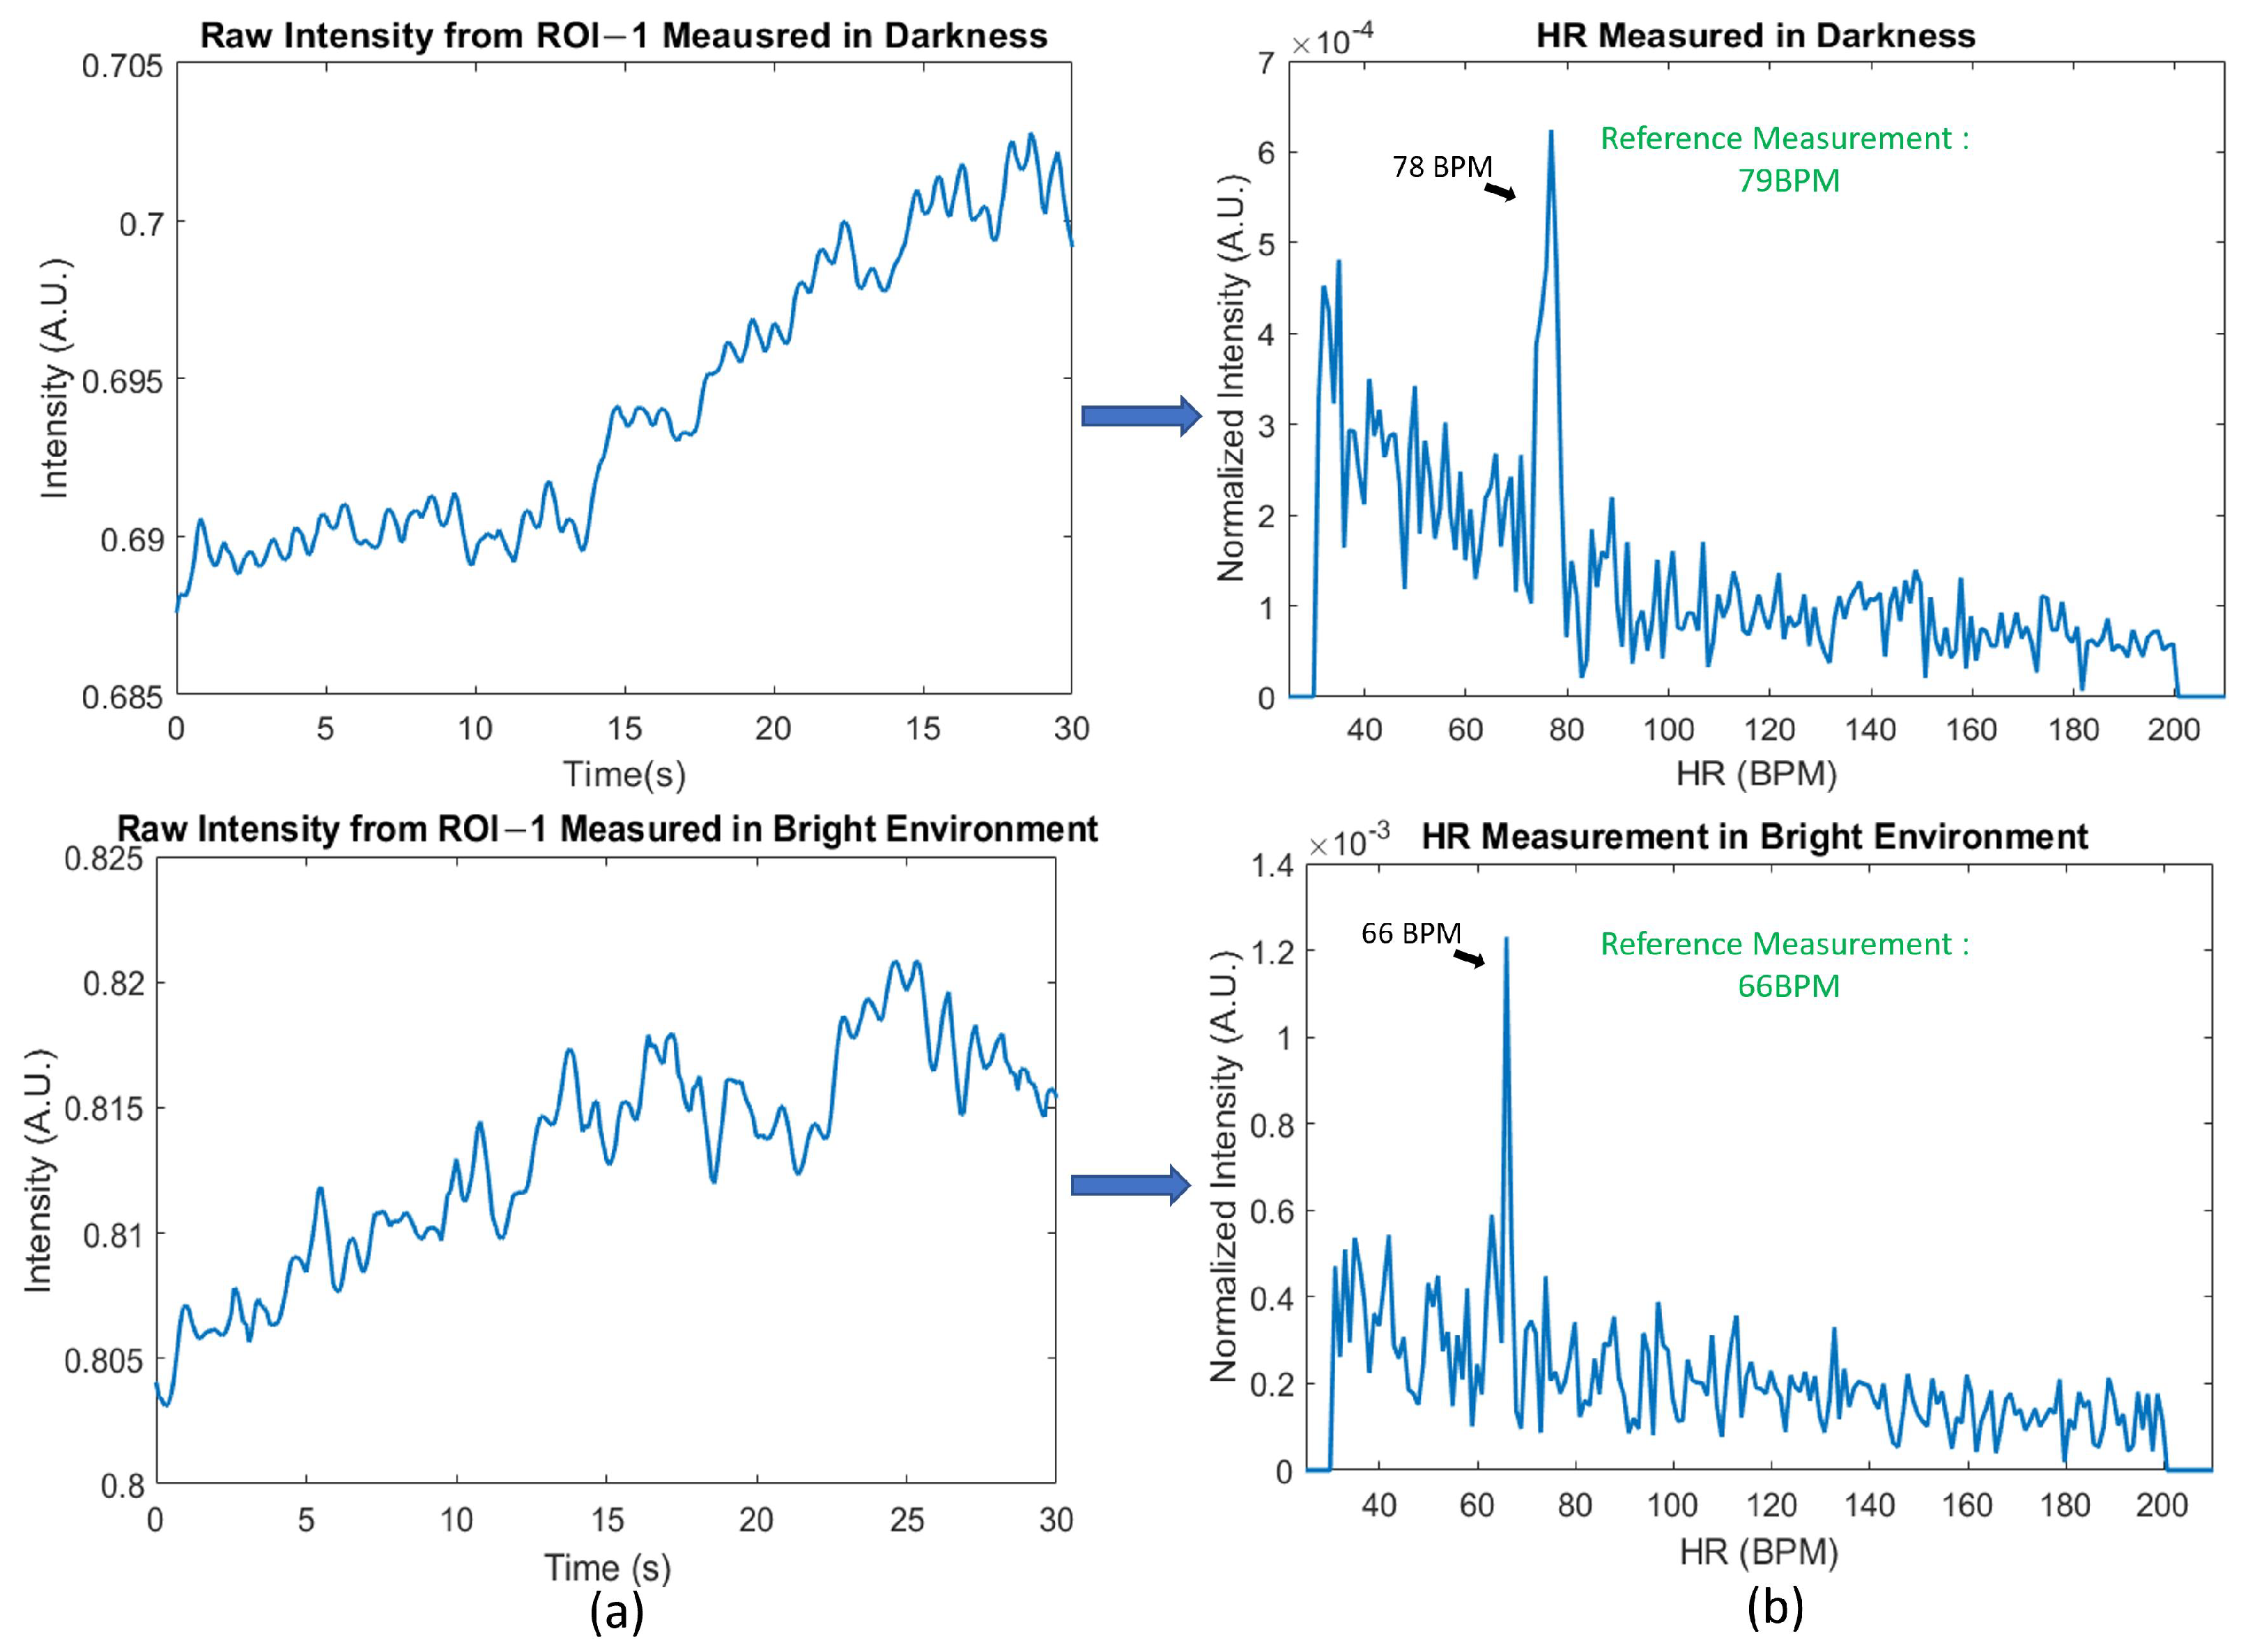
One advantage of using an indirect ToF camera for physiological monitoring is that it can operate under low or complex ambient light conditions. The enhanced immunity against external lighting conditions is a result of the narrow band-pass filter (centered at 850 nm) placed in front of the optical lens as well as the background illumination suppression from the detection mechanism used in the indirect ToF camera [
30]. To demonstrate the benefits of being independent of ambient lighting in physiological measurements, we show the results of HR measurement under various lighting conditions: a dark environment, a bright environment, and an environment where ambient light is switched on/off periodically.
Figure 3 shows the (a) raw intensity from ROI-1 when measured under the dark/bright environment and the (b) corresponding frequency domain information. When measuring under the dark environment, all ambient lights are switched off and the background illumination is reduced to <1 Lux. When measuring under the bright environment, in addition to the ambient fluorescent lighting, an 100 W halogen lamp is placed 1 m from the participant to create an illumination of 960 Lux. In both cases, since our system relies on the built-in VCSEL laser for illumination, a clear HR signal can still be seen in the time domain and the correct HR rate is obtained using a Fourier transform.
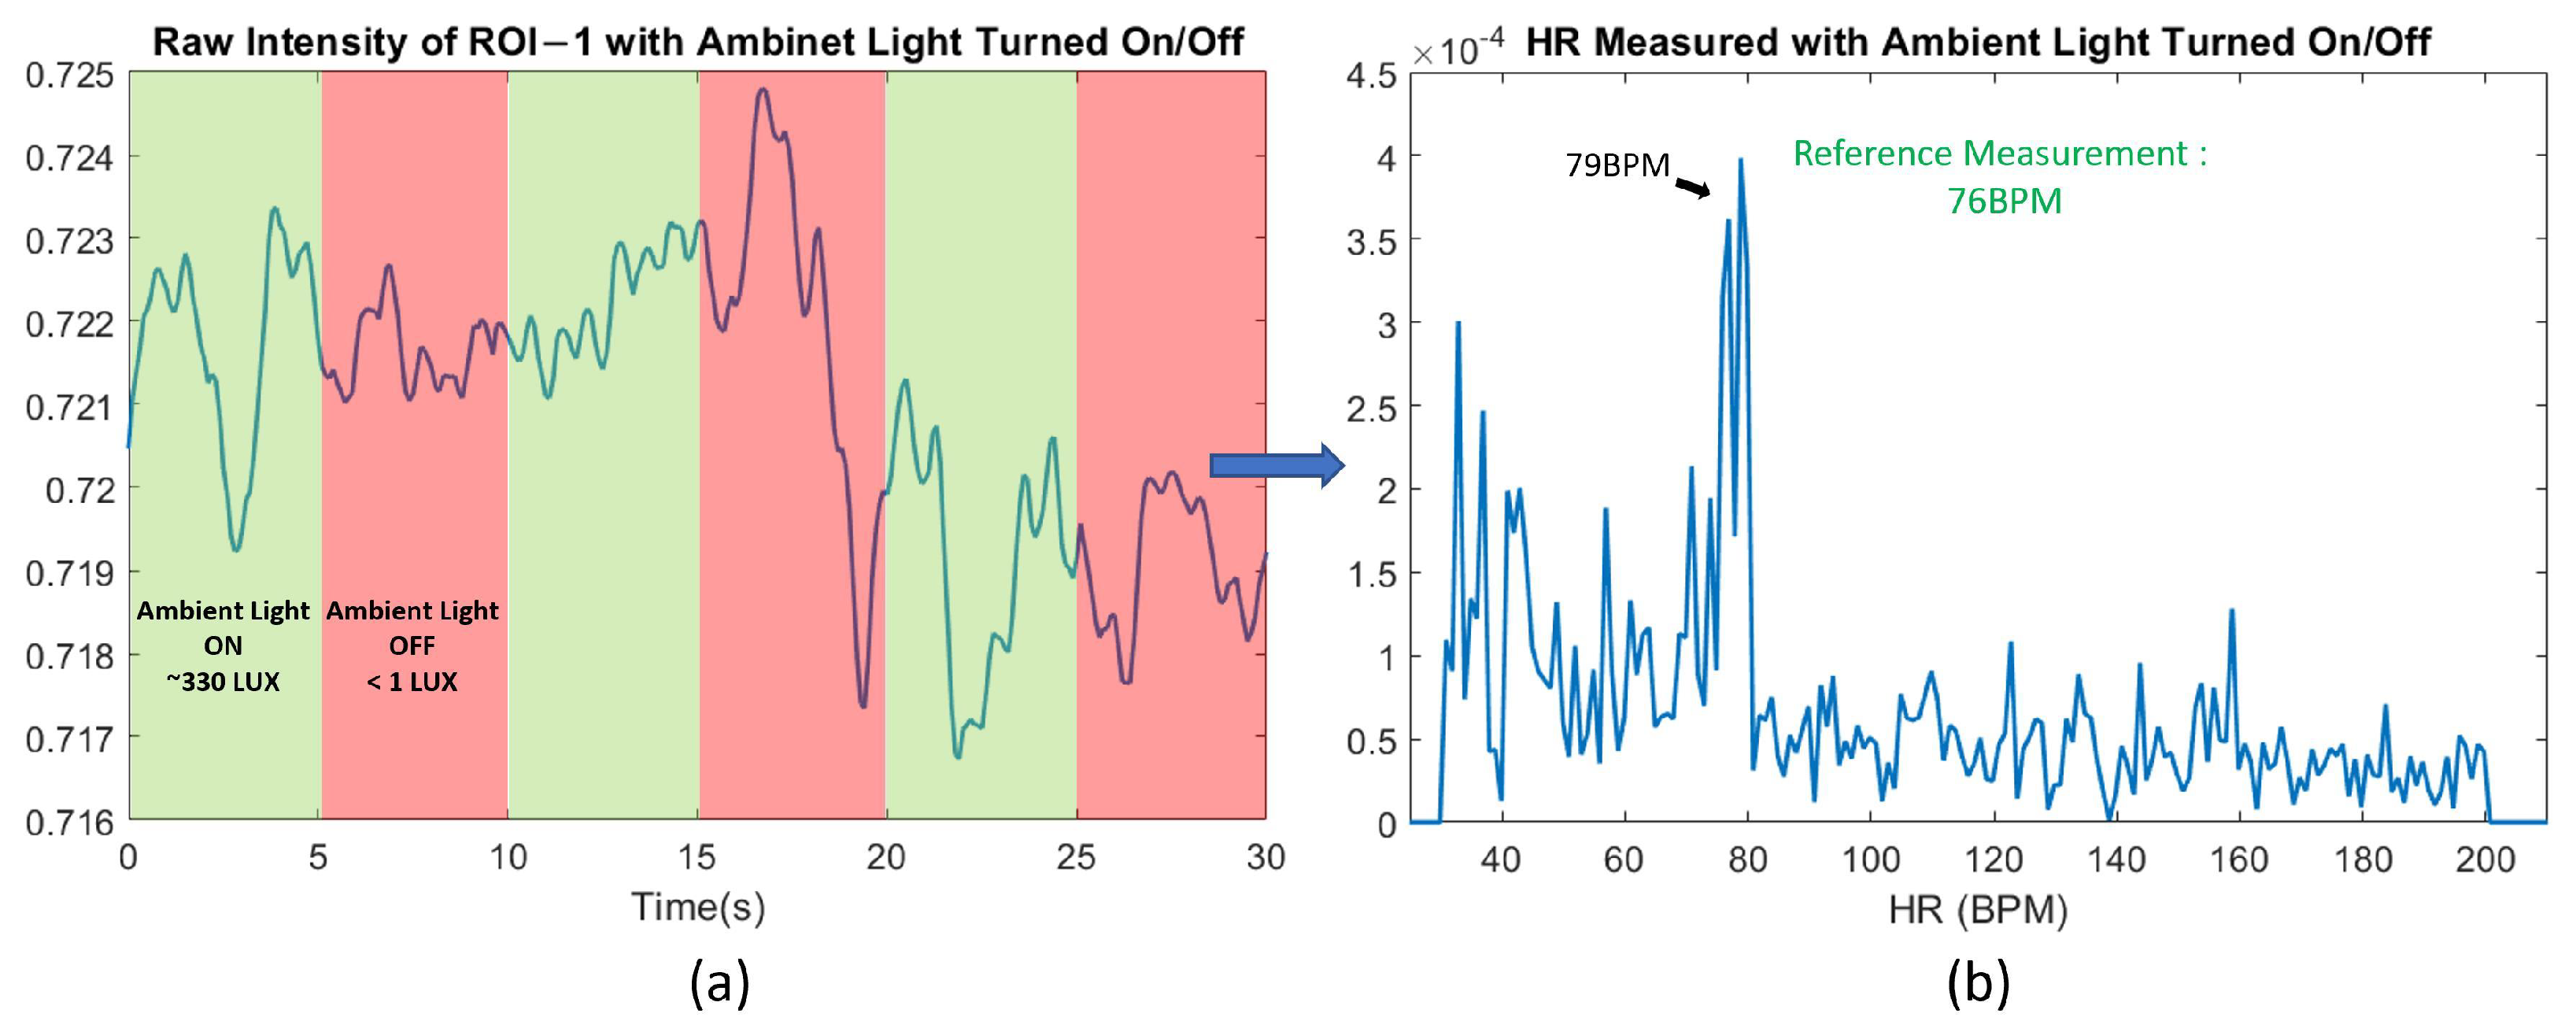
We also demonstrate that the ToF camera can operate under more extreme lighting conditions.
Figure 4 shows a measurement obtained with ambient light switched on and off at an interval of 5 s. When the ambient light is turned off, the background illumination intensity is less than 1 Lux while when the ambient light is turned on, the background illumination is 330 Lux. No significant effects of ambient light being turned on/off are seen in
Figure 4a and a correct HR measurement is still obtained with a Fourier transform.
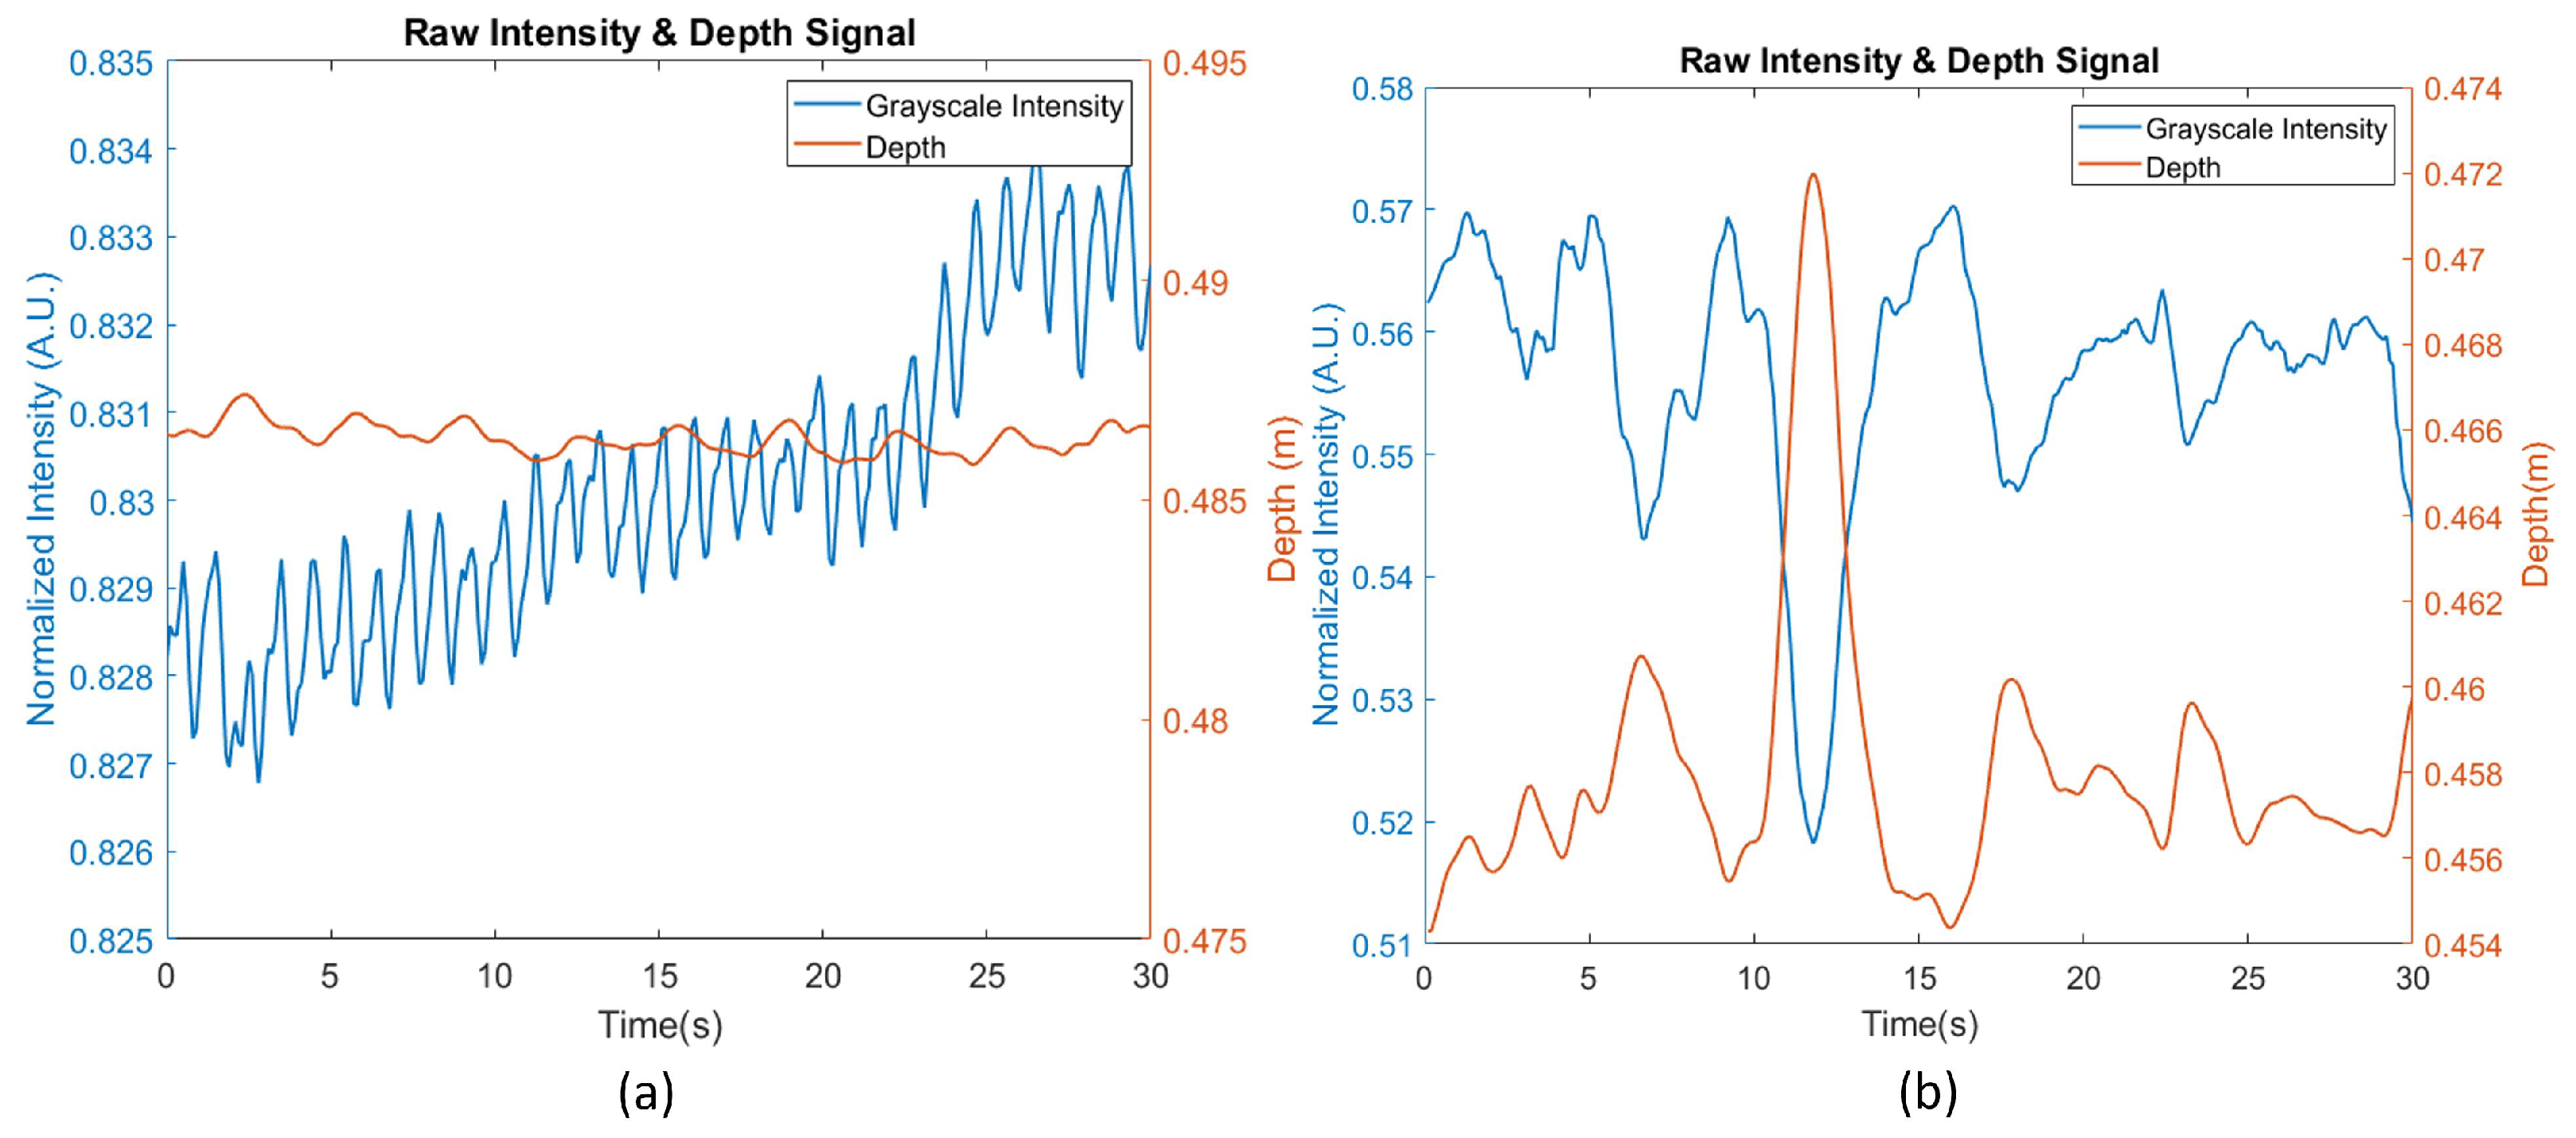
Motion artifact is a key source of noise in contactless HR measurements, especially on a system with low power and active illumination such as the one in this study. When no motion or very limited motion is present, the HR can be obtained directly from the raw grayscale intensity from the ToF camera, as is shown in
Figure 5a, during which the participant is asked to remain as still as possible. However, in more realistic scenarios, when the users are behaving naturally, there will inevitably be more motion artifacts present in the raw intensity data (
Figure 5b). Such motion artifacts are especially obvious in our system where active illumination from a point source is used. Intensity changes caused by the user moving closer or further from the light source can be many times stronger than the underlying heartbeat signal, leading to erroneous HR measurements (
Figure 5b).
Therefore, in this study, depth information is used to compensate for the intensity variation caused by motion artifacts. The underlying logic in the motion artifacts compensation is three-fold: First, because active illumination from a point source is used, the change of grayscale intensity is nonlinearly correlated to the relative position between the head and the camera. Secondly, the depth information recorded by the ToF camera should contain no heart rate component since the micromotion created by the heartbeat is too small to be measured by the ToF camera. Lastly, after the motion artifacts are removed, the compensated intensity information should have a minimum correlation with the depth information. In other words, the motion compensation is achieved when the relationship in Equation (
1) is satisfied, where
,
, and
are compensated grayscale intensity, raw average intensity across all pixels in ROI-1, and raw average depth signal across all pixels in ROI-1 respectively. a is the linear coefficient and b is the nonlinear coefficient that minimize the correlation between
and
Ideally, the intensity variation caused by the distance variation between the participants’ faces and the light source should be inversely proportional to the square of the distance (i.e., inverse square law of light propagation). However, in reality, skin conditions as well as the illumination angle change from person to person [
35,
36] and we found that different values of the nonlinear coefficients are needed to minimize the correlation between the
and
across different participants. In this study, the range of the nonlinear coefficient is set between 0.1 and 5.
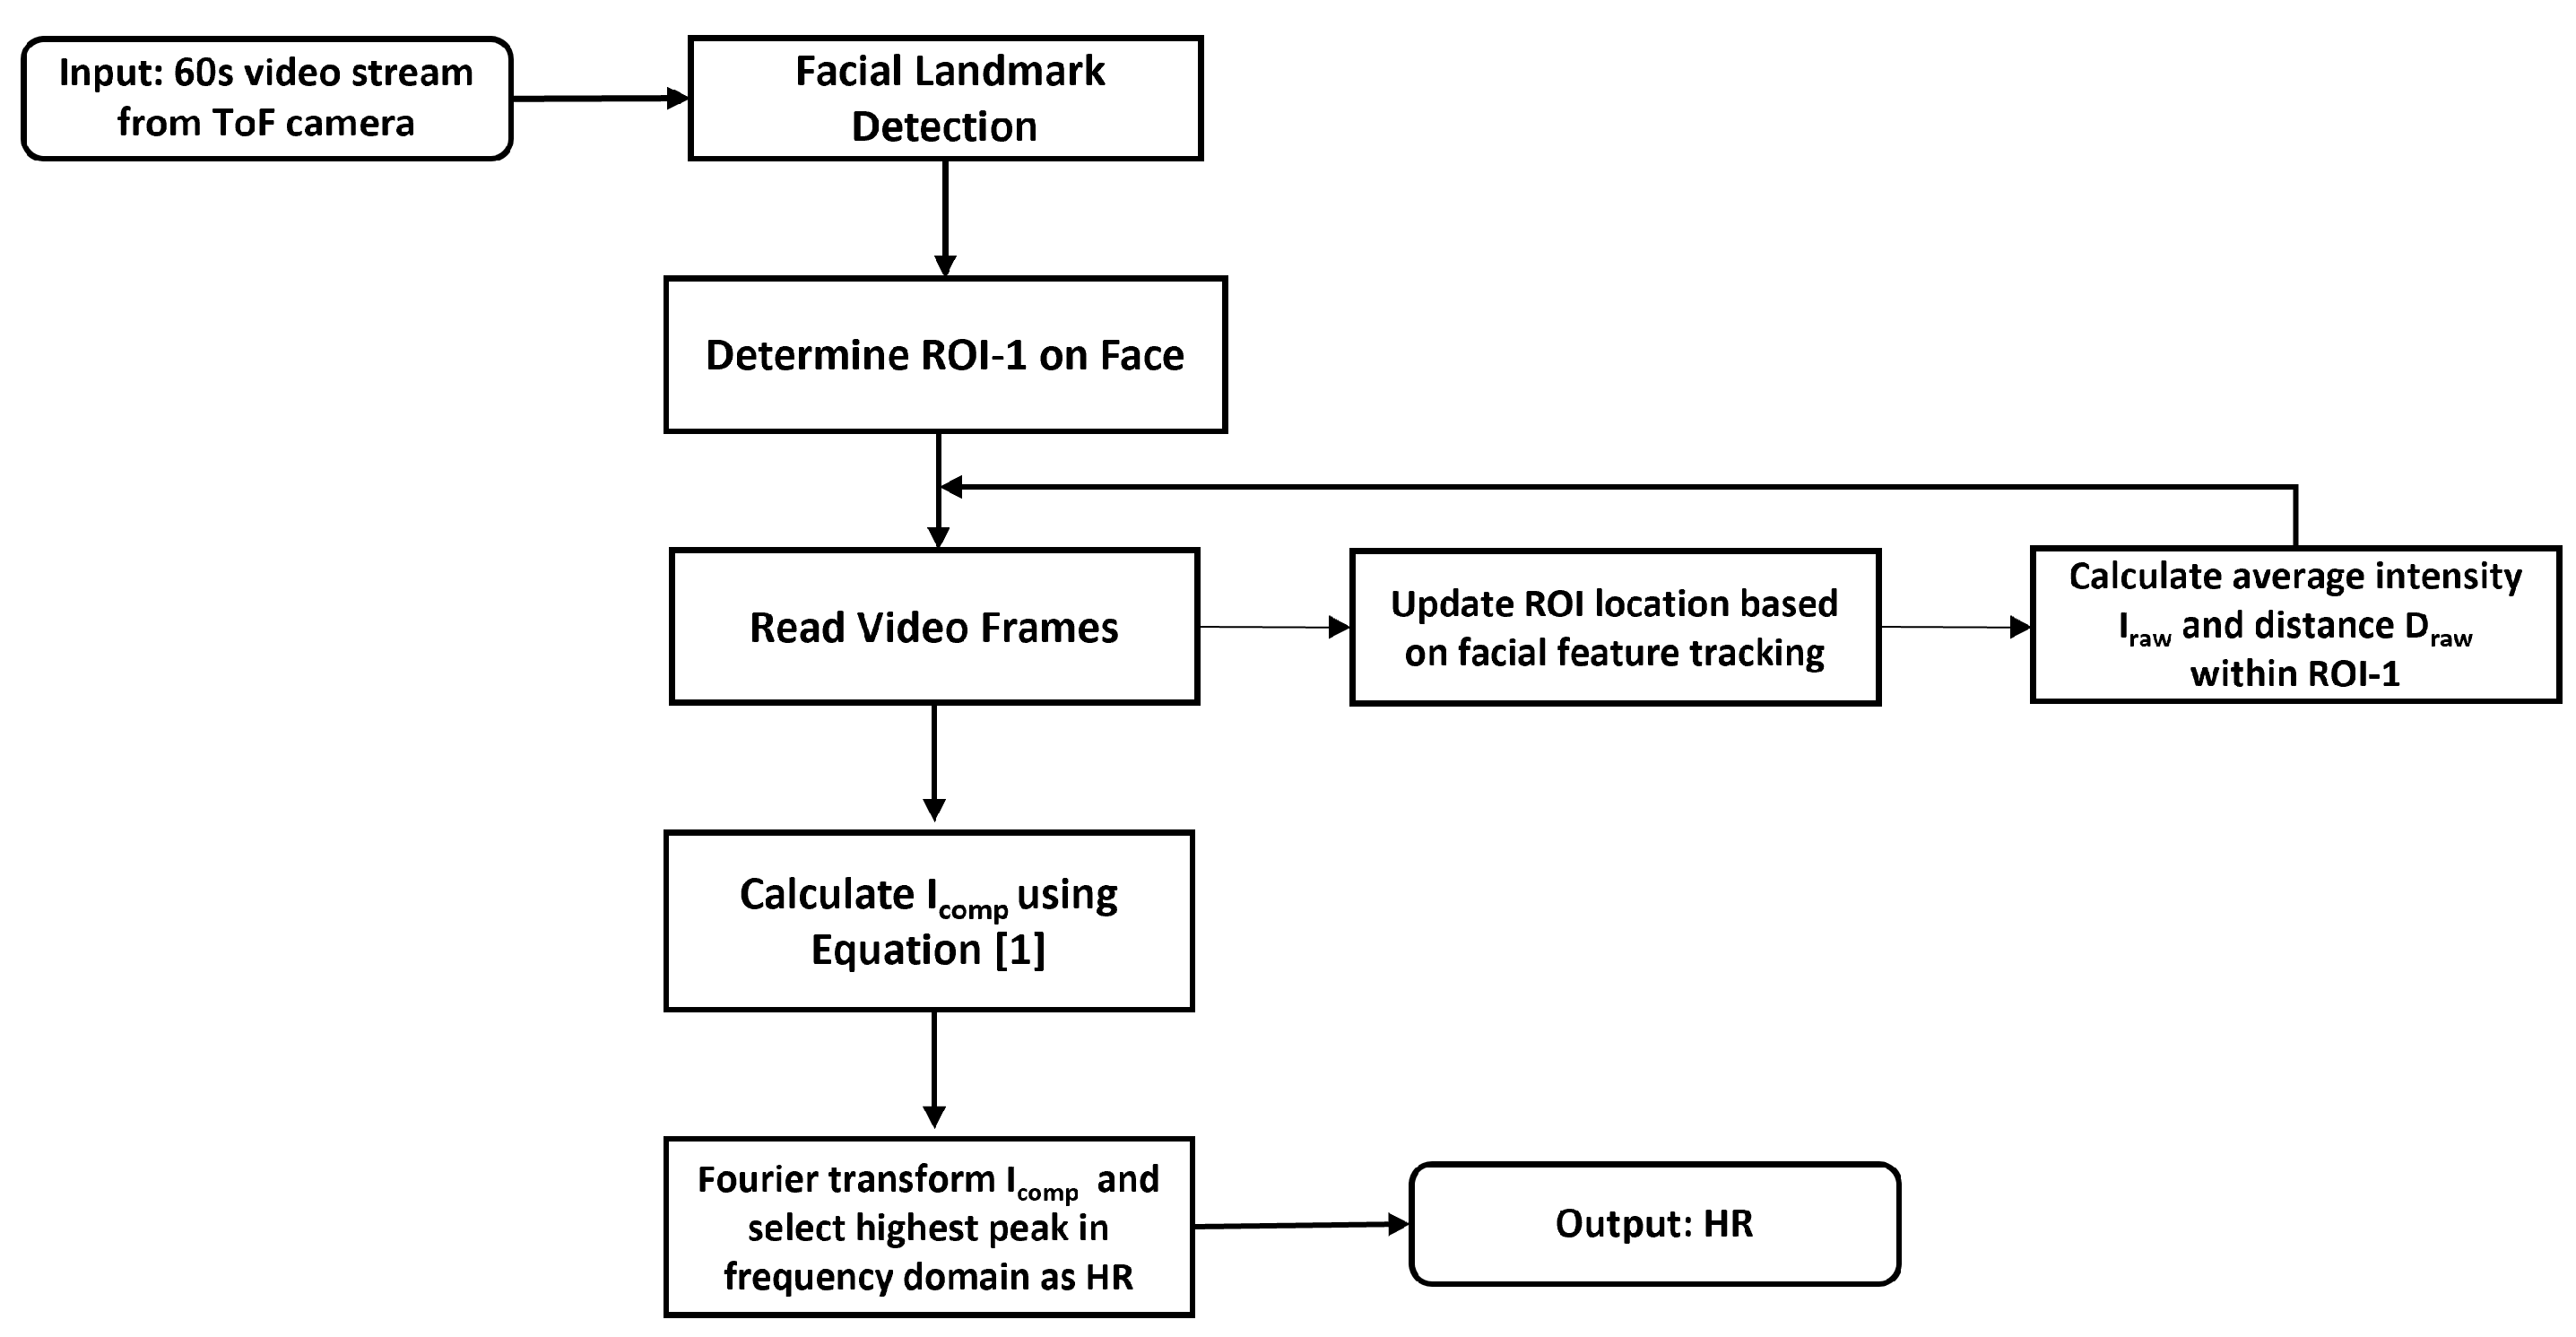
Based on the above logic, we compensate for the motion artifact and extract HR using the following steps (
Figure 6): (a) ROI-1 is defined and tracked in all frames using a Kanade–Lucas–Tomasi feature tracker [
37]; (b) the intensity across pixels within ROI-1 is averaged; (c) within a time window, using the relationship described in Equation (
1), we calculate the compensated intensity
that has the minimum correlation between the depth signal
and
; (d) a bandpass filter between 40 BPM and 150 BPM (which is the common resting HR range) is applied to the compensated signal
; (e) a Fourier transform of the data is taken on the motion-compensated intensity signal
to find the HR, where HR is determined as the frequency component with the highest amplitude. In this study, we compare the performance of the motion-compensated HR results against the results that “do not use the motion compensation”. The results that “do not use motion compensation” refer to HR reading derived using the same steps above except for the step of using the depth information to compensate for the motion artifacts.
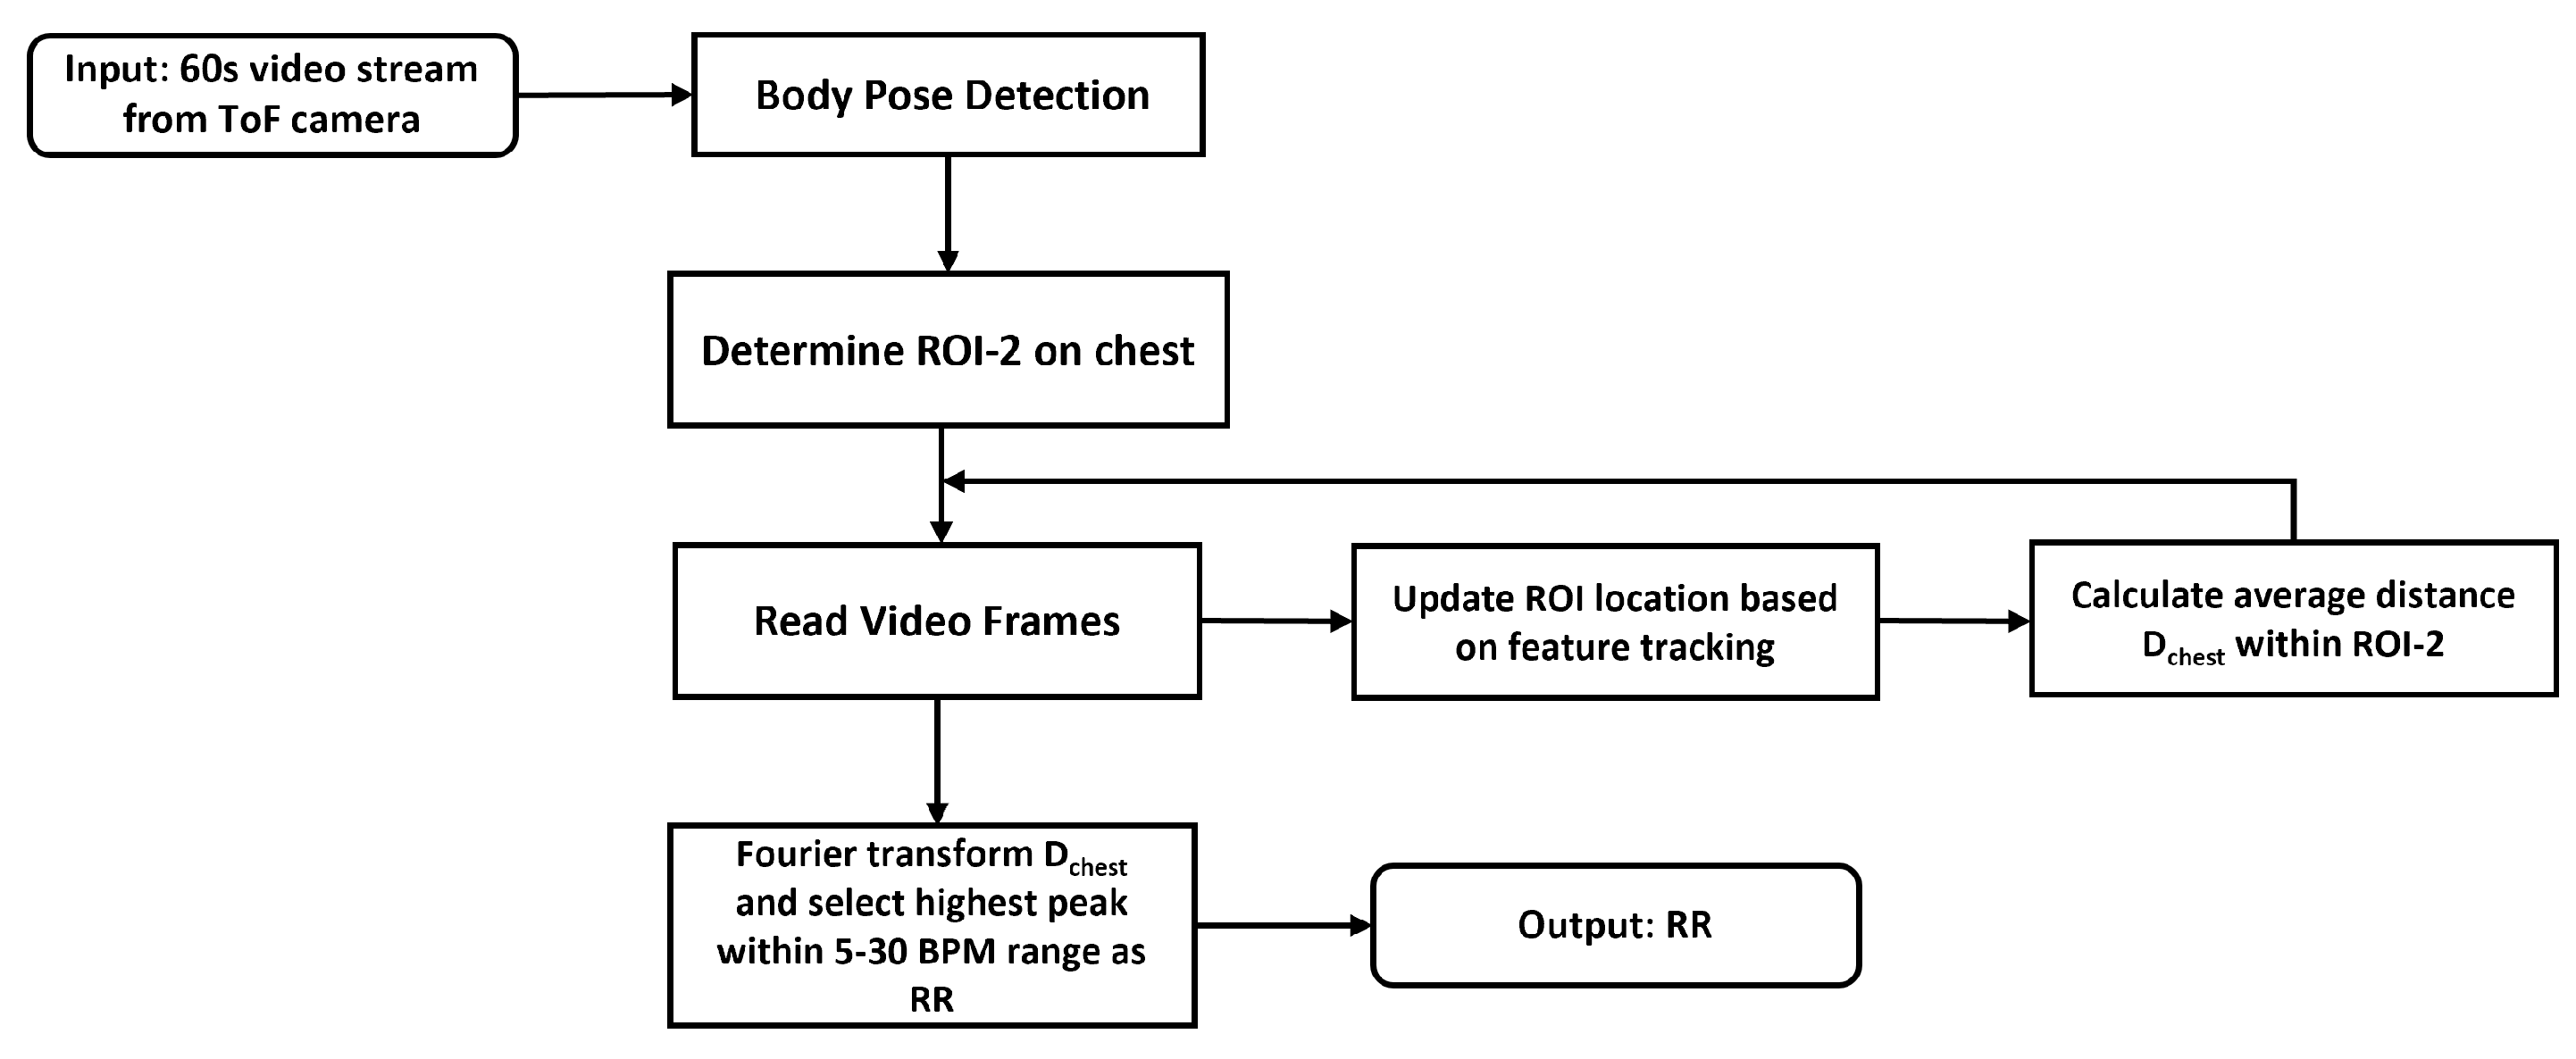
RR extraction is more straightforward as we directly measure the chest wall movement from respiration using the depth signal from the chest region. Specifically, RR is extracted using the following steps (
Figure 7): (a) ROI-2 is defined and tracked in all frames; (b) calculate the average depth across all pixels within ROI-2; (c) apply Fourier transform to the depth signal and apply bandpass filter between 5 BPM to 30 BPM to find the highest peak as the RR value.
To test the effectiveness of the HR/RR monitoring system, 29 participants from varying demographics were recruited in the study so that performance among different skin colors, genders, and ages could be compared. The study is approved by the Institutional Review Board at the University of Michigan and informed consent was obtained from every participant. All 29 participants were classified as either lighter skin color group or darker skin color group based on their Fitzpatrick skin type, a numerical classification for skin type based on a self-reported questionnaire [
38]. Participants with skin type I–III were classified into the lighter skin color group, while participants with skin type IV–VI were classified into the darker skin color group. A total of 17 participants in this study were within the lighter skin color group, while the remaining 12 participants were considered as being within the darker skin color group. In terms of gender, 18 participants were male and 11 participants female. As for age, we recruited participants from 18 years old to 72 years old. All participants were divided into groups older than 35 years old and younger than 35 years old. In this study, 8 participants were older than 35 years old and the remaining 21 participants were younger than 35 years old. The demographics of the participants are shown in
Table 3. A total of 10 60 s videos at 10 frames per second are obtained from each participant. To mimic the real-world scenario, participants were asked to sit in front of the camera and are allowed to move as they see comfortable (such as leaning backward/forward) but they were asked to look toward the camera during the measurements. Among the 290 measurements, 4 measurements were excluded in the study due to the failure of the face recognition algorithm to identify the regions of interest (ROIs). In the end, 286 measurements were used in the study.
4. Experiment Results
The raw and processed data from the two ROIs are illustrated in
Figure 8 and
Figure 9.
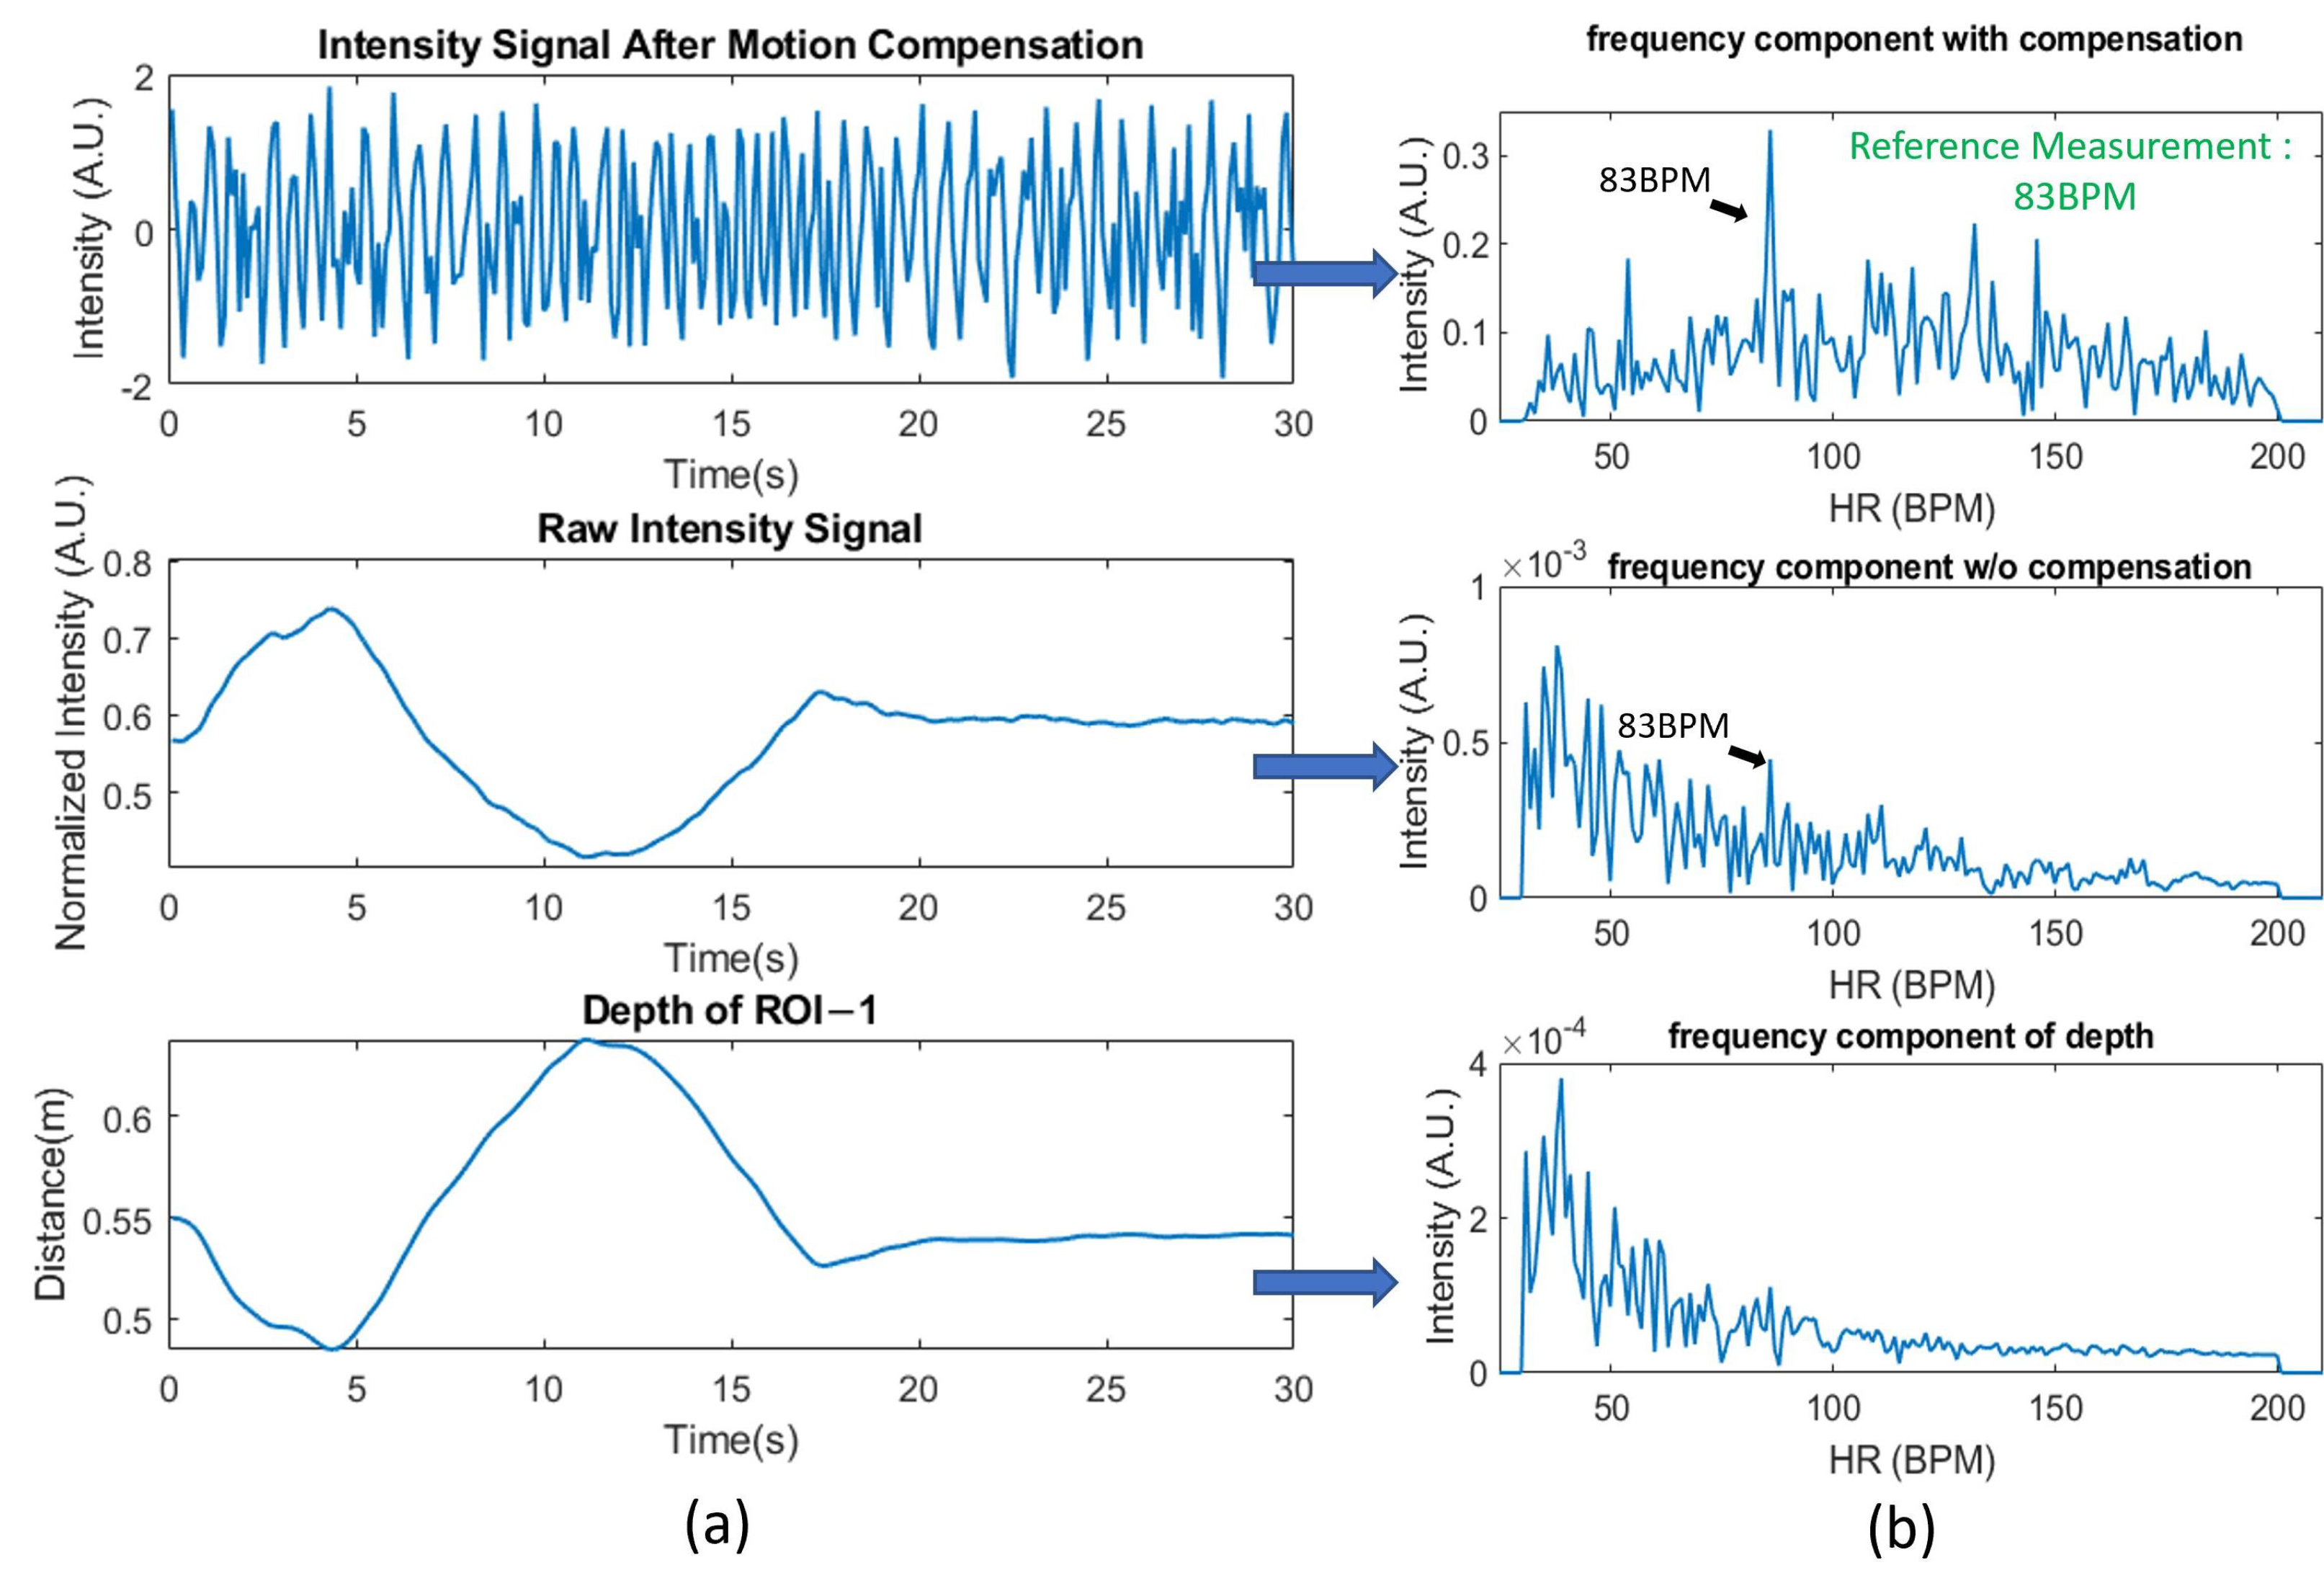
Figure 8 shows a 30 s segment of a typical 60 s recording of both the raw intensity and depth signal for ROI-1. The second row corresponds to the raw intensity information and the bottom row corresponds to the depth information from the same ROI-1. In ROI-1, the maximum motion from ROI-1 to the camera is as large as 15 cm. As a result, the raw intensity data is strongly inversely correlated to the depth information from the same ROI, suggesting that the raw signal is dominated by the motion artifacts. The grayscale intensity after motion compensation is shown on the top row of
Figure 8 where most of the motion artifacts in the depth information are removed. From the time-domain signal, the heart rate signal becomes recognizable compared to the motion-dominated raw signal. The effect of the motion artifacts as well as the benefits of depth-based motion compensation is also evident in the frequency domain. When comparing the frequency domain signal of the raw intensity and the depth signal, we can see the two spectra are similar to each other in shape, and they also share many common lower frequency components. Even though a weak frequency peak near the reference HR of 83 BPM can be seen, it is overshadowed by the frequency component from the motion artifacts. After the motion compensation, we can see that in the frequency domain signal of the compensated signal (
Figure 8b, top), these artifact frequencies are suppressed and a clear HR frequency near 83 BPM can be seen in the compensated spectrum.
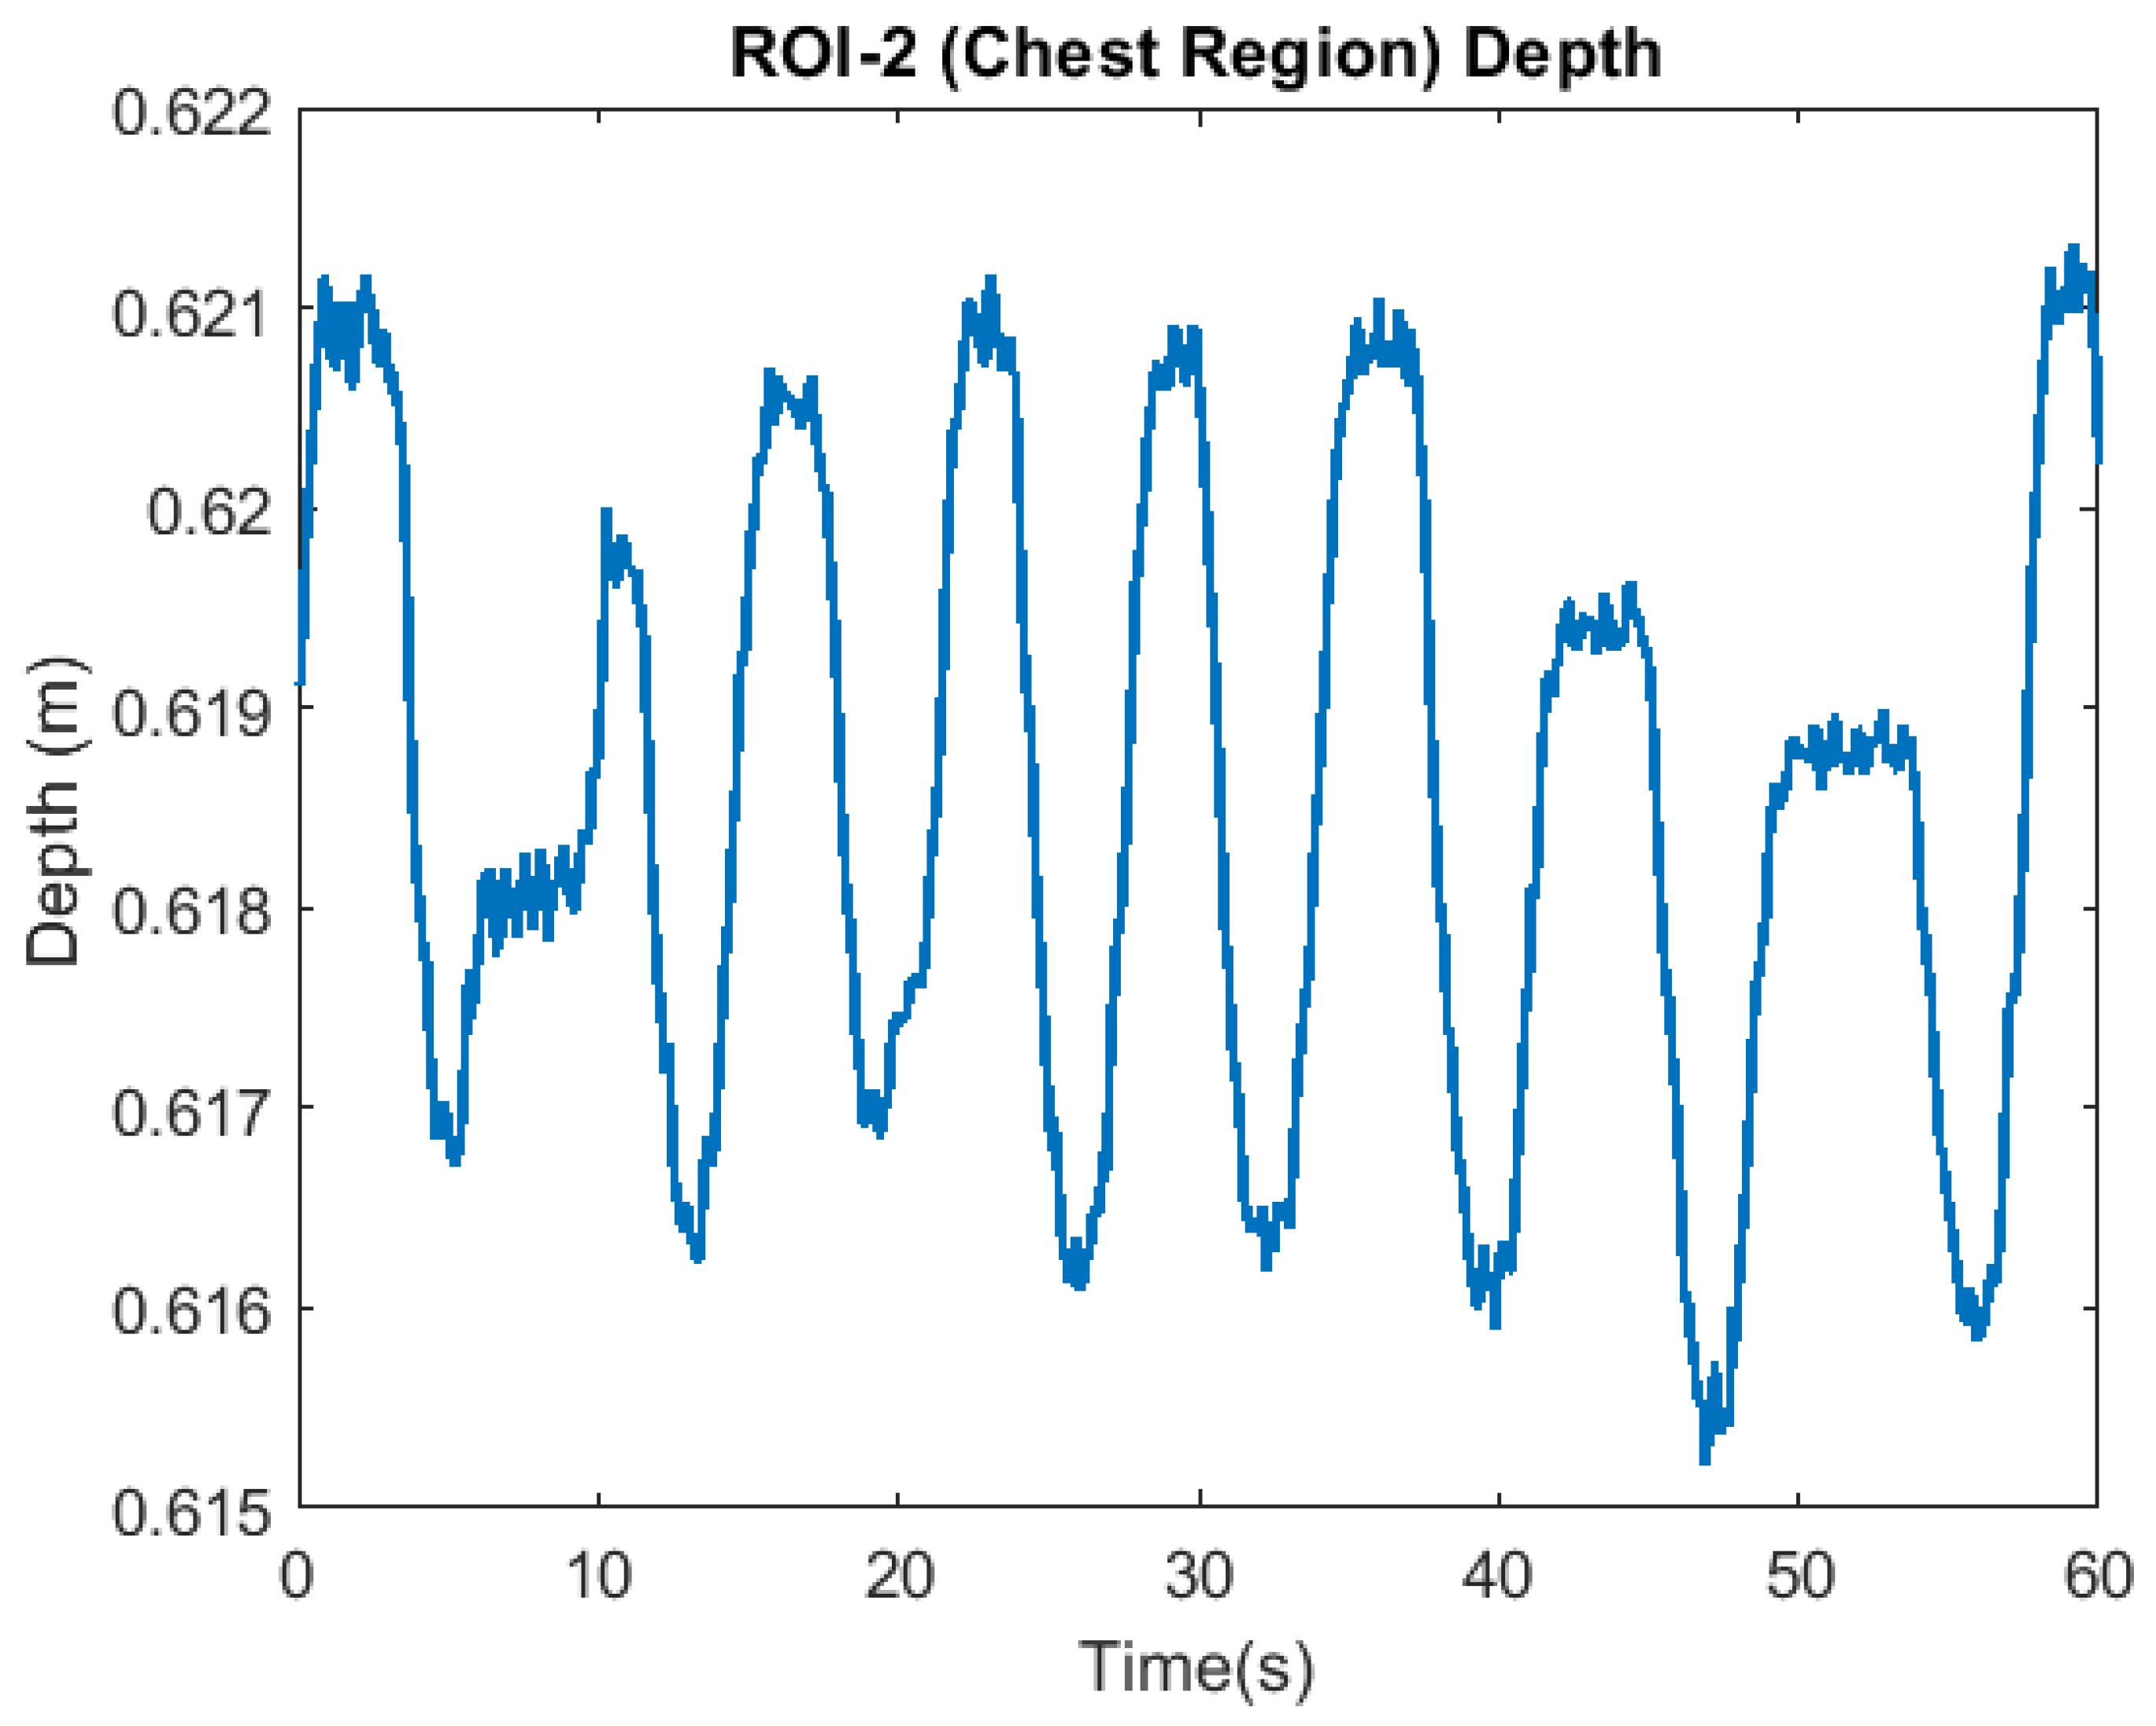
As for the respiration rate measurement,
Figure 9 shows a typical depth signal from the ROI-2 (chest) region corresponding to a RR of 9 BPM. The amplitude of chest wall displacement caused by the respiration motion is approximately 4 mm. Because of this small amplitude, such motion could be affected by other factors such as overall body motion as well the blockage of clothing. Some potential solutions to mitigate these issues will be discussed in the discussion section.
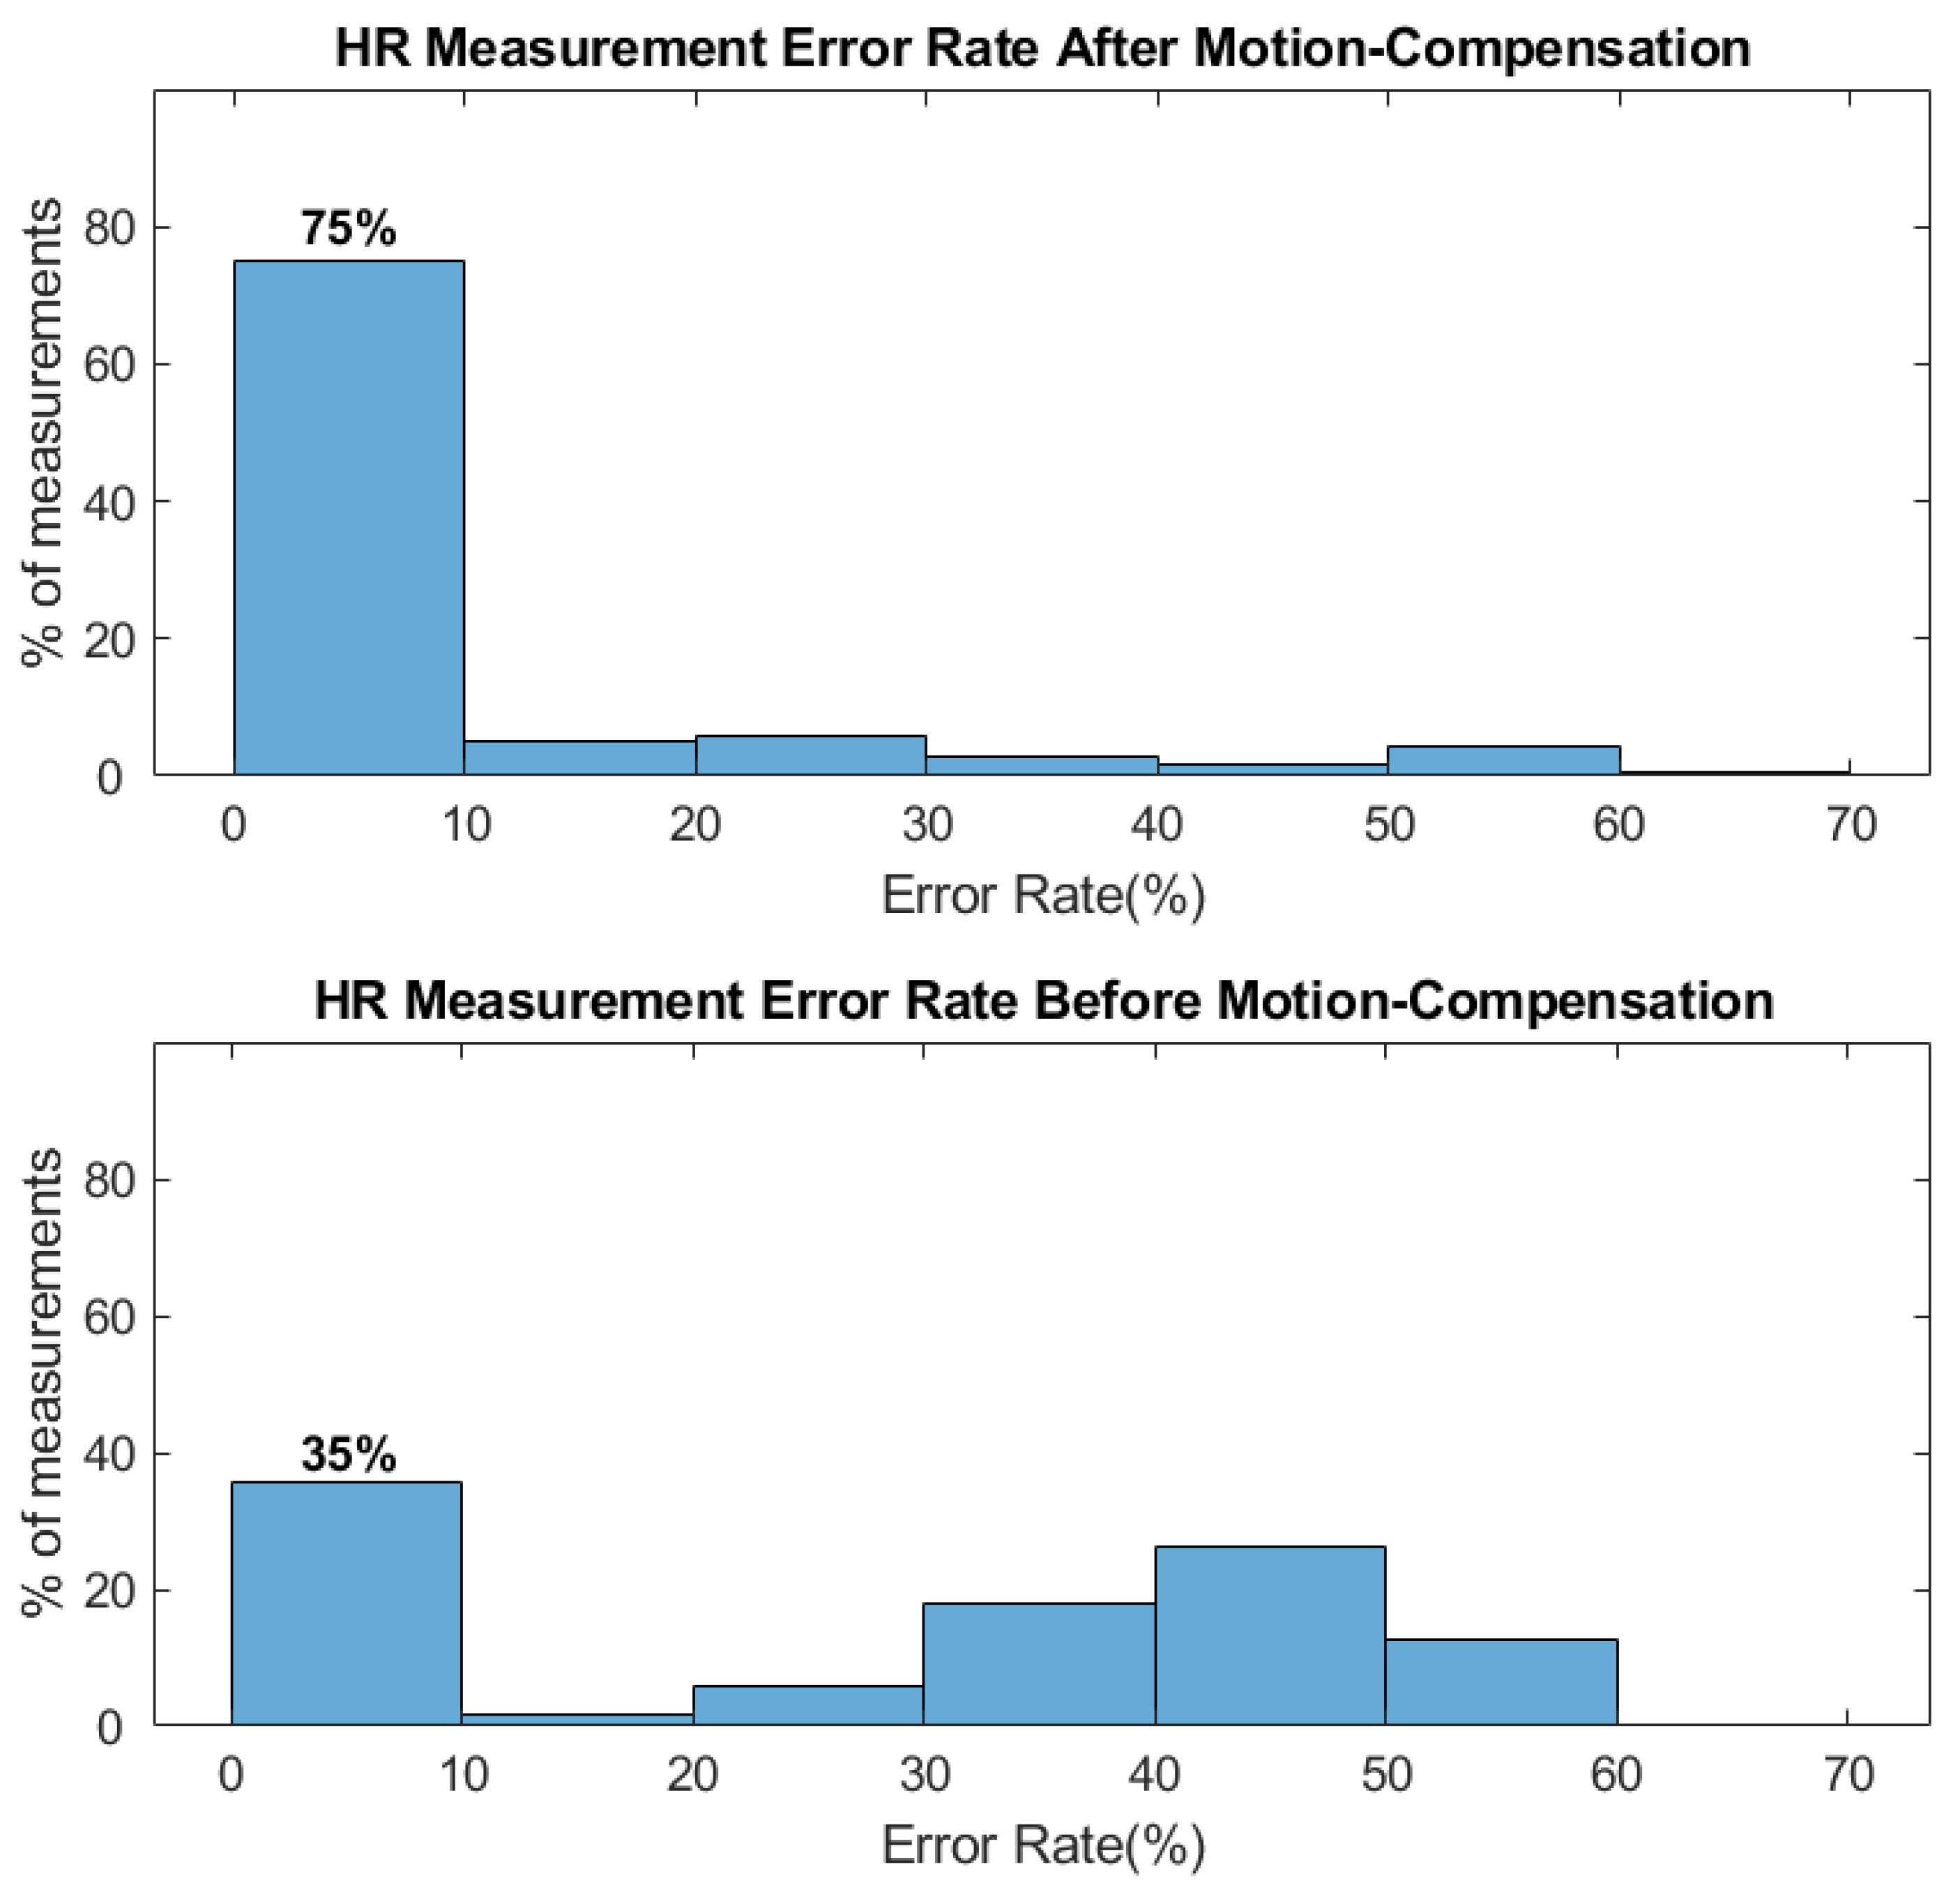
The pilot human study with 29 participants illustrates the improvement in overall performance achieved for the HR measurements by using depth information compensation. In the study, the mean HR reading during the 60 s of measurement is considered as the ground truth and the “correct measurement” from our system is defined as a HR measurement that is within 10 percent of the ground truth. The top bar graph in
Figure 10 demonstrates the distribution of measurement error rate after compensation, while the bottom bar graph demonstrates the distribution of measurement error rate without depth compensation. With depth information used to compensate for motion artifacts, 75% of the HR measurements (214 out of 286 measurements) are correct. On the other hand, without compensation, only 35% of the HR measurements (100 out of 286 tests) are correct. It is also worth noticing that with motion compensation, many of the erroneous measurements are below 30% error rate, as compared to between 50 and 60% for the uncompensated case.
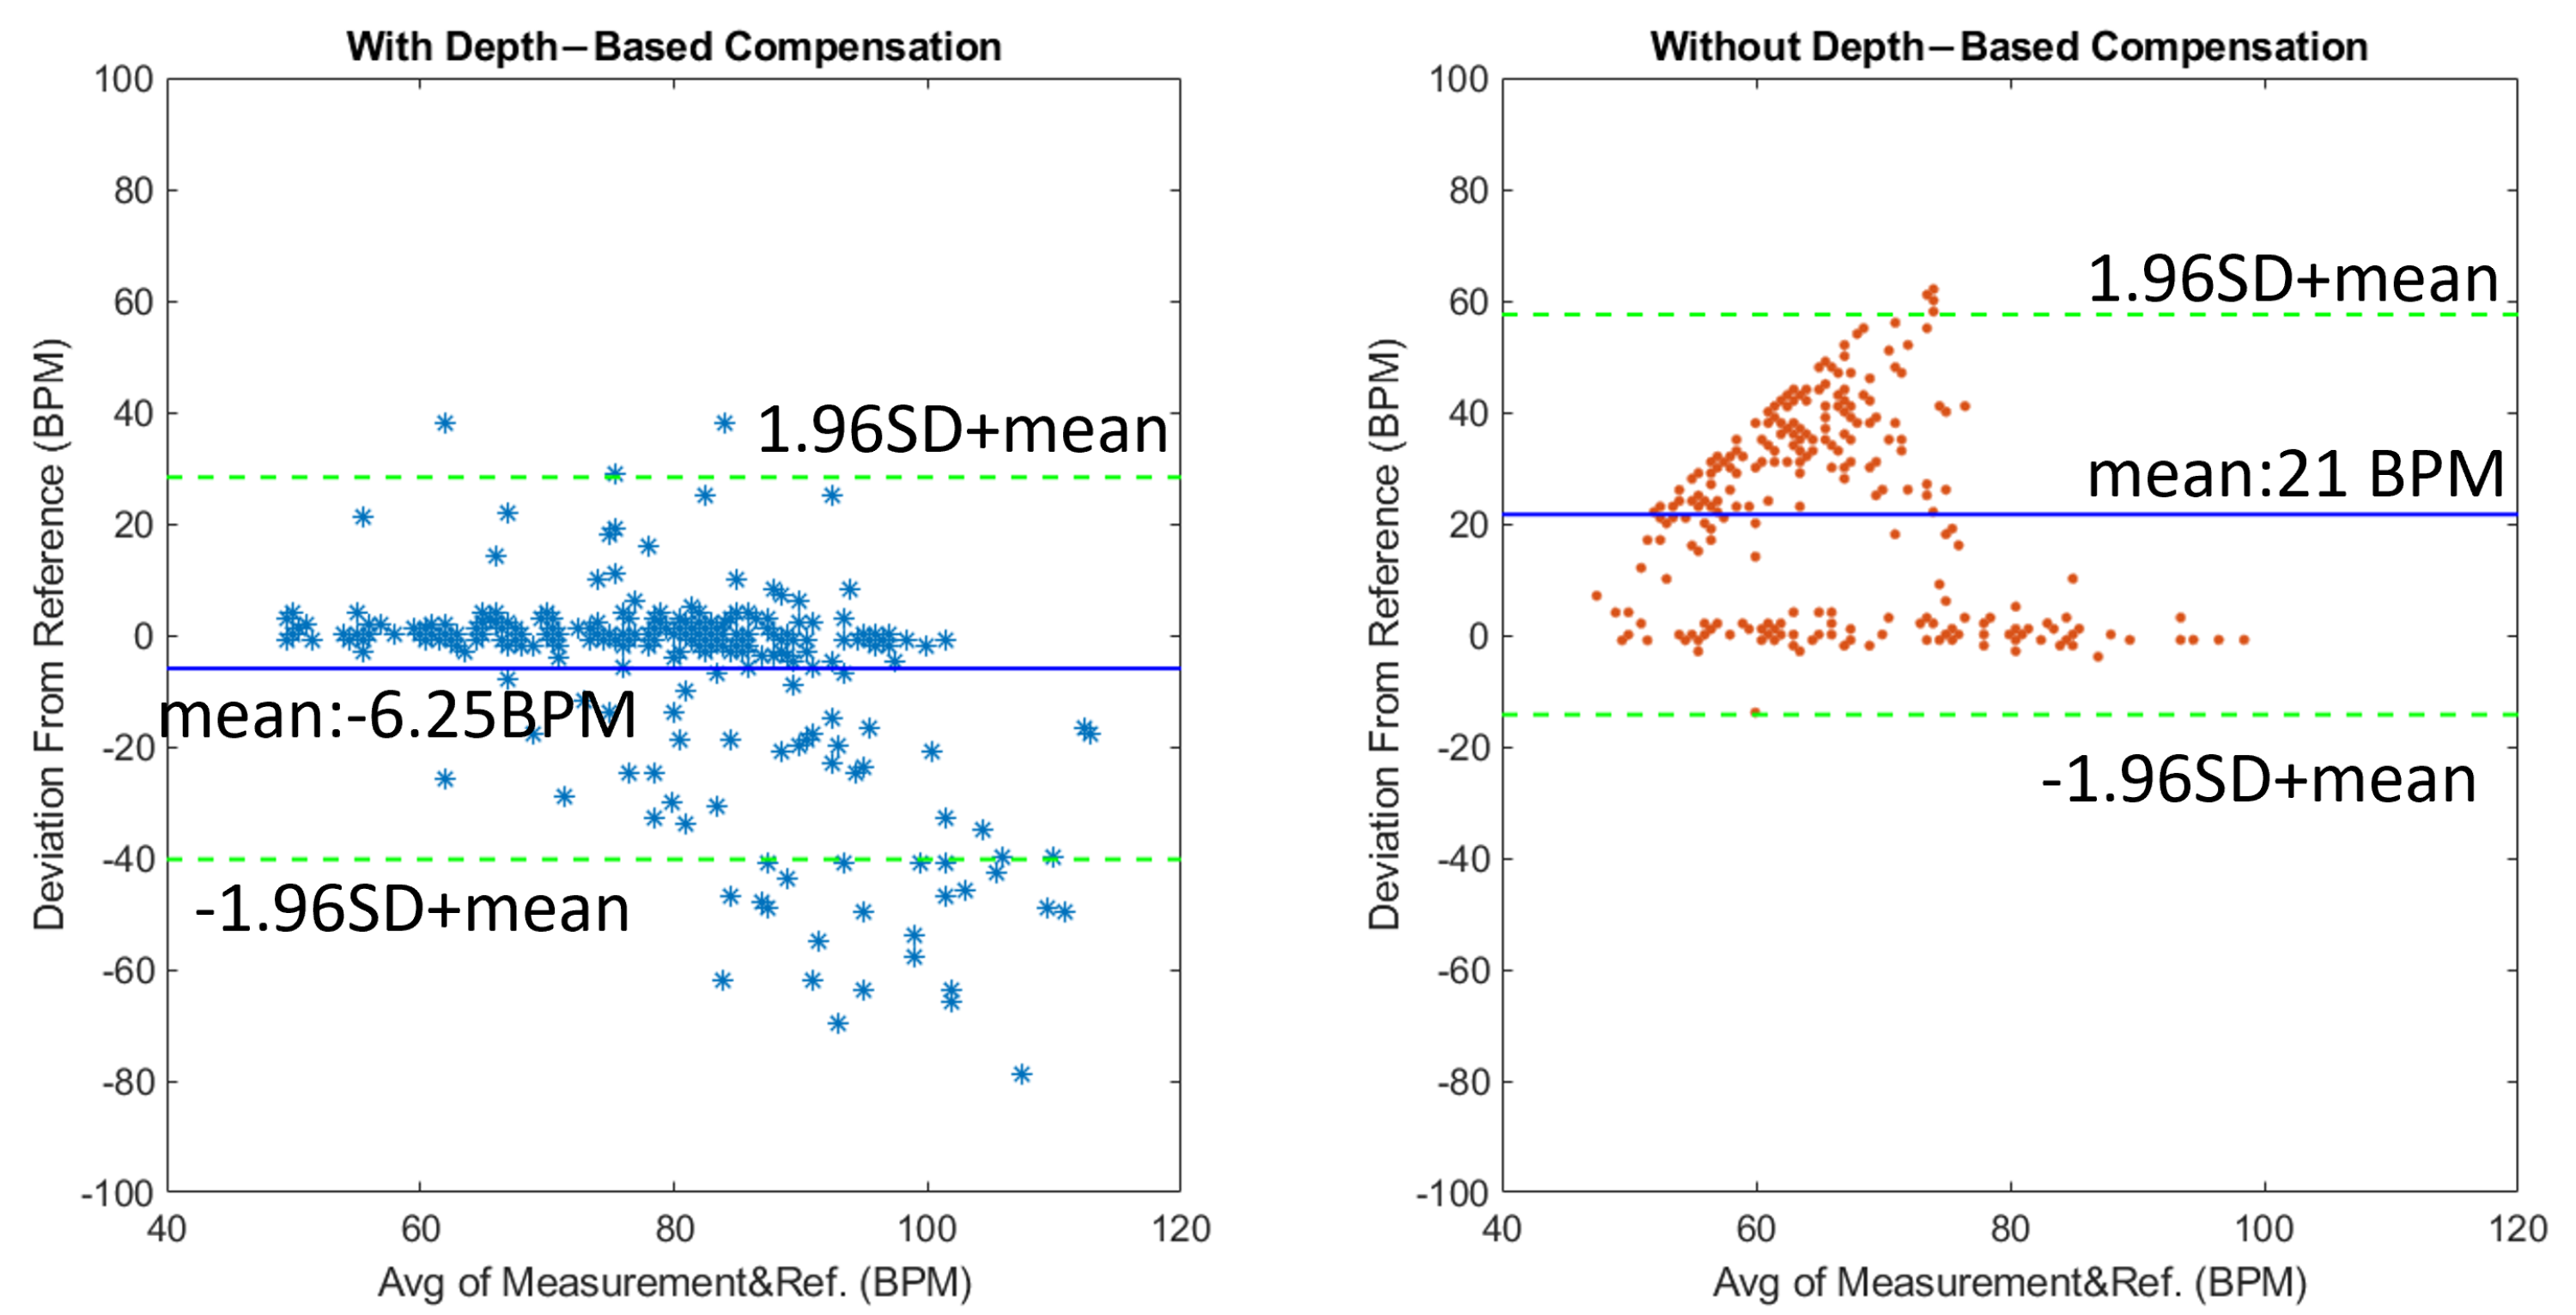
To analyze the agreement between the reference device (finger pulse oximeter) against our system, we plot the Bland–Altman plot for the HR from the 29 participant study in
Figure 11. The left plot illustrates the results with motion compensation, and the right plot illustrates the results without using motion compensation. The
x-axis is the average HR reading of the reference oximeter and our ToF-based system, while the
y-axis is the deviation of the HR measured in the ToF system from the reference oximeter reading. With compensation, the mean value of the deviation is −6.25 BPM, and 95% of the deviation falls within +/− 35 BPM of the mean deviation. In contrast, without compensation the mean value of the deviation is 21 BPM, and 95% of the deviation falls within +/− 36 BPM of the mean deviation. The large standard deviation rises from the extreme erroneous values of the measurement system. These extreme values rise from camera noises as well as intensity artifacts that are not reflected in the depth signal. After the dominating motion artifacts are removed, the system could wrongly pick up these artifacts as HR. This also explains why the wrong measurements of the uncompensated signal groups around the top left corner of the plot since the dominating motion artifacts are typically at a lower frequency compared to HR. Additionally, because the motion artifacts are likely to be mistakenly picked as HR, it also leads to the seemingly small standard deviation of errors for the uncompensated HR measurements.
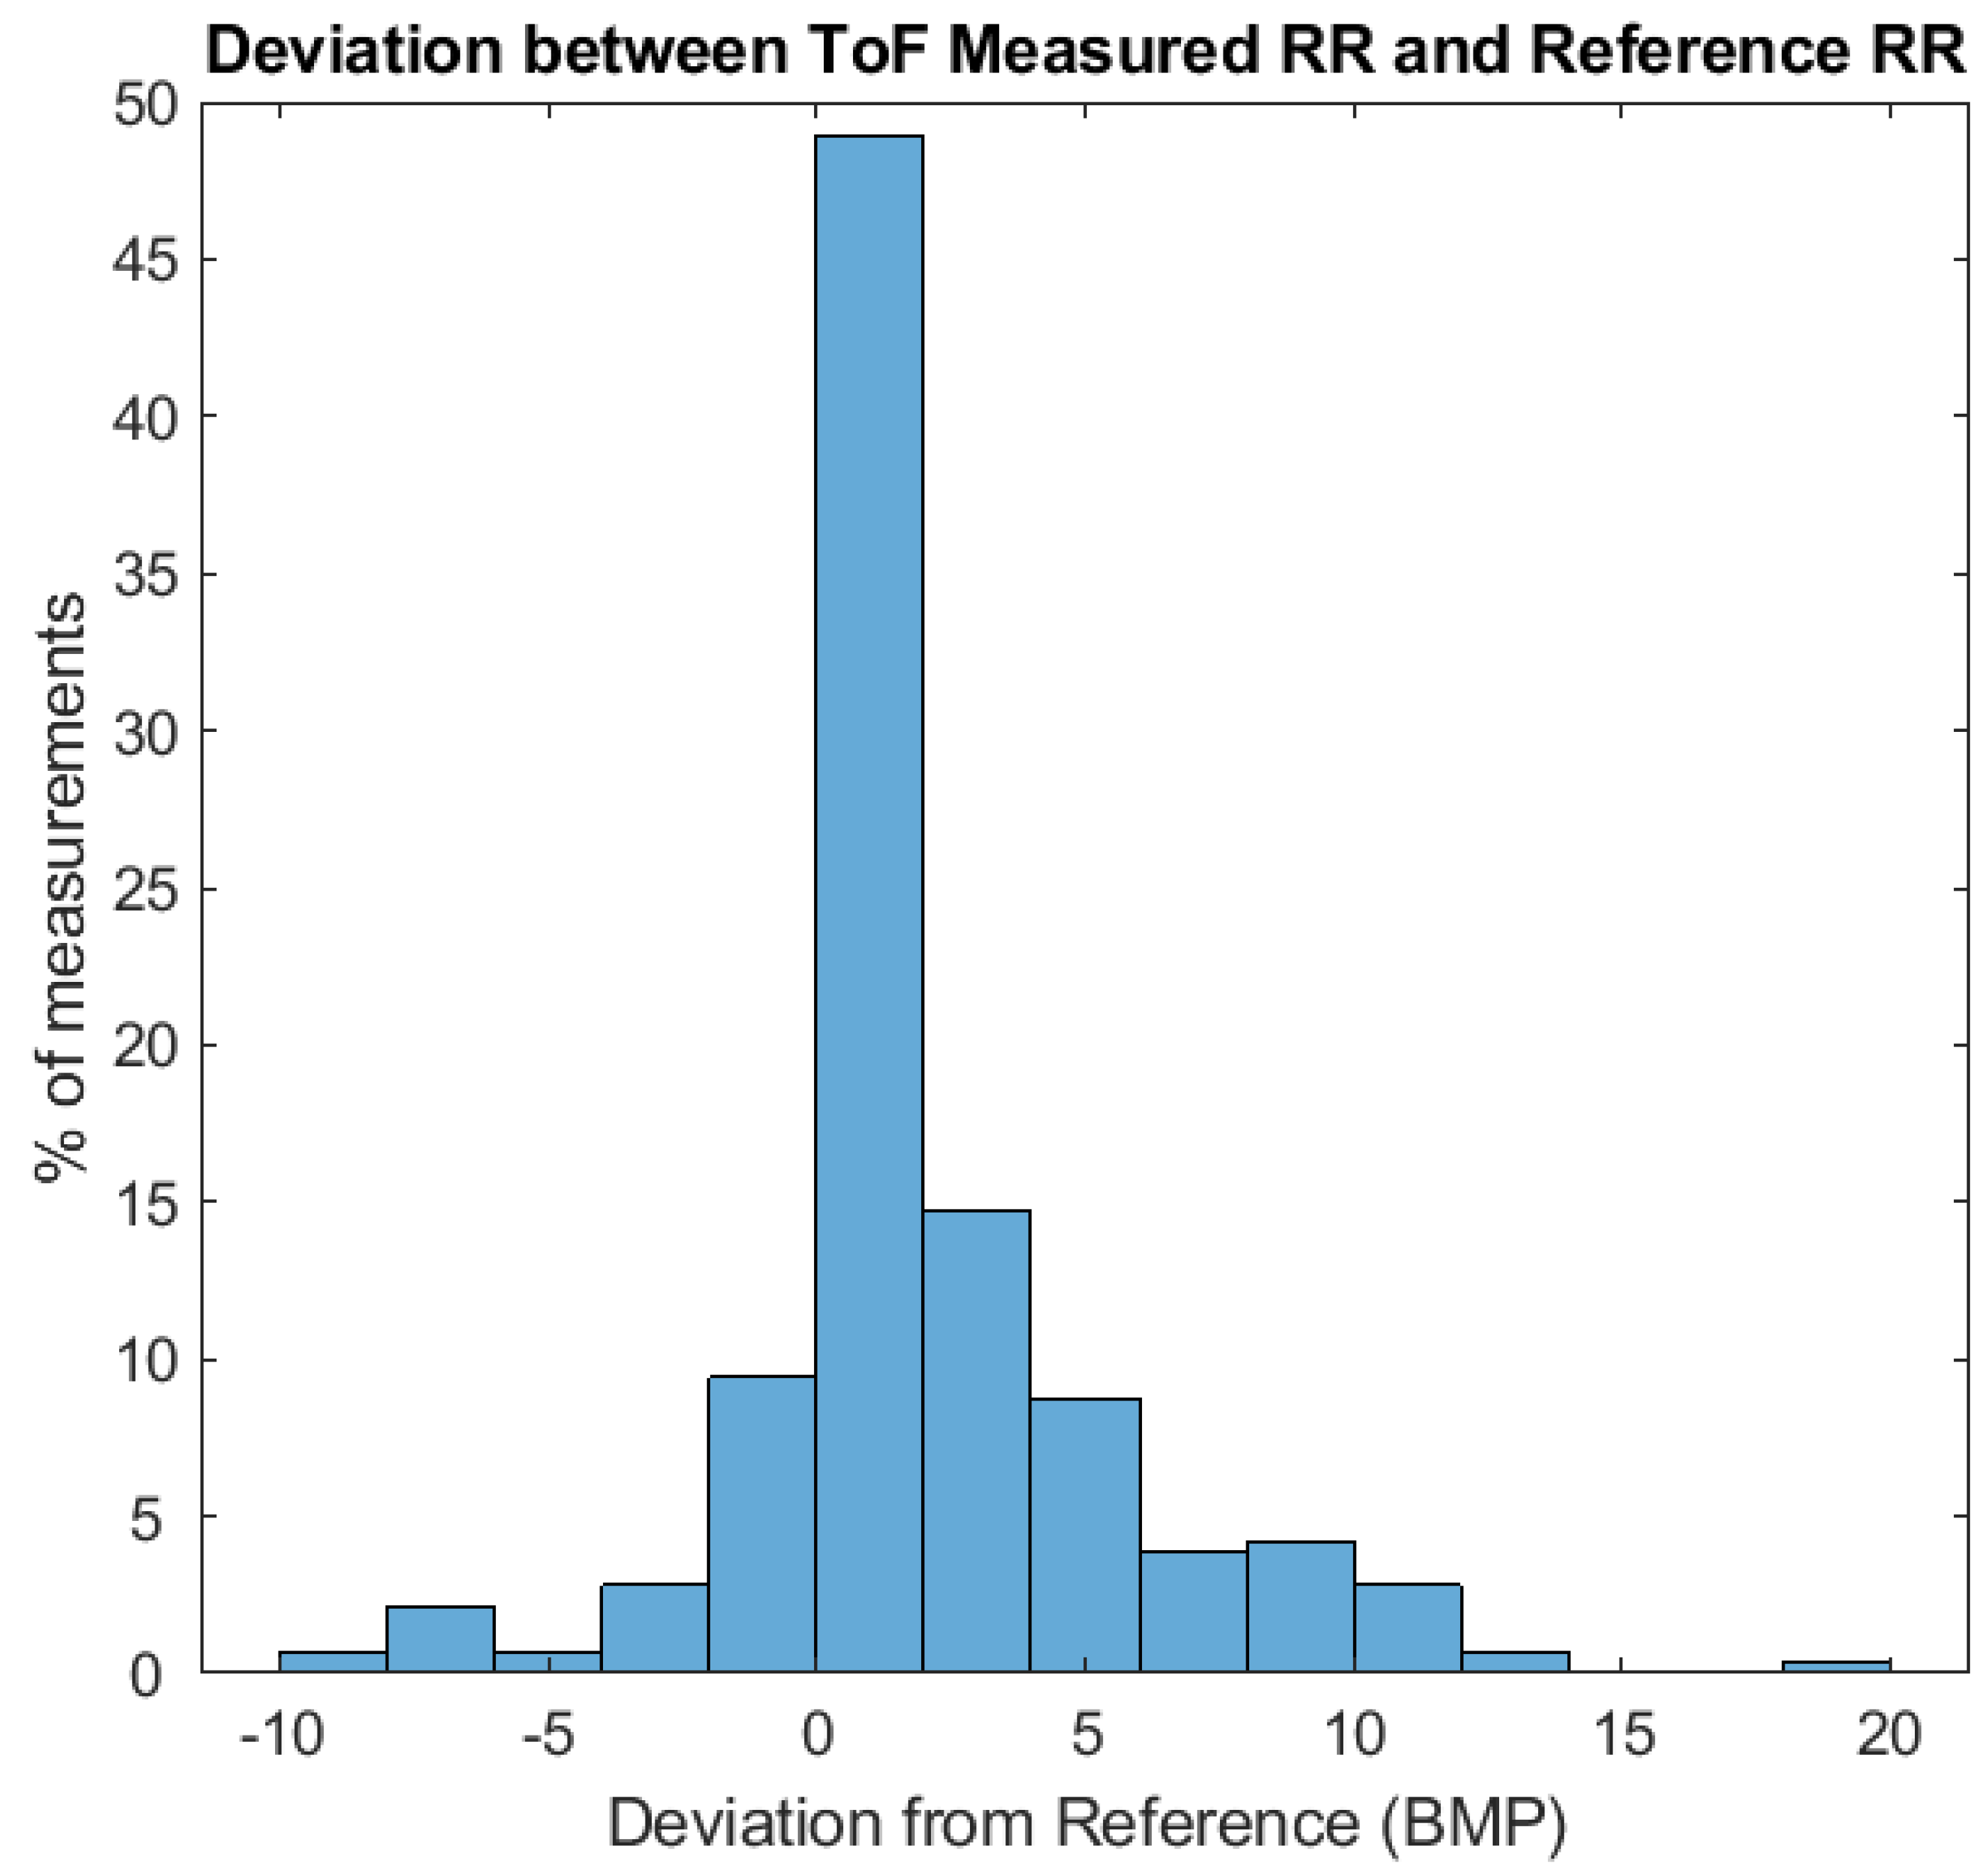
The RR measurements are also examined for the pilot study of 29 participants.
Figure 12 shows the percentage of 286 ToF-based RR measurements that fall into different bins of deviation from the reference Masimo pulse oximeter. The mean deviation from the reference reading is found to be 1.7 BPM while 60% of measurements are within +/− 2 BPM from the reference RR measurements. However, in our measurements, we can also sometimes see deviation as large as 10 BPM, these errors can be attributed to large body motion as well as the loose clothing that the participants are wearing. Some examples will be discussed in the discussion section.
4.1. HR Measurement vs. Motion Artifacts
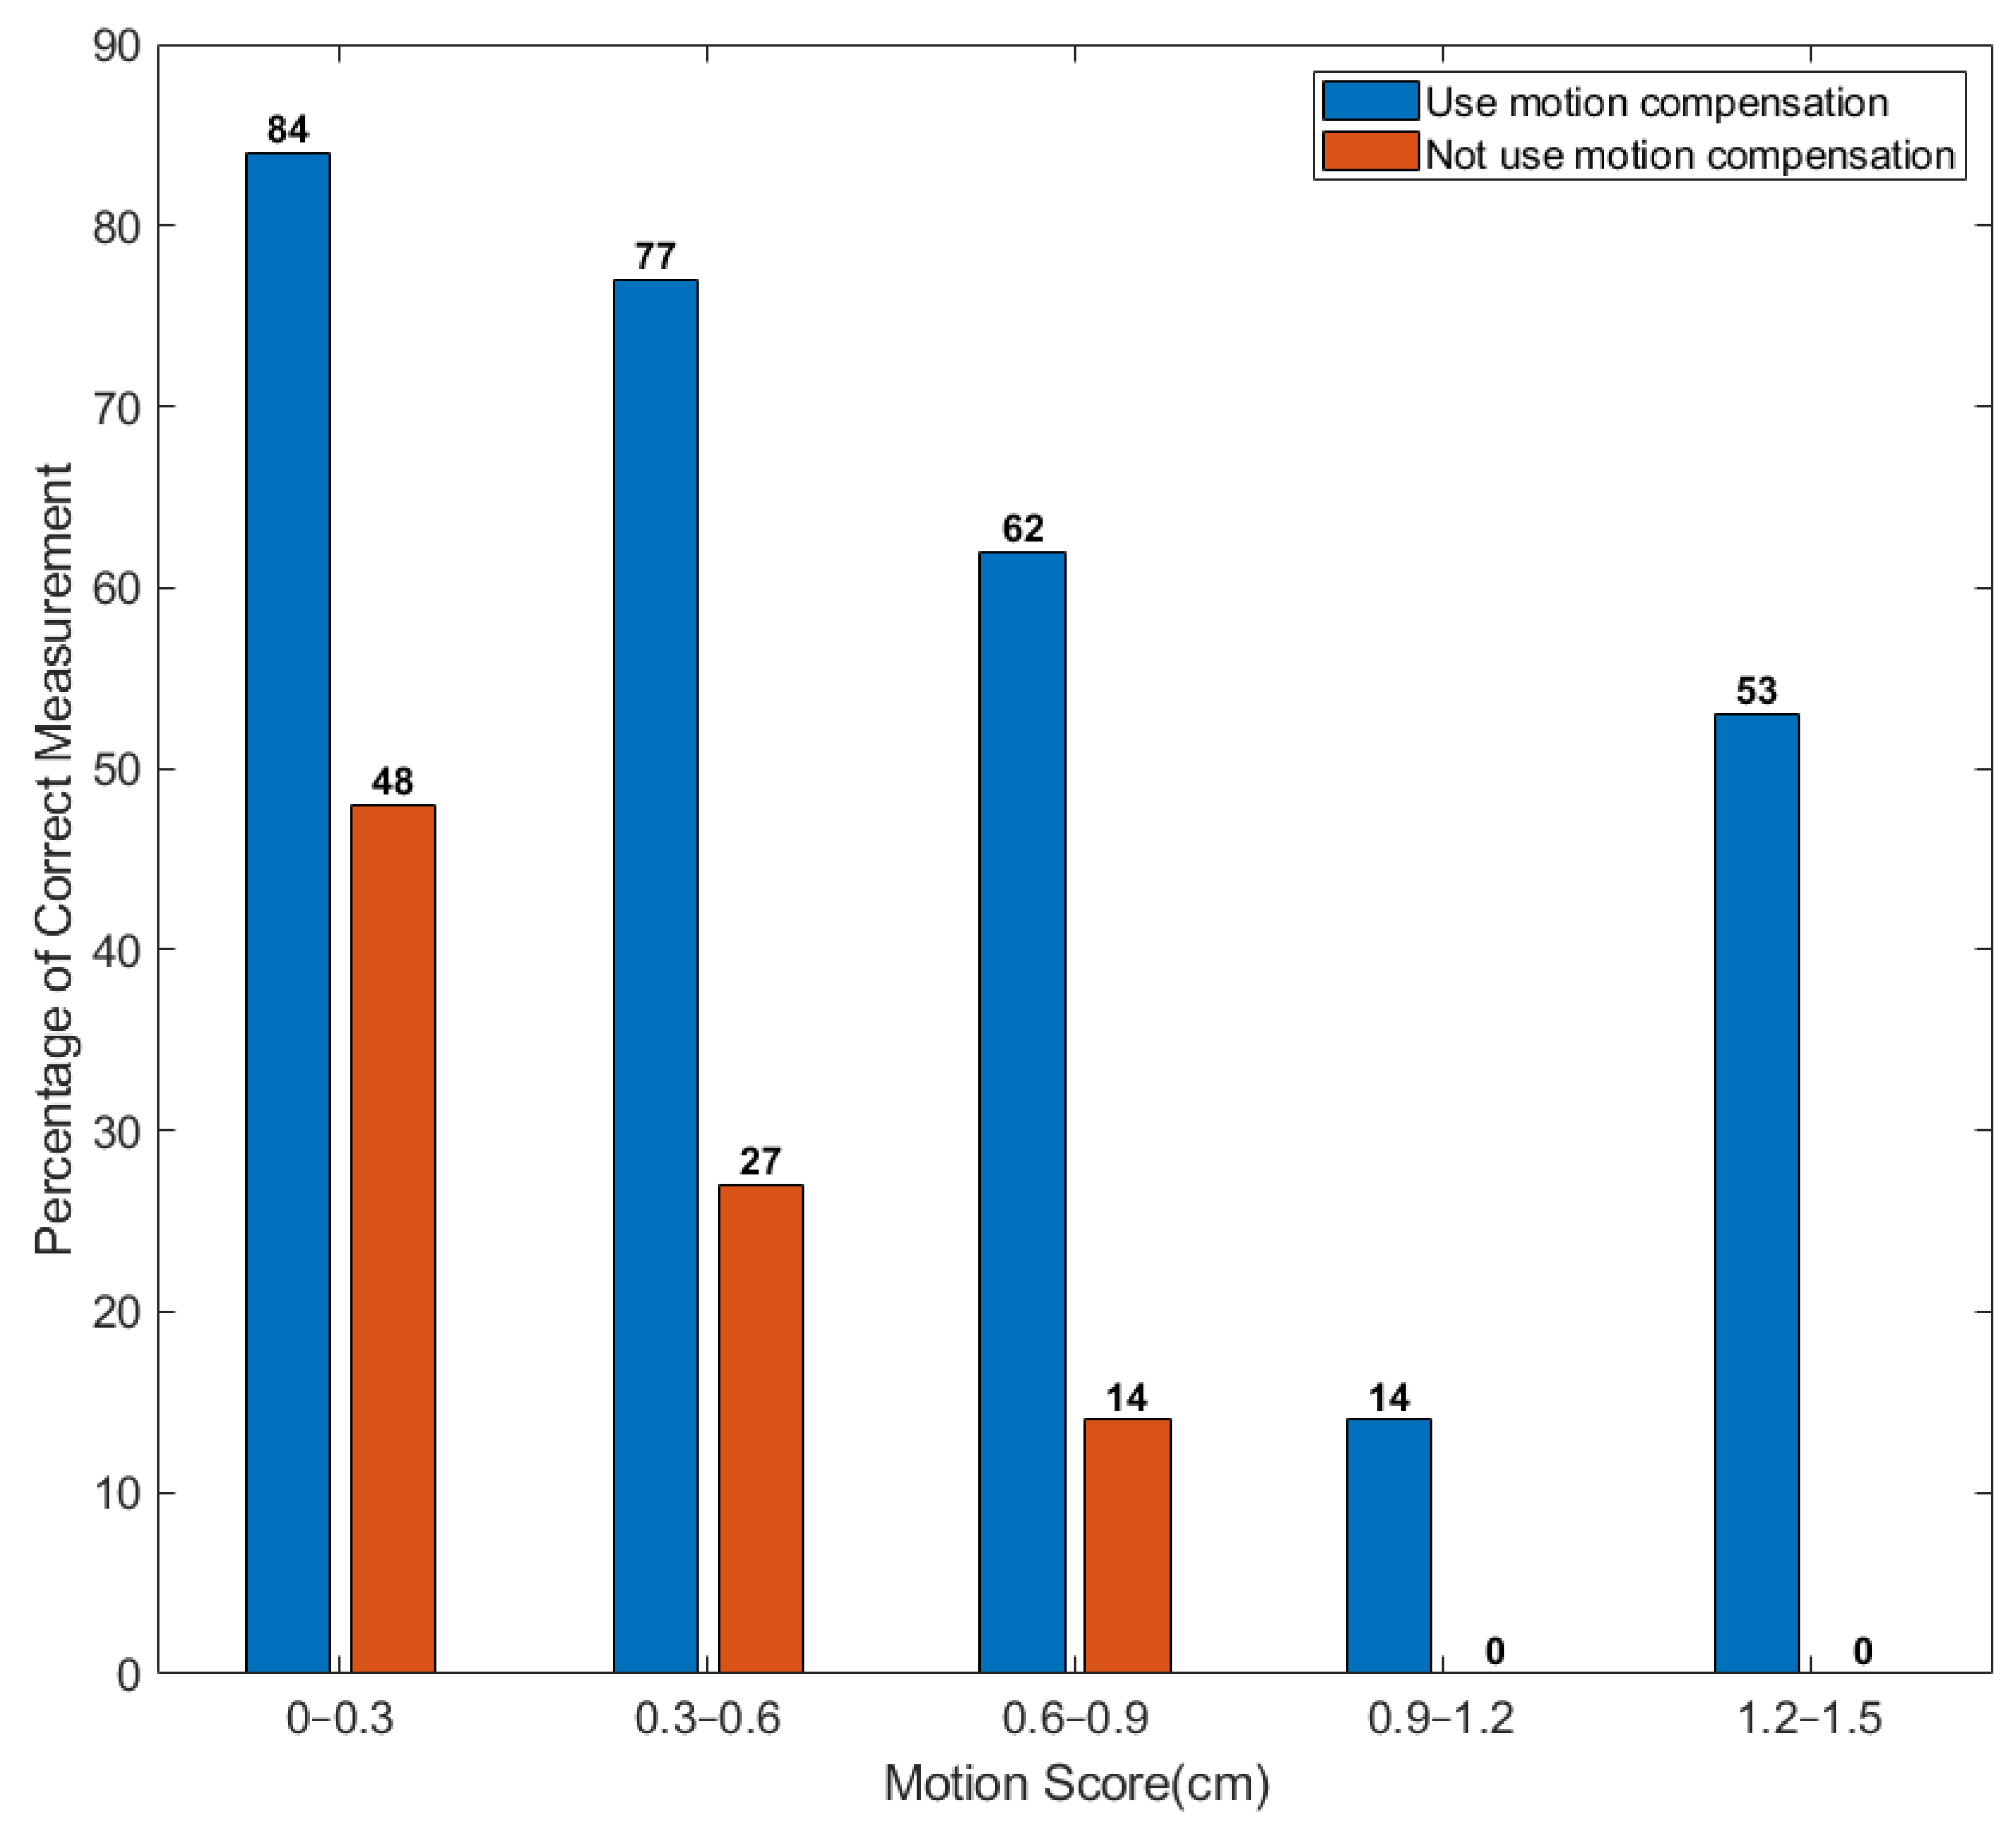
To compare the performance between distance compensated and non-distance compensated HR measurements against different levels of motion, we plot the percentage of correct measurements versus a motion score (
Figure 13). The blue bars are for the HR data with compensation, while the red bars are for the HR data without depth information compensation. In this study, we define motion score as the standard deviation of the mean depth change of the ROI-1 to the optical center of the camera, where depth change is calculated as the difference between depth
of ROI-1 and the mean depth of ROI-1 over the 60 s measurement.
Since the motion in real-life situations can sometimes be of an irregular pattern, the motion score defined in this study reflects amplitude and frequency of a participant’s motion. The higher the motion score, the larger and more frequent the motion artifacts are. For example, a motion score below 0.3 cm is typical of a participant sitting still, while a motion score above 1 cm is typical of participants adjusting for a comfortable position e.g., sitting restlessly while sitting. It is worth noticing that a motion score of 1 cm does not necessarily mean the participant moves only 1 cm during the measurements. For example, in a measurement with a motion score of 1 cm, the maximum ROI-1 deviation from the mean position can exceed 4 cm. The blue bars are for the HR measurements with compensation, while the red bars are for the HR measurements without depth information compensation. As can be seen from the plot, the performance of the motion-compensated HR measurements outperforms the uncompensated measurements across every motion score category. Even when small motion is introduced (motion score from 0 to 0.3 cm), the distance-compensated HR measurement outperforms the uncompensated measurement by more than 75% in terms of success rate. Once the motion becomes larger, the performance of the uncompensated HR measurement plummets, indicating that the raw signal is dominated by motion artifacts. At the same time, the success rate of the motion-compensated HR also drops, but to a lesser extent. For example, when motion score exceeds 0.9 cm, ~35% of compensated measurements are correct meanwhile close to none of the uncompensated HR measurements are correct. This is of great significance because motion artifacts are a dominant source of noise in contactless HR measurement, especially with near-infrared wavelength where the absorption of blood is much weaker. We believe the performance of the ToF-based HR measurement system under larger motion could be improved with future development of both the motion compensation model as well as higher performance ToF cameras. We will discuss such future developments in more detail in the
Section 5.
4.2. Different Skin Color
One of the challenges for an RGB-based HR/RR monitoring system is that different skin colors could affect the signal quality because of strong melanin absorption in the visible wavelength range [
18]. In contrast, the absorption of melanin is much lower at near-infrared, which allows the ToF-based system to perform more uniformly among demographics of different skin colors.
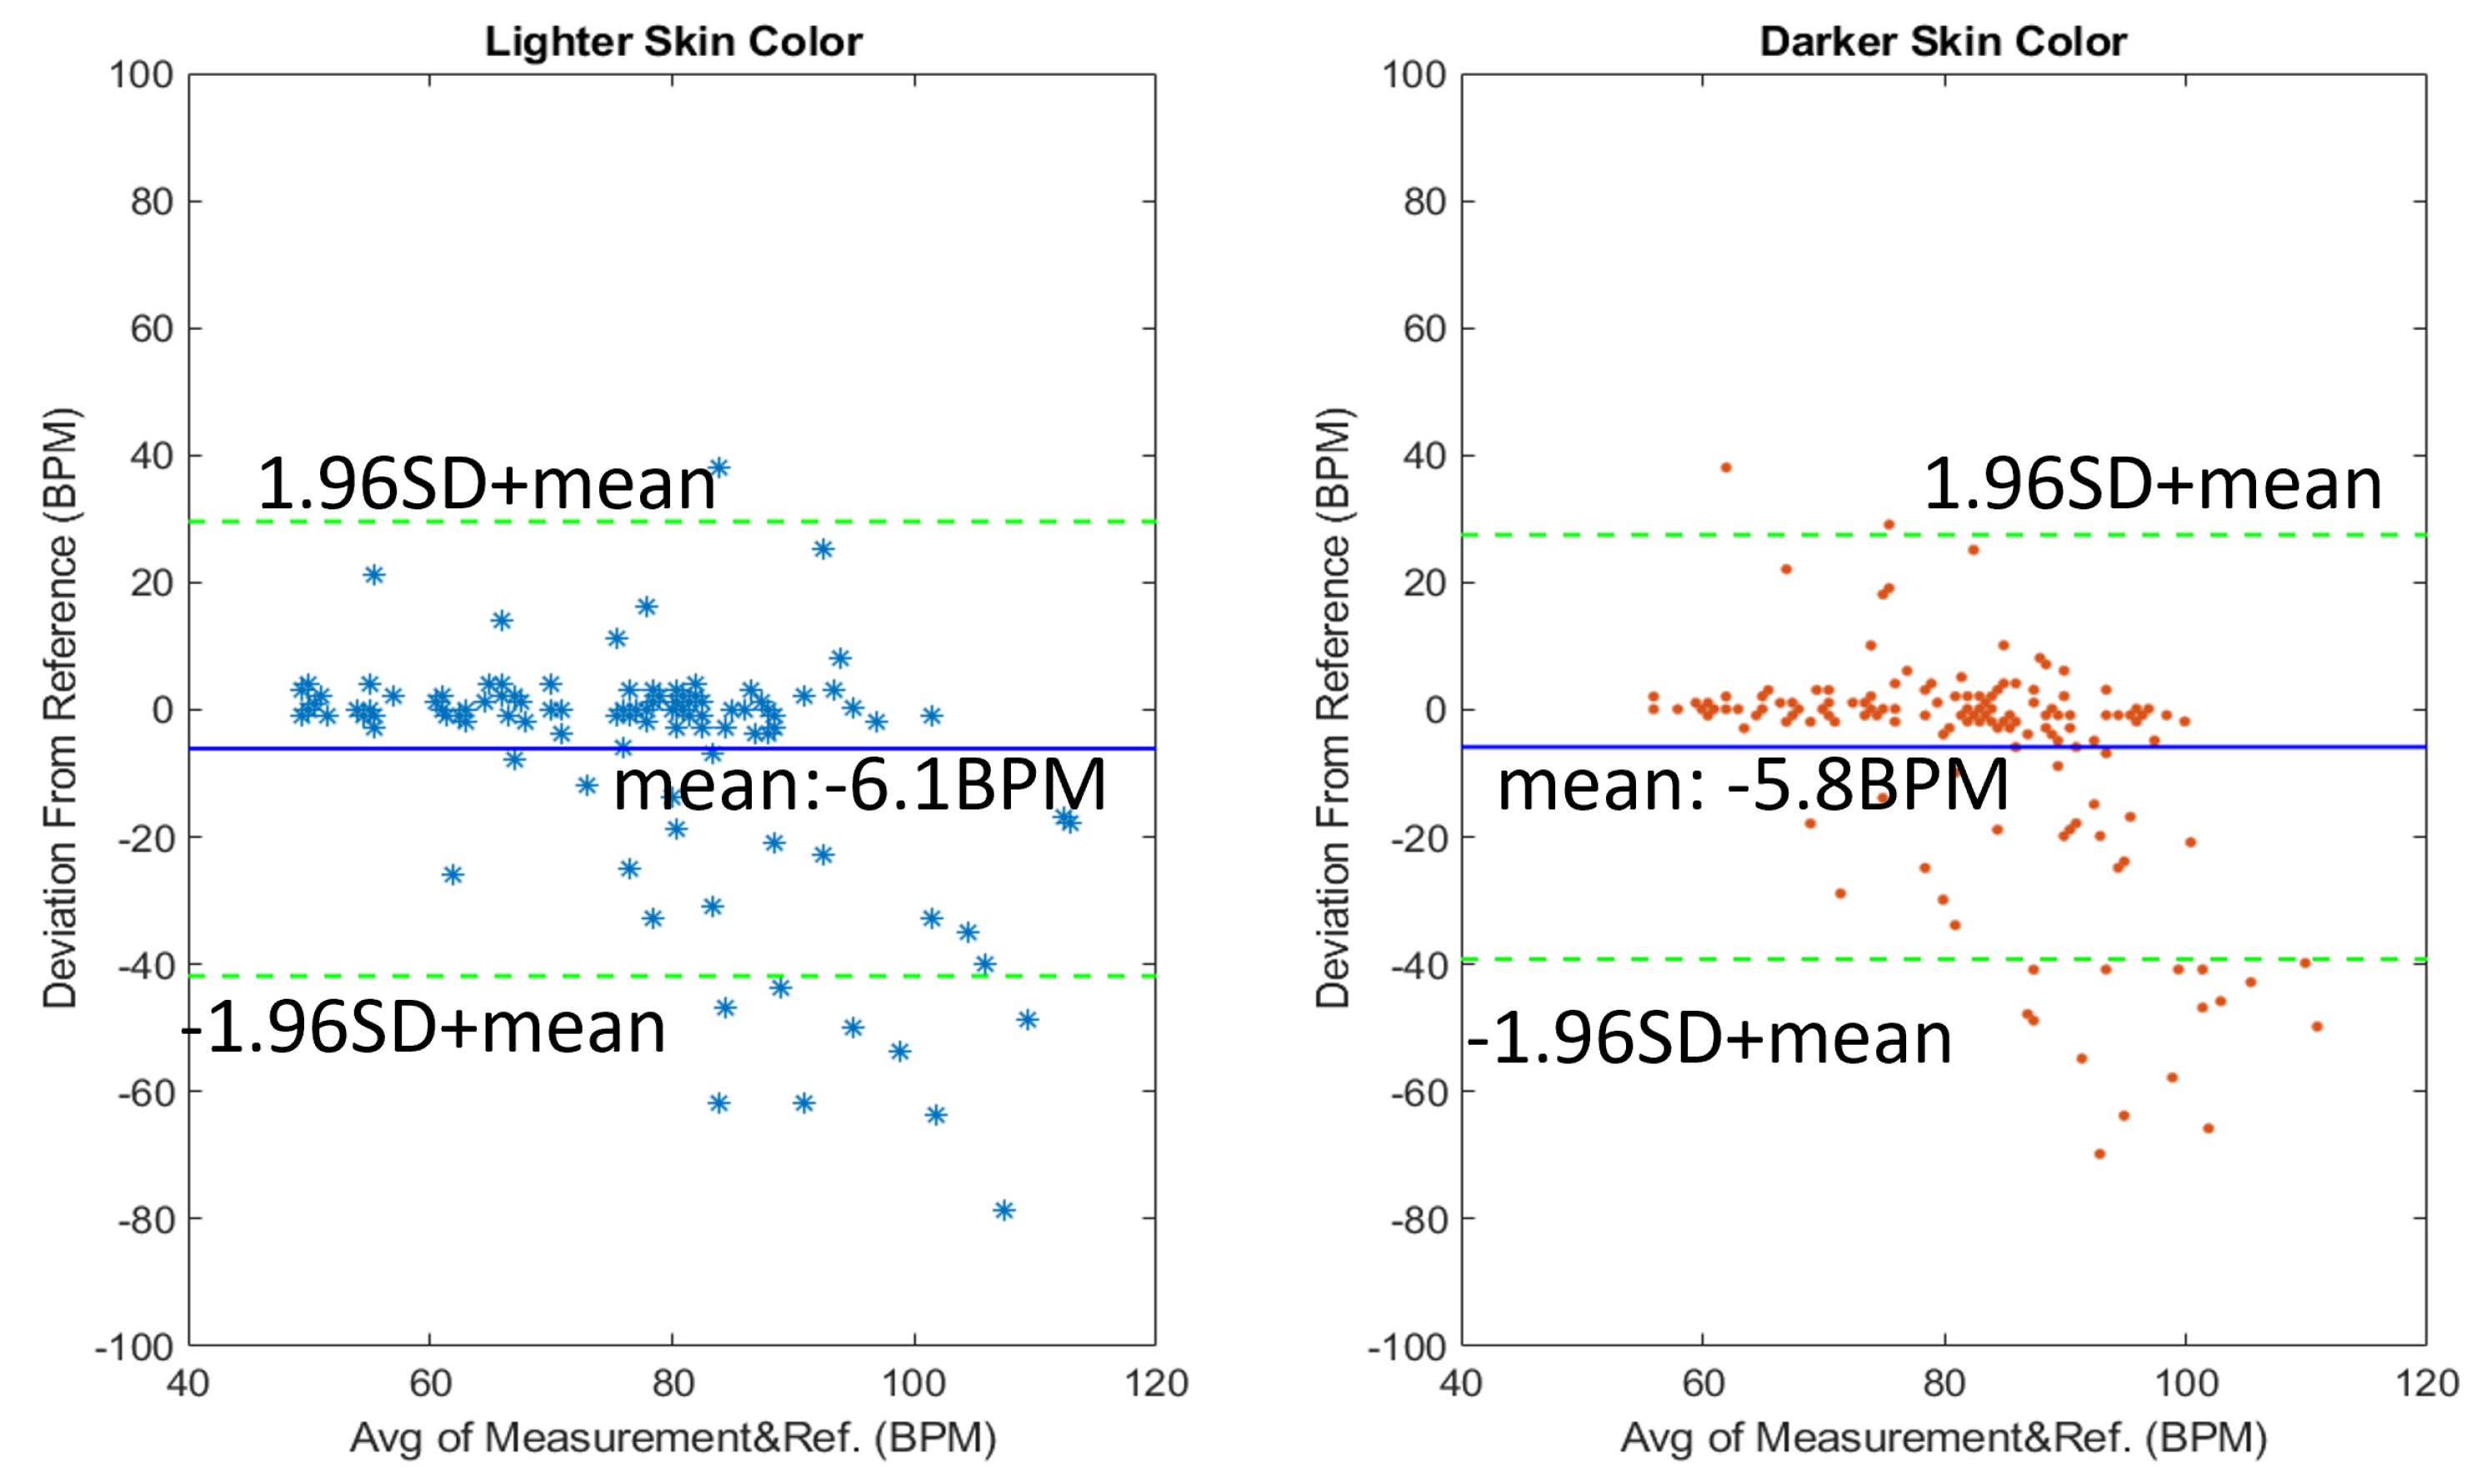
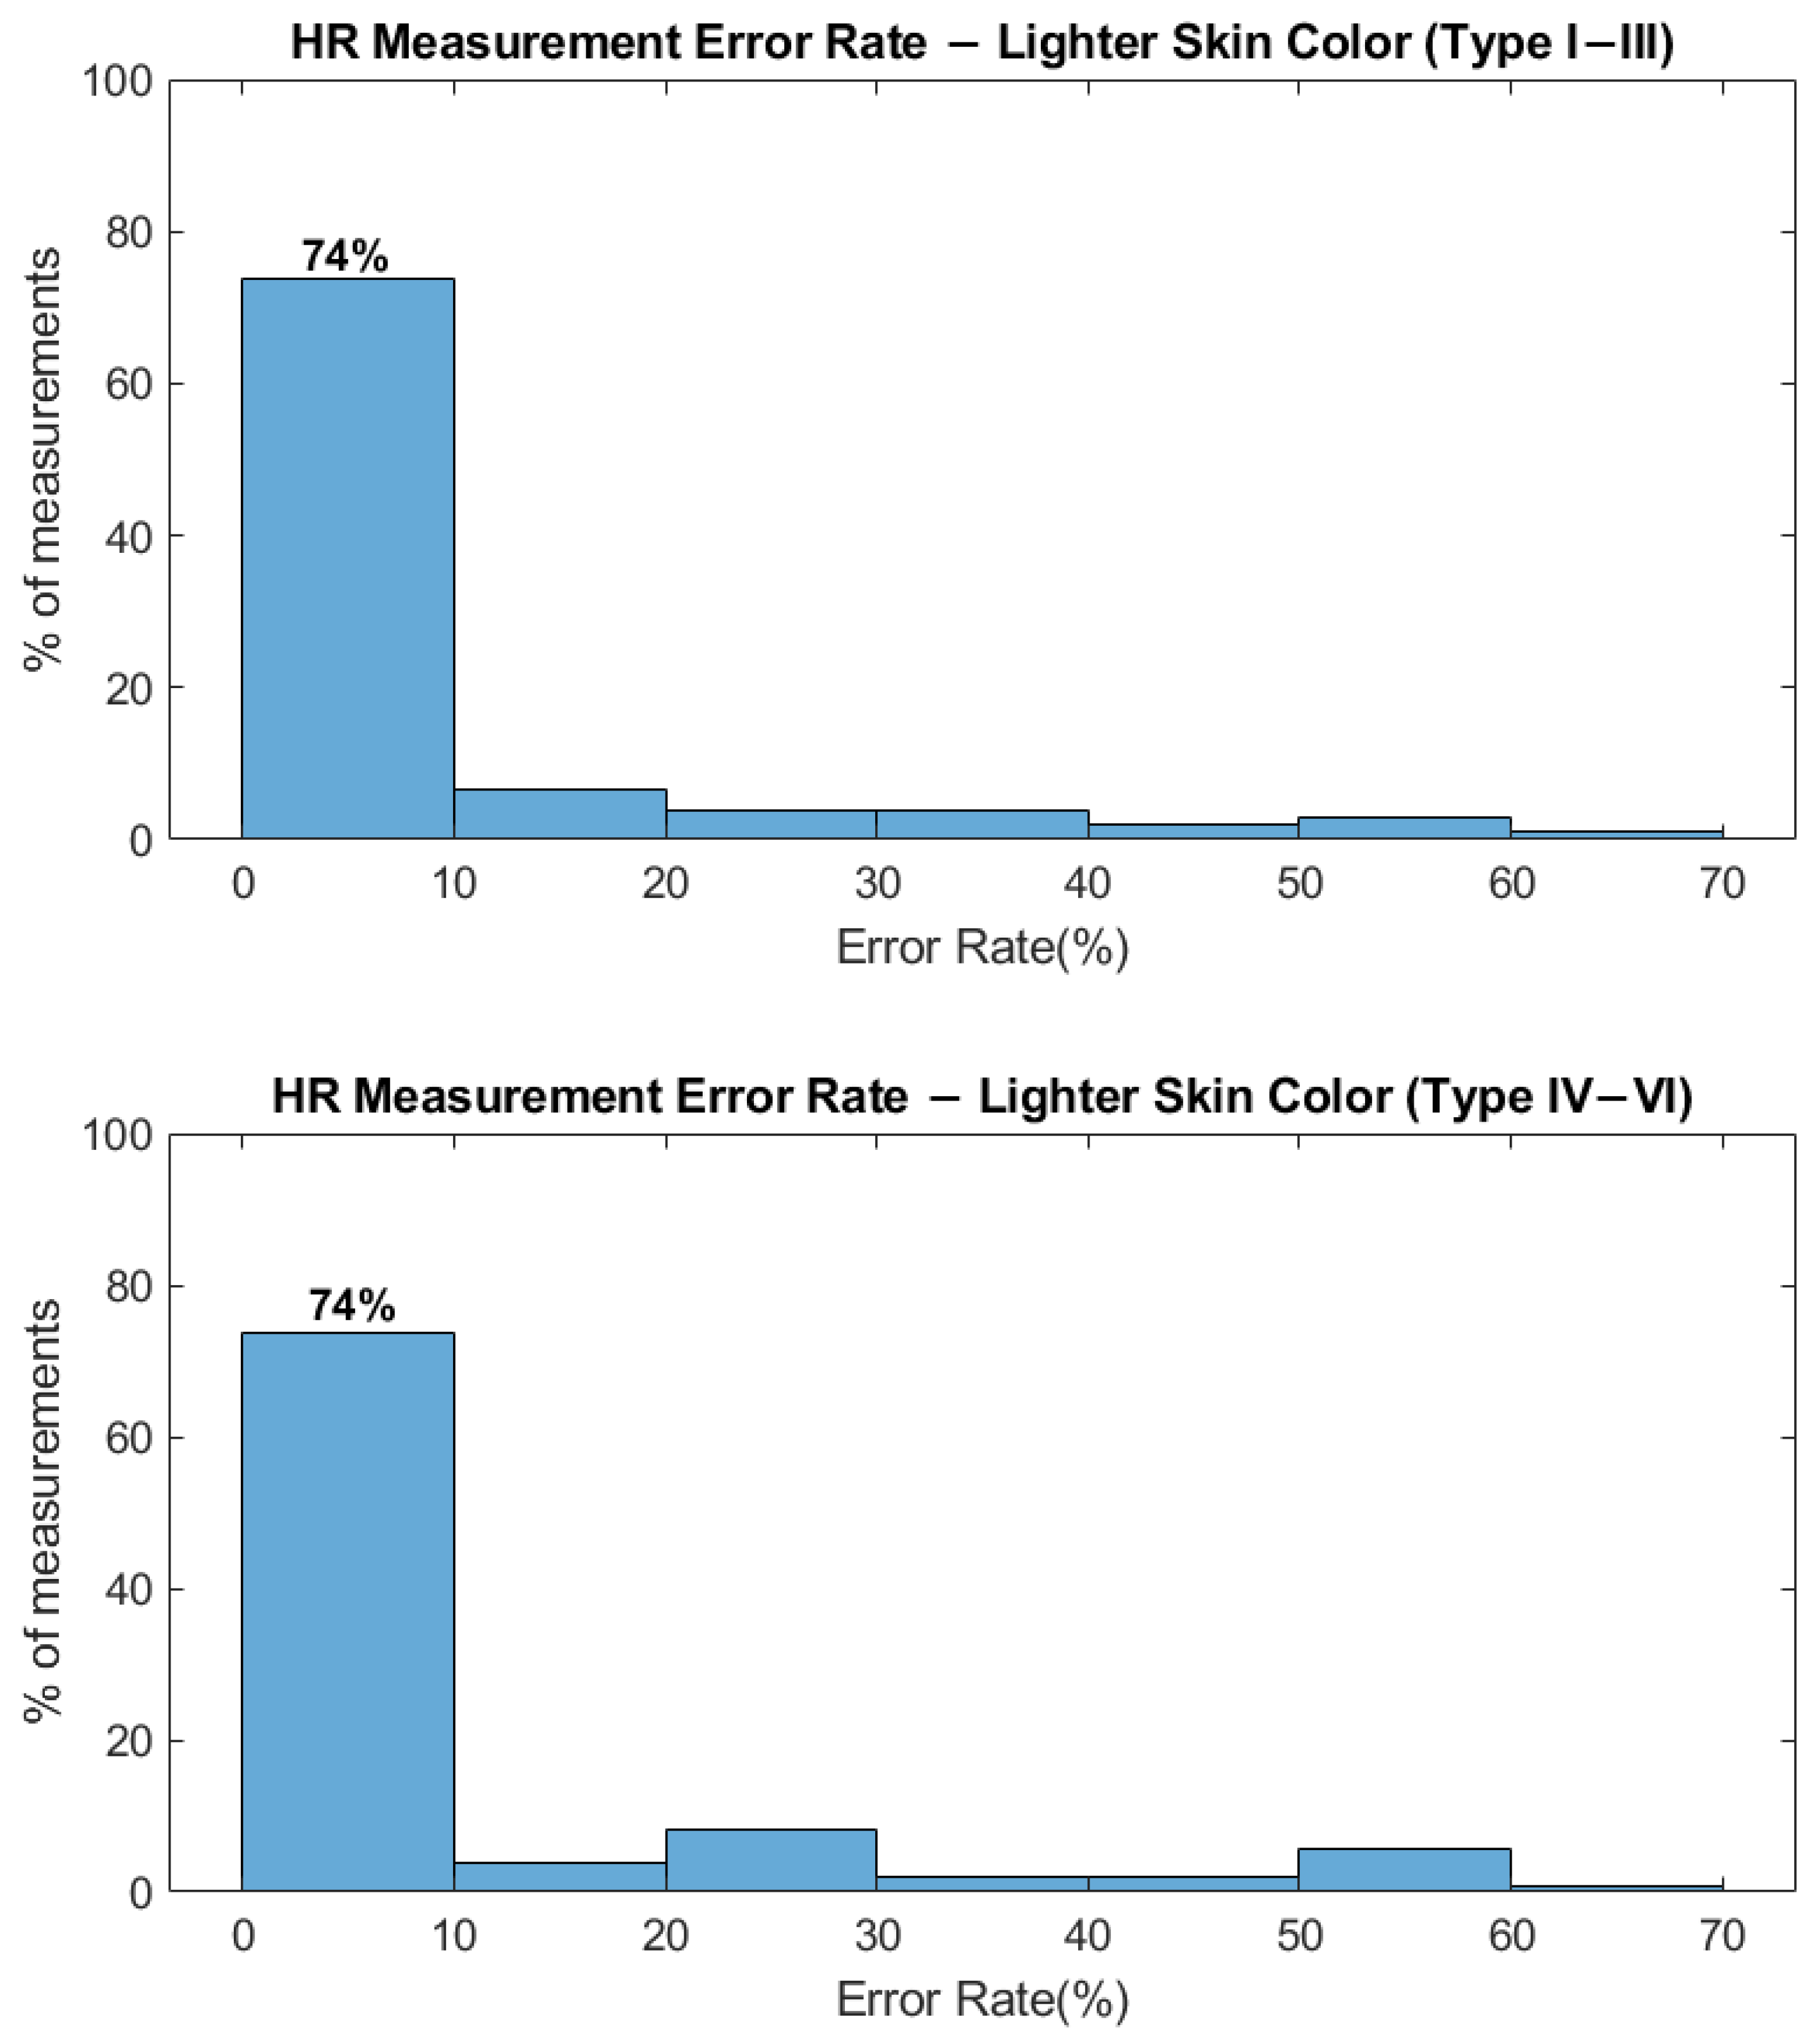
Figure 14 shows the error rate of the HR measurements among participants with darker skin color and lighter skin color. Participants with Fitzpatrick skin type I–III (17/29 participants) are considered as light skin color, while participants with skin type IV–VI (12/29 participants) are considered as darker skin color. Among the lighter skin color group, the percentage of success rate measurement is 74% with the mean deviation of the measurements being −6.1 BPM. As for the darker skin color group, the same success rate of 74% is achieved with the mean deviation from the reference at −5.8 BPM.
Similar performance among two skin color groups is also evident when we examine the Bland–Altman plot in
Figure 15. Both the mean deviation (−6.1 BPM for the lighter skin color versus −5.8 BPM for darker skin color) and the 95% percentile range (+/− 35 BPM for the lighter skin color versus +/− 33 BPM for darker skin color) are very similar between the two groups. Moreover, deviation distribution is also similar among the two groups, indicating that the ToF system used in this study performs equally well among participants of different skin colors. Thus, using near-infrared illumination, we are able to achieve performance independent of skin color.
4.3. Different Gender and Age
We also investigate the performance of the ToF-based HR measurements system in terms of the participant’s gender and age. Similar to the RGB camera-based system, no significant performance difference is seen among participants of different gender and age.
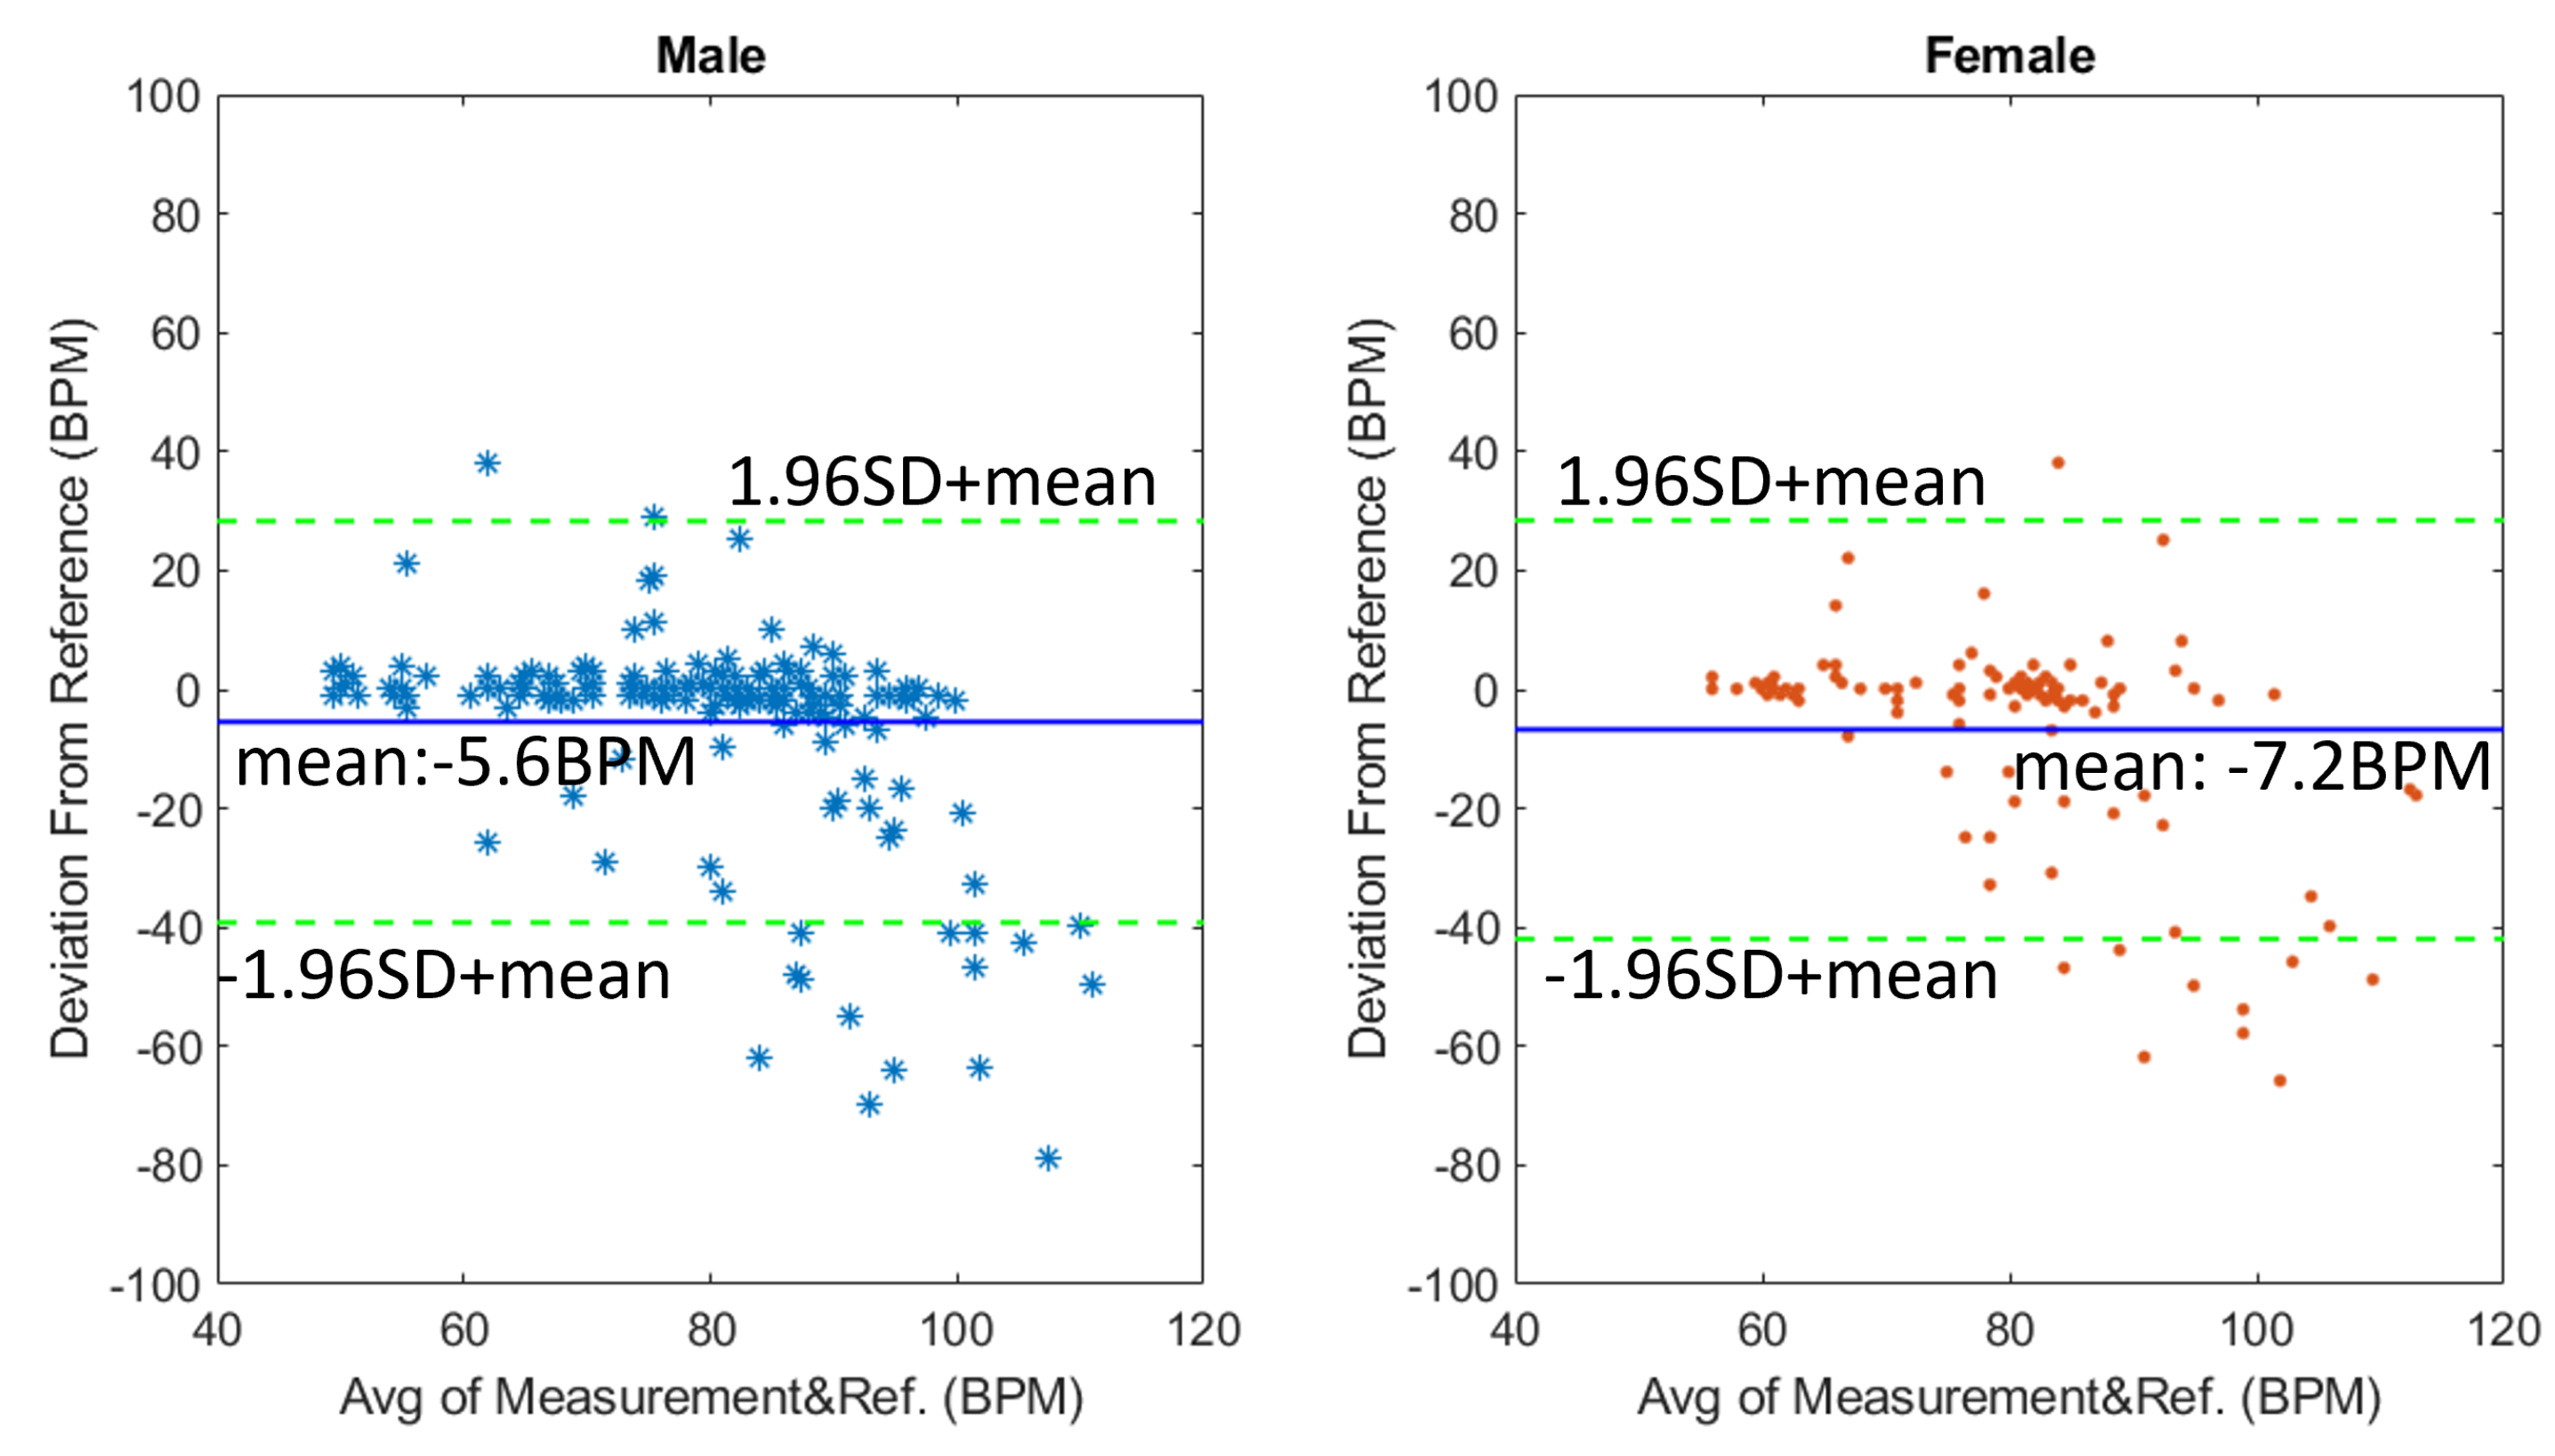
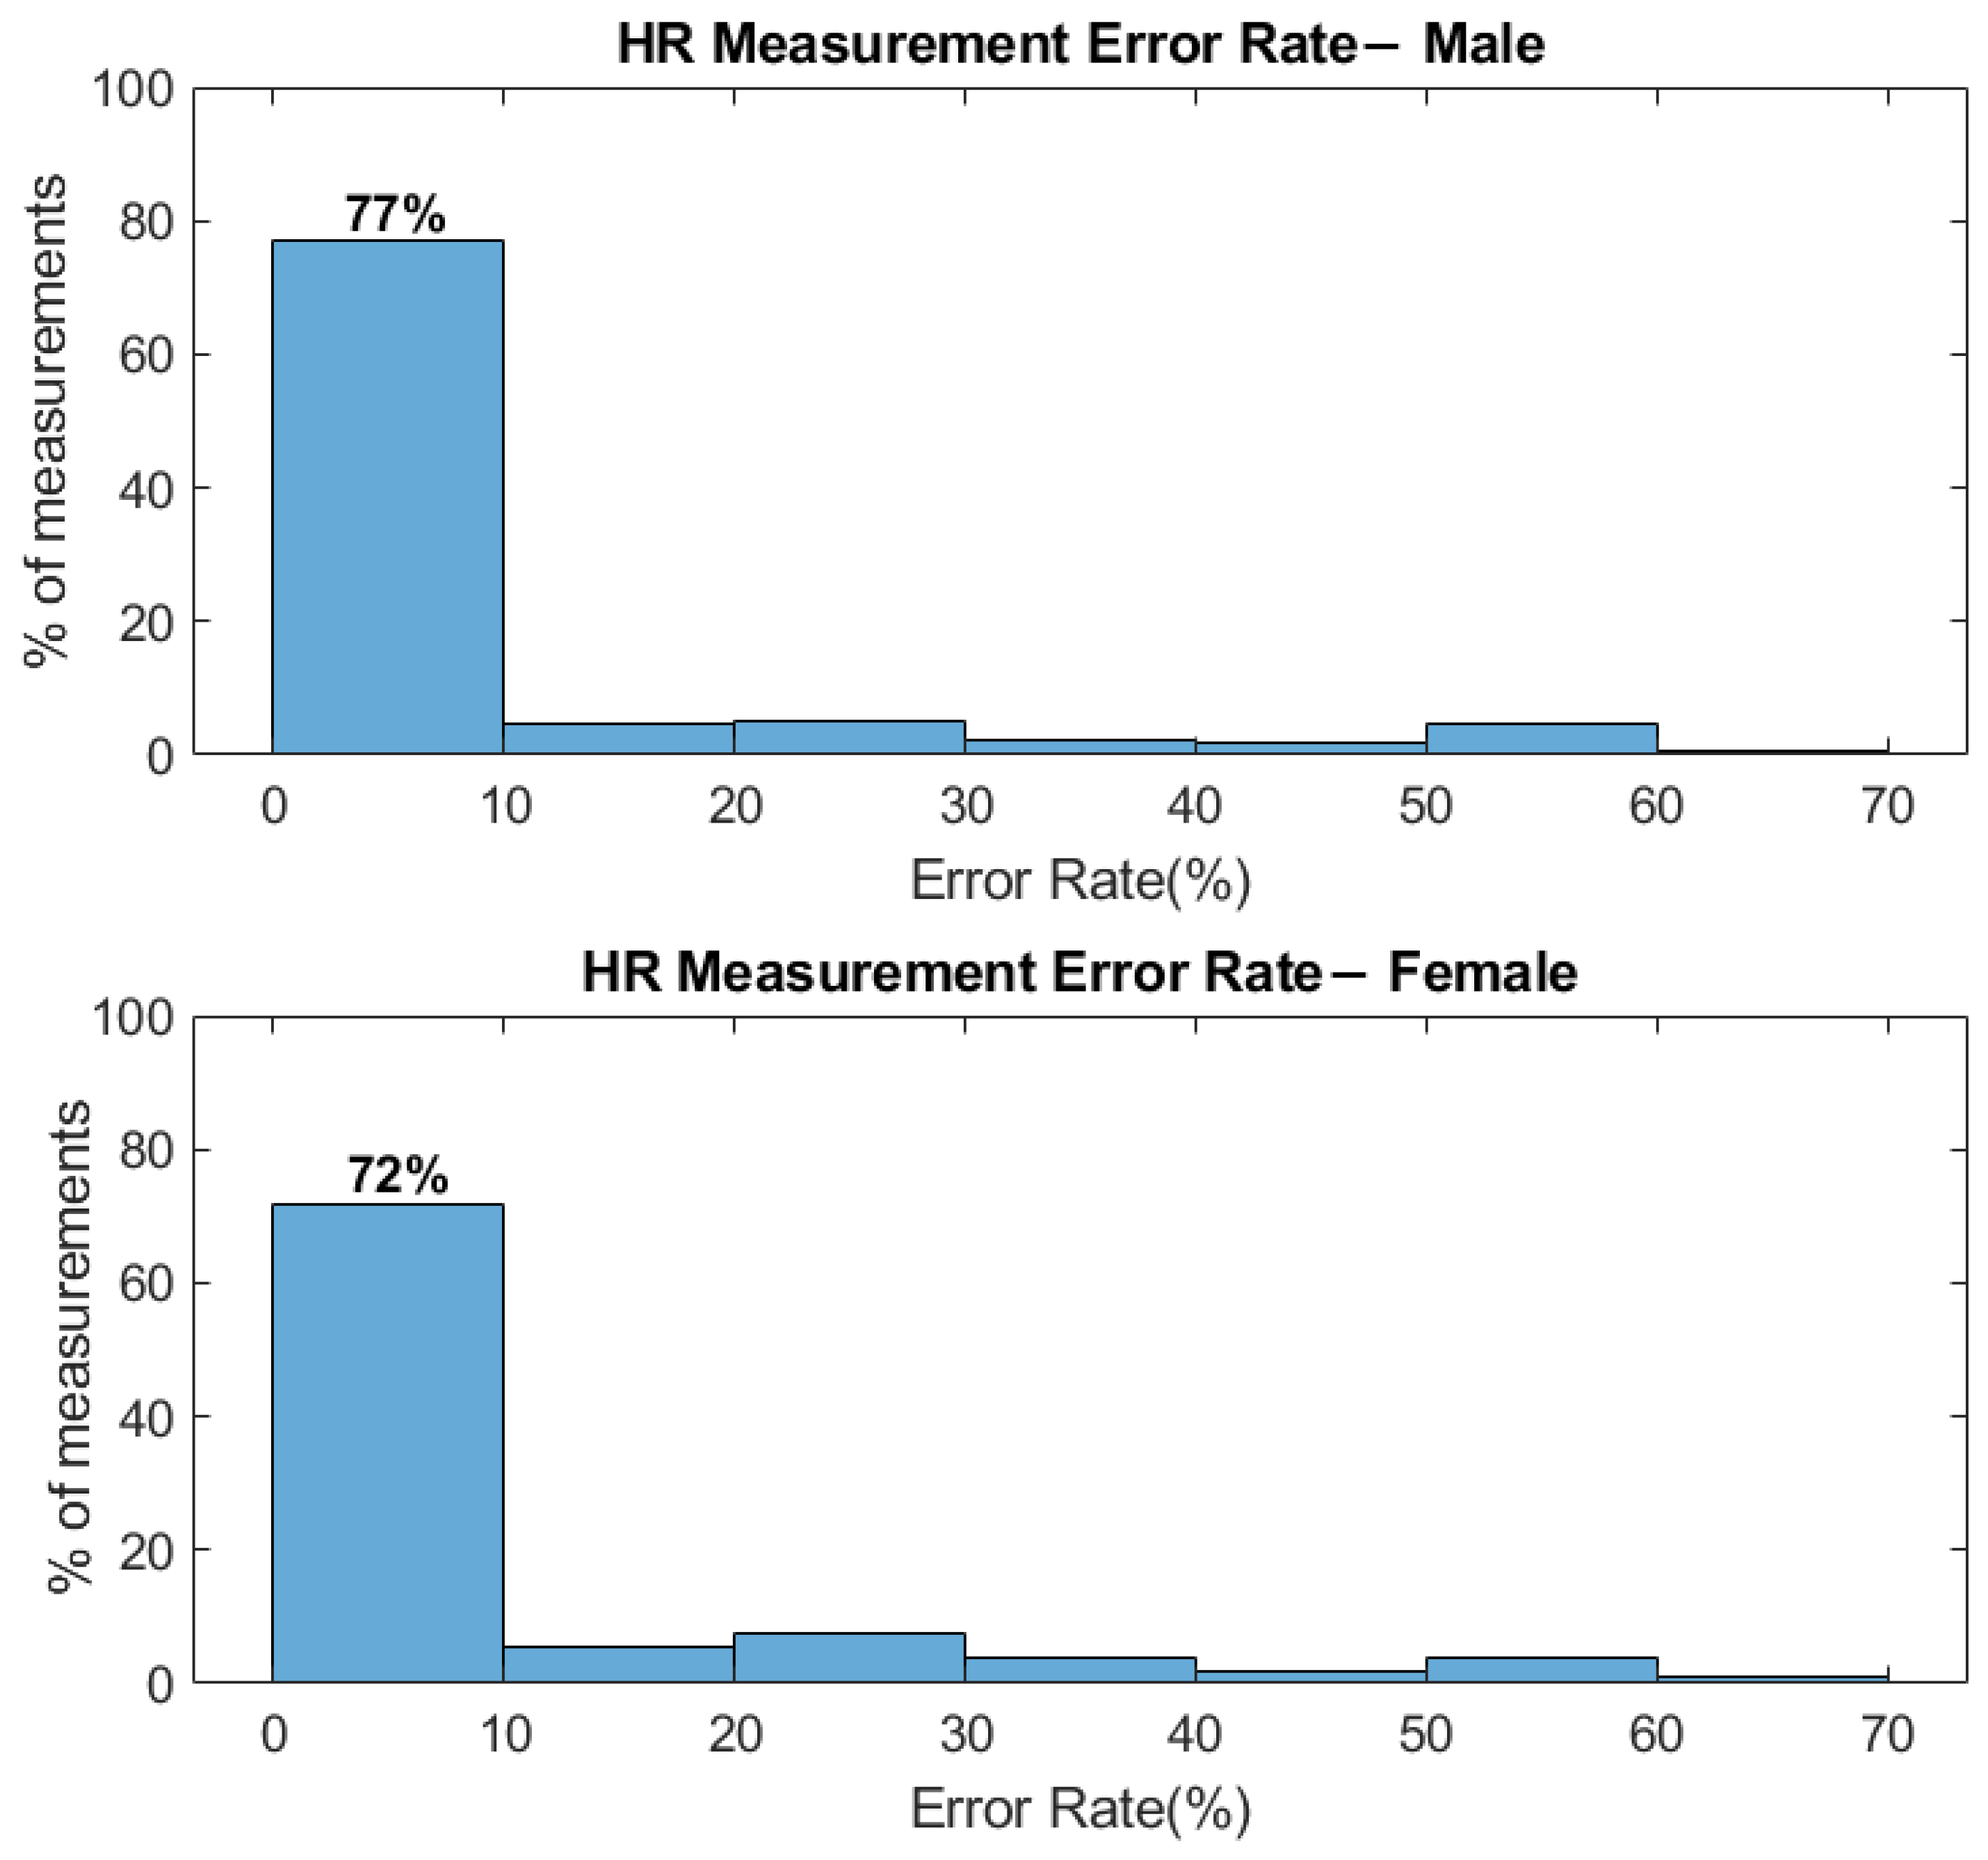
Figure 16 shows the success percentage rate among participants of different gender, we achieve a 77% success rate in the male group and a 72% success rate in the female group. The mean HR deviation from reference is −5.6 BPM for the male group (18/29 participants) and −7.2 BPM for the female group (11/29 participants) (
Figure 17), respectively. Even though the mean deviation differs slightly, the pattern of deviation data points looks similar. Such differences may be attributed to different skin conditions or even different skincare products used on the skin. Even though participants are asked not to use makeup, there could still be residuals left on the participant’s face. Since the blood absorption at infrared is already low, any further decrease of signal could affect the success rate of the HR measurements.
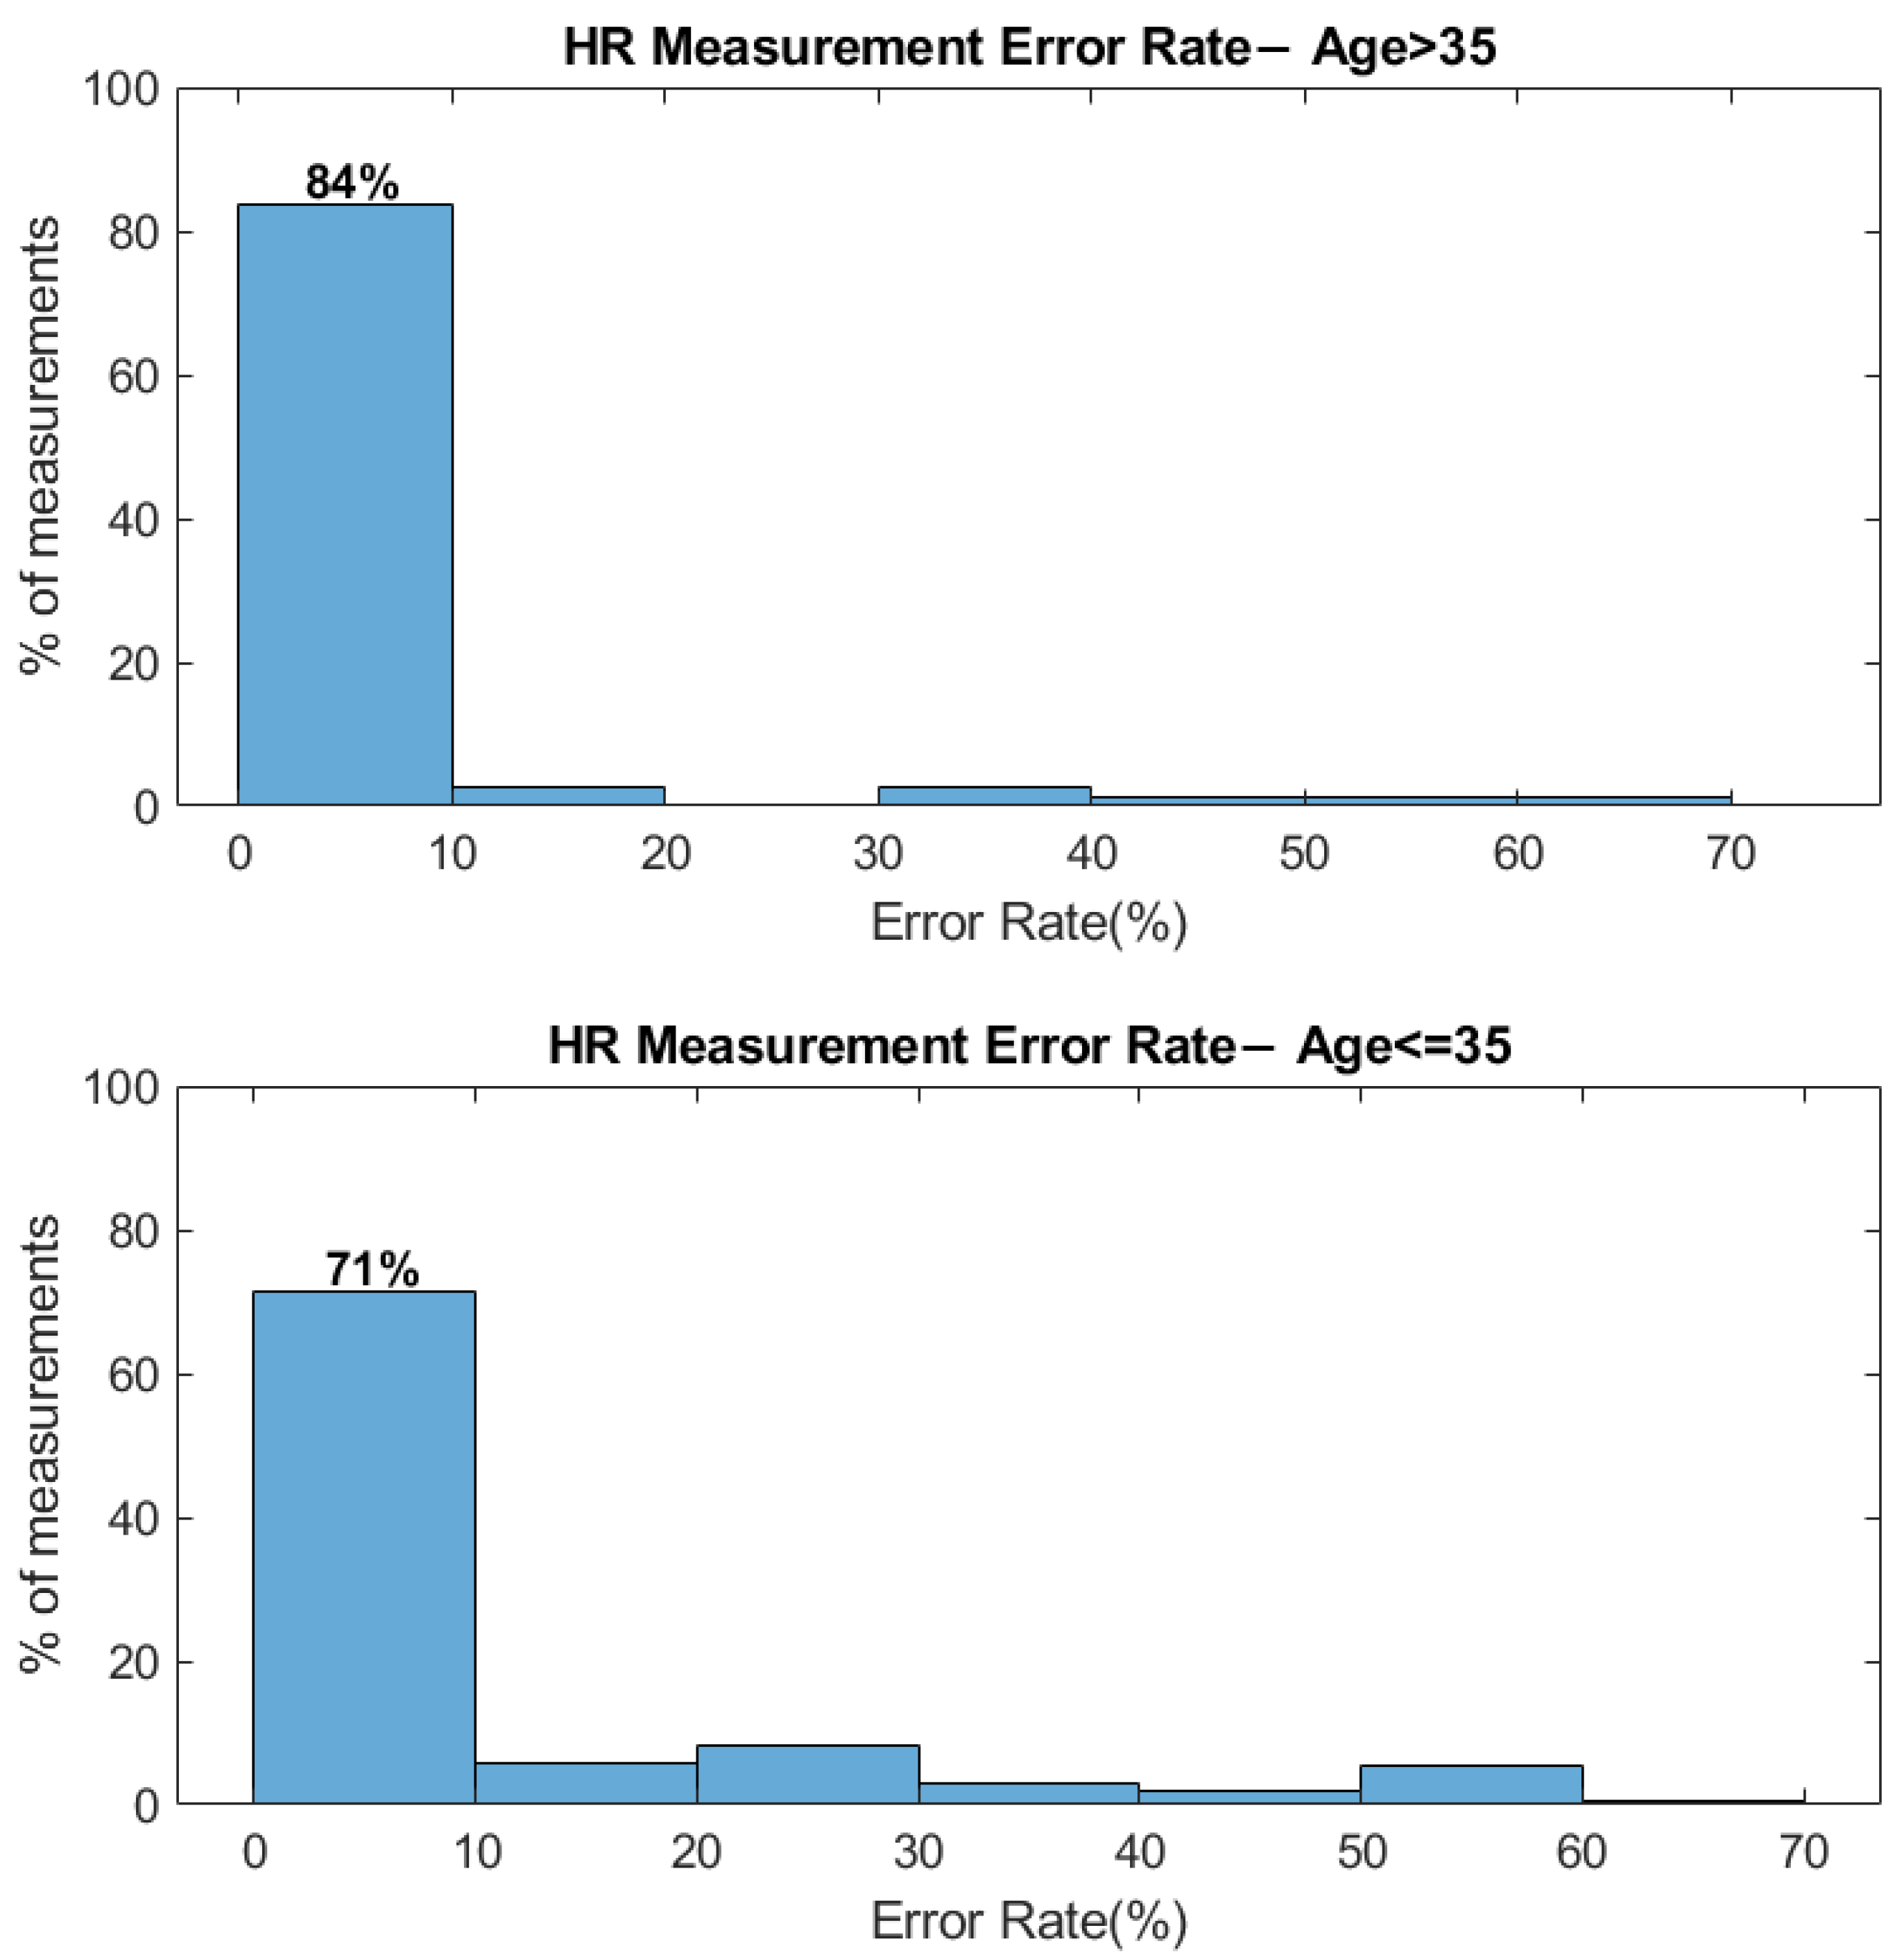
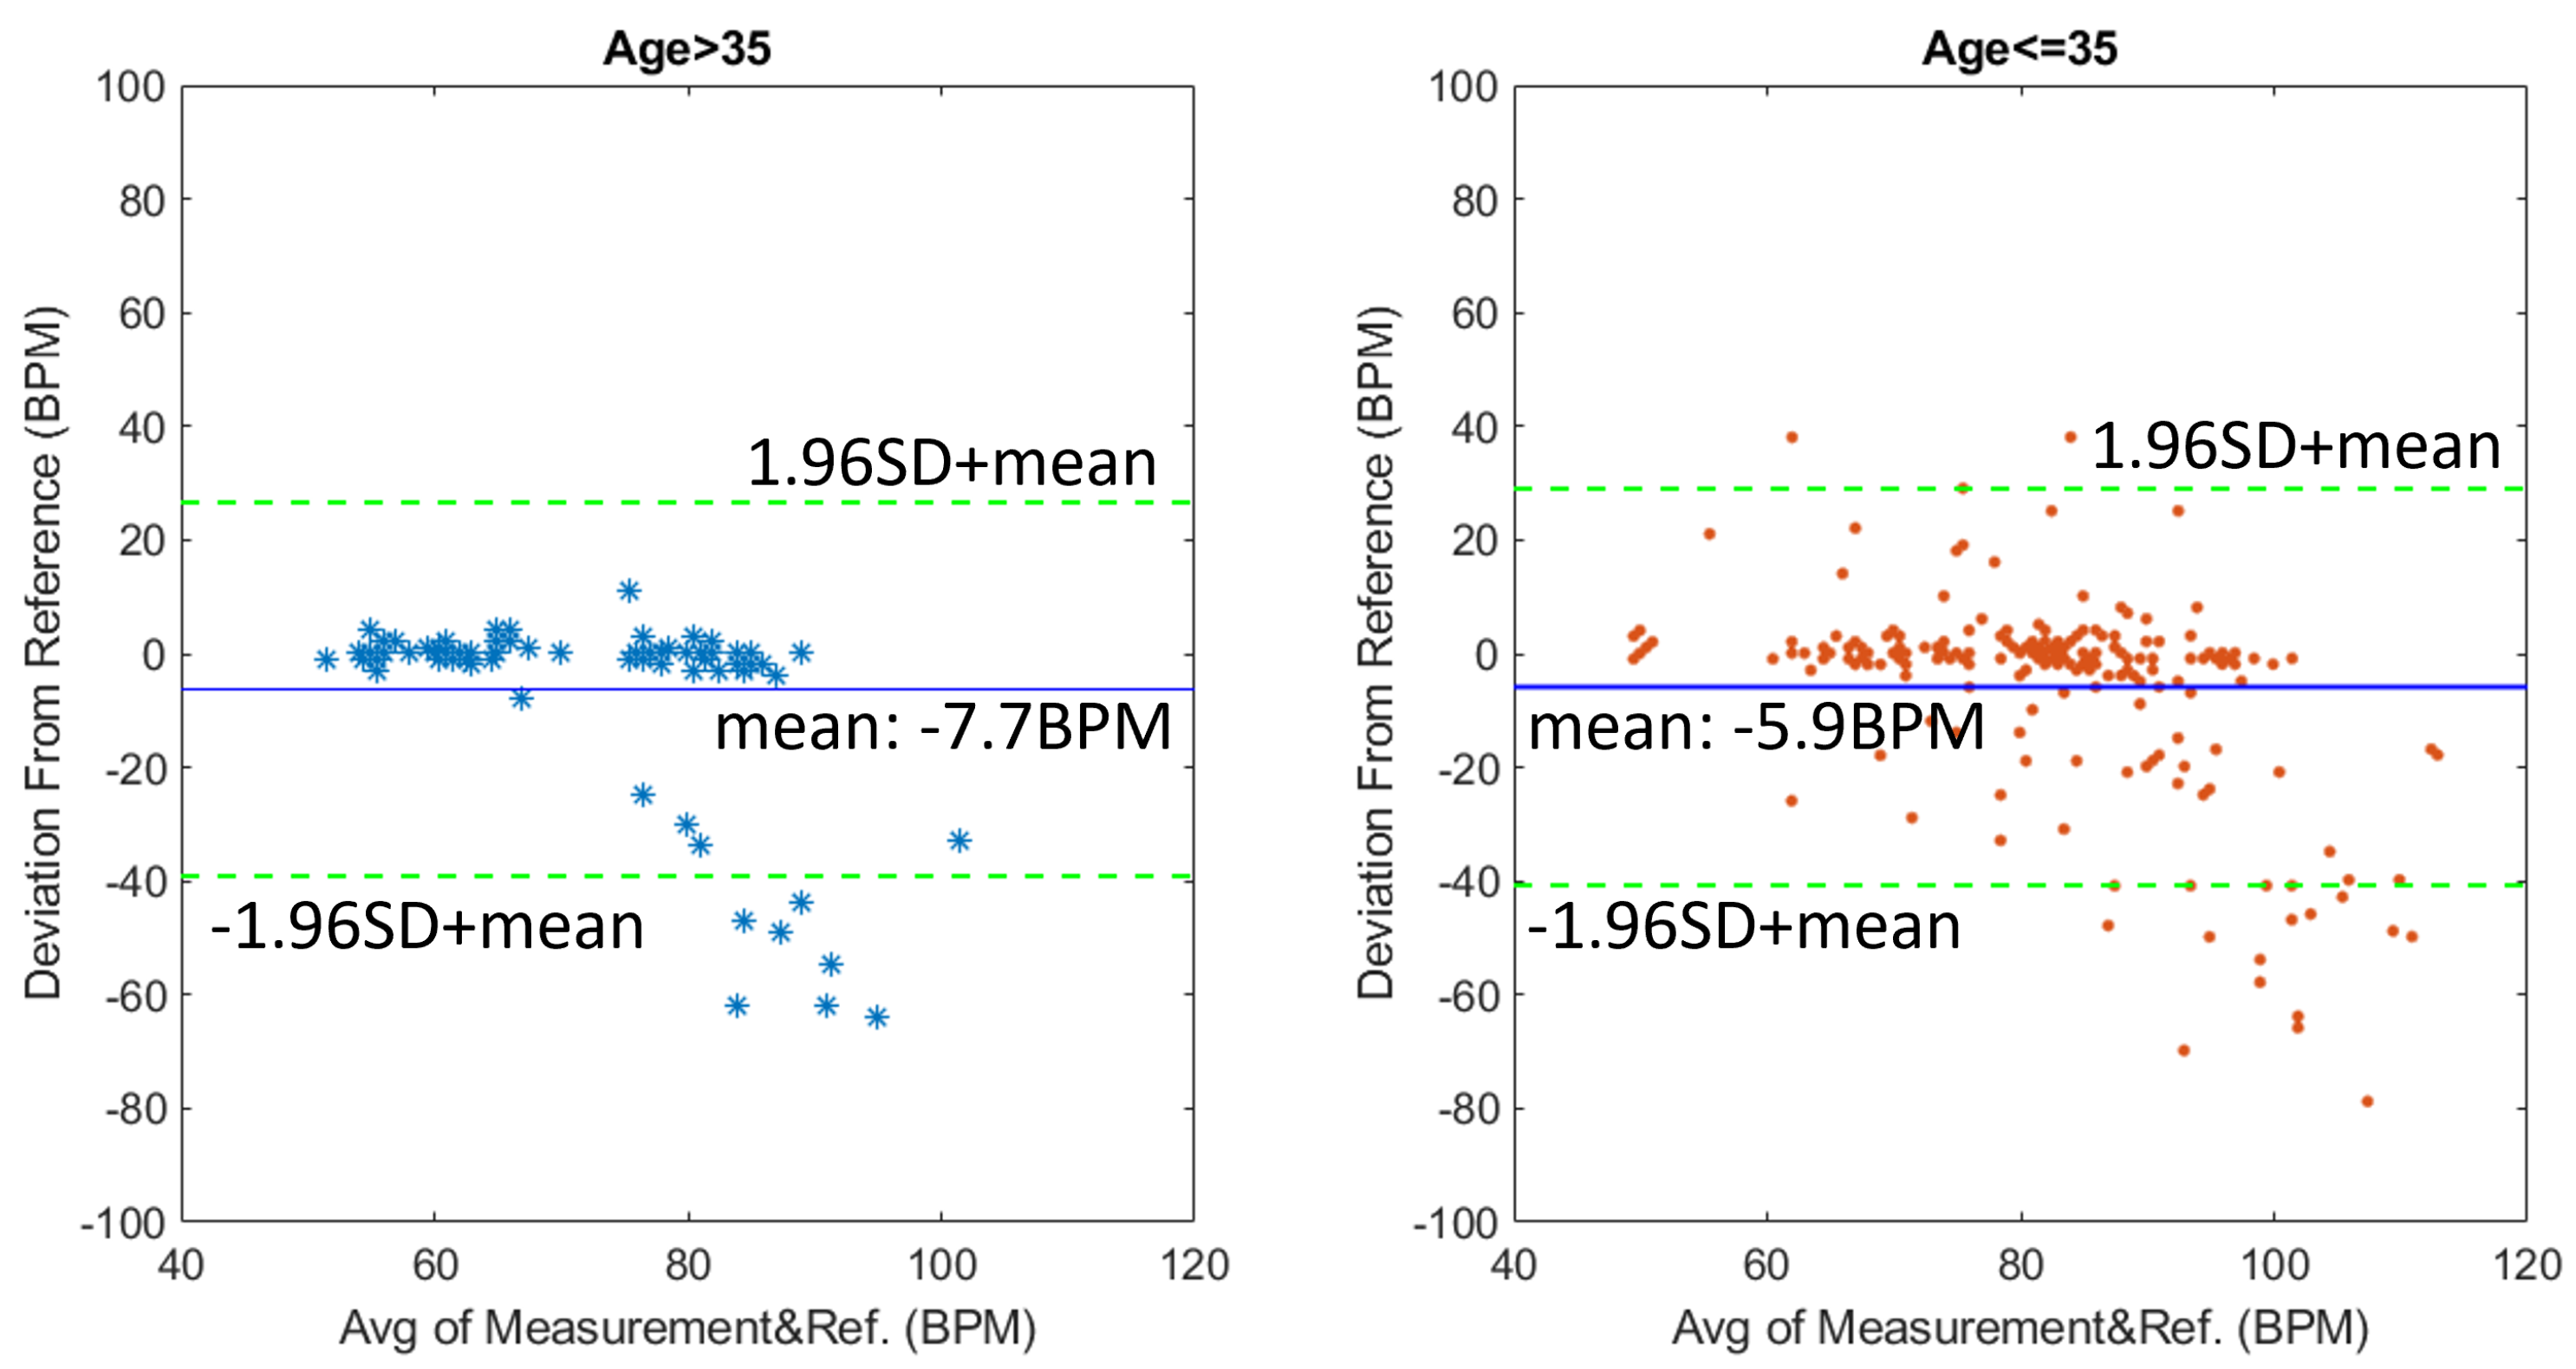
In terms of age, we separated the participants into a younger group (21/29 participants) and an elder group (8/29 participants) at the threshold of 35 years old. The success rate/mean deviation is 84%/−7.7 BPM for the elder group and 71%/−5.89 BPM for the younger group (
Figure 18 and
Figure 19). The higher success rate among the elder participants could be caused by elder participants staying more still during the measurements compared to younger participants. In fact, the mean motion score for the younger group is 0.61 cm, compared to 0.47 cm for the elder groups. As we discussed before, the success rate deteriorates as the motion score increases, which could explain the higher success rate among elder participants.
5. Discussion
Even though the additional depth information from the ToF-based HR/RR measurements system shows benefits in terms of motion compensation and respiration rate measurements, we also noticed several external factors that can affect the performance, which could help with the future improvement of the system’s performance if addressed.
5.1. Limitation of RR Measurements
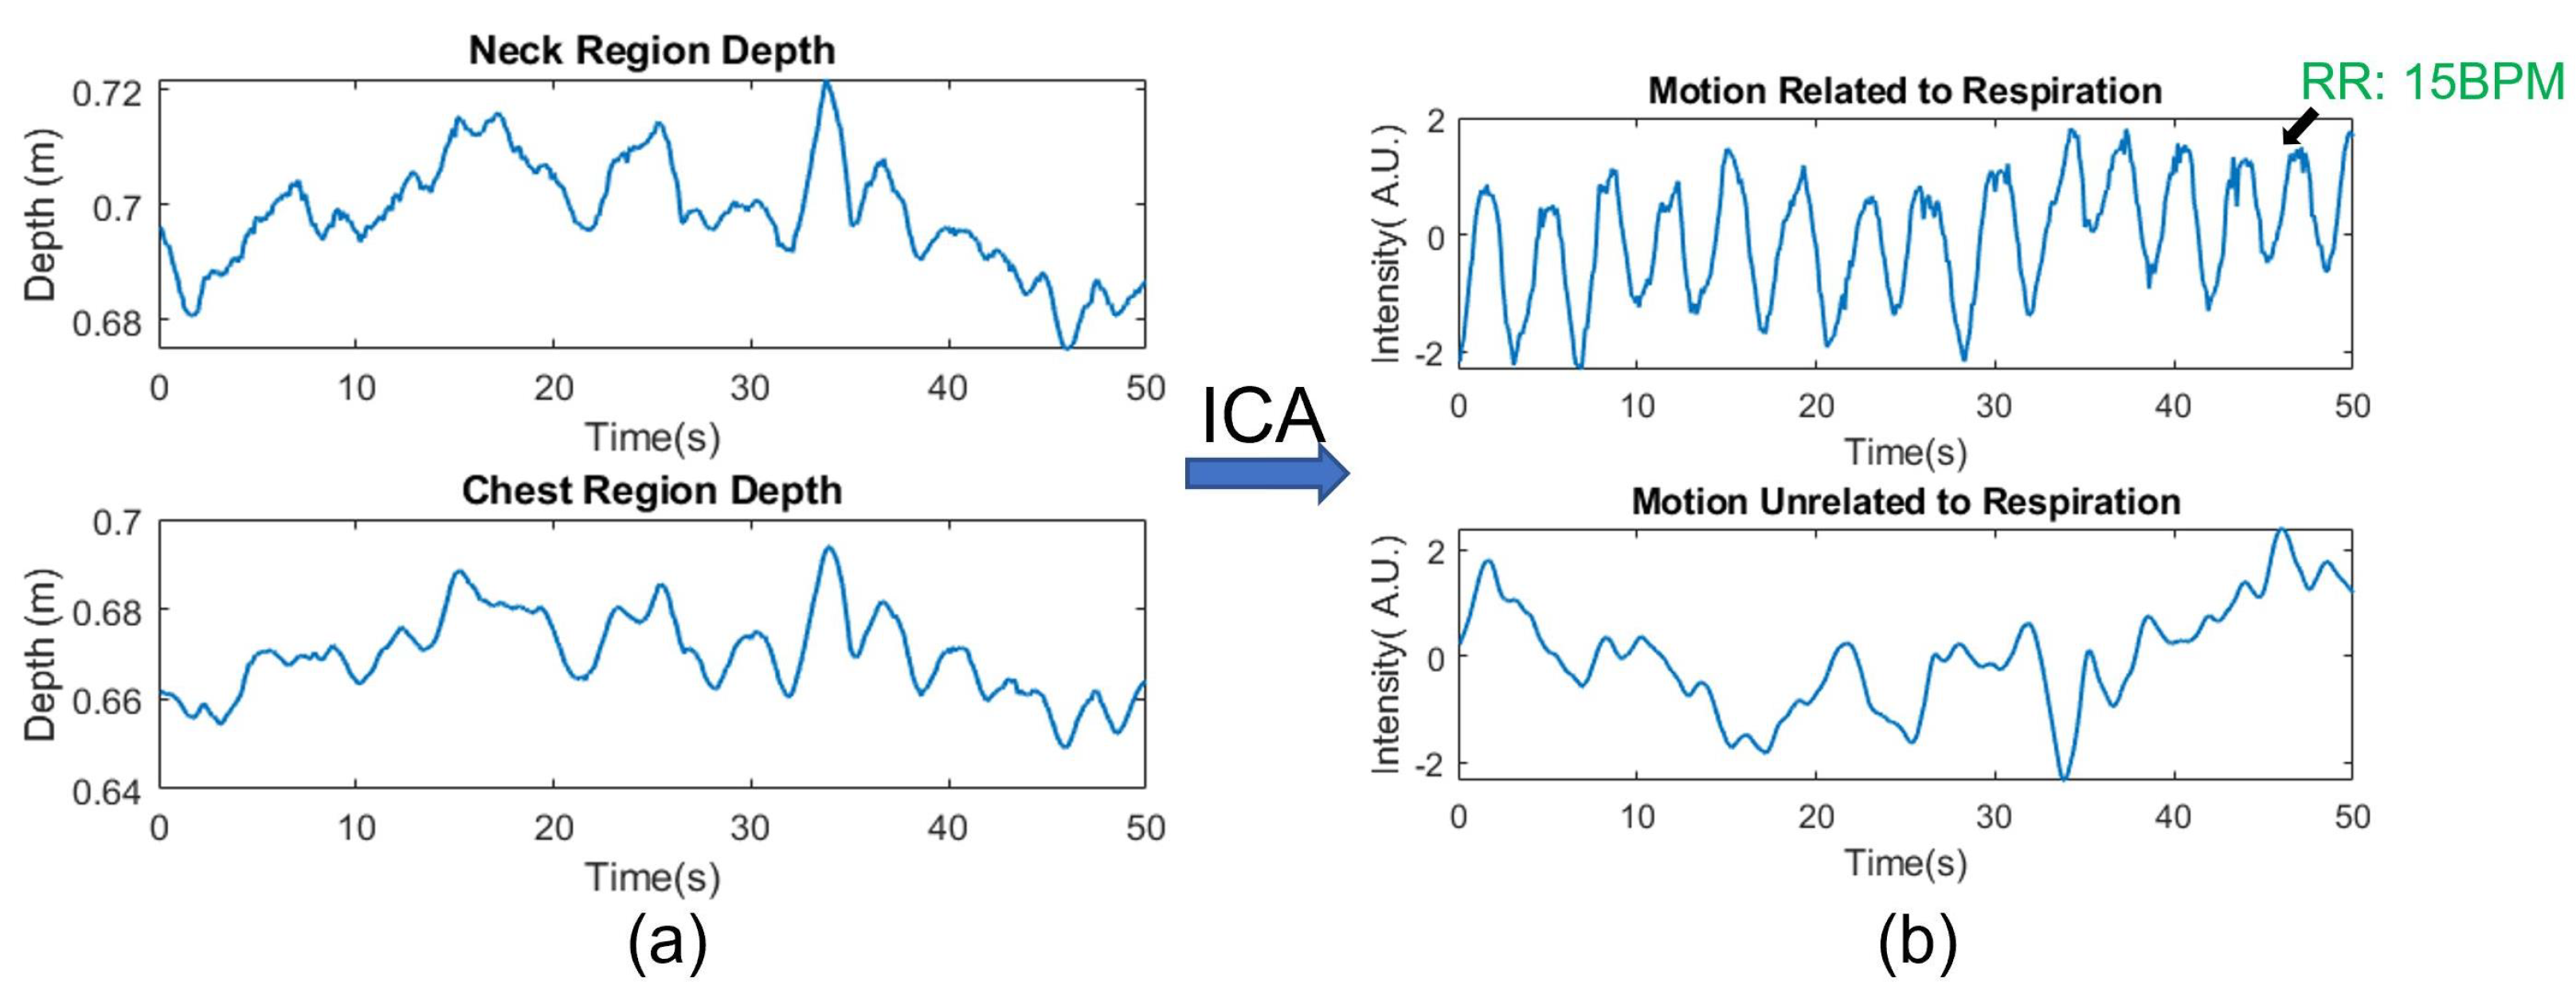
In this study, the RRs are acquired by directly measuring the displacement of the chest wall during respiration. In reality, it is often the case when the users’ bodies are involuntarily moving while the system is measuring the respiration rate. Therefore, similar to the HR measurement, the RR measurement could also suffer from motion-induced artifacts. Even though such an issue is less pronounced in this study as the participants are asked to sit in front of the camera, we still discuss possible methods to mitigate the effects of body motion that is unrelated to respiration. Since the neck region usually moves with the chest but does not show a strong respiration motion, we could use the depth signal on the neck as a reference region to separate the respiration motion from other body motions. Therefore, we could view the depth signal from the chest region as a superposition of the general body motion and the chest wall motion from respiration. A blind source separation method such as Independent Component Analysis (ICA) can then be applied to the raw depth signals to extract the respiration motion. For example,
Figure 20a shows the raw depth signal from the neck and chest region, respectively. The depth signal from the neck region records mainly the motion of the body since respiration does not cause significant muscle contraction on the neck. As a comparison, the signal from the chest region (
Figure 20a bottom figure) is also affected by the overall body motion as the periodic chest wall motion from respiration is masked. The signal after ICA separation is shown in l
Figure 20b. A clear pattern of the chest wall moving back and forth from the respiring motion can now be seen in the top row of the separated signal. The respiratory rate, derived from the first component in
Figure 9, is measured as 15 BPM, while the reference pulse oximeter also measures 15 BPM.
It is also worth noticing that since the method of acquiring the respiration rate relies on directly measuring chest wall movement, any type of clothing, such as a loose sweatshirt or down jacket, that obfuscates the chest wall movement, will prevent the system from acquiring RR. To overcome this limitation, some complementary methods such as deriving RR from HR variability or using a thermal sensor to measure respiration rate can be used in combination with the ToF camera to provide RR measurements in more versatile environments [
5,
7,
26,
27].
5.2. Limitation of Motion Compensated HR Measurement Using ToF Camera
The results of the pilot human study suggest that the magnitude of motion contributes the most to the failure of the HR measurements. When the motion score is relatively small (<0.3 cm), the success rate is 84% while such success rate falls quickly as the motion score increases. The adverse effects of larger motion to the HR measurements seem intuitive as it both makes the ROIs harder to track as well as creates larger intensity artifacts for the ToF camera to compensate. However, there are also some less noticeable factors that can also contribute to the erroneous reading even when the motion artifacts are small.
To obtain a stable signal from a ROI, the ROIs needs to be stably and accurately tracked in every frame. In some cases, reflective spots on the face as well as the changing head pose/facial expression could introduce artifacts to the tracked ROI. For example, we find that the light reflection from the participants’ eyes combined with the blinking motion can sometimes cause the positions of the ROI to jitter, even though the participants are not moving at that time. If such artifacts are present during measurement, it can mislead the system to take the blinking frequency as HR.
In terms of the limitation of the depth-based motion compensation, other than the obvious cases where significant motion overwhelms the underlying HR signal, we also find the system performance degrading when local motions, such as involuntary muscle twitches or facial expression changes [
6,
10], are present. Since the human face is not a rigid body, these local motions can cause intensity artifacts without inducing a change in depth signal at the same time, making them “invisible” to the depth-based motion compensation.
Therefore, the depth signal-based method is more effective toward motion artifacts that induce depth variations that are large enough to be captured by the ToF camera. As an example, global motions, especially scaling and translational motion, can be easily captured by the ToF camera. Even though these larger motions cause large grayscale intensity change on the ToF camera, they can be effectively removed to prevent them from affecting HR measurement.
5.3. Future Improvements
Based on the previous discussion, we believe that the system performance can be further improved by building a more precise model to compensate for motion-induced artifacts and by developing ToF cameras with higher resolution and frame rate. The model we use in this study to compensate for the intensity change caused by motion is relatively coarse as we only consider the average depth change within a larger ROI. If a model can be developed to further utilize the point cloud generated by the ToF camera to take more subtle movements such as head rotation/tilting into consideration, it would expand the types of motion artifacts that the CVSM system can compensate. At the same time, efforts are made to develop an indirect ToF camera with a higher resolution and frame rate [
39]. Higher camera resolution could be useful in improving the ROI tracking performance of the system while a higher frame rate would allow the system to capture the motion of higher frequency without aliasing or motion blur. In addition, to compensate for micro-motion that is not captured by the depth signal, other signal processing techniques such as sparse frequency estimation could be combined with our depth-based motion compensation method to improve the motion artifacts resilience of the system.


 ,
, 


