Article

Comparison of Initial pH Adjustment Prior to Thermophilic Anaerobic Digestion of Lime-Treated Corn Stover via Liquid Digestate or CO2

State Key Laboratory of Agricultural Microbiology, College of Life Science and Technology, Huazhong Agricultural University, Wuhan 430070, China
*
Author to whom correspondence should be addressed.
Appl. Sci. 2021, 11(22), 10884; https://doi.org/10.3390/app112210884
Submission received: 3 October 2021 / Revised: 4 November 2021 / Accepted: 12 November 2021 / Published: 18 November 2021
(This article belongs to the Section Agricultural Science and Technology)

Abstract

:
Neutralization with liquid digestate and CO2 was compared herein to adjust the pH of lime-treated corn stover. The effects on the thermophilic (55 °C) anaerobic digestion were also analyzed. Liquid digestate neutralization (LDN) caused a decrease in pH from 10.5 to 7.5 in 60 h and accumulation of acetic/isobutyric acids. The CO2 neutralization (CN) under solid-state conditions reduced the pH from 10.5 to 8.5 in 30 min, which is faster than that of LDN and did not affect the subsequent anaerobic digestion. Biomethane production rate indicates that LDN contributed to the performance of anaerobic digestion, but this was not sufficient to compensate for the loss of total biomethane yield, resulting in a negative net profit (i.e., revenue from increased energy production minus reagent cost). For CN under solid-state conditions, the biomethane production was highest in both liquid- and solid-state anaerobic digestion, and also obtained a net profit of 98.74–100.89 RMB/tonne dry biomass. Therefore, the solid-state condition CN is a more efficient and economic method for adjusting initial pH of lime-treated corn stover.

1. Introduction

Anaerobic digestion (AD) is an environment-friendly and sustainable technology for the treatment of agricultural residues for recovering energy in the form of biogas and organic fertilizer raw materials in the form of digestates [1,2]. AD can be categorized according to the total solids (TS) content as liquid AD (L-AD) and solid-state AD (SS-AD) [3], and it can also be grouped into mesophilic AD (30–40 °C) and thermophilic AD (50–60 °C), according to the operating temperature [4,5]. As less moisture increases equipment efficiency and reduces heating demand [6], while higher fermentation temperatures accelerate biogas production and reduce retention time [4], a growing corpus of studies has been focused on thermophilic SS-AD [7,8,9].
As a representative member of the agricultural residues, corn stover (CS) primarily comprises three types of polymers: cellulose, hemicellulose, and lignin. However, a rigid three-dimensional matrix formed by cross-linking the three components constrains the efficient biological deconstruction [6]. Thus, pretreatment is generally required prior to AD for enhancing the enzymatic accessibility and subsequent biodegradability of CS. Various pretreatment strategies have been previously used for lignocellulosic biomass, including biological, physical, chemical, physicochemical, and combined methods [10]. Among the existing pretreatment technologies, alkali pretreatment is considered one of the most promising options, considering its high efficiency in delignification and high final total sugar yields [11]. Calcium hydroxide/calcium oxide has been extensively studied as a potential reagent based on the cost-efficiency [12,13,14]. Ca(OH)2 single-batch pretreatment and NaOH consecutive-batch pretreatment with leachate reuse have been compared for giant reed. The net benefit (revenue from increased energy production minus chemical cost) of Ca(OH)2 pretreatment was positive at $1.1–5.8/ton dry biomass, whereas that of the NaOH was negative [15]. As the solubility of Ca(OH)2 in water is considerably lower than that of NaOH or KOH, some of the unreacted solids remaining on the surface of the biomass were wasted. Therefore, a recirculating system for the saturated lime solution was introduced by researchers [16] to further reduce the chemical costs.
However, the final pH after the alkali pretreatment process is typically >10.0, while the acceptable pH for AD is typically in the range of 6.5–8.5. Therefore, lowering the pH to the range where AD can be successfully initiated is the required step, including washing with deionized water, adding organic or mineral acids [17], or using gaseous carbon dioxide or biogas to neutralize alkali [18,19]. These methods suffer from considerable limitations for practical applications, despite the fact that they are easily applicable in the laboratory conditions. The large volumes of wastewater generated during the washing process or bubbling gases and the extra chemical costs caused by adding acids should be considered by the industry.
Liquid digestate (LD) from AD systems is rich in microbes for bioconversion. Previous studies have reported that LD could be utilized as a microbial agent for the bio-pretreatment of lignocellulosic biomass [20,21,22,23]. Notably, acidogens from these microbes are also potential candidates for reducing the pH. Additionally, enzymes from microorganisms can attack inert lignocellulose and convert it into volatile fatty acids (VFAs) that are easily fermented, which may accelerate the subsequent AD process. Hence, to the best of our knowledge, the use of LD to neutralize alkali-pretreated CS for the initiation of AD is reported herein for the first time.
For alkali-treated materials immersed in liquids, gaseous CO2 or biogas has been previously utilized as an effective aid for alkali neutralization [18,19]. However, gas-neutralization of CS with high TS content has not been investigated yet, as most of the pretreatment processes were seemingly carried out at high water content. To avoid generation and disposal of waste chemical solution, the use of limited water was considered to be a simpler, more cost-effective, and more environmentally friendly method [24]. In order to continue this idea of water conservation, it is necessary to explore the gas-neutralization under solid conditions.
To this end, the objectives of this study are: (1) to investigate the effect of LD on reducing pH of alkali-pretreated CS; (2) to attempt CO2-neutralization in the substrate state with high TS content; and (3) to compare the applicability of the two methods for the thermophilic AD (liquid or solid state) of lignocellulosic feedstocks.

2. Materials and Methods

2.1. Samples

The employed CS was provided by a farm (Lianyungang, China). It was hammer milled through a 10-mesh sieve, and then stored in bags at room temperature for further use. The fermentative inoculum and LD were derived from a lab-scale (30 L) thermophilic (55 °C) semi-continuous L-AD digester that had been exclusively loaded with lignocellulosic biomass for >2 years to ensure high microbial activity. Prior to use, the previously stored substrate, freshly collected inoculum, and LD were determined to obtain the conventional physicochemical characteristics presented in Table 1.

2.2. Lime Pretreatment

In this work, lime pretreatment was carried out at a high solid–liquid ratio for water conservation. Every 100 g of CS (dry mass) was mixed with 300 mL of tap water and 8.0 g of Ca(OH)2 in a 5-L flask at a loading rate of 8% (g Ca(OH)2/g initial TS of CS biomass). The mixture was transferred into foil pouches, sealed with thermoplastic, and stored at 30 ± 1 °C for 7 days.

2.3. Neutralization of Lime-Treated Corn Stover

Neutralization with LD (LDN) was performed in 1 L plastic boxes. Mixtures of LD with lime-treated CS (wet mass) in different ratios (v/w) were effective in reducing pH, with 1:1 being the best (Supplementary Data Figure S1). So, in this section, every 200 g of lime-treated CS (wet mass) was mixed with 200 mL of LD at a loading ratio of 12.3% (TS of CS biomass). The plastic boxes were covered with fresh wraps and were further incubated at 30 ± 1 °C for 60 h in triplicate. The samples were taken at 12-h intervals to monitor the changes in pH and VFAs. The neutralized CS was then divided into two parts, one for L-AD directly and the other for SS-AD after dehydration by extrusion to 25–28% TS.
Two influencing factors were examined in the CO2 neutralization (CN) including CO2 concentration and moisture. The 100% CO2, 50% CO2 (simulating biogas with methane replaced by nitrogen for safety reasons), 25% TS, or 9.1% TS were considered. More specifically, 160 g of lime-treated CS (wet mass) was fed into a 1 L plexiglass cylindrical vessel directly or mixed with 280 mL of distilled water. Subsequently, two separate concentrations of CO2 were purged from the bottom for 30 min at a flow rate of 0.2 L min−1. The pH was measured every 5 min. For CS immersed in distilled water, the pH was measured directly; for CS in the solid state, 2 g of sample was taken and mixed with 20 mL of distilled water and shaken for 20 min before measurement. Afterward, the lime-treated CS was oven-dried at 105 °C for 8 h and subsequently stored in a sealed plastic bag at 4 °C before digestion tests. CN was repeated three times.
The lime-treated CS was washed with tap water (WW) in 1 L plastic boxes until the pH decreased to 8.0 and then oven-dried at 105 °C for 8 h and stored in a sealed plastic bag at 4 °C for future use. The characteristics of CS after performing the above three neutralizations were shown in Table S1 (Supplementary Data).

2.4. Biomethane Potential Test

To investigate the effect of the pre-operations on CH4 yield from CS, a biomethane potential (BMP) test was conducted in triplicate bottles with a total volume of 500 mL and a working volume of 400 mL. The parameter settings of the BMP test referred to some suggestions from Holliger et al. [25] and the results of some pre-experiments (Supplementary Data Figures S2 and S3). In particular, the inoculum injection was operated in the ratio of 1.6 (inoculum/substrate) on the basis of VS (volatile solids), and the substrate concentration was 12.5 gVS/L. No additional nutrients or alkalinity was added. The headspace gas of each reactor was replaced with pure N2 before starting the test. The BMP test was additionally performed under the thermophilic conditions (55 °C) and intermittent stirring (30 s clockwise, 30 s counterclockwise, and then 60 s rest in each cycle) for dozens of days until the daily methane yield was less than 1% of the total methane production. Microcrystalline cellulose was used as a positive control.

2.5. Batch Liquid Anaerobic Digestion Test

The batch L-AD test was conducted in reactors with a total volume of 500 mL and a working volume of 400 mL. The CS loading of each reactor was 50 g VS/L with reference to the previous settings [21], and then the inoculum was set at an S/I ratio of 4 (VS basis) based on the results of pre-experiments (Supplementary Data Figure S4). The same 400-mL working volume was adjusted by the extra addition of tap water, resulting in an initial TS concentration of 7.4–7.9%. Briefly, based on VS, 20 g of substrate (treated with the three neutralization methods described above), 5 g of inoculum and some required water were added to a series reactors. Subsequently, the mixture was flushed with pure N2 for 5 min to remove O2, followed by incubation at 55 °C for 30 d. The same intermittent stirring parameters as in the BMP test were selected. Pure inoculum was applied as a control. All treatments were conducted in triplicate.

2.6. Batch Solid-State Anaerobic Digestion Test

The batch SS-AD test was established in 100-mL glass bottles without mechanical stirring or leachate recirculation. The S/I ratio was 6 (VS basis) [26] and the initial TS content was 20% [7]. To this end, 9 g of substrate treated with the three neutralization methods described above and 1.5 g of inoculum were thoroughly mixed on the basis of VS, and the initial TS levels were regulated by tap water. Then, about 65 g of the total mixture was added to the series of 100-mL anaerobic reactors. Subsequently, the reactors were flushed with pure N2 for 5 min to provide an anaerobic environment and then fermented at 55 °C for 30 d. Pure inoculum was used as the control. All treatments were conducted in triplicate.

2.7. Analytical Methods

CH4 production was monitored daily using an automated methane potential testing system (RTK-BMP, Rocktek Instrument, Wuhan, China), which was normalized by converting the temperature and pressure to the standard state (0 °C, 101.325 kPa).
TS, VS, and alkalinity of the inoculum, CS, and LD were determined according to standard methods [27]. Total nitrogen concentrations were measured using a Kjeldahl analyzer (K99860, Hanon, Jinan, China). Total organic carbon was analyzed by a TOC Analyzer (Elementar, Vario TOC, Hannau, Germany). The lignocellulose content was determined using HPLC (1200, Agilent, Santa Clara, CA, USA) according to the analytical procedures provided by NREL [28]. To quantify VFAs, 2 g of sample (fresh matter) and 20 mL of distilled water were mixed and shaken for 20 min, followed by centrifugation at 4000 rpm for 5 min, after which the pH of 4 mL supernatant was adjusted to 2–3 by formic acid and then measured using a GC system (7890A, Agilent, Santa Clara, CA, USA) equipped with a 30 m × 0.32 mm × 0.25 μm DB-FFAP column and a flame ionization detector.

2.8. Data Analyses

The modified Gompertz equation was fitted to the measured cumulative CH4 production curves of L-AD and SS-AD, respectively, as shown in Equation (1) below, which was developed by Lay et al. [29]:
P ( t ) = P m exp { exp [ R m e P m ( λ t ) + 1 ] }
where P(t) is the cumulative CH4 production (mLN) at time t, Pm is the maximum CH4 potential (mLN) at the end of incubation time, t is time (d), Rm is the maximum CH4 production rate (mLN·d−1), λ is the lag phase (d), and e is the base of natural logarithms, that is, 2.71828. The three parameters Pm, Rm, and λ were estimated using the nonlinear curve fit program in the GraphPad Prism 8.0.1 software (GraphPad Software, San Diego, CA, USA, 2018).
Standard deviations and statistical differences were analyzed using the GraphPad Prism 8.0.1 software. All figures in this manuscript were also created using the above software.

3. Results and Discussion

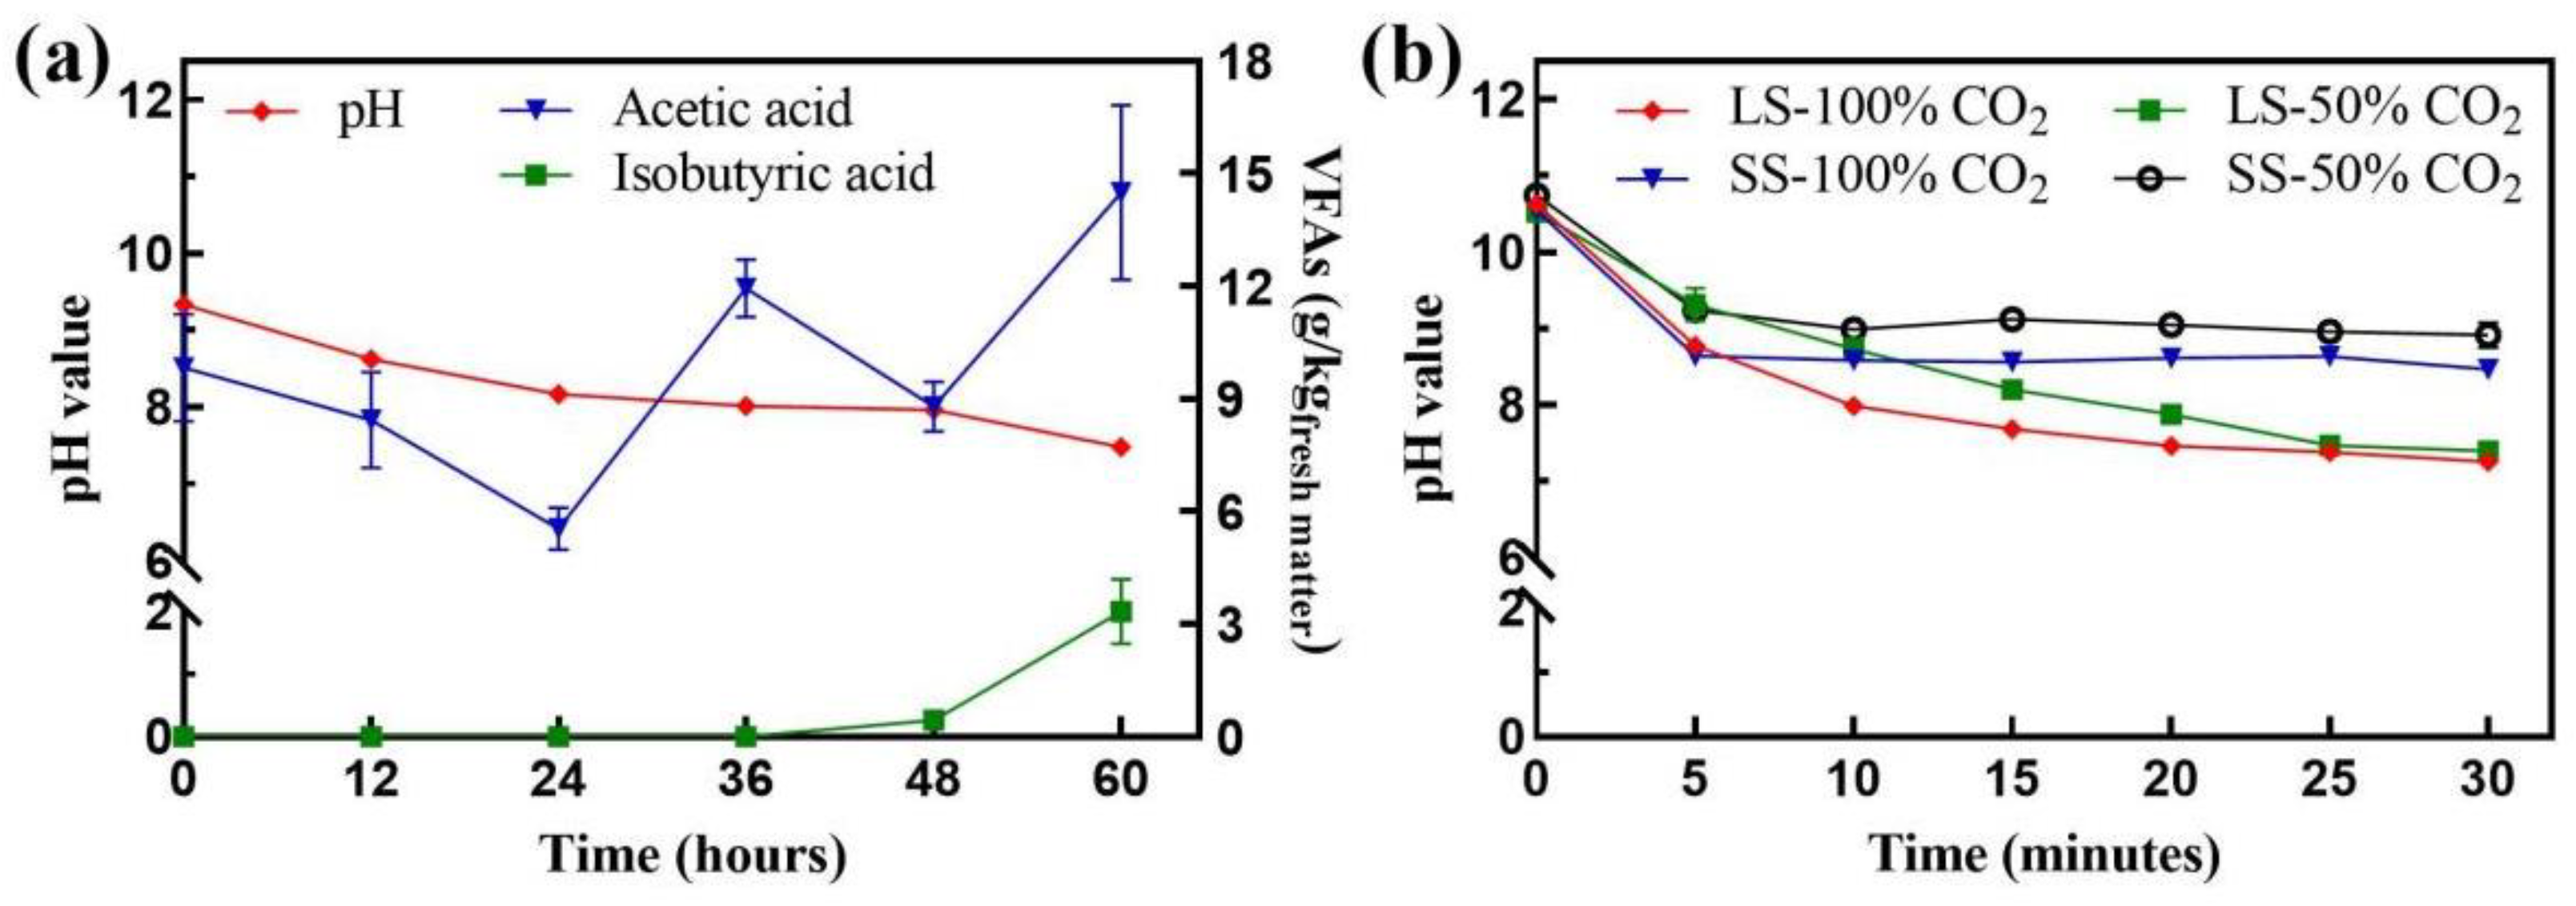
3.1. Reduction in pH and Accumulation of Volatile Fatty Acids during Liquid Digestate Neutralization

The LDN process significantly (p < 0.05) reduced the pH from 9.3 to 7.5 during 60 h (Figure 1a), indicating that the method could effectively decrease the pH of the alkali-treated CS. There were two drivers behind this reduction. First, the direct and immediate neutralization reaction caused the pH of the lime-treated CS to drop from approximately 10.5 to 9.3 during the mixing process at 0 h (omitted from Figure 1). Second, the LD contained sufficient acid-producing microbes to further reduce the pH by continued acid production during subsequent incubation. Notably, LD arguably contains not only acid producers but also acid consumers. However, the LDN process was carried out under non-strictly anaerobic and overloaded conditions, which were not conducive to the activity of acid-consuming microorganisms, thus, breaking the imbalance between the acid production and consumption rate [30,31]. Consequently, we utilized this imbalance to decrease the pH and stopped it in time. This was also conductive to avoid over-acidification, which could affect the subsequent AD.
As shown in Figure 1a, a certain amount of acetic acid appeared at 0 h, which was one of the by-products generated during the alkali treatment process [32]. Acetic acid first decreased gradually from 9.8 to 5.5 g/kgfresh matter within 24 h, then gradually accumulated and finally reached 14.5 g/kgfresh matter at 60 h. As for isobutyric acid, it started appearing after 36 h, and finally reached up to 3.3 g/kgfresh matter at 60 h. Surprisingly, no accumulation of propionic, n-butyric, and valeric acid was identified throughout the process. This finding contradicts the previous reports on over-acidification [30,33], seemingly because the pH of the LDN process did not drop to 6.5, or even lower, as typically observed in the case of over-acidification. The production of these VFAs was responsible for the reduction in pH, but it is worth noting that the drop followed by the rise in acetic acid implied that part of the biomass that could have produced biogas in the future was inevitably metabolized by these acid consumers. To avoid excessive biomass loss during pH reduction, the effect of different pH endpoints neutralized by LD on the cumulative/daily methane production has been compared in BMP tests with lime-treated CS and pH 7.6 was finally chosen as the endpoint for LDN (Supplementary Data Figure S5).

3.2. Reduction in pH during Gas-Neutralization

As seen from Figure 1b, after 30 min of 100% CO2-neutralization, the pH of lime-treated CS decreased significantly (p < 0.05) from 10.5 to 8.5 (solid-state condition) and 7.3 (liquid-state condition), respectively. In particular, the pH of the CS in the solid condition nearly stopped changing from the 5th min onwards, while the pH of the CS in the liquid condition had been further continuously decreasing over the observed time range, despite the trend becoming increasingly slow. By comparison, it has been reported that 100% CO2-neutralization in the liquid state can reduce the pH to 6.8 and 7.0, respectively [18,34]. This is probably because the alkali-treated lignocellulose releases alkaline substances more easily after immersion in water, and CO2 dissolved in it completes the acid–base neutralization reaction.
Figure 1b illustrates the results of 50% CO2-neutralization. A similar phenomenon to those mentioned above with a slightly less effective pH reduction was identified. For the liquid condition, nearly the same pH endpoint was shown (p > 0.05), but the slope changed more slowly, while for the solid state, the pH endpoint was higher, approximately 8.9 (p < 0.05). This finding indicates that the simulated biogas (containing 50% CO2) was not suitable for neutralization reactions under solid-state conditions.
To the best of our knowledge, the CO2-neutralization process under solid-state conditions was used for the first time. Although the final lower pH limit was higher than that of the liquid method reported earlier by other studies, it still meets the requirements for the AD initiation if operated with 100% CO2. It was also more convenient for SS-AD as no additional water was required.

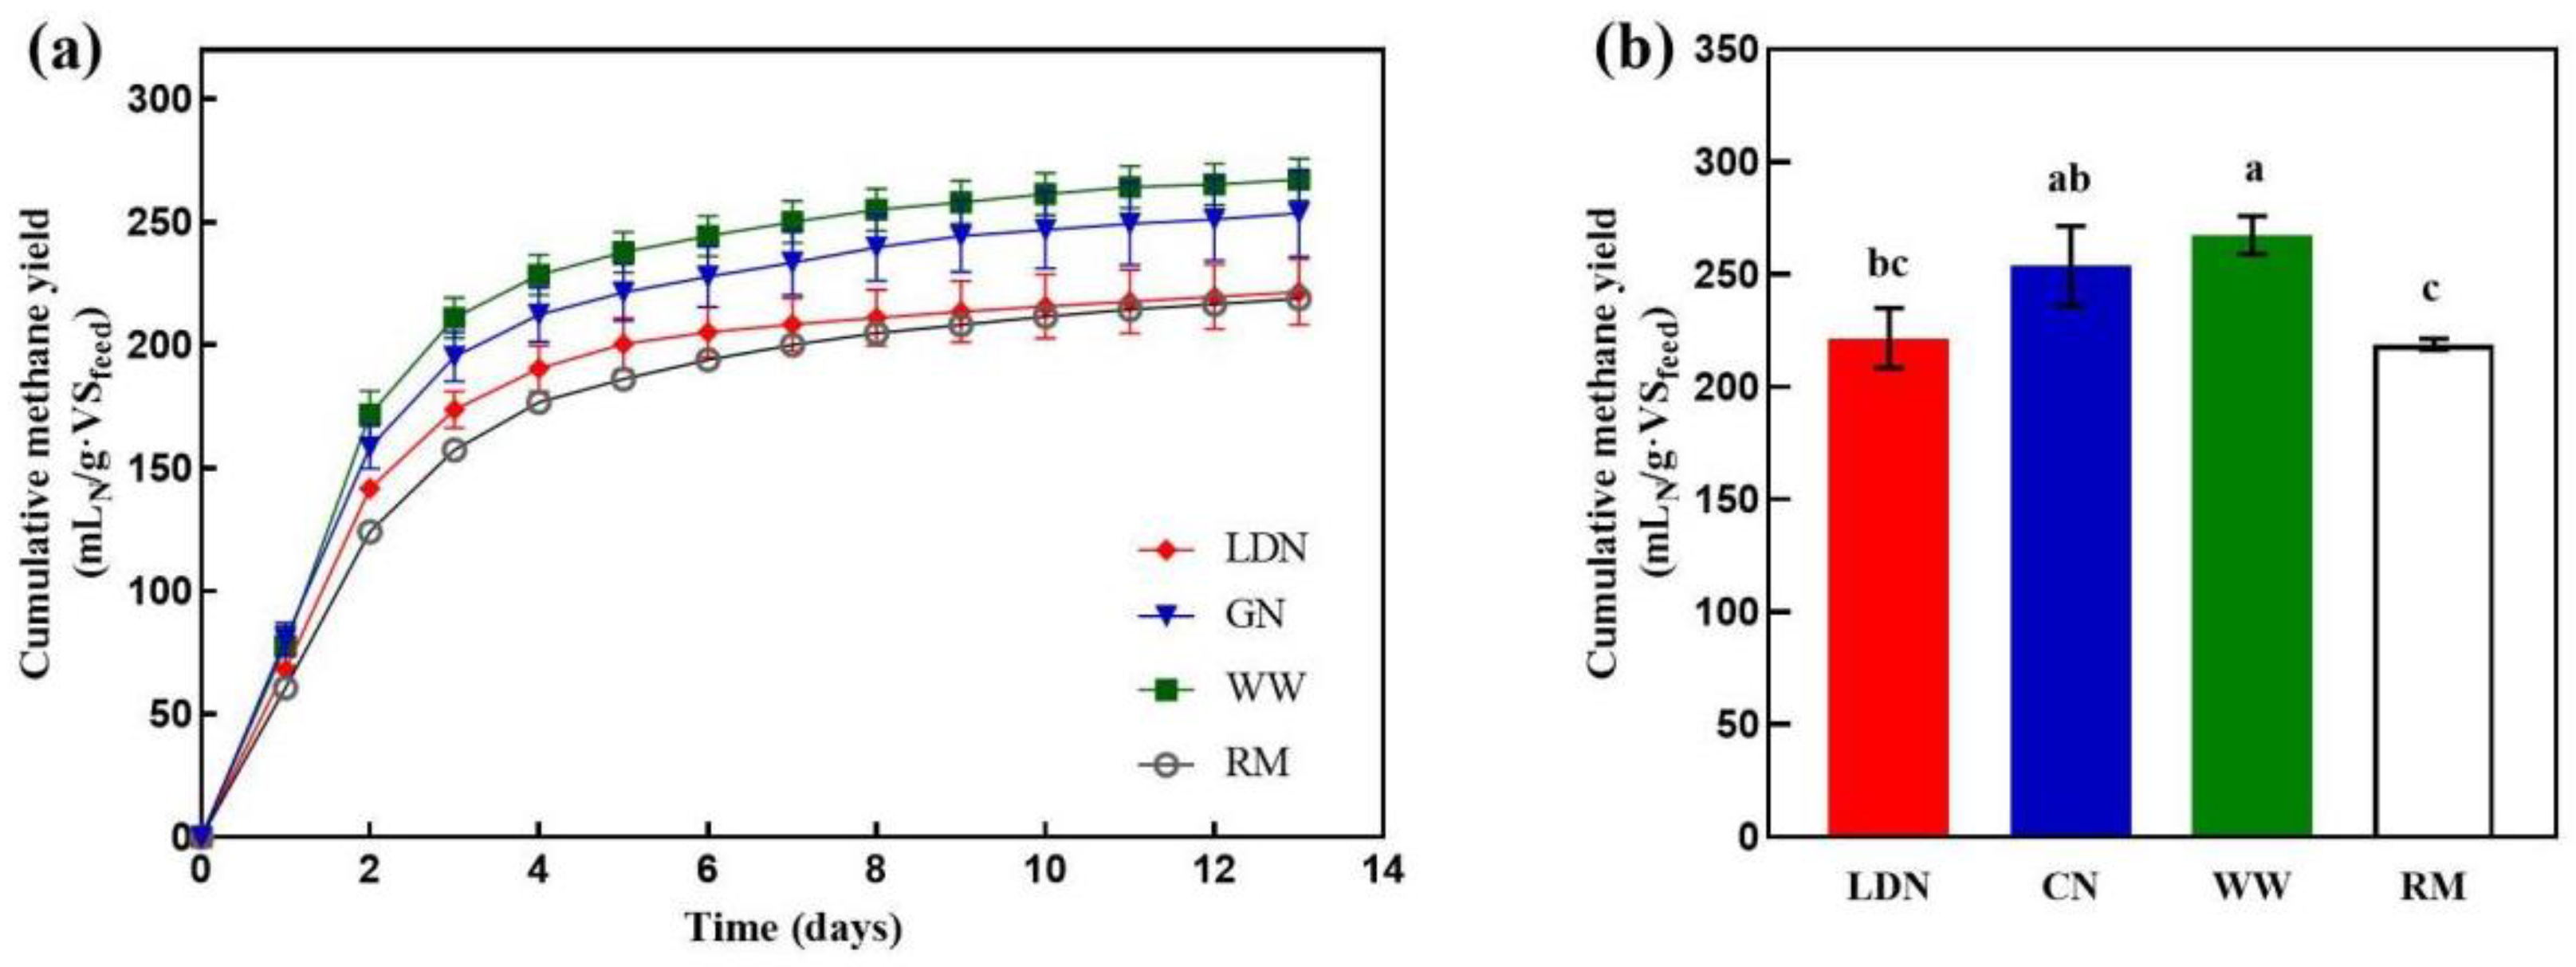
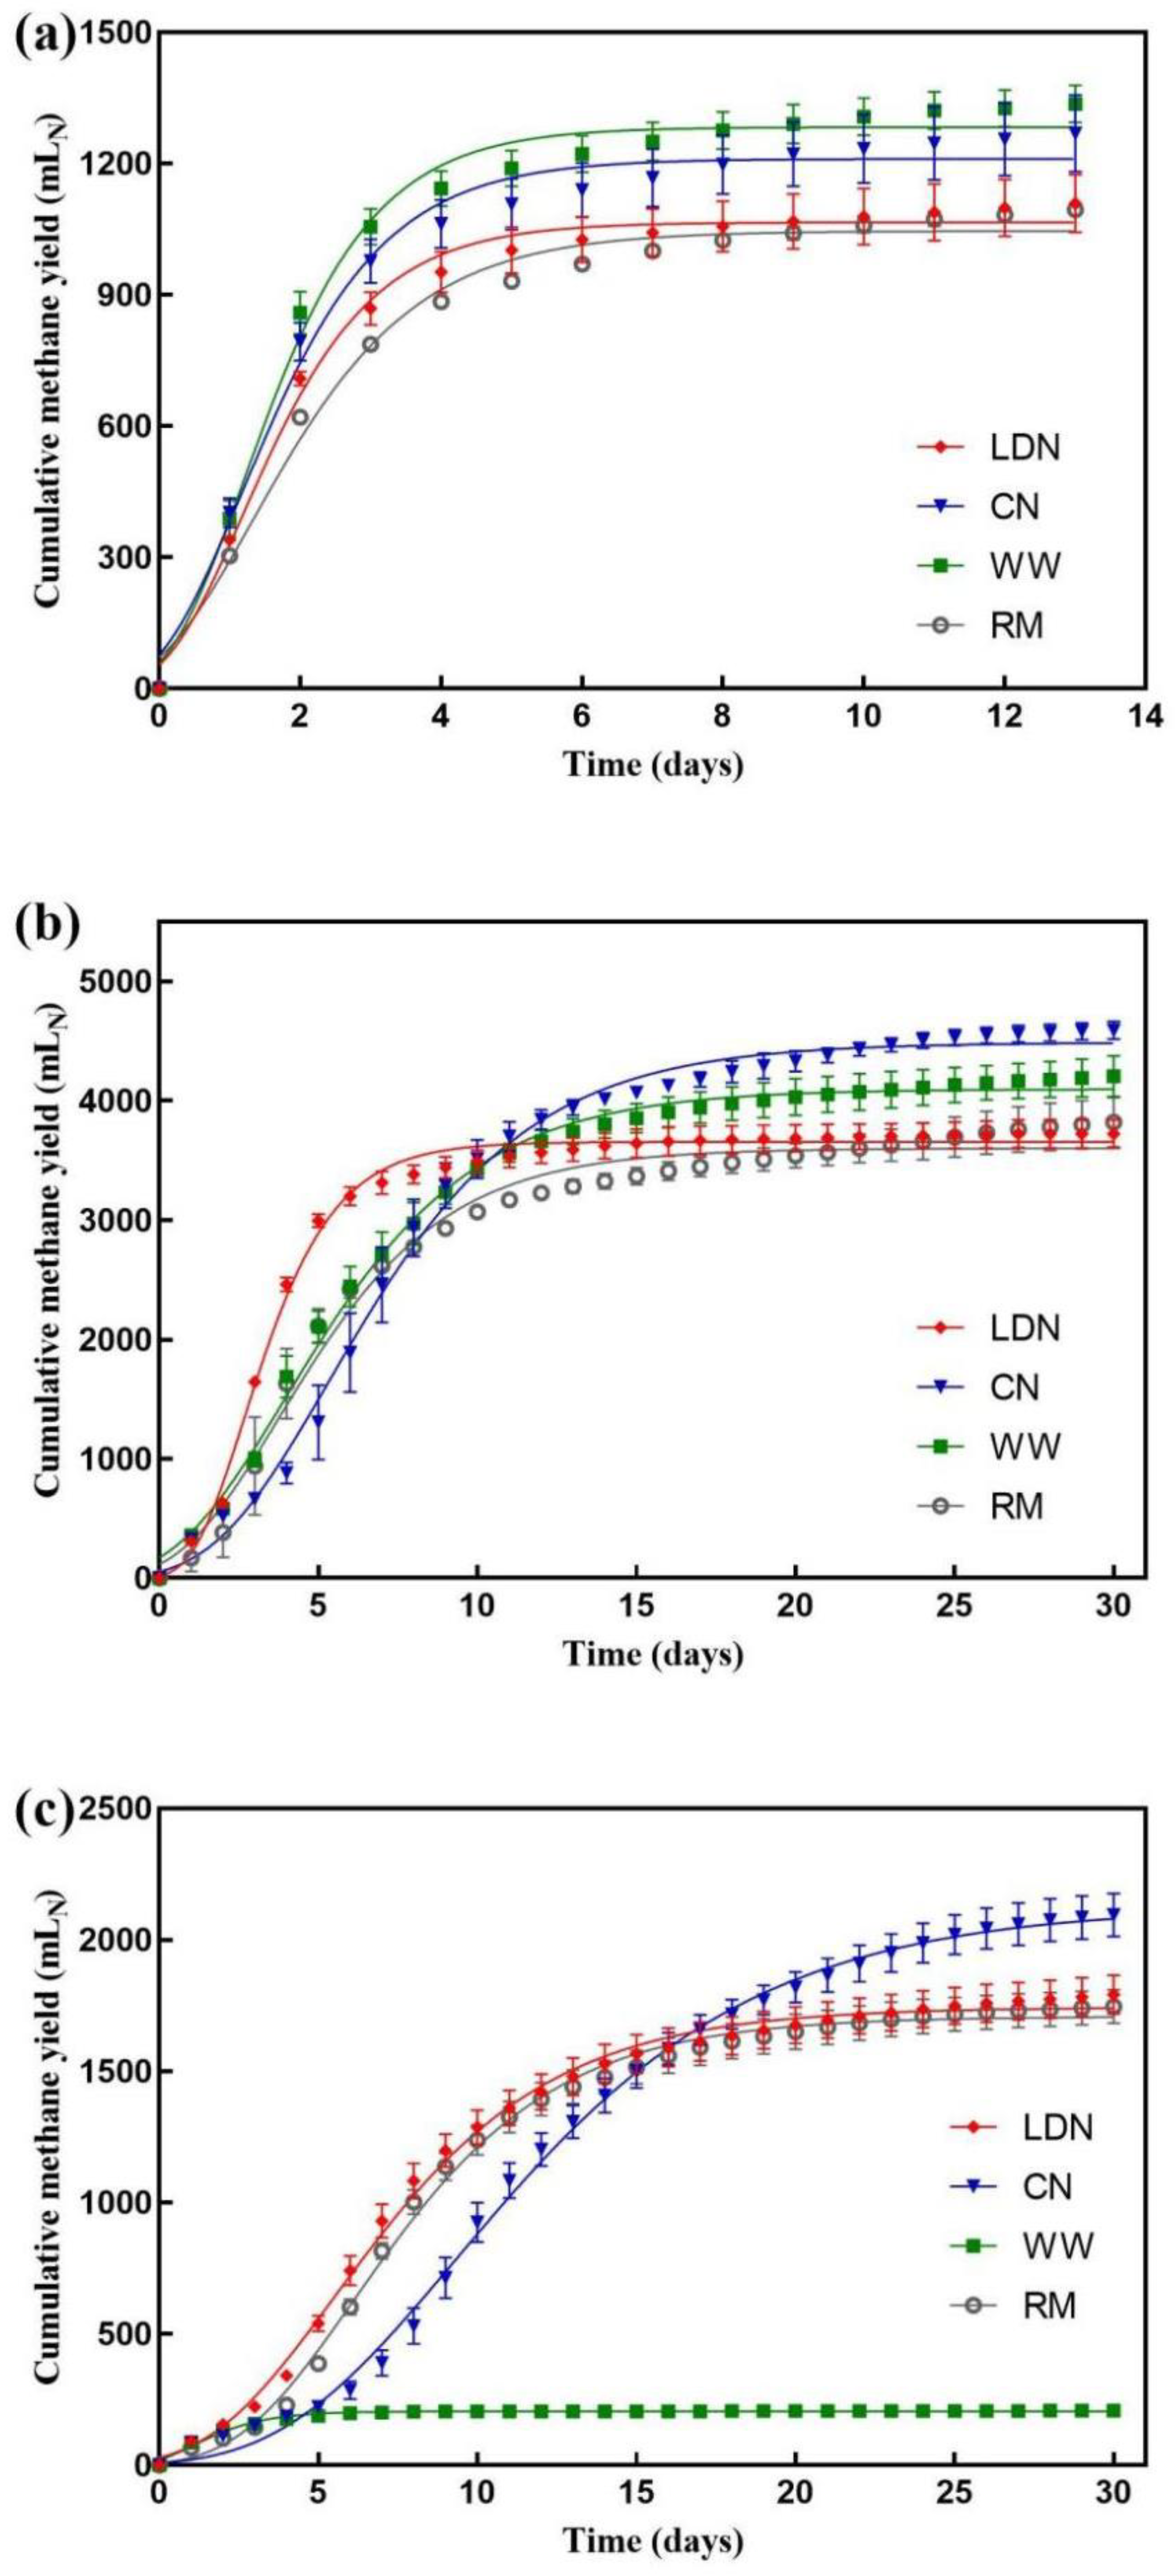
3.3. Effect of Neutralization on Biomethane Potential Test

The purpose of the BMP test was to investigate the effects of different treatments on the biomethane potential. As shown in Figure 2a, the curves have a similar trend. And Figure 2b displays that the total methane yield for raw material (RM) was 218.9 mLN·gVSfeed−1 whereas it was 267.3, 253.7, and 221.6 mLN·gVSfeed−1 for neutralization with WW, CN, and LDN, respectively. The total methane yield of WW was the highest, seemingly due to a large amount of water washing that removed the non-fermentable inert components (e.g., lignin) from VS. This yielded the highest percentage of fermentability, while causing the large amounts of wastewater at the same time. There was no significant difference (p > 0.05) between CN and LDN, but LDN was slightly lower than CN, seemingly because the acid consumers from the LD triggered a part of the loss of methane potential during the pH reduction process.
Overall, these results suggest that different neutralization methods have different degrees of impact on the biomethane potential of CS. Compared to RM, 22.11% and 15.90% improvements were identified for WW and CN, respectively. The increase in methane production was associated with the lime pretreatment [15,35,36], but the difference in the degree of improvement emerged because the washing process had inevitably concentrated the fermentable fraction. Alas, LDN, with the drag of the acid consumers, completely diminished the increase caused by lime pretreatment.

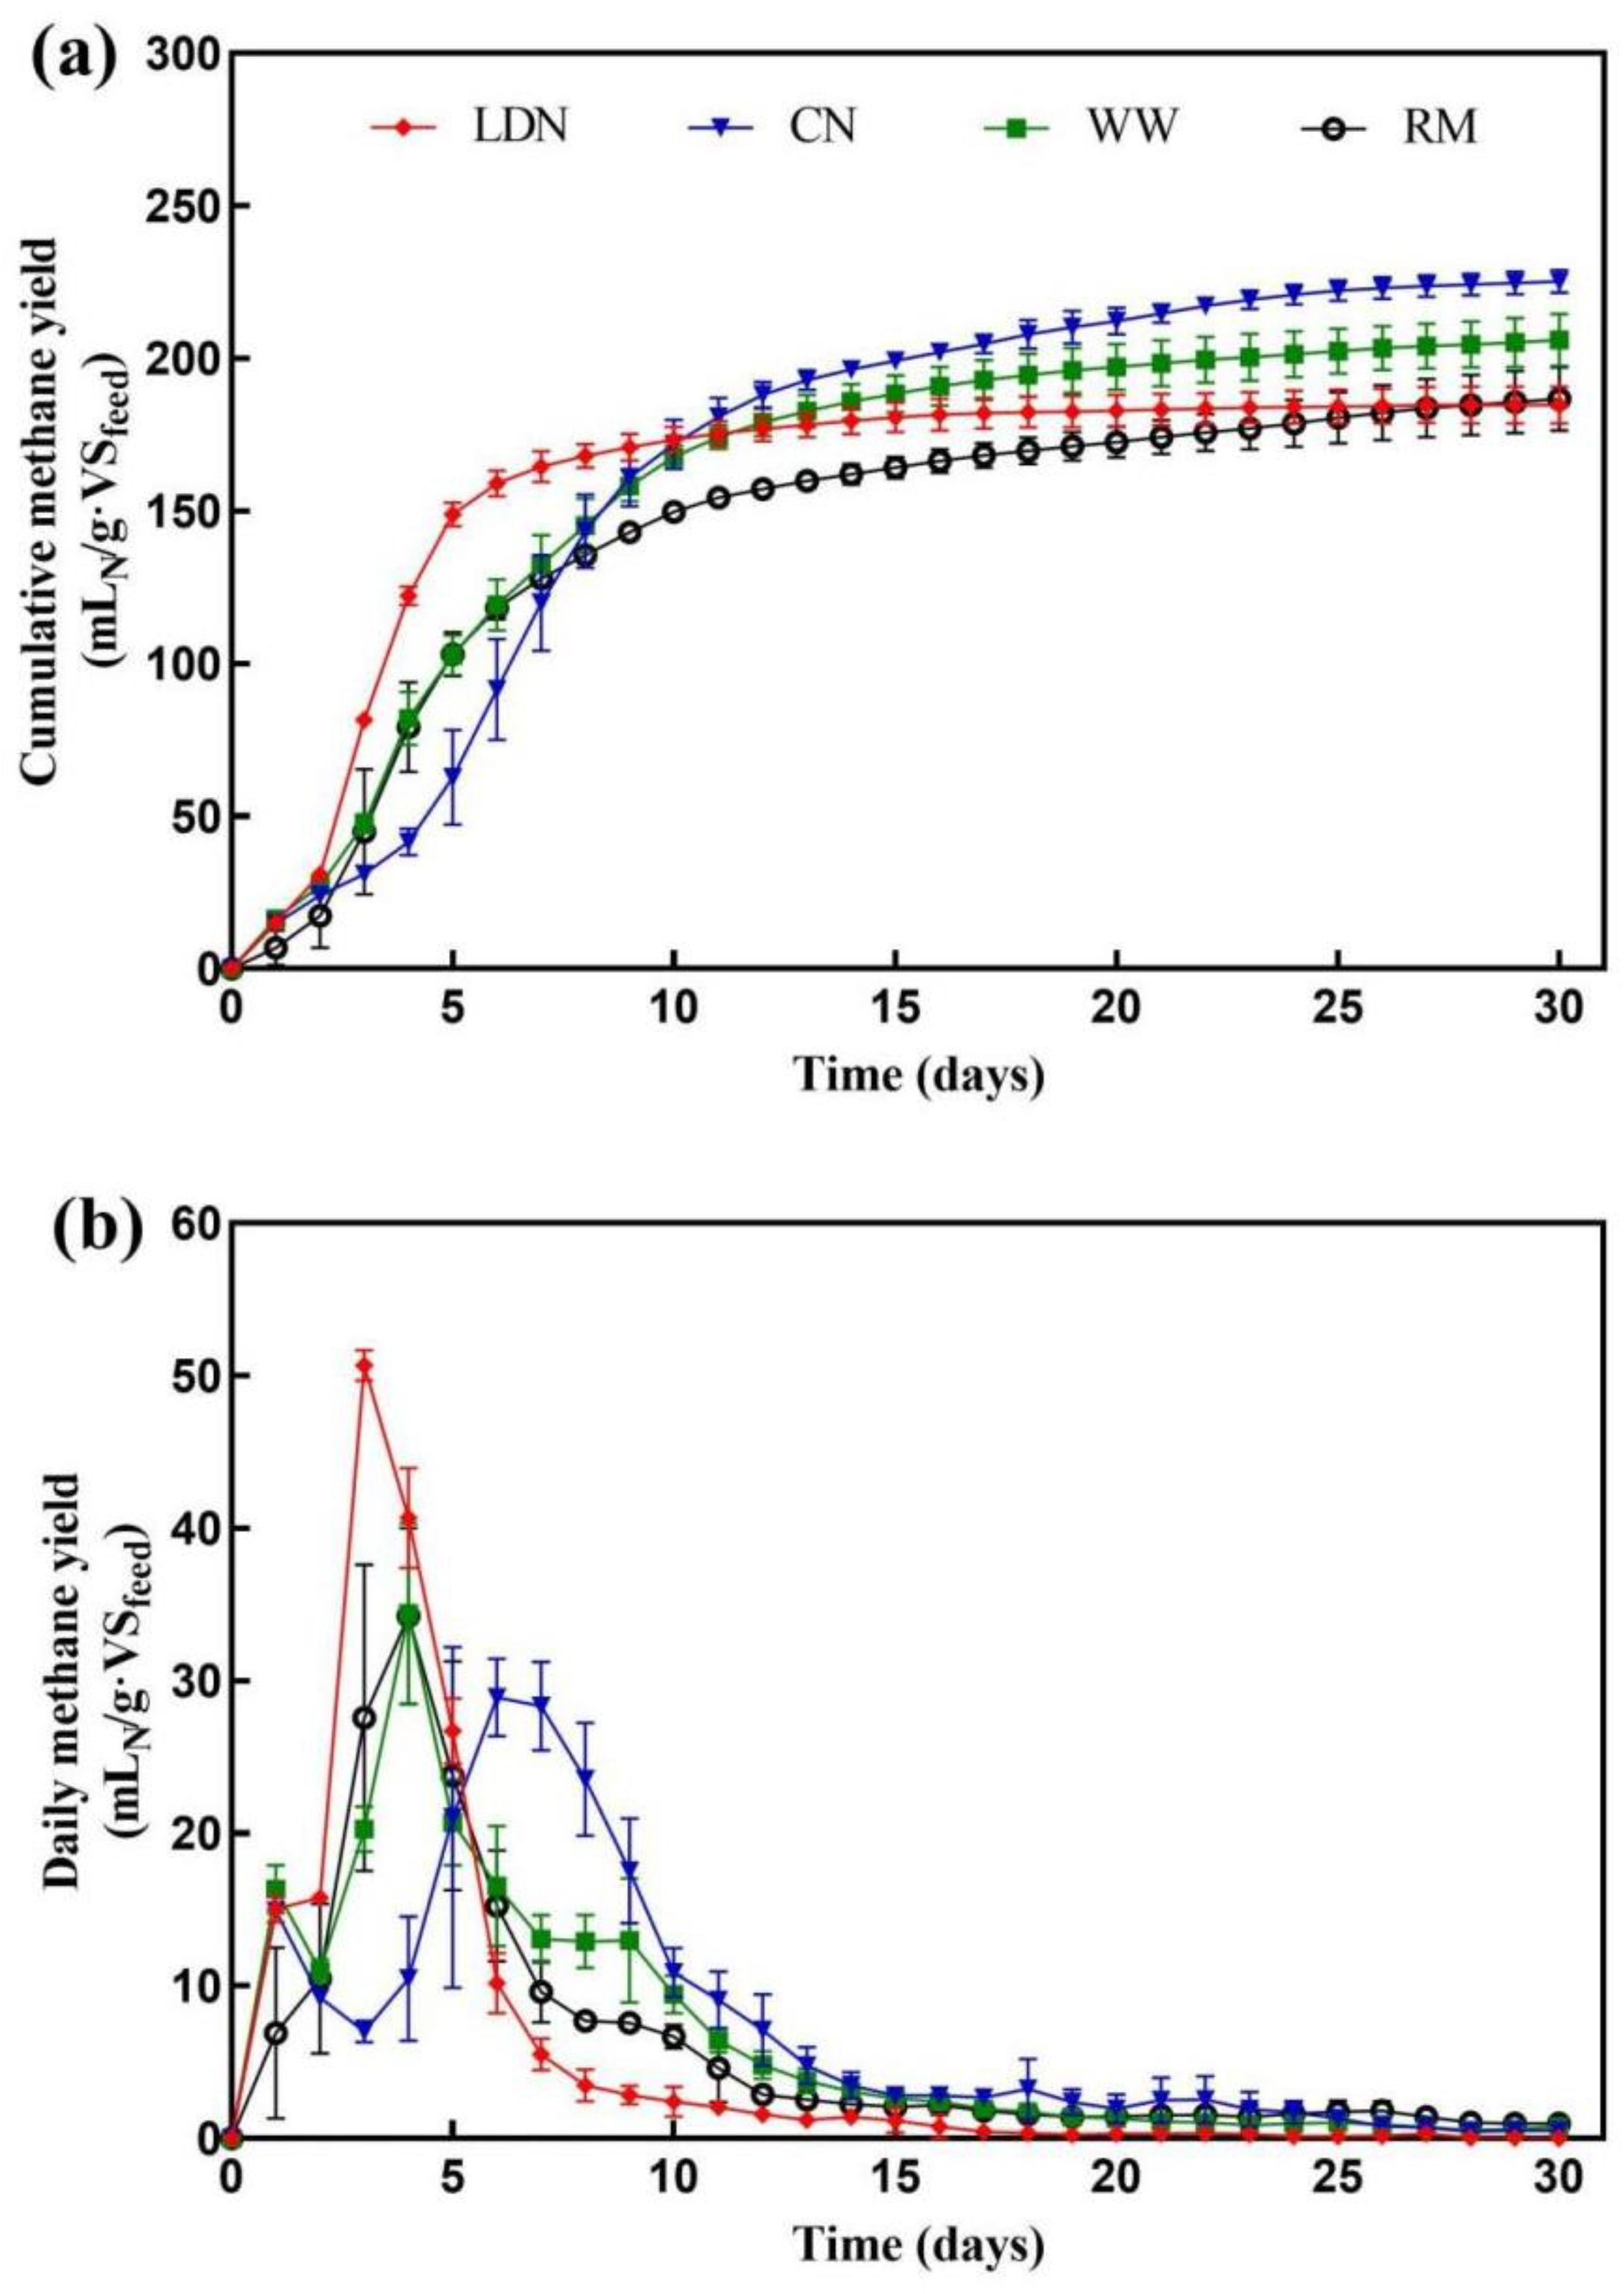
3.4. Effect of Neutralization on Thermophilic Liquid Anaerobic Digestion

To explore the applicability of different neutralization treatments for thermophilic L-AD, the cumulative methane yields and daily methane yields of the reactors are presented in Figure 3. The cumulative methane yields of all reactors with different neutralization treatments ranged between 186.7–225.3 mLN·gVSfeed−1, while the CN had the highest yield with a significant (p < 0.05) increase of 20.6% over that of RM. However, the peak of CN’s daily methane production occurred the latest, on day 6, even 2 days later than that of RM. Jiang et al. [15] did not find any AD initiation lag when using lime for pretreatment, seemingly because they removed the fermentation inhibitors by washing with water, while CO2 neutralization did not. The inhibitors were derived from the side products released during the lignocellulosic pretreatment process, and they can have a negative impact on the enzymatic activity, growth, and metabolism of the microbial community associated with the AD process [37]. Similarly to the BMP test, the cumulative methane production of LDN was not significantly (p > 0.05) different from that of RM. Hu et al. [20] found that LD would cause the consumption of soluble substrate, which could explain our experimental results. However, the earliest peak in the daily methane production of all reactors was observed at LDN, likely due to the destructive effect of microorganisms in the LD on the dense structure of the CS, which was confirmed by a previous report [21].

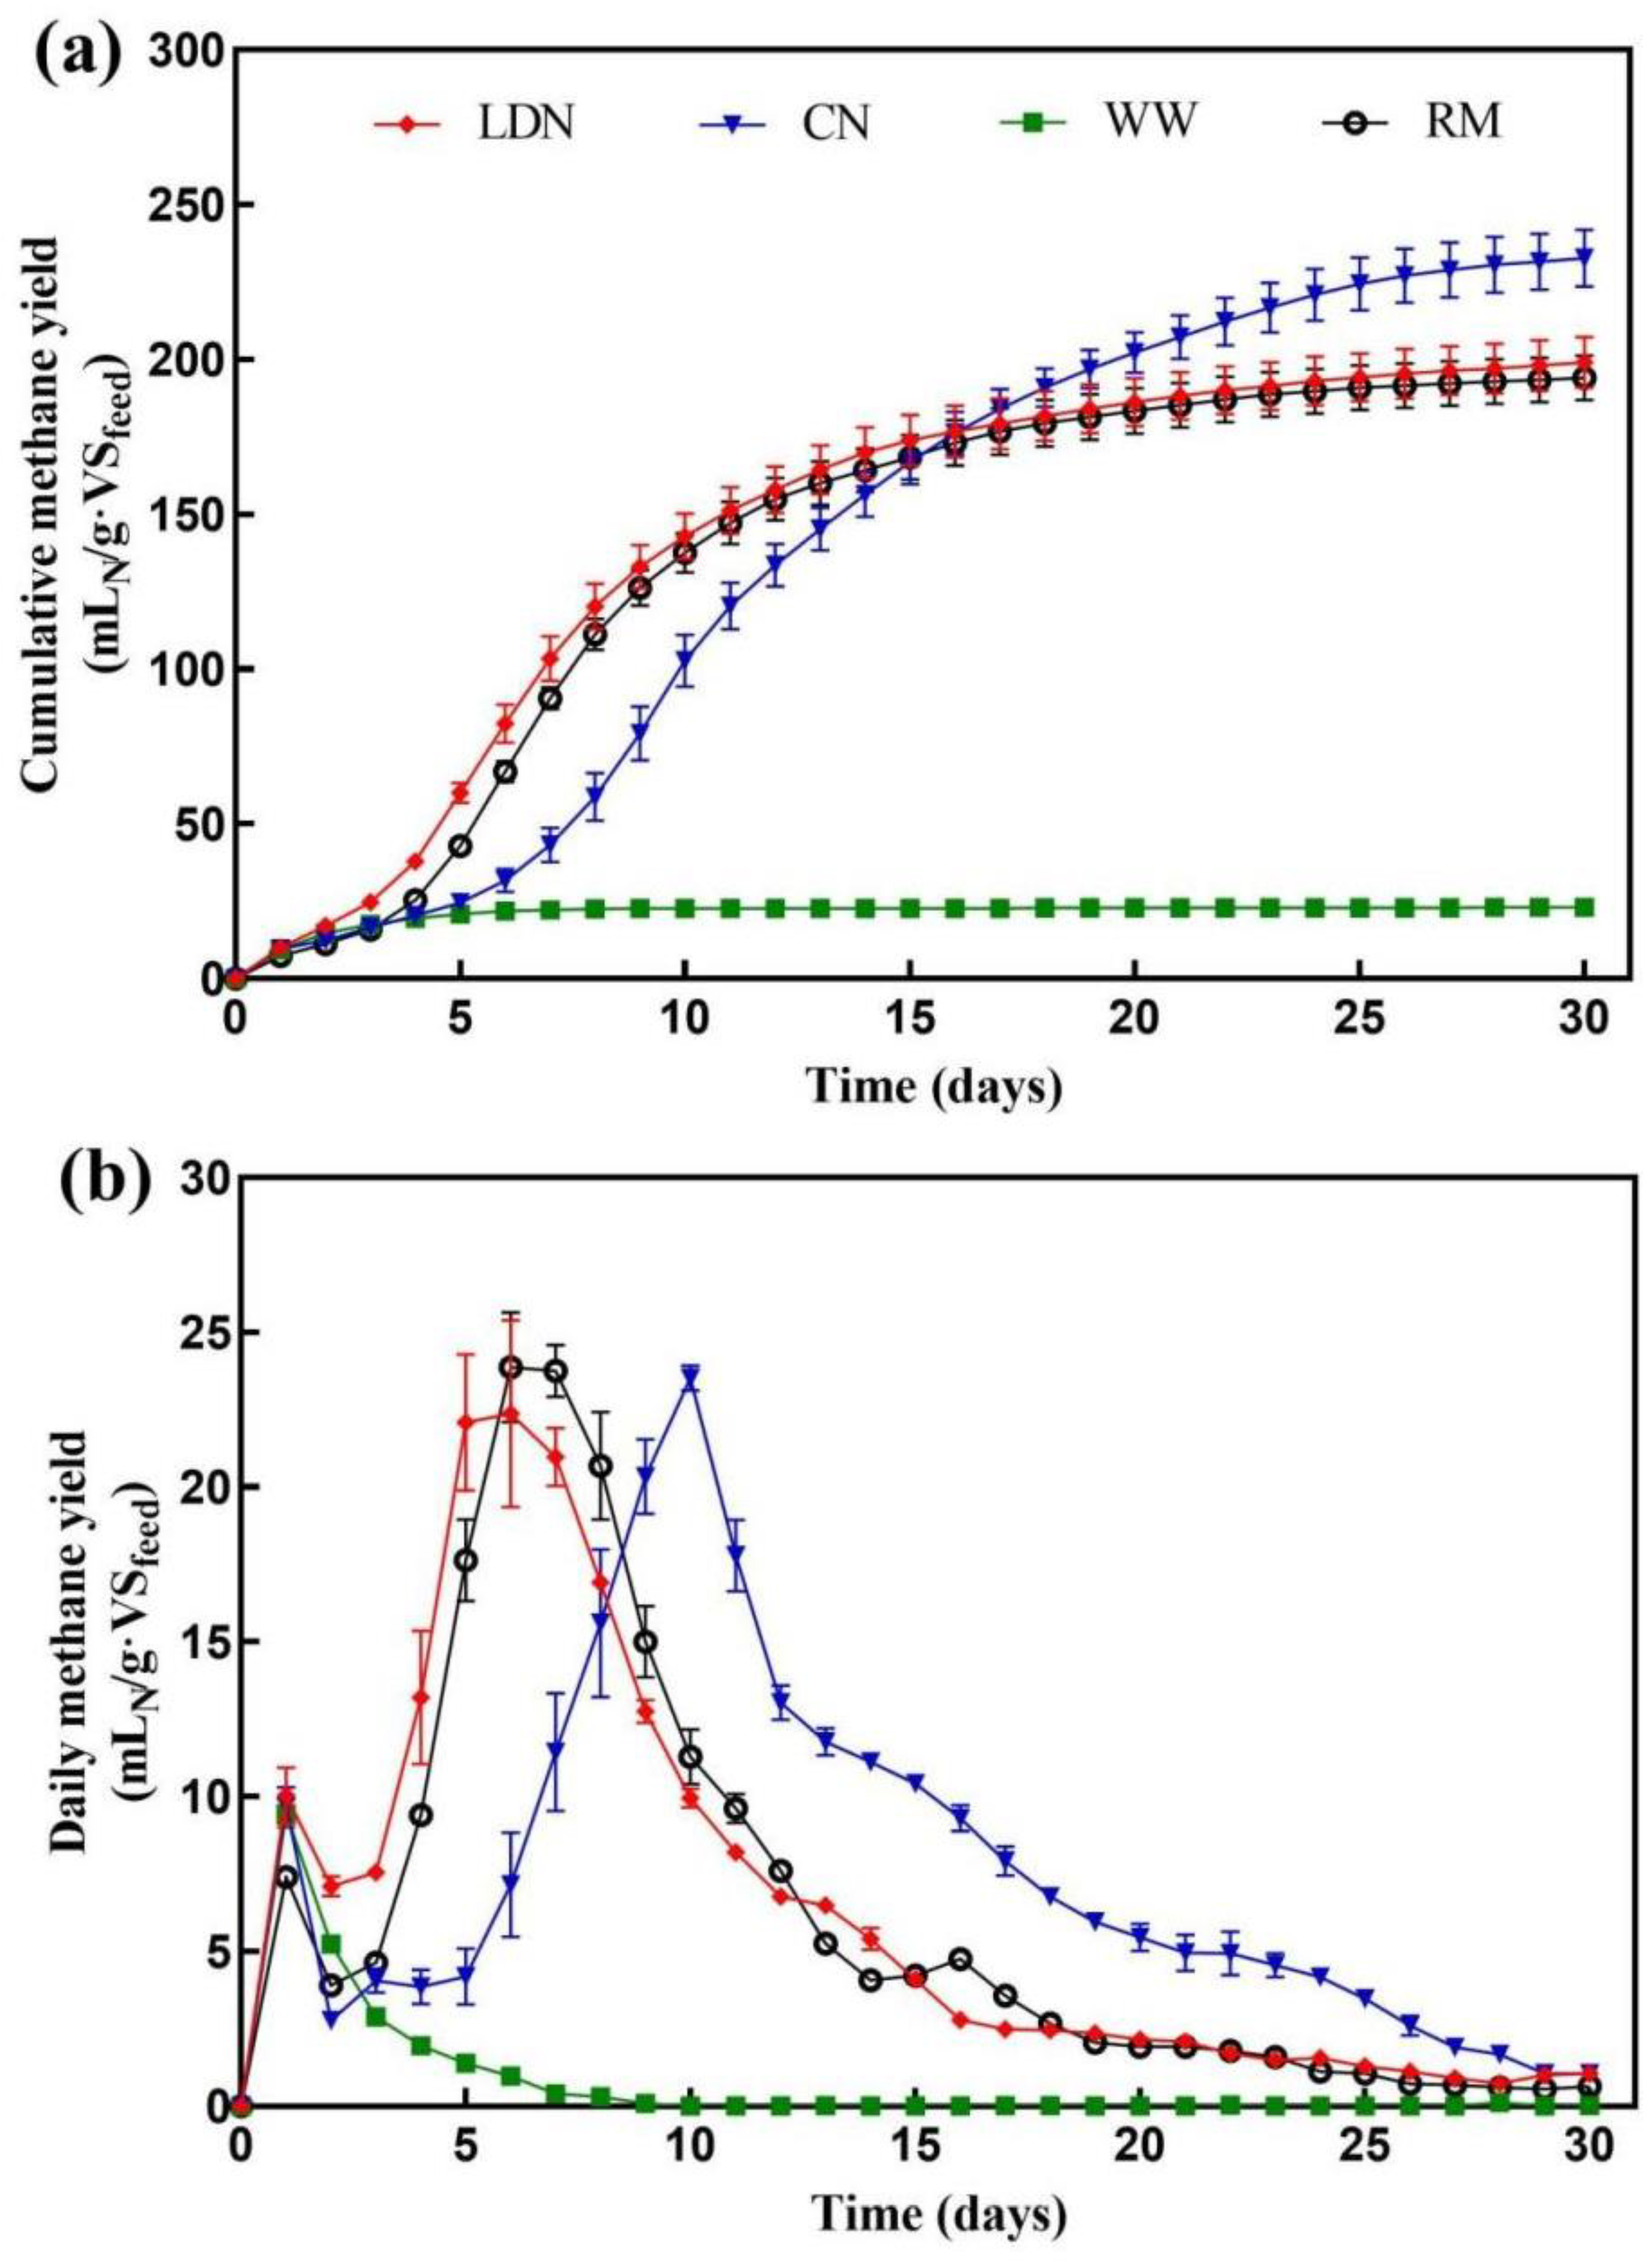
3.5. Effect of Neutralization on Thermophilic Solid-State Anaerobic Digestion

The cumulative methane yields and daily methane yields of the reactors for 30 d for thermophilic SS-AD are shown in Figure 4. The cumulative methane yields of all reactors with different neutralization treatments ranged between 23.1–232.7 mLN·gVSfeed−1. Meanwhile, the reactors treated by WW had much lower cumulative methane yield of 23.1 mLN·gVSfeed−1, which was approximately 88–90% less compared with reactors treated by others and RM (see Figure 4a). In fact, the cumulative methane yield of the WW treatment nearly halted from the 9th day (Figure 4b), thereby exhibiting a typical acidification phenomenon, which was confirmed by the measurement of pH (<5.8) on day 30. In the experiments described herein, a large amount of tap water was consumed to lower the pH of the lime-treated CS to 8.0, which could simultaneously reduce the alkalinity of the substrate. At the same time, our experiments were performed at lower inoculation ratios (S/I = 6, VS basis) compared to those reported for SS-AD at an S/I of 1–4 [38,39], which further increased the risk of over-acidification. Moreover, AD of WW has not failed both in the BMP test and the L-AD, seemingly due to the higher ratio of inoculum, lower TS, and intermittent physical stirring providing many microbes and a more efficient mass transfer environment.
Compared to RM, the cumulative methane yield of CN was significantly (p < 0.05) increased by 19.9%. Li et al. [7] also achieved higher methane yields when using NaOH for pretreatment, which was a larger increase (40.1%) than that in this study because Li et al. used a smaller size of corn stover as a substrate for AD. Moreover, the peak of CN’s daily methane yield was delayed by four days (Figure 4b). In contrast, the peak of daily methane yield of LDN was 1 and 5 days earlier than that of RM and CN, respectively (Figure 4b). This finding can be potentially explained by the fact that the microorganisms in LD facilitate the disruption of the dense structure of CS. At the same time, the inhibition of the AD process driven by the pretreatment by-products disappeared, probably because the extrusion step had removed some of the by-products, thereby resulting in the concentrations of these inhibitors below the threshold of inhibition. However, the extrusion step removed not only the fermentation inhibitors but also the dissolved fermentable fractions, so that the cumulative methane yield was not significantly different from that of RM (Figure 4a).

3.6. Kinetics of the Anaerobic Digestion Process

The modified Gompertz equation was applied to fit the cumulative biomethane production of the BMP test and thermophilic L- and SS-AD, and the simulation results are displayed in Figure 5 as well as in Table 2. The fitting index (R2) values ranged from 0.9632 to 0.9975, indicating that the modified Gompertz equation was applicable not only to the BMP test and thermophilic L-AD but also SS-AD without stirring. The lowest R2 (0.9632) was WW-SS (WW for SS-AD) because it failed to initiate AD due to acidification. Moreover, the different treatments caused variations in Rm, λ, and Pm, which were in accordance with the daily and cumulative methane yields (see Figure 3 and Figure 4 for details).

3.7. Economic Evaluation Analysis

In this study, a simple economic evaluation analysis (Table 3) for the three neutralization methods was performed using the Engineering Economics Analysis method [21]. The price of pretreatment reagents, water, wastewater treatment and methane were achieved according to current market price, the average industrial water price, the average industrial wastewater treatment cost and the average liquefied natural gas (LNG) price in October 2021 in China, respectively (Lime is 944.44 RMB/t, LDN is 0.00 RMB/t, CN is 0.00 RMB/t, industrial water is 4.1 RMB/t, industrial wastewater treatment is 2.00 RMB/t and the methane price is 4.88 RMB/m3). The profit value was calculated based on the RM, so there was no additional calculation of cost consumption which were the same (e.g., labor costs, energy costs, CS costs, depreciation costs of the instruments and equipment, costs of use-and-throw materials). The net profit was defined as the energy revenue from the methane production minus the cost of starting material.
For all neutralization methods, the cost of the lime pretreatment reagent and water in the first step was the same (87.41 RMB/t TS). The total cost of LDN and CN was 0.00 RMB/t TS, which was collected for free. The total cost of WW was 122.00 RMB/t TS, of which 82.00 RMB/t TS was used for neutralization and 40.00 RMB/t TS for wastewater treatment. LDN and CN were more advantageous in terms of cost compared to WW. However, among the three neutralization methods, the net profit of CN was the only positive one with 100.89 and 98.74 RMB/t TS in L-AD and SS-AD, respectively. Therefore, CN was more economically attractive for practical applications.

4. Conclusions

Two novel neutralization methods for lime-treated CS were developed for biomethane production: (1) LD-neutralization and (2) CO2-neutralization. Compared to other processes, they do not require a washing step, and both the LD and CO2 are by-products of AD. This saves the cost of additional chemical agents. They all succeeded in reducing the pH to the fermentable range and CN was quicker. Moreover, LDN facilitated AD performance in terms of gas production rate, particularly in L-AD. However, it had a significant reduction in total biomethane yield compared to CN, resulting in a negative net profit, which has entirely counterbalanced its advantage of the production rate. Furthermore, CN exhibited the highest gas production and net profit not only in L-AD but also in SS-AD, but with the disadvantage of the longest stagnation phase. Overall, this study provided references for adjusting the initial pH of lime-treated CS before AD, and CO2-neutralization is recommended as a more efficient and affordable method.

Supplementary Materials

The following are available online at https://www.mdpi.com/article/10.3390/app112210884/s1, Figure S1: Changes in pH during liquid digestate (LD) neutralization at different ratios (v/w) of LD to lime-treated corn stover (wet mass). Data are shown as mean ± standard deviation (SD), n = 3. Figure S2: Effect of I/S ratio on BMP test of microcrystalline cellulose. Data are shown as mean ± standard deviation (SD), n = 3. Figure S3: Effect of temperature on BMP test of microcrystalline cellulose. Data are shown as mean ± standard deviation (SD), n = 3. Figure S4: Effect of different S/I ratios on L-AD. Data are shown as mean ± standard deviation (SD), n = 3. Figure S5: Effect of different pH endpoints neutralized by LD on the cumulative/daily methane yield during BMP tests of lime-treated corn stover. Data are shown as mean ± SD, n = 3. Table S1: Characteristics of CS after performing different neutralization before AD.

Author Contributions

Conceptualization, L.X. and Y.L.; methodology, L.X. and Y.L.; formal analysis, L.X.; investigation, L.X. and M.Y.; resources, S.Z.; data curation, L.X. and M.Y.; writing-original draft preparation, L.X. and Y.L.; writing-review and editing, L.X. and Y.L.; visualization, L.X. and D.H.; supervision, Y.M.; project administration, Y.L.; funding acquisition, Y.L. and Y.M. All authors have read and agreed to the published version of the manuscript.

Funding

This work was supported by the Key Research and Development Program of Hubei Province, China (Grant No. 2020BAB095) and Fundamental Research Funds for the Central Universities of China (Grant No. 2662021FW006).

Institutional Review Board Statement

Not applicable.

Informed Consent Statement

Not applicable.

Data Availability Statement

Not applicable.

Acknowledgments

We gratefully acknowledge Yaohao Dun and Weiwei Dong for their valuable guidance and support.

Conflicts of Interest

The authors declare no conflict of interest. The funders had no role in the study’s design; in the collection, analyses or interpretation of data; in the writing of the manuscript, or in the decision to publish the results.

Nomenclature

ADanaerobic digestion
CNCO2 neutralization
C/N ratiocarbon/nitrogen ratio
CScorn stover
I/S ratioinoculum/substrate ratio
L-ADliquid anaerobic digestion
LDLiquid digestate
LDNliquid digestate neutralization
S/I ratiosubstrate/inoculum ratio
SS-ADsolid-state anaerobic digestion
TStotal solids
VFAsvolatile fatty acids
VS volatile solids
WW washed with tap water

References

  1. Sun, H.; Cui, X.; Stinner, W.; Shah, G.M.; Cheng, H.; Shan, S.; Guo, J.; Dong, R. Synergetic effect of combined ensiling of freshly harvested and excessively wilted maize stover for efficient biogas production. Bioresour. Technol. 2019, 285, 121338. [Google Scholar] [CrossRef]
  2. Bhatia, P.; Fujiwara, M.; Salangsang, M.; Qian, J.; Liu, X.; Ban, S.; Myojin, M.; Toda, T. Effect of Semi-Continuous Anaerobic Digestion on the Substrate Solubilisation of Lignin-Rich Steam-Exploded Ludwigia grandiflora. Appl. Sci. 2021, 11, 4452. [Google Scholar] [CrossRef]
  3. Momayez, F.; Karimi, K.; Taherzadeh, M.J. Energy recovery from industrial crop wastes by dry anaerobic digestion: A review. Ind. Crops Prod. 2019, 129, 673–687. [Google Scholar] [CrossRef]
  4. Shi, J.; Wang, Z.; Stiverson, J.; Yu, Z.; Li, Y. Reactor performance and microbial community dynamics during solid-state anaerobic digestion of corn stover at mesophilic and thermophilic conditions. Bioresour. Technol. 2013, 136, 574–581. [Google Scholar] [CrossRef]
  5. Kasinski, S. Mesophilic and Thermophilic Anaerobic Digestion of Organic Fraction Separated during Mechanical Heat Treatment of Municipal Waste. Appl. Sci. 2020, 10, 2412. [Google Scholar] [CrossRef] [Green Version]
  6. Yang, L.; Xu, F.; Ge, X.; Li, Y. Challenges and strategies for solid-state anaerobic digestion of lignocellulosic biomass. Renew. Sustain. Energy Rev. 2015, 44, 824–834. [Google Scholar] [CrossRef]
  7. Li, Y.; Zhang, R.; He, Y.; Liu, X.; Chen, C.; Liu, G. Thermophilic Solid-State Anaerobic Digestion of Alkaline-Pretreated Corn Stover. Energy Fuels 2014, 28, 3759–3765. [Google Scholar] [CrossRef]
  8. Rusin, J.; Chamradova, K.; Grycova, B. The influence of biomass agitation on biogas and methane production using the high-solids thermophilic anaerobic digestion. Green Process. Synth. 2017, 6, 273–279. [Google Scholar] [CrossRef]
  9. Meng, L.; Xie, L.; Riya, S.; Terada, A.; Hosomi, M. Impact of turning waste on performance and energy balance in thermophilic solid-state anaerobic digestion of agricultural waste. Waste Manag. 2019, 87, 183–191. [Google Scholar] [CrossRef]
  10. Soltanian, S.; Aghbashlo, M.; Almasi, F.; Hosseinzadeh-Bandbafha, H.; Nizami, A.-S.; Ok, Y.S.; Lam, S.S.; Tabatabaei, M. A critical review of the effects of pretreatment methods on the exergetic aspects of lignocellulosic biofuels. Energy Convers. Manag. 2020, 212, 112792. [Google Scholar] [CrossRef]
  11. Xu, H.; Li, B.; Mu, X. Review of Alkali-Based Pretreatment to Enhance Enzymatic Saccharification for Lignocellulosic Biomass Conversion. Ind. Eng. Chem. Res. 2016, 55, 8691–8705. [Google Scholar] [CrossRef]
  12. You, Z.; Zhang, S.; Kim, H.; Chiang, P.-C.; Sun, Y.; Guo, Z.; Xu, H. Effects of Corn Stover Pretreated with NaOH and CaO on Anaerobic Co-Digestion of Swine Manure and Corn Stover. Appl. Sci. 2018, 9, 123. [Google Scholar] [CrossRef] [Green Version]
  13. Du, J.; Qian, Y.; Xi, Y.; Lü, X. Hydrothermal and alkaline thermal pretreatment at mild temperature in solid state for physicochemical properties and biogas production from anaerobic digestion of rice straw. Renew. Energy 2019, 139, 261–267. [Google Scholar] [CrossRef]
  14. Shen, J.; Zheng, Q.; Zhang, R.; Chen, C.; Liu, G. Co-pretreatment of wheat straw by potassium hydroxide and calcium hydroxide: Methane production, economics, and energy potential analysis. J. Environ. Manag. 2019, 236, 720–726. [Google Scholar] [CrossRef]
  15. Jiang, D.; Ge, X.; Zhang, Q.; Zhou, X.; Chen, Z.; Keener, H.; Li, Y. Comparison of sodium hydroxide and calcium hydroxide pretreatments of giant reed for enhanced enzymatic digestibility and methane production. Bioresour. Technol. 2017, 244, 1150–1157. [Google Scholar] [CrossRef] [PubMed]
  16. Sympson, W.; Nokes, S.; Hickman, A. Recirculating calcium hydroxide solution: A practical choice for on-farm high solids lignocellulose pretreatment. Ind. Crops Prod. 2017, 97, 492–497. [Google Scholar] [CrossRef] [Green Version]
  17. Falls, M.; Holtzapple, M.T. Oxidative Lime Pretreatment of Alamo Switchgrass. Appl. Biochem. Biotechnol. 2011, 165, 506–522. [Google Scholar] [CrossRef] [PubMed]
  18. Park, J.-Y.; Shiroma, R.; Al-Haq, M.I.; Zhang, Y.; Ike, M.; Arai-Sanoh, Y.; Ida, A.; Kondo, M.; Tokuyasu, K. A novel lime pretreatment for subsequent bioethanol production from rice straw—Calcium capturing by carbonation (CaCCO) process. Bioresour. Technol. 2010, 101, 6805–6811. [Google Scholar] [CrossRef]
  19. Sun, C.; Xie, Y.; Hou, F.; Yu, Q.; Wang, Y.; Wang, X.; Miao, C.; Ma, J.; Ge, W.; Zhang, T.; et al. Enhancement on methane production and anaerobic digestion stability via co-digestion of microwave-Ca(OH)2 pretreated sugarcane rind slurry and kitchen waste. J. Clean. Prod. 2020, 264, 121731. [Google Scholar] [CrossRef]
  20. Hu, Y.; Pang, Y.; Yuan, H.; Zou, D.; Liu, Y.; Zhu, B.; Chufo, W.A.; Jaffar, M.; Li, X. Promoting anaerobic biogasification of corn stover through biological pretreatment by liquid fraction of digestate (LFD). Bioresour. Technol. 2015, 175, 167–173. [Google Scholar] [CrossRef]
  21. Guan, R.; Li, X.; Wachemo, A.C.; Yuan, H.; Liu, Y.; Zou, D.; Zuo, X.; Gu, J. Enhancing anaerobic digestion performance and degradation of lignocellulosic components of rice straw by combined biological and chemical pretreatment. Sci. Total Environ. 2018, 637–638, 9–17. [Google Scholar] [CrossRef]
  22. Liu, T.; Zhou, X.; Li, Z.; Wang, X.; Sun, J. Effects of liquid digestate pretreatment on biogas production for anaerobic digestion of wheat straw. Bioresour. Technol. 2019, 280, 345–351. [Google Scholar] [CrossRef] [PubMed]
  23. Sun, J.; Li, Z.; Zhou, X.; Wang, X.; Liu, T.; Cheng, S. Investigation on methane yield of wheat husk anaerobic digestion andits enhancement effect by liquid digestate pretreatment. Anaerobe 2019, 59, 92–99. [Google Scholar] [CrossRef]
  24. Pang, Y.Z.; Liu, Y.P.; Li, X.J.; Wang, K.S.; Yuan, H.R. Improving Biodegradability and Biogas Production of Corn Stover through Sodium Hydroxide Solid State Pretreatment. Energy Fuels 2008, 22, 2761–2766. [Google Scholar] [CrossRef]
  25. Holliger, C.; Alves, M.; Andrade, D.; Angelidaki, I.; Astals, S.; Baier, U.; Bougrier, C.; Buffière, P.; Carballa, M.; De Wilde, V.; et al. Towards a standardization of biomethane potential tests. Water Sci. Technol. 2016, 74, 2515–2522. [Google Scholar] [CrossRef]
  26. Zhu, J.; Yang, L.; Li, Y. Comparison of premixing methods for solid-state anaerobic digestion of corn stover. Bioresour. Technol. 2015, 175, 430–435. [Google Scholar] [CrossRef] [PubMed]
  27. Federation, W.E.; APH Association. Standard Methods for the Examination of Water and Wastewater; AWWA/WEF/APHA: Washington, DC, USA, 2005. [Google Scholar]
  28. Sluiter, A.; Hames, B.; Ruiz, R.; Scarlata, C.; Sluiter, J.; Templeton, D.; Crocker, D. Determination of Structural Carbohydrates and Lignin in Biomass. Laboratory Analytical Procedure; National Renewable Energy Laboratory: Golden, CO, USA, 2010; TP–510–42618.
  29. Lay, J.; Li, Y.; Noike, T.; Endo, J.; Ishimoto, S. Analysis of environmental factors affecting methane production from high solids organic waste. Water Sci. Technol. 1997, 36, 493–500. [Google Scholar] [CrossRef]
  30. Li, Y.; Yang, G.; Li, L.; Sun, Y. Bioaugmentation for overloaded anaerobic digestion recovery with acid-tolerant methanogenic enrichment. Waste Manag. 2018, 79, 744–751. [Google Scholar] [CrossRef]
  31. Alavi-Borazjani, S.A.; Capela, I.; Tarelho, L.A. Over-acidification control strategies for enhanced biogas production from anaerobic digestion: A review. Biomass-Bioenergy 2020, 143, 105833. [Google Scholar] [CrossRef]
  32. Jönsson, L.J.; Martín, C. Pretreatment of lignocellulose: Formation of inhibitory by-products and strategies for minimizing their effects. Bioresour. Technol. 2016, 199, 103–112. [Google Scholar] [CrossRef] [Green Version]
  33. Braz, G.H.R.; Fernandez-Gonzalez, N.; Lema, J.; Carballa, M. The time response of anaerobic digestion microbiome during an organic loading rate shock. Appl. Microbiol. Biotechnol. 2018, 102, 10285–10297. [Google Scholar] [CrossRef]
  34. Reilly, M.; Dinsdale, R.; Guwy, A. Mesophilic biohydrogen production from calcium hydroxide treated wheat straw. Int. J. Hydrogen Energy 2014, 39, 16891–16901. [Google Scholar] [CrossRef]
  35. Ajayi-Banji, A.A.; Rahman, S.; Cihacek, L.; Nahar, N. Comparison of the Reactor Performance of Alkaline-Pretreated Corn Stover Co-digested with Dairy Manure under Solid-State. Waste Biomass-Valorization 2020, 11, 5211–5222. [Google Scholar] [CrossRef]
  36. Halil, Ş. Enhancement in methane yield from anaerobic co-digestion of walnut shells and cattle manure. Environ. Prog. Sustain. 2020, 39, e13524. [Google Scholar]
  37. Mirmohamadsadeghi, S.; Karimi, K.; Azarbaijani, R.; Yeganeh, L.P.; Angelidaki, I.; Nizami, A.-S.; Bhat, R.; Dashora, K.; Vijay, V.K.; Aghbashlo, M.; et al. Pretreatment of lignocelluloses for enhanced biogas production: A review on influencing mechanisms and the importance of microbial diversity. Renew. Sustain. Energy Rev. 2021, 135, 110173. [Google Scholar] [CrossRef]
  38. Meng, L.; Xie, L.; Kinh, C.T.; Suenaga, T.; Hori, T.; Riya, S.; Terada, A.; Hosomi, M. Influence of feedstock-to-inoculum ratio on performance and microbial community succession during solid-state thermophilic anaerobic co-digestion of pig urine and rice straw. Bioresour. Technol. 2018, 252, 127–133. [Google Scholar] [CrossRef]
  39. Ma, X.; Jiang, T.; Chang, J.; Tang, Q.; Luo, T.; Cui, Z. Effect of Substrate to Inoculum Ratio on Biogas Production and Microbial Community during Hemi-Solid-State Batch Anaerobic Co-digestion of Rape Straw and Dairy Manure. Appl. Biochem. Biotechnol. 2019, 189, 884–902. [Google Scholar] [CrossRef] [PubMed]
Figure 1. Changes in (a) pH and VFAs during LD-neutralization; and (b) pH during CO2-neutralization. LS- and SS-denote liquid state and solid state, respectively. Data are shown as mean ± standard deviation (SD), n = 3.
Applsci 11 10884 g001
Figure 2. Effect of different neutralization treatments on BMP tests of lime-treated corn stover: (a) cuvers and (b) total yields. Data are shown as mean ± SD, n = 3. Significant differences are indicated by different letters (p < 0.05).
Applsci 11 10884 g002
Figure 3. Effect of different neutralization treatments on the (a) cumulative methane yield; and (b) daily methane yield during 30 days thermophilic L-AD of lime-treated corn stover. Data are shown as mean ± SD, n = 3.
Applsci 11 10884 g003
Figure 4. Effect of different neutralization treatments on the (a) cumulative methane yield; and (b) daily methane yield during 30 days thermophilic SS-AD of lime-treated corn stover. Data are shown as mean ± SD, n = 3.
Applsci 11 10884 g004
Figure 5. Curve fitting of the Gompertz equation to methane production data for (a) BMP, (b) L-AD and (c) SS-AD tests. Dots denote the means of data and lines denote the Gompertz curves.
Applsci 11 10884 g005
Table 1. Characteristics of materials.
ParametersCorn StoverInoculumLiquid Digestate
Total solids (%)91.48 ± 0.1013.54 ± 0.05N/D
Volatile solids (%)84.55 ± 0.196.51 ± 0.04N/D
Total organic carbon (%)43.11 ± 0.7725.77 ± 0.36N/D
Total nitrogen (%)1.02 ± 0.032.61 ± 0.070.15 ± 0.00
C/N ratio42.28 ± 0.749.89 ± 0.29N/D
Alkalinity (g CaCO3/kg)8.54 ± 0.0210.23 ± 0.351.87 ± 0.11
Cellulose (%) a33.83 ± 0.36N/DN/D
Hemicellulose (%) a26.10 ± 0.33N/DN/D
Lignin (%) a19.10 ± 0.89N/DN/D
MLSS (g/L)N/DN/D3.72 ± 0.13
MLVSS (g/L)N/DN/D2.64 ± 0.14
pHN/D7.87 ± 0.087.53 ± 0.09
a Based on VS while the rest are based on total weight; N/D, not determined.
Table 2. Kinetic parameters of biomethane production with the modified Gompertz model.
MethodRm (mLN·d−1)λ (d)Pm (mLN)R2
LDN-B a364.80.11065.60.9897
CN-B a385.00.01210.70.9827
WW-B a445.10.11283.20.9870
RM-B a286.20.01045.80.9842
LDN-L b721.01.13108.20.9942
CN-L b453.21.84398.60.9946
WW-L b431.80.64010.20.9955
RM-L b432.30.83513.90.9832
LDN-SS c163.91.61744.20.9962
CN-SS c143.93.92128.10.9975
WW-SS c58.9−0.2205.10.9632
RM-SS c172.82.51708.50.9962
a BMP test with 5 g of substrate (VS basis). b Liquid anaerobic digestion with 9 g of substrate (VS basis). c Solid-state anaerobic digestion with 20 g of substrate (VS basis).
Table 3. Economic evaluation of different neutralization methods for lime-pretreated corn stover.
ItermsLime Pretreatment Reagent and Water Cost (RMB/t TS a)Neutralization Cost
(RMB/t TS a)
Wastewater Treatment Cost
(RMB/t TS a)
Methane Profits (RMB/t TS a)Net Profits (RMB/t TS a)
LDN-L b87.410.000.00−9.33−96.74
CN-L b87.410.000.00188.30100.89
WW-L b87.4182.0040.0094.37−126.89
RM-L b-----
LDN-SS c87.410.000.0024.72−62.69
CN-SS c87.410.000.00186.1598.74
WW-SS c87.4182.0040.00−835.10−1056.36
RM-SS c-----
a Based on initial TS of corn stover biomass. b Liquid anaerobic digestion. c Solid-state anaerobic digestion.
Publisher’s Note: MDPI stays neutral with regard to jurisdictional claims in published maps and institutional affiliations.

