Article

Metal Titanate (ATiO3, A: Ni, Co, Mg, Zn) Nanorods for Toluene Photooxidation under LED Illumination

by
Anna P. Souri
1,2,
Natalia Andrigiannaki
2,3,4,
Marilena Moschogiannaki
1,2,
Vasiliki Faka
1,2,
George Kiriakidis
2,
Anna Malankowska
4,
Adriana Zaleska-Medynska
4 and
Vassilios Binas
2,3,*
1
Department of Materials Science and Technology, University of Crete, 71110 Herakleion, Greece
2
Institute of Electronic Structure and Laser, Foundation for Research and Technology-Hellas, 71110 Heraklion, Greece
3
Department of Physics, University of Crete, 71110 Herakleion, Greece
4
Department of Environmental Technology, Faculty of Chemistry, University of Gdansk, 80-308 Gdansk, Poland
*
Author to whom correspondence should be addressed.
Appl. Sci. 2021, 11(22), 10850; https://doi.org/10.3390/app112210850
Submission received: 13 October 2021 / Revised: 9 November 2021 / Accepted: 12 November 2021 / Published: 17 November 2021
(This article belongs to the Special Issue Emerging Technologies for Air Quality Improvement)

Abstract

:
The increasing air pollution taking place in virtue of human activity has a novel impact in our health. Heterogeneous photocatalysis is a promising way of degrading volatile organic compounds (VOCs) that makes the quest of new and improved photocatalysts of great importance. Herein, perovskite-related materials ATiO3 with A = Mg, Ni, Co, Zn were synthesized through an ethylene glycol-mediated root, with ethylene glycol being used as a solvent and ligand. Characterization techniques such as X-ray diffraction (XRD), scanning electron microscopy, and energy dispersive X-ray spectroscopy (SEM/EDX), transmission electron microscopy (TEM), UV-vis spectroscopy, Raman spectroscopy, Fourier transform infrared (FT-IR), and photoluminescence spectroscopy (PL) were used in order to confirm the structure, the nanorod morphology, their absorption in UV-vis, and the separation efficiency of photogenerated charge carriers. The highest photoactivity was observed for ZnTiO3 in which 62% of toluene was decomposed after 60 min under LED illumination (54 mW/cm2).

1. Introduction

Air pollution is one of the most serious problems in the world. World Health Organization (WHO, 2018) underlined that, “almost 9 out of 10 people breathe air that contains pollutants (such as NOx, VOCs and bioaerosols) at concentrations well over the recommended levels”. Volatile organic compounds (VOCs) are emitted gasses whose concentration up to a certain point is associated with health problems. Toluene belongs in the organic pollutants category, it is used as a model air contaminant, and can be released in air, water, or soil at places that it is produced or used. If the concentration of toluene exceeds the recommended levels (20 ppm), it can affect our nervous system like headaches, dizziness or unconsciousness, cognitive impairment, and vision and hearing loss [1].
Heterogeneous photocatalysis is a promising technology for the degradation of environmental pollutants [2,3]. Perovskite materials (ABX3) are promising candidate as efficient photocatalysts and exhibit high stability. Cations in A and B site are 12-coordinated and 6-coordinated accordingly [4] with RA > RB. In addition, X is an anion, usually O, which connects to both cations. The diversity connected to the perovskite structure as far as the properties of the materials are concerned is justified if we consider that almost all the elements of the periodic table can occupy A or B site. When B site is occupied by Ti— the compounds are called metal titanates (ATiO3). Tolerance factor is an indication of the structure’s formation and stability and is expressed through Goldschmid’s formula t = ((rA + rO))/√(2(rB + rO)) [5,6], with t taking values from 0.71 to 1. The ideal perovskite structure is the cubic lattice (0.9 < t < 1). Mixed oxides with t lower than 0.8 crystallize in ilmenite structure [7,8], a distortion from perovskite structure where A and Ti cations occupy octahedron sites. Ilmenite structure [9] has ordered corundum structure where each octahedron AO6 is sandwiched by two TiO6 layers [10,11].
Metal titanates (ATiO3, where A: Ni, Co, Zn, Mn, Mg, Fe, Ca, Ba, Sr) have been extensively studied for photooxidation applications, due to their unique physical and chemical properties. According to the literature, ATiO3 has been prepared by various methods such as sonochemical method [12,13,14,15], precipitation method [16], sol-gel method [17,18,19], wet chemical method [20], auto-ignited combustion method [21], through conventional solid-state reaction route [22], and through hydrothermal method [23,24]. However, polyol process [25,26]—that is followed in our work—offers a low-cost and simple way of fabricating metal titanates. A key parameter of the process is the polyol used which acts both as a solvent and as a ligand thus making the redox reactions a significant part [27]. Ethylene glycol is proven to be an effective ligand with metal ions, and it favors its 1 D structure to the polymerization of the chain structure.
Up to this moment, ATiO3 compounds have been employed for photocatalytic hydrogen production [28,29,30], degradation of toxic aqueous pollutants [30,31,32,33,34,35,36,37], gas sensing [38,39], microwave applications [40], water purification [41], and photovoltaic applications [42,43,44]. In TiO2 and TiO2-related materials the photocatalytic degradation of gaseous pollutants like toluene [45,46,47], nitric oxides NOx [48,49,50], and 2-propanol [51] has been studied. Chen et al., synthesized Bi-BiPO4 nanocomposites through in situ solvothermal reduction for NO removal [52]. Rao et al., constructed Pb/PbO/β-Bi2O3 microspheres for bisphenol A degradation and NO removal [53] and Wang et al., obtained three types of supported Cobalt catalysts (CoOx/SiO2, CoOx/Al2O3, CoOx/TiO2) for CO oxidation [54]. There are limited reports for metal titanates in degrading gaseous pollutants. More specifically SrTiO3 is the main perovskite material associated with degradation of VOCs like isopropyl alcohol (IPA) [55], 2-propanol [56,57], and toluene [58,59]. Suarez et al., [60] synthesized SrTiO3 perovskites doped by two transition metals (Cu and Mn) in B-site by one pot hydrothermal method with the Mn-doped catalyst exhibiting the highest catalytic activity as toluene is completely converted to CO2 at temperatures below 350 °C.
In the present study metal titanate nanorods ATiO3, A = Mg, Ni, Co, Zn were successfully synthesized in order to be used as photocatalysts for toluene photooxidation (in the gas phase), activated by light emitting diodes (LEDs), a low powered and cost irradiation source. Hence, the impact of perovskite type materials on photocatalysis expands in gaseous pollutants and the effect of A-site metal on optical and structural properties are examined. To the best of our knowledge, this is the first study on the photocatalytic activity of metal titanate nanorods, in gas phase treatment.

2. Materials and Methods

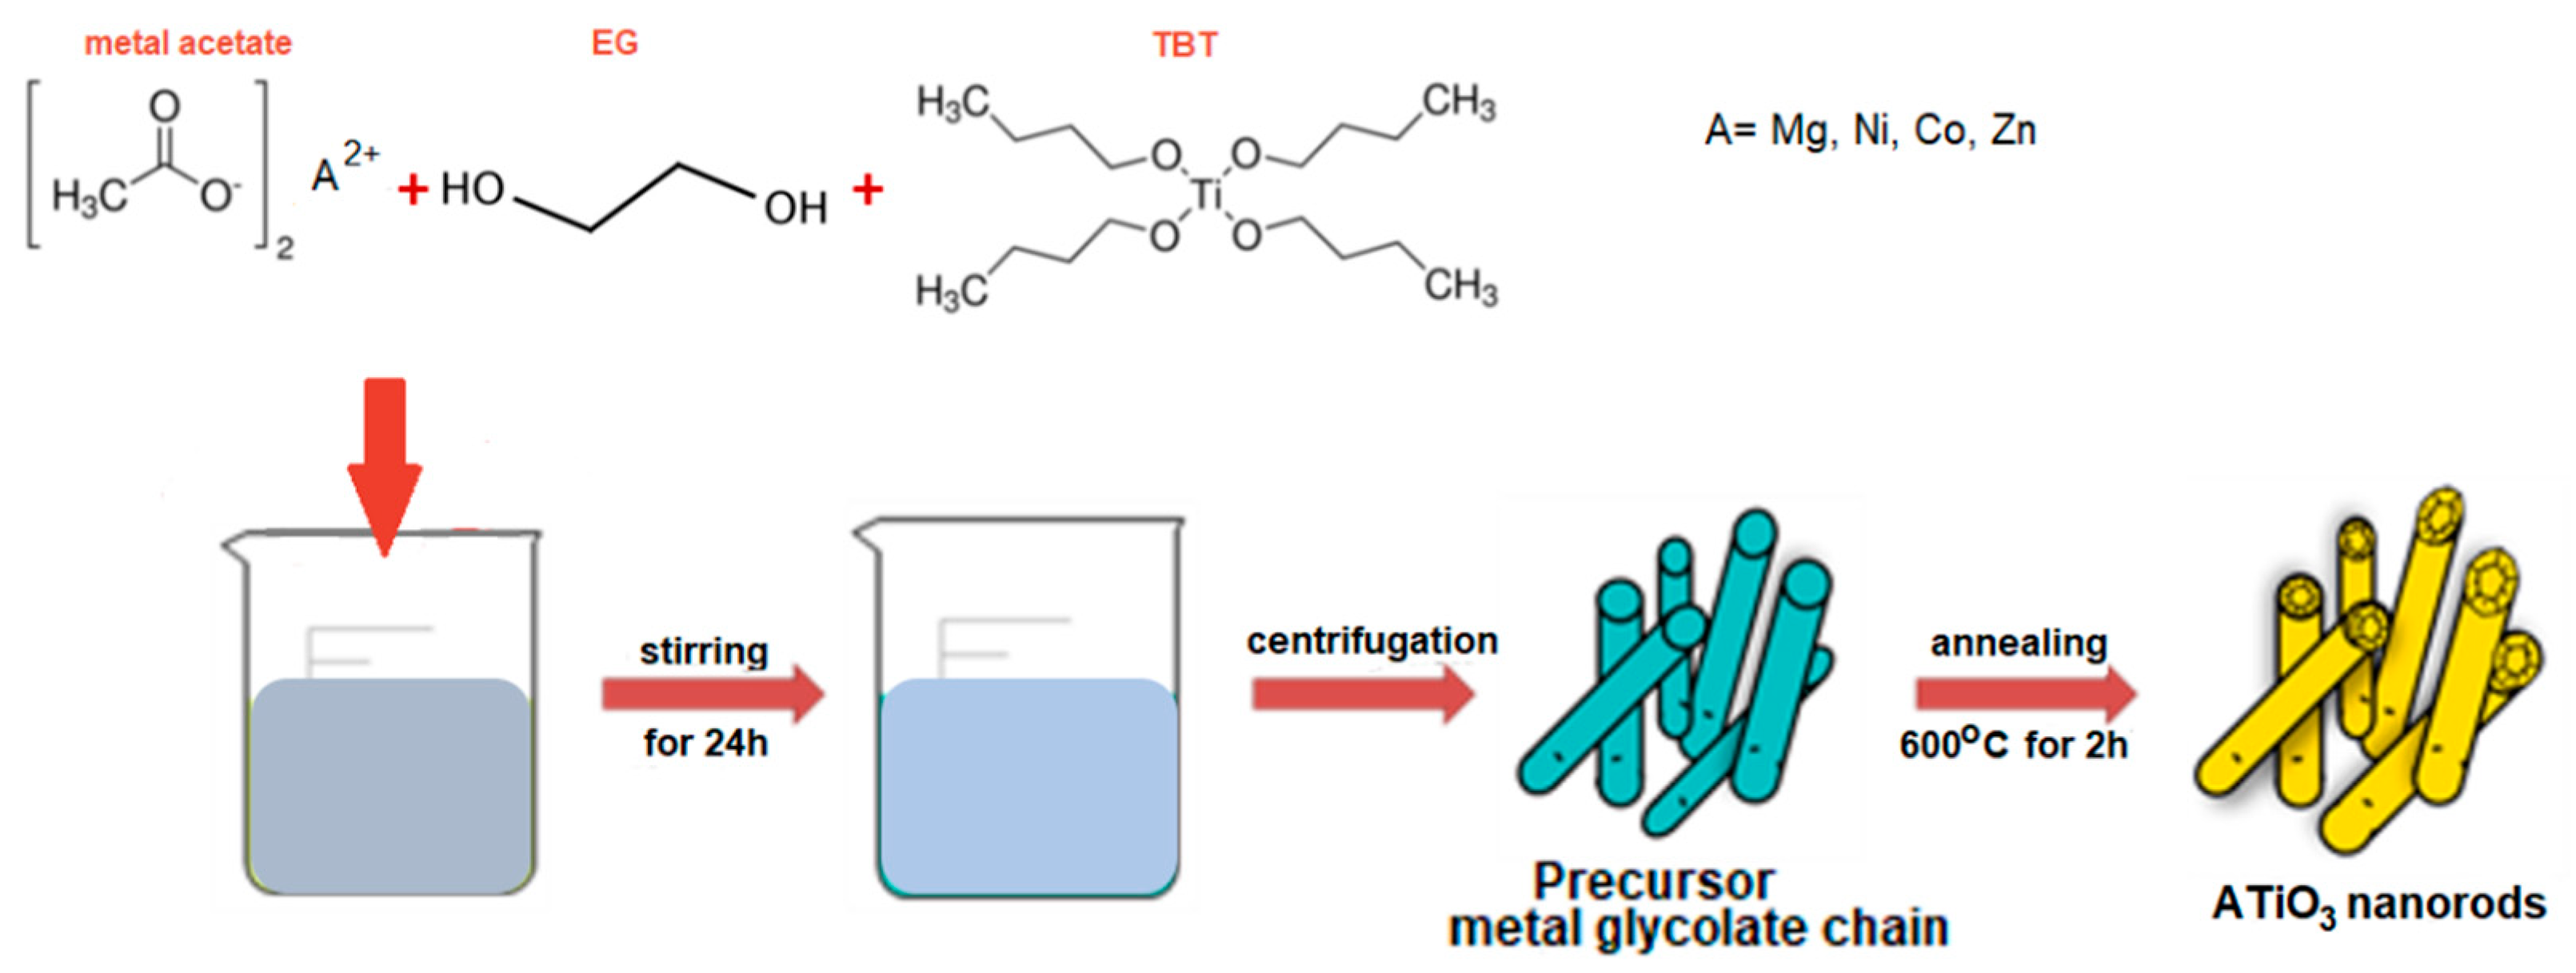
2.1. Synthesis of Metal Titanate Nanorods

All photocatalysts were synthesized via an ethylene glycol-mediated route at room temperature using metal acetates, magnesium (II) acetate tetrahydrate (Sigma-Aldrich > = 99%), nickel (II) acetate tetrahydrate (Sigma-Aldrich 98%, Darmstadt, Germany), zinc (II) acetate tetrahydrate (Sigma-Aldrich ≥99%); cobalt (II) acetate tetrahydrate (Alfa Aesar, 98%, Karlsruhe, Gerrmany), titanium butoxide (TBT, Sigma-Aldrich ≥97.0%) as metal sources; ethylene glycol (EG, Honeywell ≥ 99.5%, Offenbach, Germany,) as a solvent and reducing agent; and sodium hydroxide (Sigma-Aldrich ≥98%) to control pH. All chemicals were used as received without further purification.
In a typical polyol process, the steps followed include the dissolution of the metal salt in a polyol either at room temperature or at a heating step, the possible formation of an intermediate phase, the nucleation step, and finally the growth step that leads to the formation of the metal nanoparticles. Herein, 0.005 mol of the metal acetate was dissolved in 30 mL EG, 1.7 mL TBT was added, and finally 0.22 g sodium hydroxide was added (Figure 1). The solution was stirred for 24 h, then it was centrifuged in order to separate the solid and liquid phase and washed with ethanol two times. Following the centrifugations, the samples were aged for 24 h and finally were annealed at 600 °C for 2 h in air (heating rate 5 °C/min) in order to obtain metal titanate nanorods with ilmenite and cubic structure. It has to be mentioned that some of the prepared solutions had different colors in the beginning and the termination of the stirring process, for instance MgTiO3 and ZnTiO3 were white during the whole process while NiTiO3 and CoTiO3 turned from green and purple to light blue and light pink, respectively. In addition, MgTiO3 and ZnTiO3 were white before and after annealing while NiTiO3 turned from light blue to yellow, CoTiO3 turned from light pink to dark green.

2.2. Characterization

X-ray powder diffraction patterns were obtained by a Rigaku D/MAX-2000 H rotating anode diffractometer (CuKα radiation) equipped with the secondary pyrolytic graphite monochromator operated at 40 kV and 80 mA over the 2θ collection range of 10–80°. The scan rate was 0.05° s−1. The average crystallite size (D in nm) of nanorods was calculated from the line broadening of the X-ray diffraction peak according to the following Scherrer formula:
D = kλ/βcosθ
where k is the Scherrer constant (~0.9), λ is the wavelength of the X-ray radiation (1.54 Ǻ for CuKα), β is the full width at half maximum (FWHM) of the diffraction peak measured at 2θ, and θ is the Bragg angle. The morphology and microstructure analyses were performed using scanning electron microscopy (SEM) and energy dispersive X-ray spectroscopy (EDX) on a JSM-6390 LV microscope. A conventional and transmission electron microscopy (HR-TEM) were used, using a LaB6 JEOL 2100 electron microscope, operating at an accelerating voltage of 200 kV. All the images were captured by the Gatan ORIUS™ SC 1000 CCD camera. For the purposes of the TEM analysis, a drop of a diluted samples with ethanol solution was deposited onto a carbon-coated copper TEM grid and the ethanol was allowed to evaporate. The UV-Vis spectra were measured by a Perkin-Elmer Lambda 950 UV-VIS-NIR Spectrometer. The photoluminescence (PL) emission spectra were recorded using a Perkin-Elmer Luminescence Spectrometer LS 50 B. The samples were excited with 330 nm wavelength light at room temperature and the emission was scanned between 300 and 800 nm. FT-IR spectra were recorded on a Thermo-Electron Nicolet 6700 FTIR optical spectrometer with a DTGS KBr detector at a resolution of 2 cm−1. Raman measurements were performed at room temperature using a Nicolet Almega XR Raman spectrometer with a 473 nm blue laser as an excitation source. The laser power was 15 mW and the beam was focused on the sample through a confocal microscope equipped with a 50× objective.

2.3. Measurement of Photocatalytic Activity

The photocatalytic activity of the metal titanate nanorods was determined in the process of toluene degradation in the gas phase. Toluene, an important volatile organic compound (VOC), was used as a model air contaminant. The photocatalysts’ activity tests were carried out in the flat stainless steel reactor (V = 30 cm3) equipped with a quartz window, two valves, and a septa. As irradiation sources there were used two arrays of 25 LEDs (λmax = 375 nm, light intensity 54 mW/cm2, emission spectrum in the range 326–404 nm Figure S1) and λmax= 400 nm (light intensity 11 mW/cm2, emission spectrum in the range 376–428 nm Figure S2). In a typical measurement calculated mass of semiconductor powder was suspended in a small amount of water and loaded as a thick film on a glass plate (3 cm × 3 cm) using the painting technique. The obtained semiconductor’s coated support was dried and then placed at the bottom side of the photoreactor followed by closing the reactor with a quartz window. The gaseous mixture from a cylinder was passed through the reactor space for 1 min. The concentration of toluene in a gas mixture was about 200 ppm. After closing the valves, the reactor was kept in the dark for 30 min to reach adsorption equilibrium. A reference sample was taken just before starting irradiation. To estimate toluene concentration, the samples were taken every 20 min during 60 min of irradiation. The analysis of toluene concentration in the gas phase was carried out using a Perkin Elmer Clarus 500 GC (Perkin Elmer, Waltham, MA, USA) equipped with a 30 m × 0.25 mm Elite-5 MS capillary column (0.25 m film thickness) and a flame ionization detector (FID). The samples (200 μL) were injected by using a gas-tight syringe. Helium was used as a carrier gas at a flow rate of 1 mL/min.

3. Results

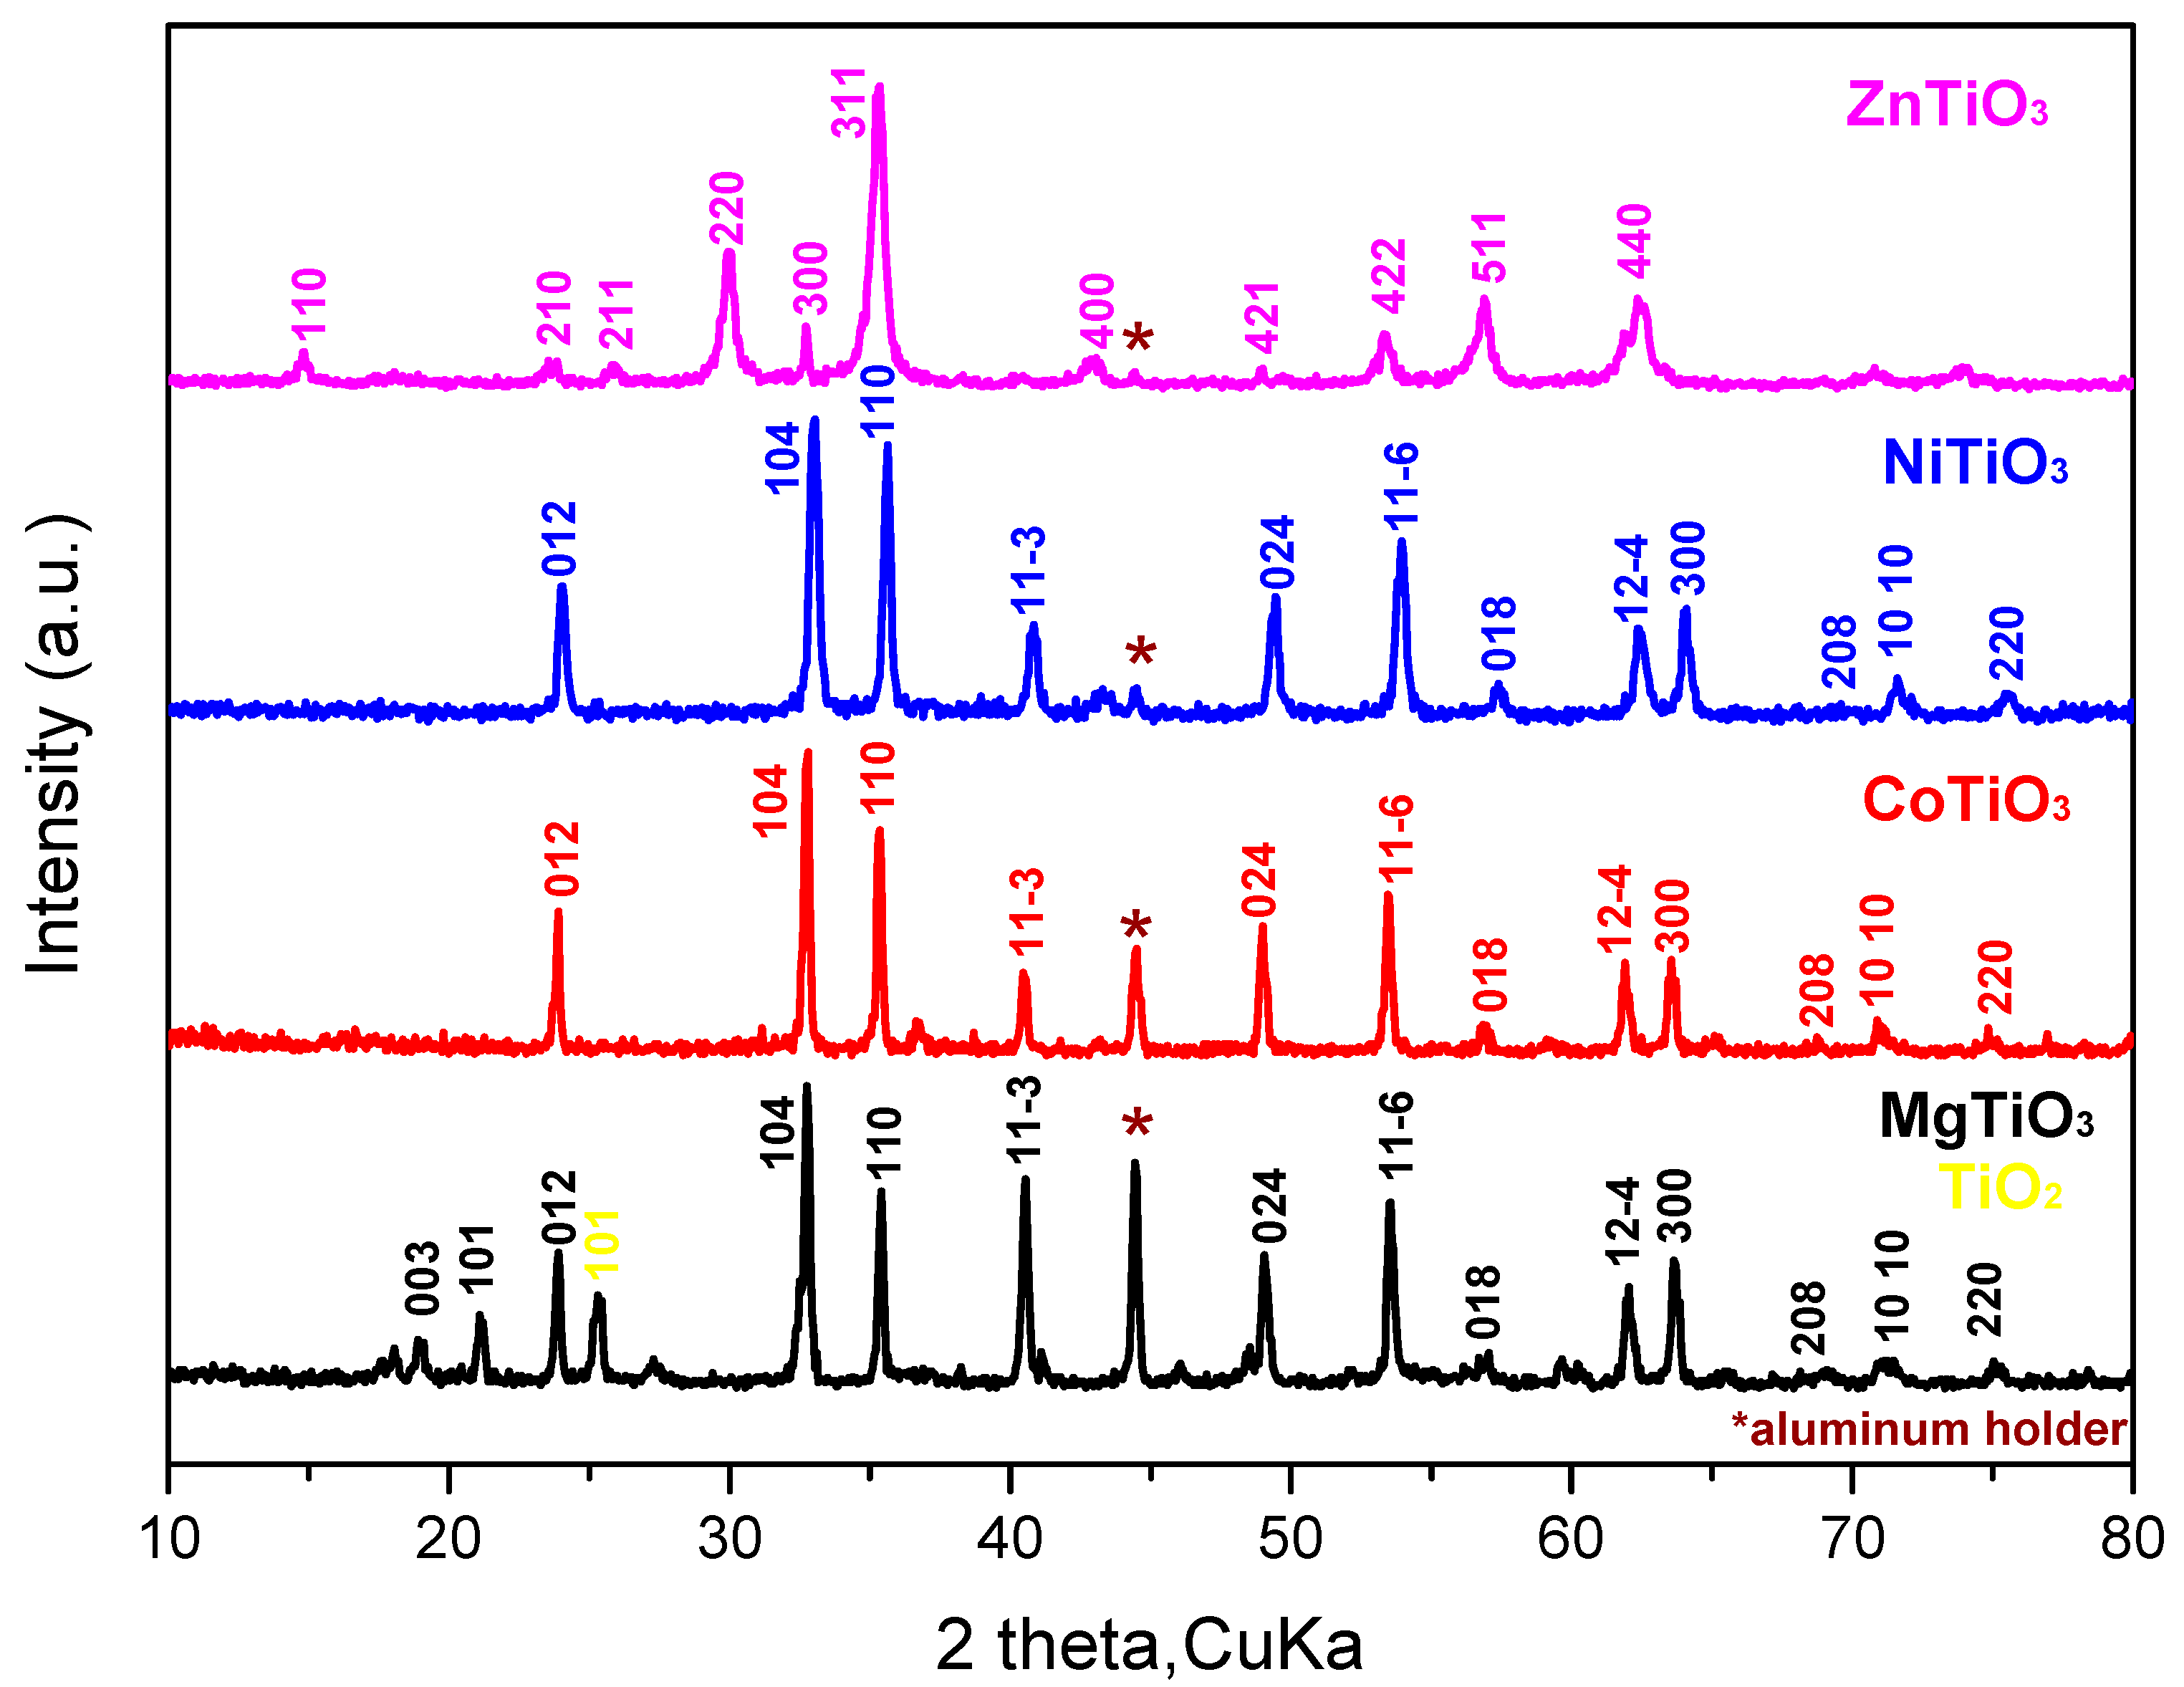
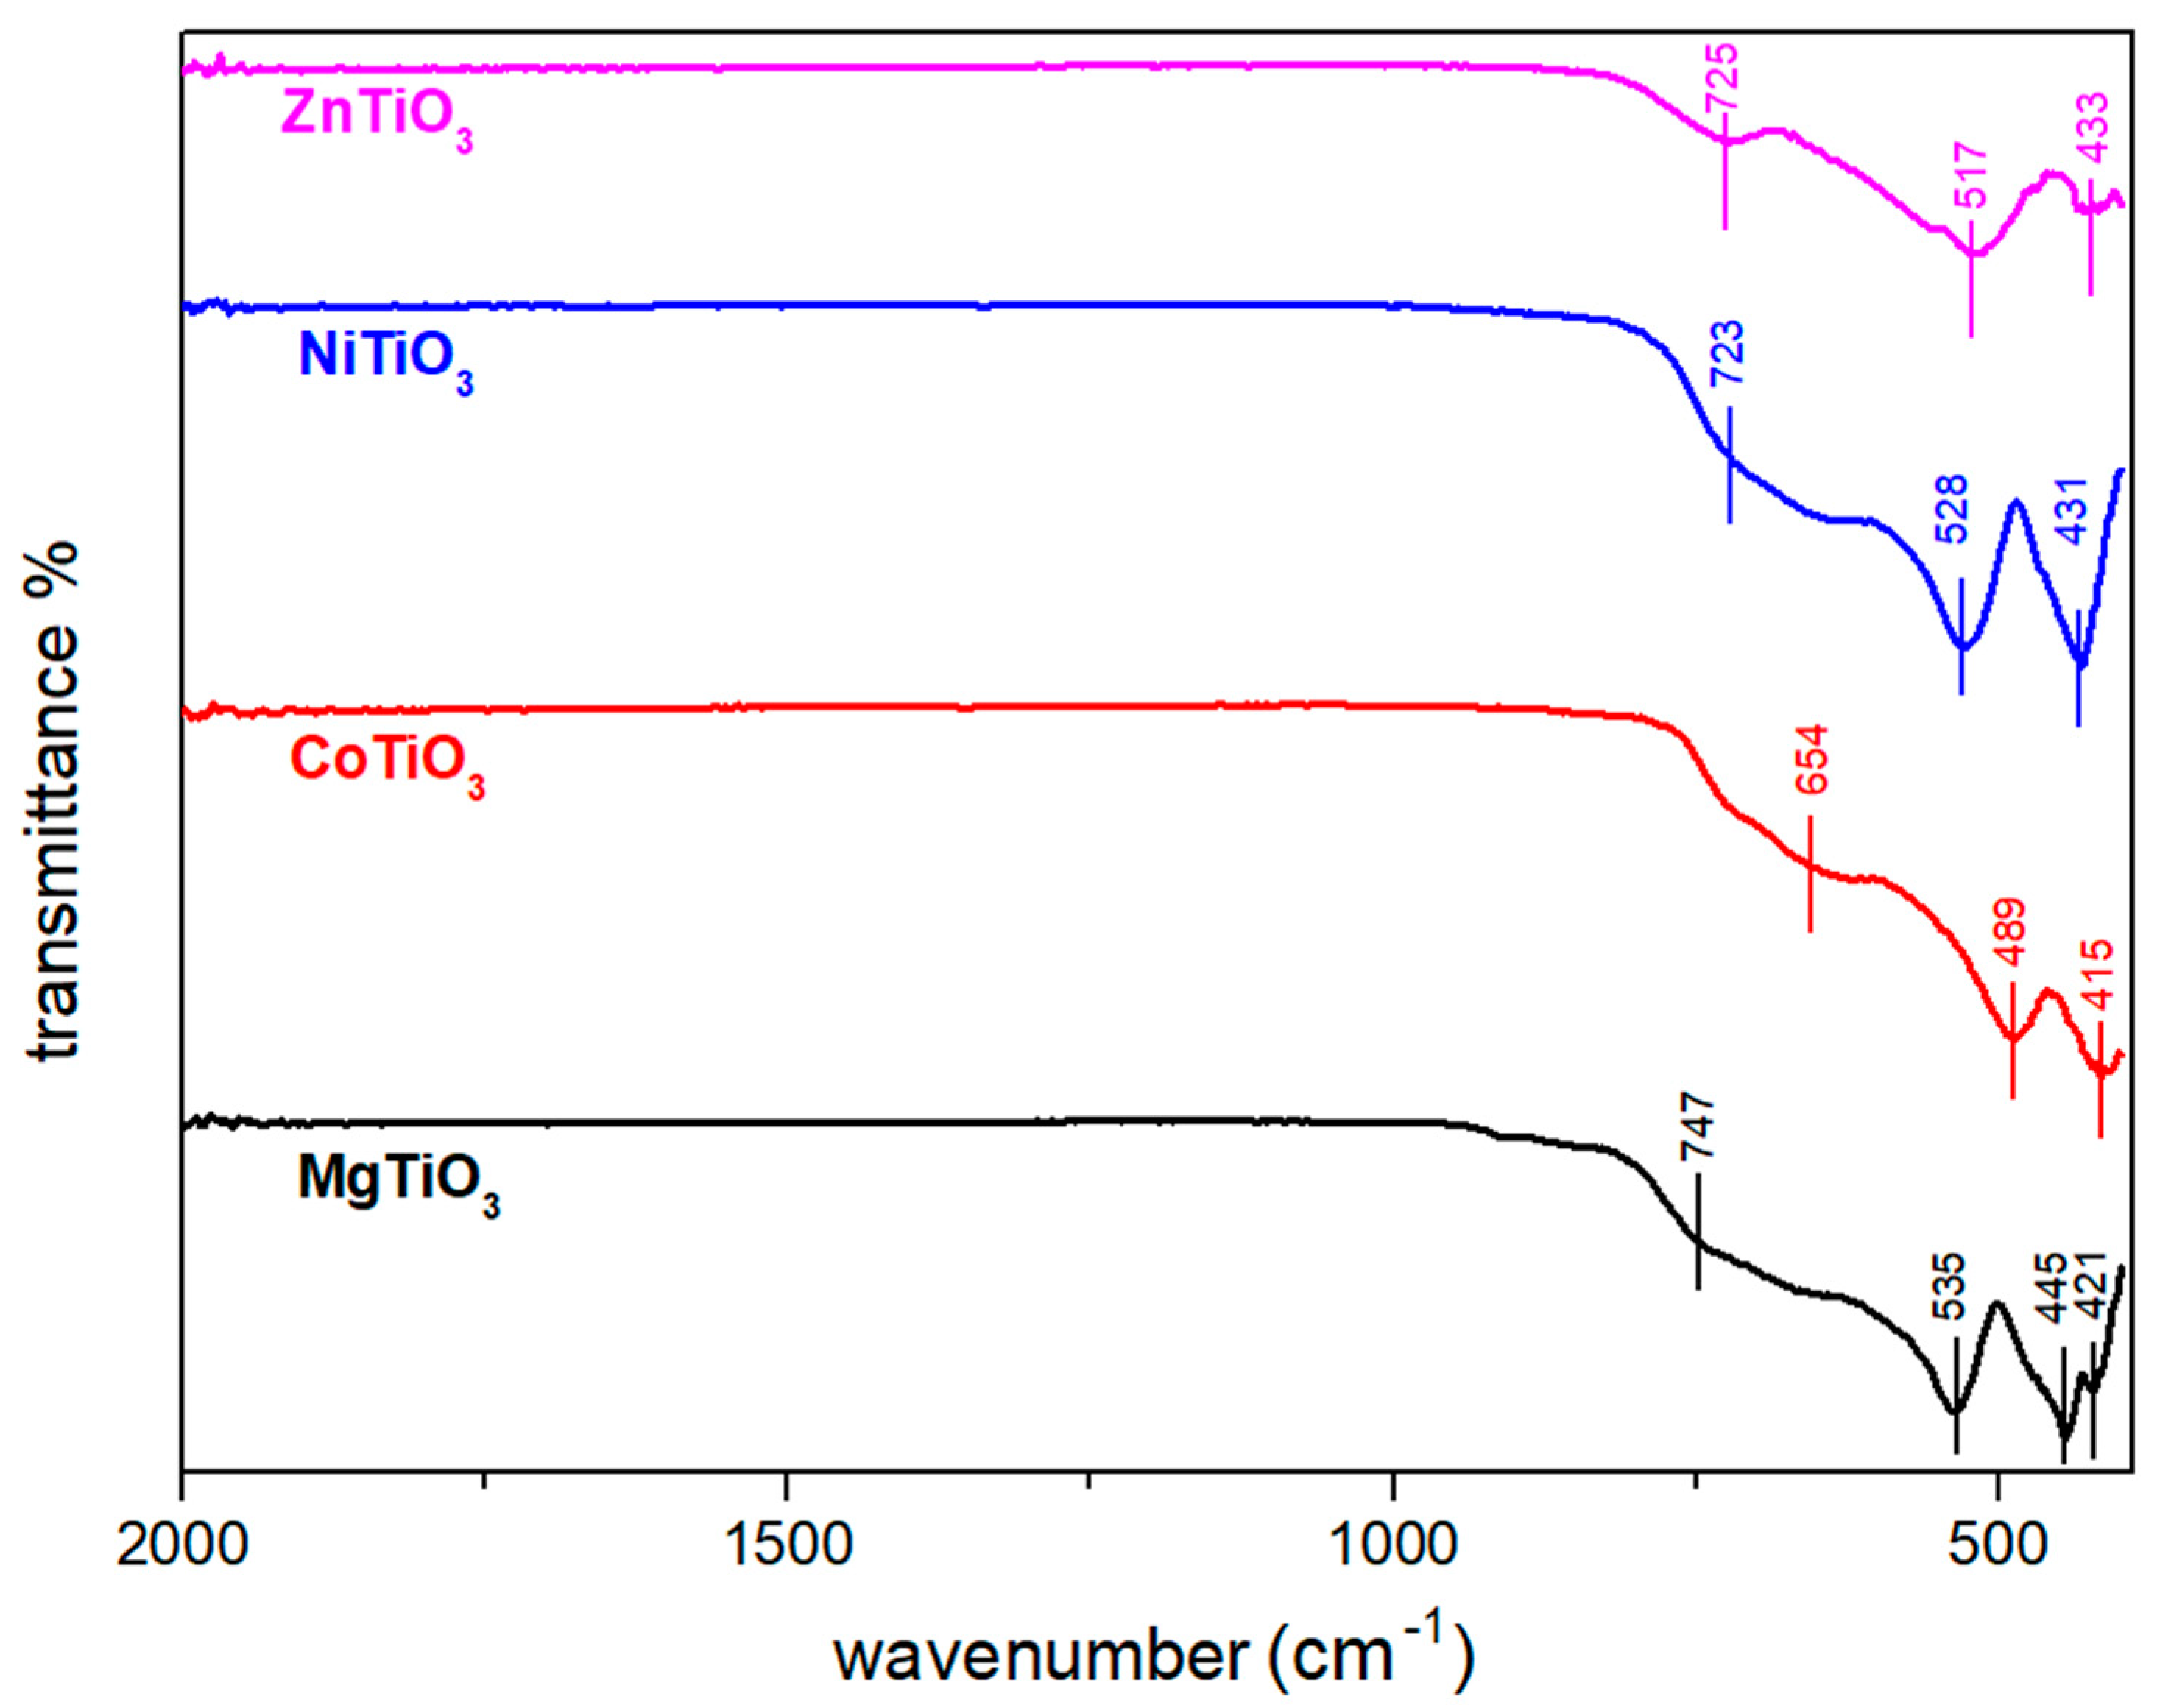
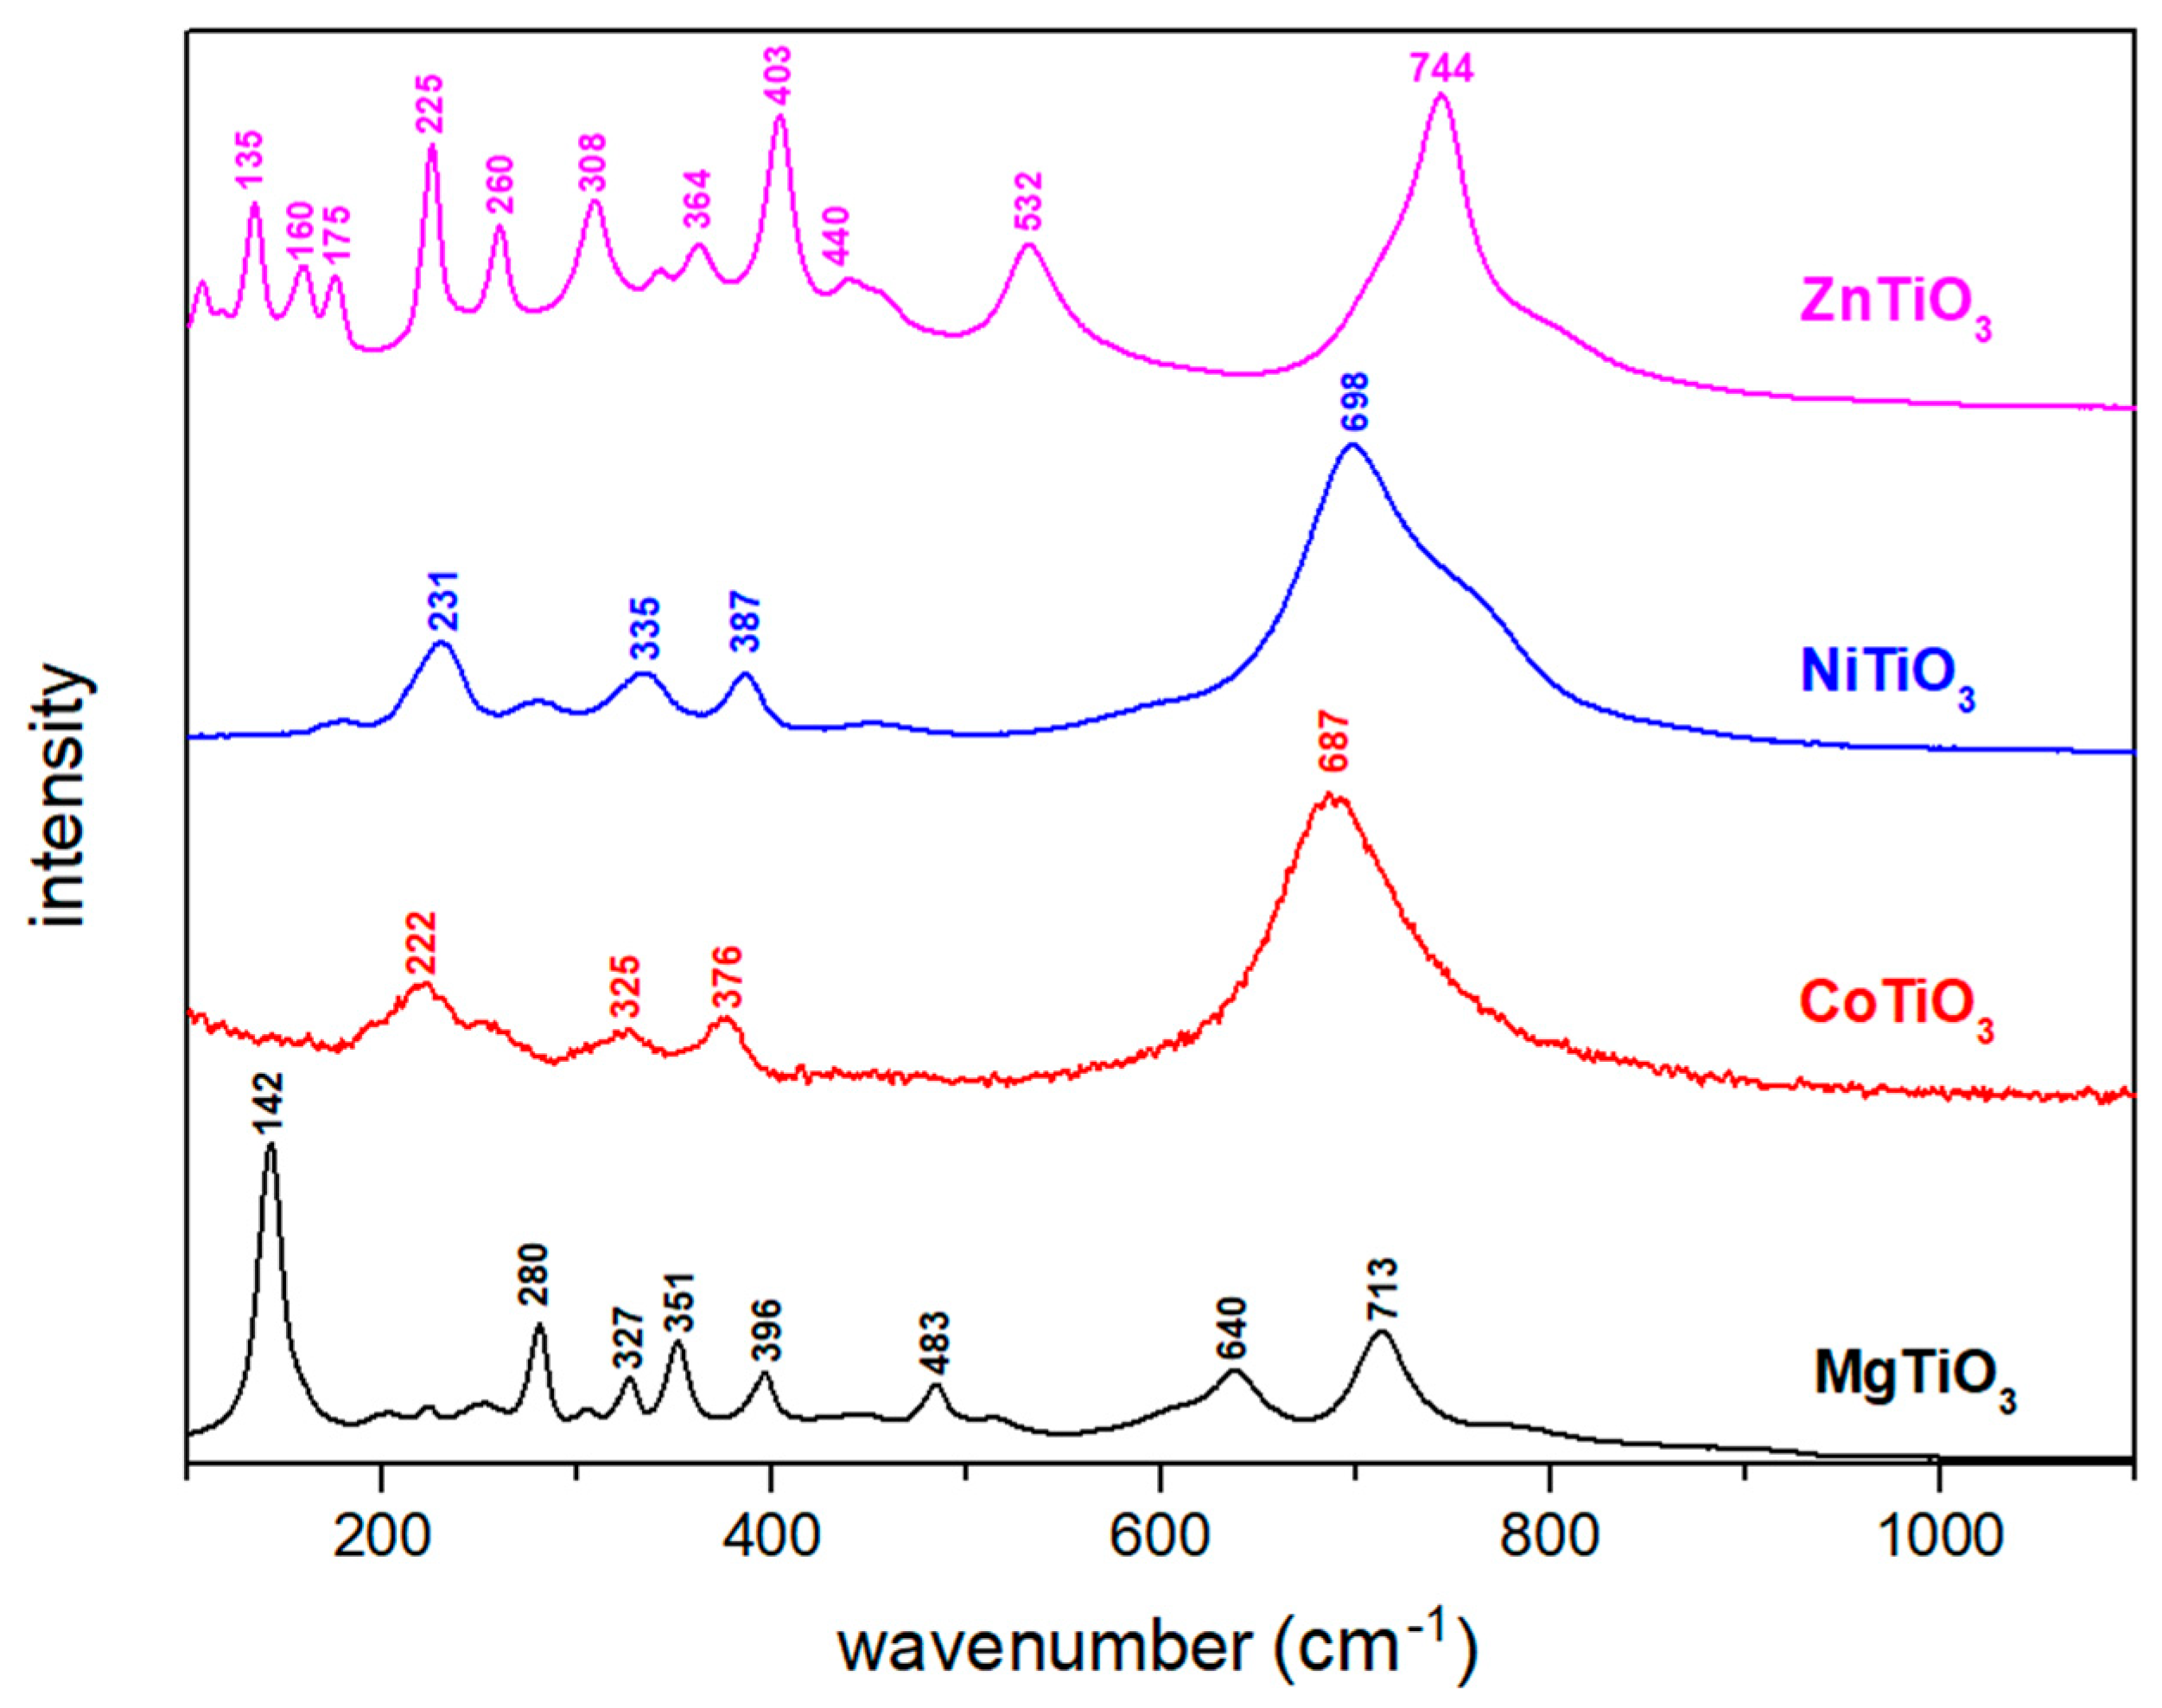
3.1. Structural Characterization of Metal Titanate Nanorods

Figure 2 presents the powder X-ray diffraction patterns for metal titanate nanorods annealed at 600 °C. The structure of MgTiO3 nanorods was indexed according to the standard card (JCPDS card number: 79-0831), with the diffraction lines to be at 2θ = 23.90°, 32.75°, 35.40°, 40.55°, 49.05°, 53.55°, 62.05°, 63.65°, corresponding to (012), (104), (110), (11–3), (024), (11–6), (12–4), and (300) planes, respectively. In addition, the phase of CoTiO3 nanorods was also identified (JCPDS card number: 77-1373) with the diffraction lines at 2θ= 23.90°, 32.85°, 35.35°, 40.45°, 49.00°, 53.50°, 61.90°, 63.55°, corresponding to (012), (104), (110), (11–3), (024), (11–6), (12–4), and (300) planes. The NiTiO3 nanorods were indexed by JCPDS card number: 89-3743 with the diffraction lines at 2θ = 24.05°, 33.05°, 35.65°, 40.85°, 49.45°, 53.95°, 62.40°, 64.10° corresponding to (012), (104), (110), (11–3), (024), (11–6), (12–4), and (300) planes, indicative of ilmenite structure. All the above-mentioned, metal titanates are crystallized in the ilmenite structure, which is a typical example of Rhombohedral lattice system, (which belongs to the hexagonal crystal family, with space group R-3) corresponding to (012), (104), (110), (11–3), (024), (11–6), (12–4), and (300) planes. The peak at 44.50° for all samples is attributed to the aluminum holder. Moreover, MgTiO3 nanorods has an additional peak at 25.30° that is attributed to secondary TiO2 phase (JCPDS card No. 65-5714), a peak that could be characterized as a very small impurity as its intensity is low. The sharpness and the intensity of the diffraction peaks indicate high crystallinity. In the case of Zn- titanate nanorods (ZnTiO3) diffraction peaks at 23.55°, 30.00°, 31.95°, 33.65°, 42.90°, 49.70°, 53.30°, 62.35° correspond to (210), (220), (300), (311), (400), (421), (422), and (440) planes and are assigned to cubic crystal system (JCPDS card No. 39-0190).
The lattice parameters of all the samples were in good agreement with the theoretical ones (Table 1). However, a deviation is observed because each sample’s metal in A-site has different ionic radii. Lattice parameters and volume cell of NiTiO3 are smaller than MgTiO3 which is smaller than CoTiO3. Moreover, Mg2+ has a radius of 0.72 Å [61,62] and Ni2+ 0.69 Å [63] thus the lattice parameters in NiTiO3 are smaller than those of MgTiO3. With the same notion, Co2+ radius is 0.74 Å [64] (larger than the radius of Mg2+) so the lattice parameters of CoTiO3 are larger than those of MgTiO3. Following the same trend as the lattice parameters the volume of NiTiO3 cell is the smallest, the volume of CoTiO3 cell is the highest, and the volume cell of MgTiO3 is in-between. The volume cell of ZnTiO3 is the smallest of all the four samples because it crystallizes in cubic system. The crystalline size too, follows the same trend as cell volume and lattice parameters. More specifically, NiTiO3 crystalline size is the smallest, MgTiO3 has slightly bigger crystalline size, and CoTiO3 has the highest. The ideal perovskite structure is in cubic lattice (0.9 < t < 1). Mixed oxides with t lower than 0.8 crystallize in ilmenite structure, a distortion from perovskite structure where A and Ti cations occupy octahedron sites. The tolerance factor for NiTiO3, MgTiO3, and CoTiO3 is found to be 0.73, 0.75, and 0.76, accordingly. So, because the values below the ilmenite barrier, the samples correspond to ilmenite structure. The tolerance factor for ZnTiO3 is found to be 0.99 and corresponds to cubic structure. All values are in good agreement with the structural analysis and the theoretical ones.
FT-IR spectra of metal titanates are shown in Figure 3.
It can be seen that no impurity peaks corresponding to the organic impurities were observed. It is known from the literature that vibrations with wavenumbers in the region 830–500 cm−1 correspond to the formation of metal titanates [61,62]. More specifically, the peaks at 747 and 535 cm−1 in MgTiO3 the peak at 654 cm−1 for CoTiO3, the peaks at 723 and 528 cm−1 for NiTiO3, and the peaks at 725 and 517 cm−1 for ZnTiO3 are attributed to the formation of metal titanates. Furthermore, peaks located below 500 cm−1 can be assigned to stretching vibrations of M–O bonds where metal denotes the A-site metal in each case or Ti from octahedral TiO6 groups [63,64,65]. These peaks for MgTiO3 are at 445 and 421 cm−1, for CoTiO3 at 489 and 415 cm−1, for NiTiO3 at 415 cm−1, and for ZnTiO3 at 433 cm−1.
Based on the literature data it is reported that the Raman spectrum of metal titanates has a strong peak at 700 cm−1 which corresponds to symmetric stretching vibration of MO6 octahedra, (with M: Mg, Ni, Co, Zn) [39,66,67,68]. All the other signals in MgTiO3, NiTiO3, CoTiO3 can be related to ilmenite Ag, Eg vibrational modes [67]. In ZnTiO3 all the peaks except the one at 744 cm−1 are associated with Ag and Eg modes, with the ones at 260 and 440 cm−1 being associated to octahedral TiO6 group [39]. Raman spectrum of metal titanates are shown in Figure 4.

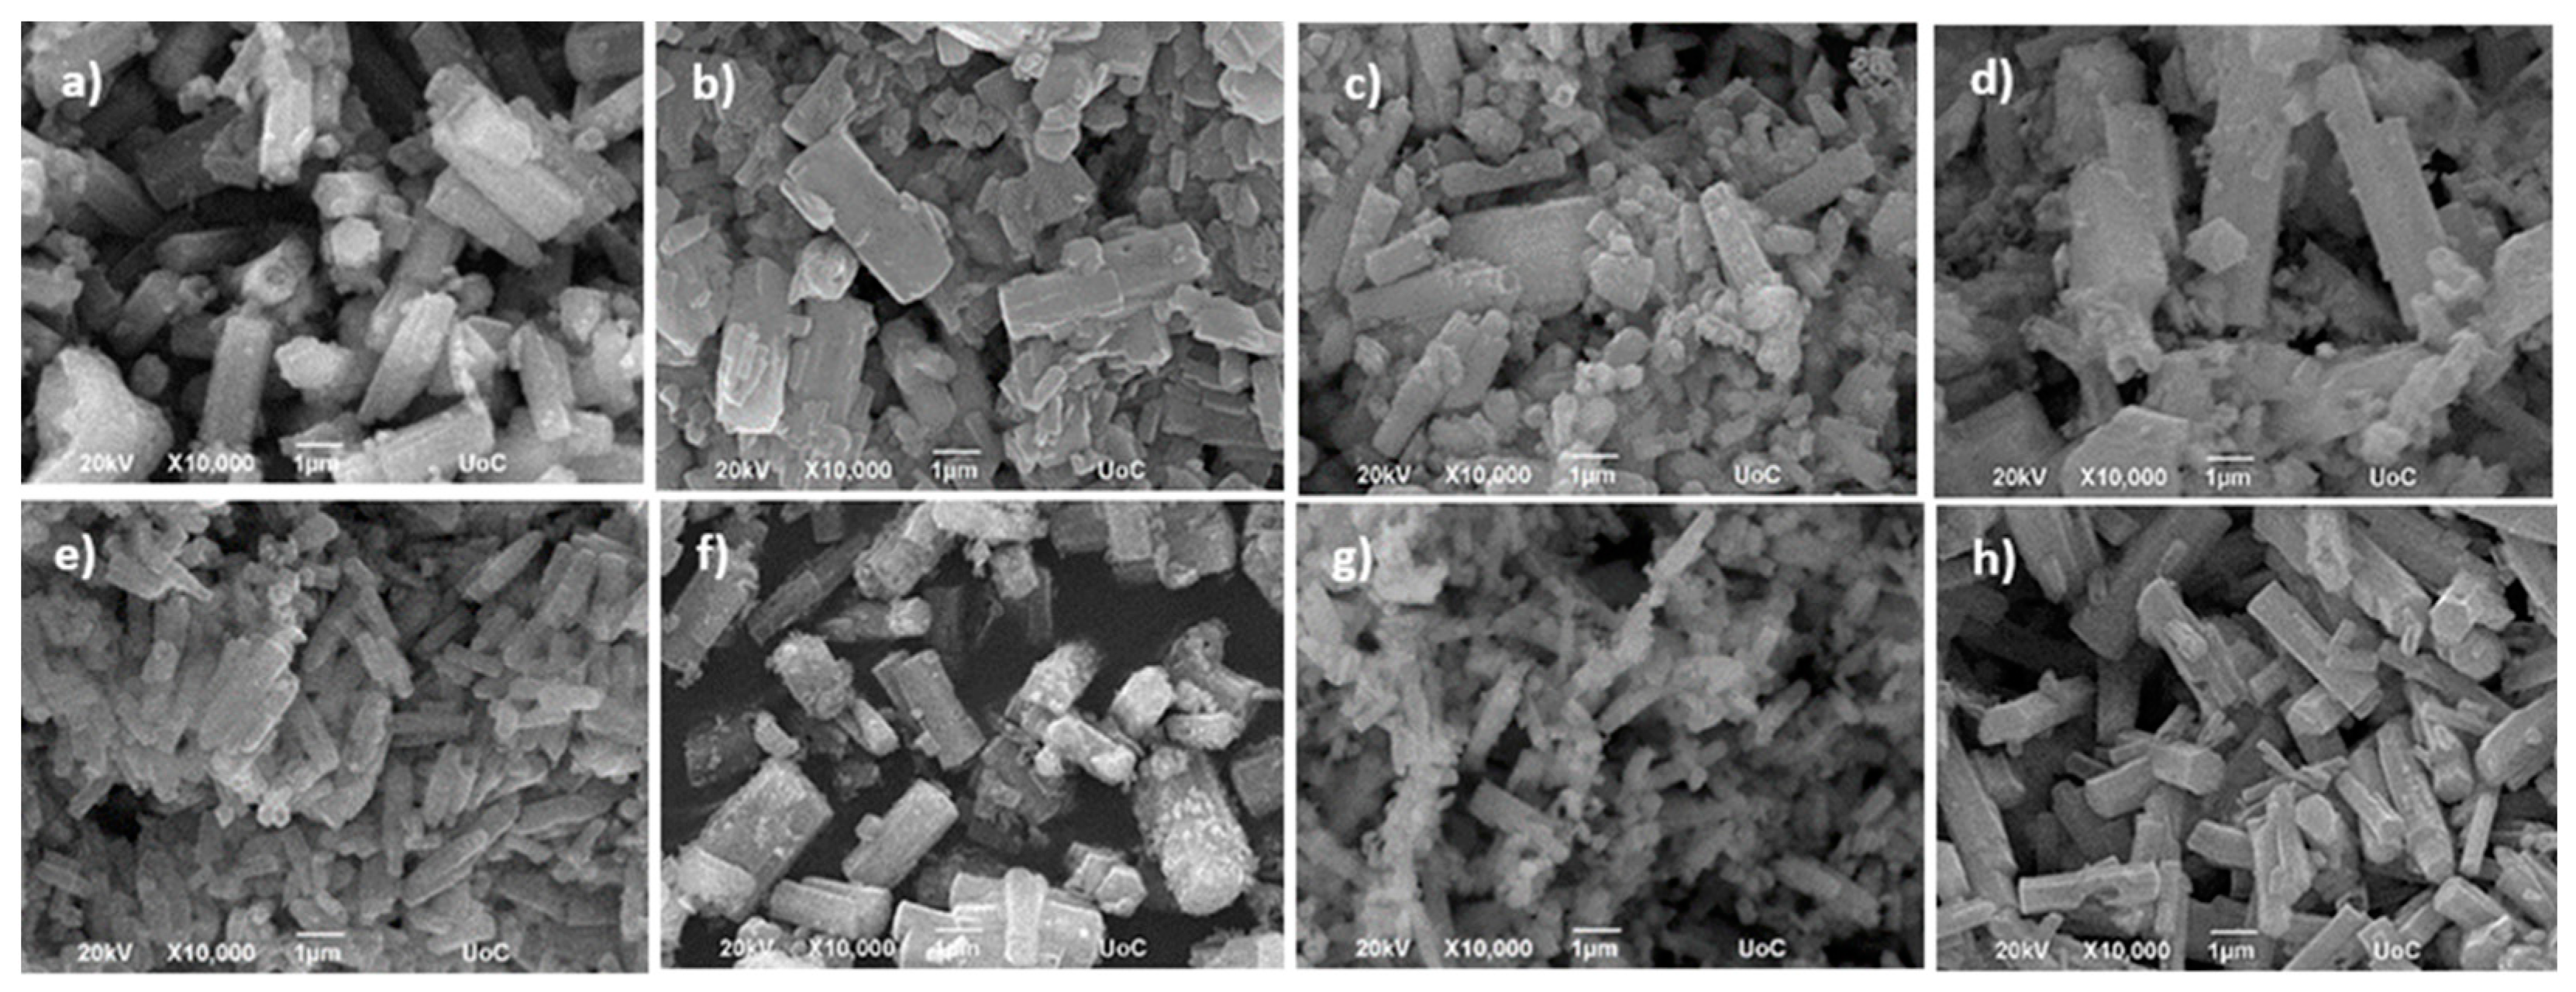
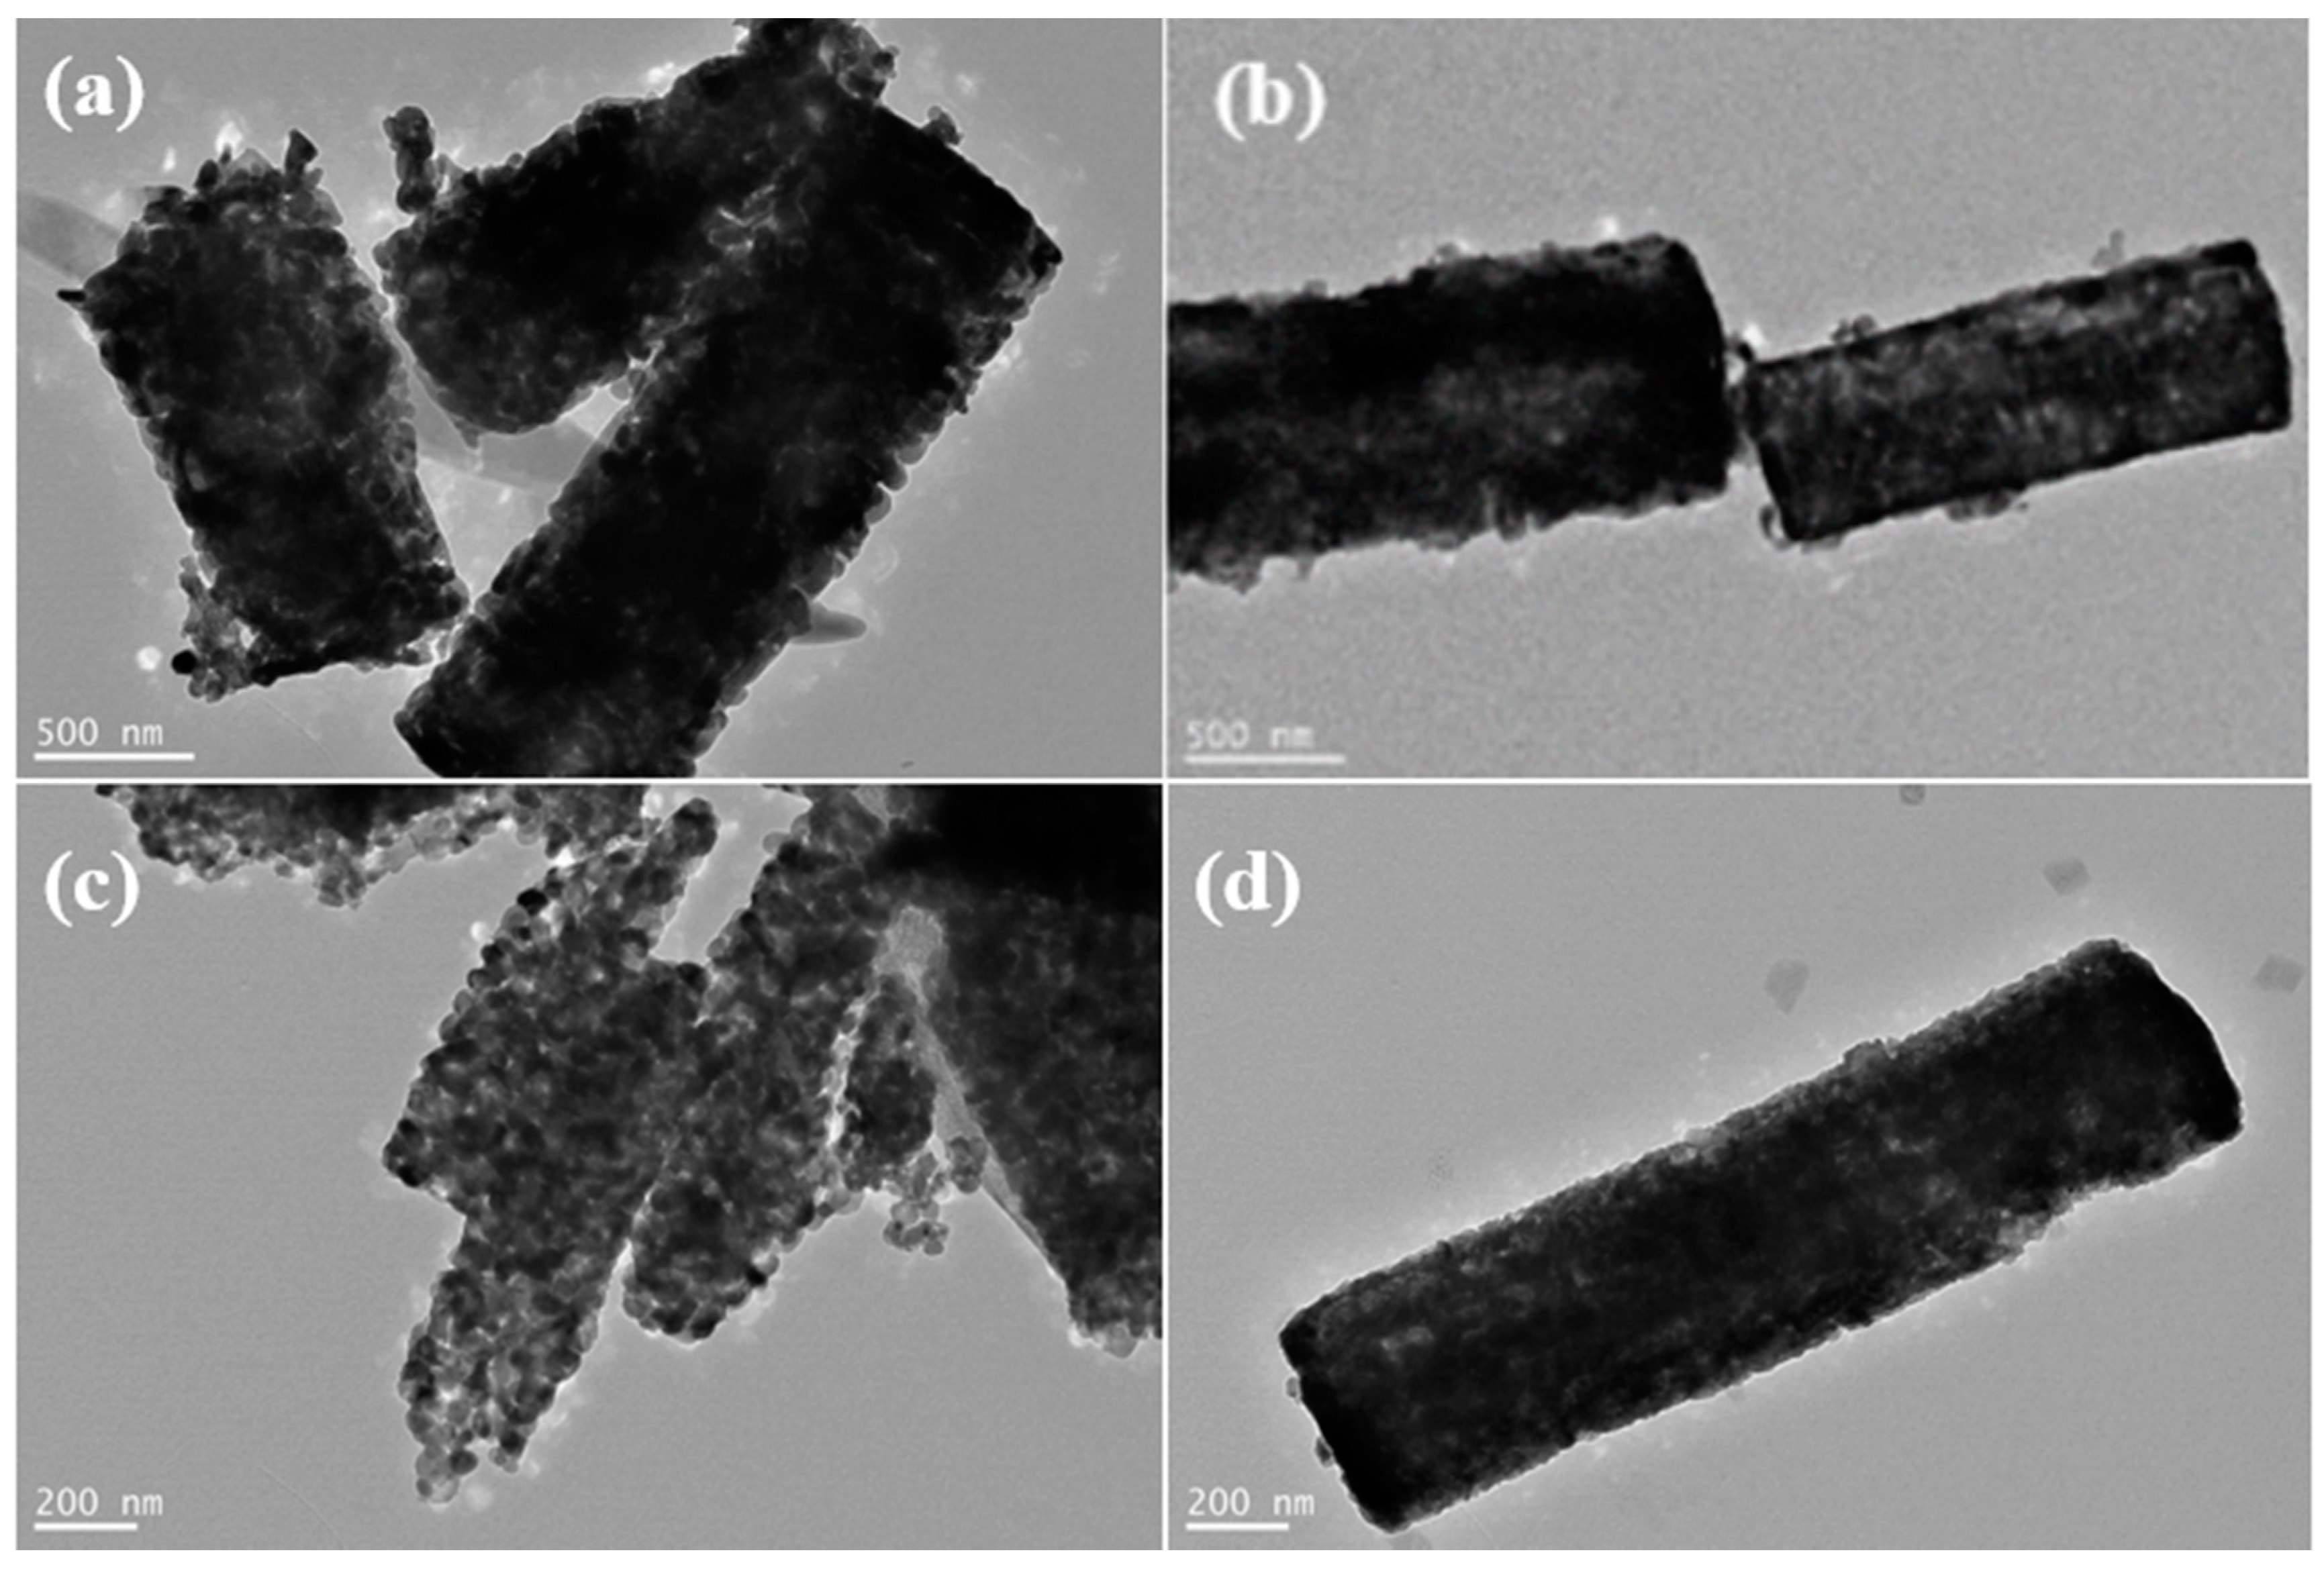
3.2. Morphological Characterization of Metal Titanate Nanorods

Figure 5 presents SEM images of the metal titanate nanorods before and after annealing.
Top row images are referred to materials before annealing and bottom row images are referred to materials after annealing in an order of MgTiO3, CoTiO3, NiTiO3, and ZnTiO3. SEM images reveal homogenous and well-defined nanorods in all four samples before and after annealing. The nanorod precursors that have been created after the stirring process have smooth surface which after annealing gets rougher with smaller nanoparticles of irregular shapes and sizes attached on it. After annealing MgTiO3 nanorods’ average length is 1.5–2 μm, CoTiO3 is 2 μm, NiTiO3 is 1–2 μm, and ZnTiO3 is 3–4 μm. The elementary analysis of the metal titanate nanorods is shown in Figure S3. In all samples peaks of Ti, O, and metal, with metal being either Mg, Co, Ni, or Zn, appeared in percentages matching with the chemical formula ATiO3. Moreover, the absence of other peaks denotes the purity of the samples agreeing with the XRD and FTIR data.
Figure 6 presents the TEM images of metal titanate nanorods after annealing. Verifying the SEM data, TEM images reveal homogenous nanorods with rough surfaces that seem to be composed of smaller, round in shape, nanoparticles that have aggregated with each other. The nanorods in MgTiO3 and CoTiO3 samples have a diameter of 500 nm. In NiTiO3 the rods have a diameter of 200 nm, and in ZnTiO3 the diameter is 250–300 nm.

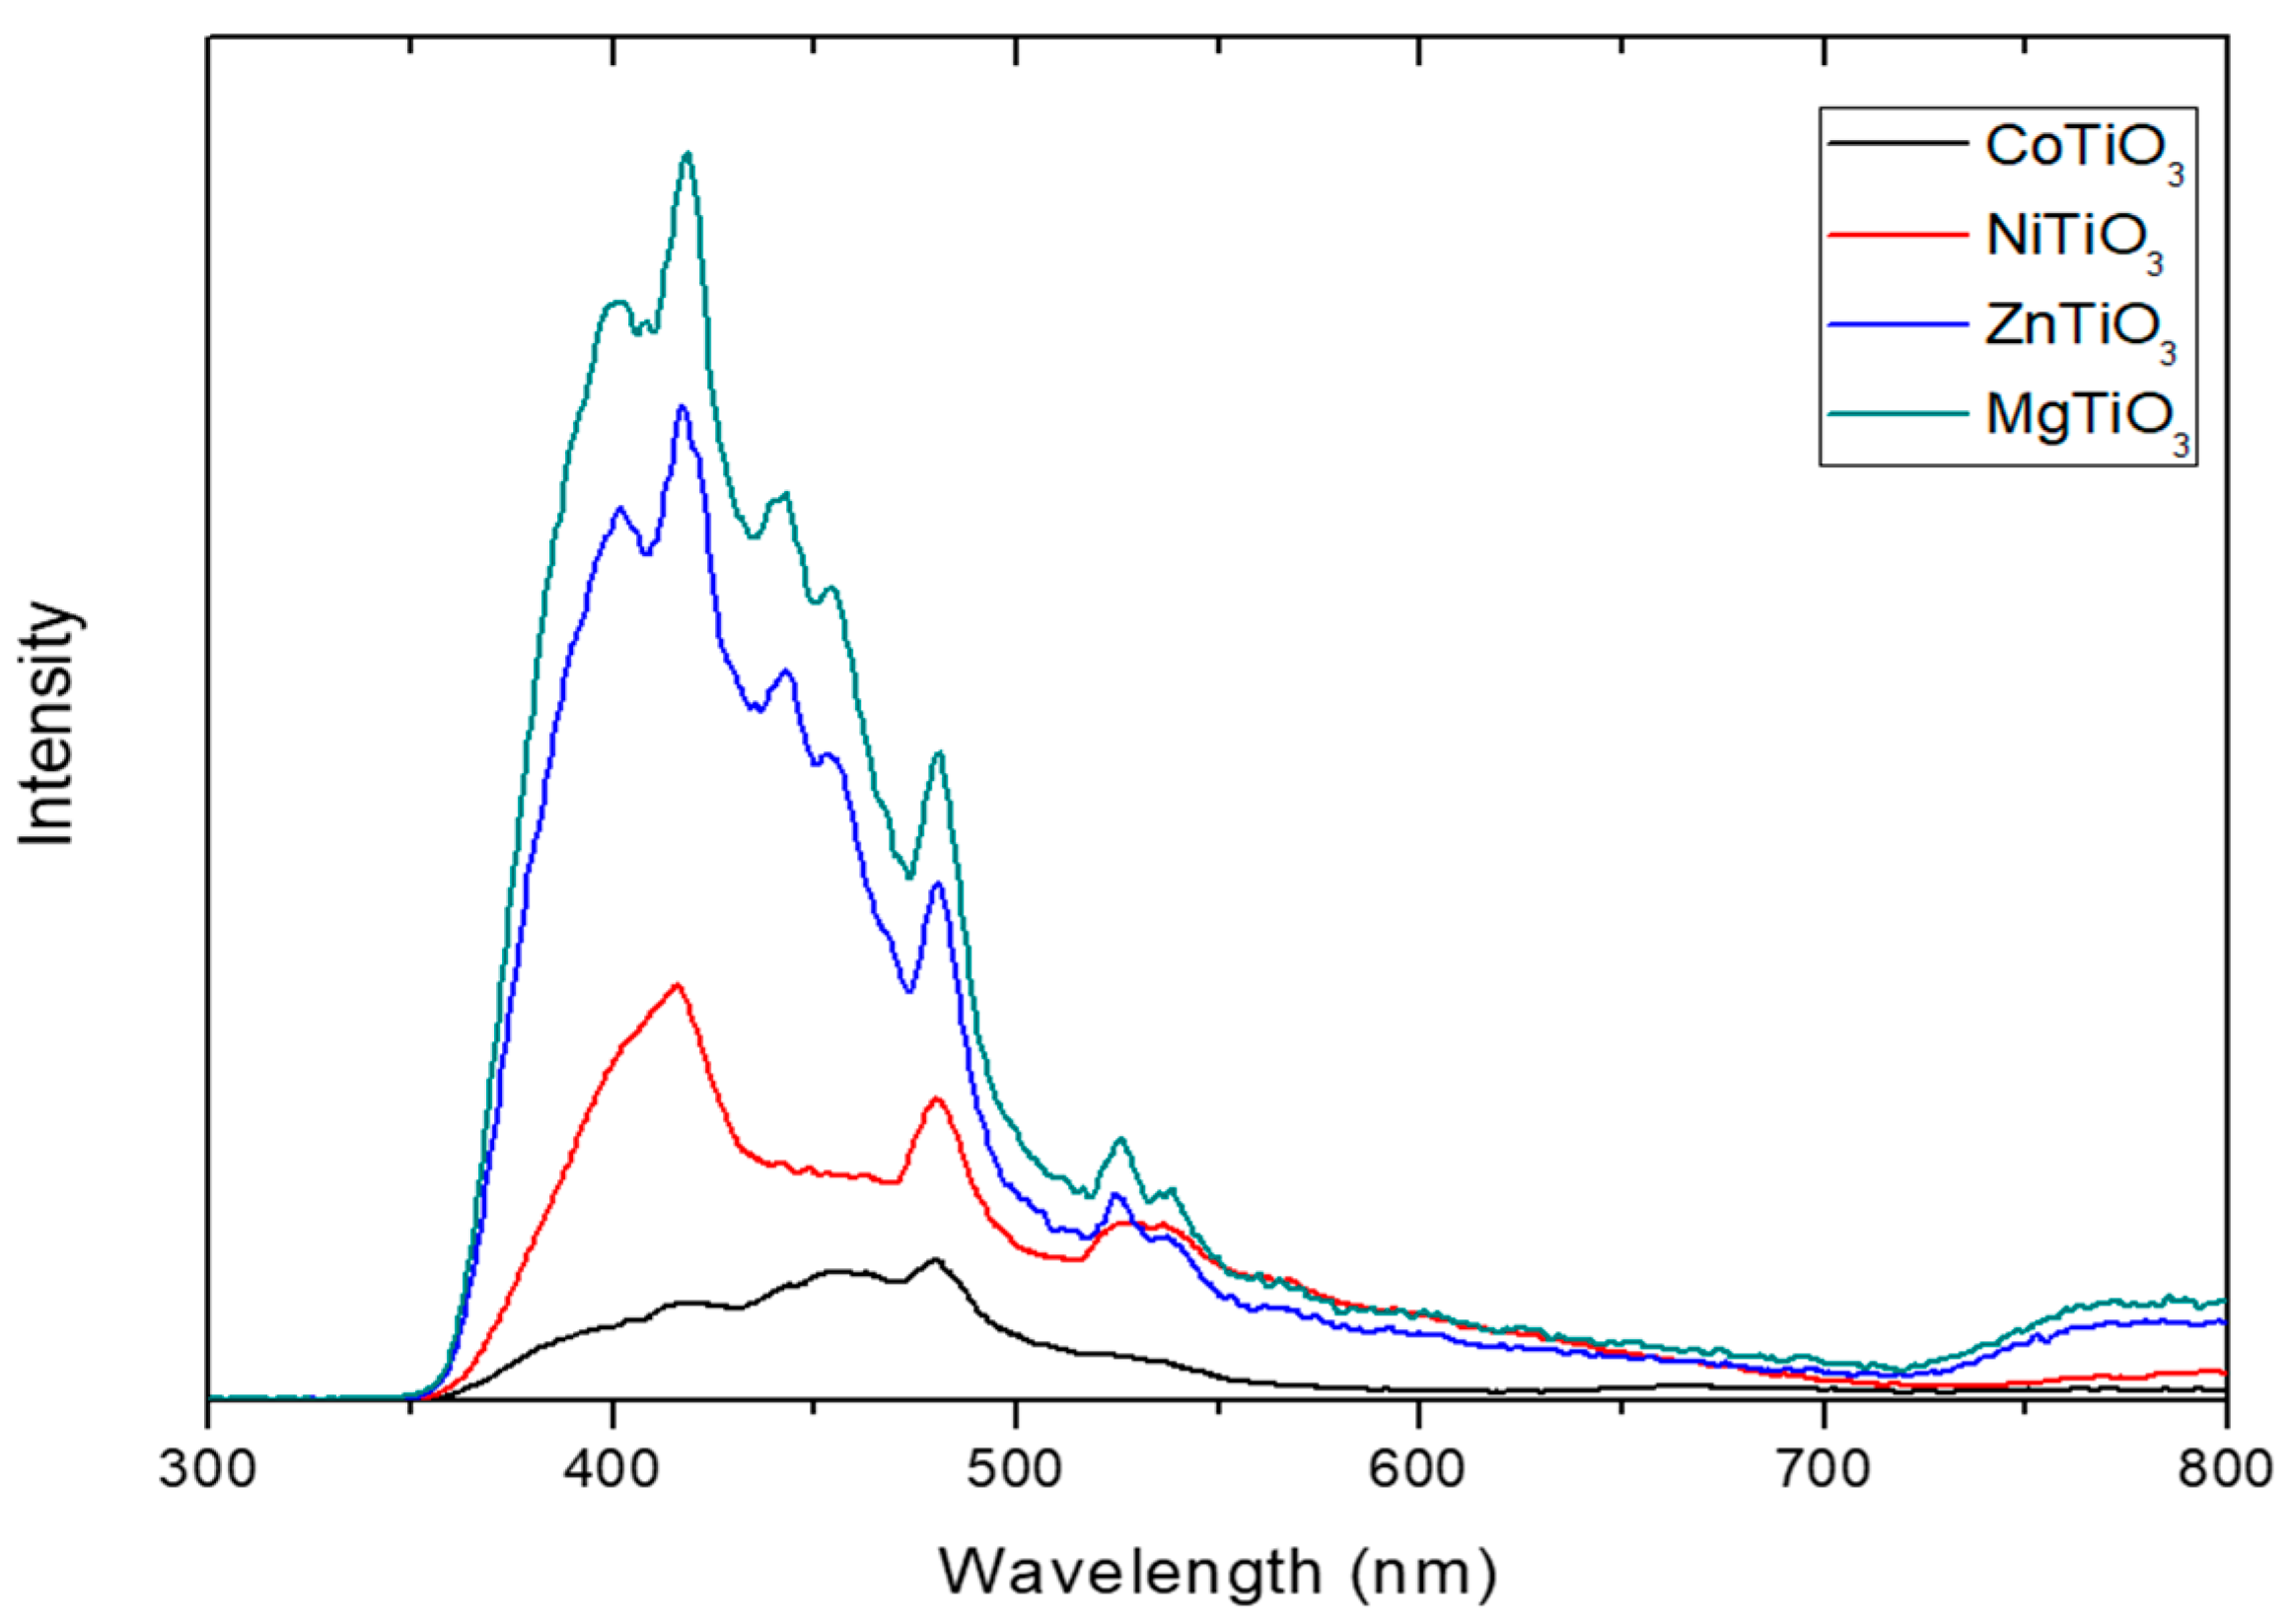
3.3. Optical Characterization of Metal Titanate Nanorods

Figure S4 shows the UV-Vis absorption as a function of wavelength for metal titanate nanorods. Table 2 presents the energy gap of metal titanate nanorods. MgTiO3 and ZnTiO3 reveal absorption bands at wavelengths lower than 400 nm, explaining their bright white color. However, in ZnTiO3 a small absorption edge can be spotted in the range 400–550 nm. Moreover, the energy gap of MgTiO3 was found to be 3.15 eV and for ZnTiO3 to be 3.5 eV from the Kubelka-Munk formula. CoTiO3 sample has absorption peaks at 400, 535, 611 nm with the last two bands associated with electron transfer from Co2+ to Ti4+ [26]. The sample’s energy gap was found to be 2.79 eV. The lack of absorption at the range of 480–550 nm justifies the sample’s dark green color. NiTiO3 sample has a bandgap energy of 2.6 eV and absorption peaks at 448, 505, 744 nm, again justifying the sample’s yellow color. Furthermore, the peaks at 448 nm and 505 nm are associated with electron transfer from Ni2+ to Ti4+ [69].
The separation efficiency of photo-generated charge carriers is revealed through photoluminescence (PL) spectroscopy. The PL emission spectrum of MTiO3 (M = Ni, Co, Mg, Zn) is shown in Figure 7. Since A2+ (A: Metal) itself is non-luminous and the observed luminescence from ATiO3 nanorods must be due to non-stoichiometry created by the oxygen deficiency in the system, which is expected to arise when ATiO3 nanorods form in a carbon-rich ambience [65]. The PL emission spectrum of ZnTiO3 and MgTiO3 nanorods show the same peaks with different intensity. Although high PL intensity is found for MgTiO3 and lower PL intensity is observed upon ZnTiO3 which indicates a lower electron–hole recombination rate. However, NiTiO3 and CoTiO3 exhibit the lowest electron-hole recombination. Based on the obtained results, the enhanced photocatalytic activity of NiTiO3 and CoTiO3 is ascribed mainly to an increased UV-light harvesting ability and an efficient separation of electron–hole pairs. Especially, it shows that upon 330 nm excitation, a series of emission bands ranging from UV to green region is observed and the bands were centered at 400, 418, 443, 455, 480, 525 nm for ZnTiO3 and CoTiO3. In the emission spectra, the broad emission peak at 400 nm is attributed to radiative recombination of photo-generated hole with an electron occupying the oxygen vacancy. Emission band centered at 443 nm is attributed to the recombination of a delocalized electron close to the conduction band with a single charged state of surface oxygen vacancy. The emission band at 455 nm can be attributed to self-trapped excitation luminescence [65]. Two emission peaks centered at 418 and 480 nm are observed also in the PL spectrum of NiTiO3 and the emission peak at 480 nm is the main peak in the PL spectrum of CoTiO3 [74,75]. This might be due to the increase in the crystallites with aspect ratio of the perovskite nanorods [76]. However, the strong emission peak focused at about 418 nm may be also due to radiative recombination process and self-trapped excitations [12].

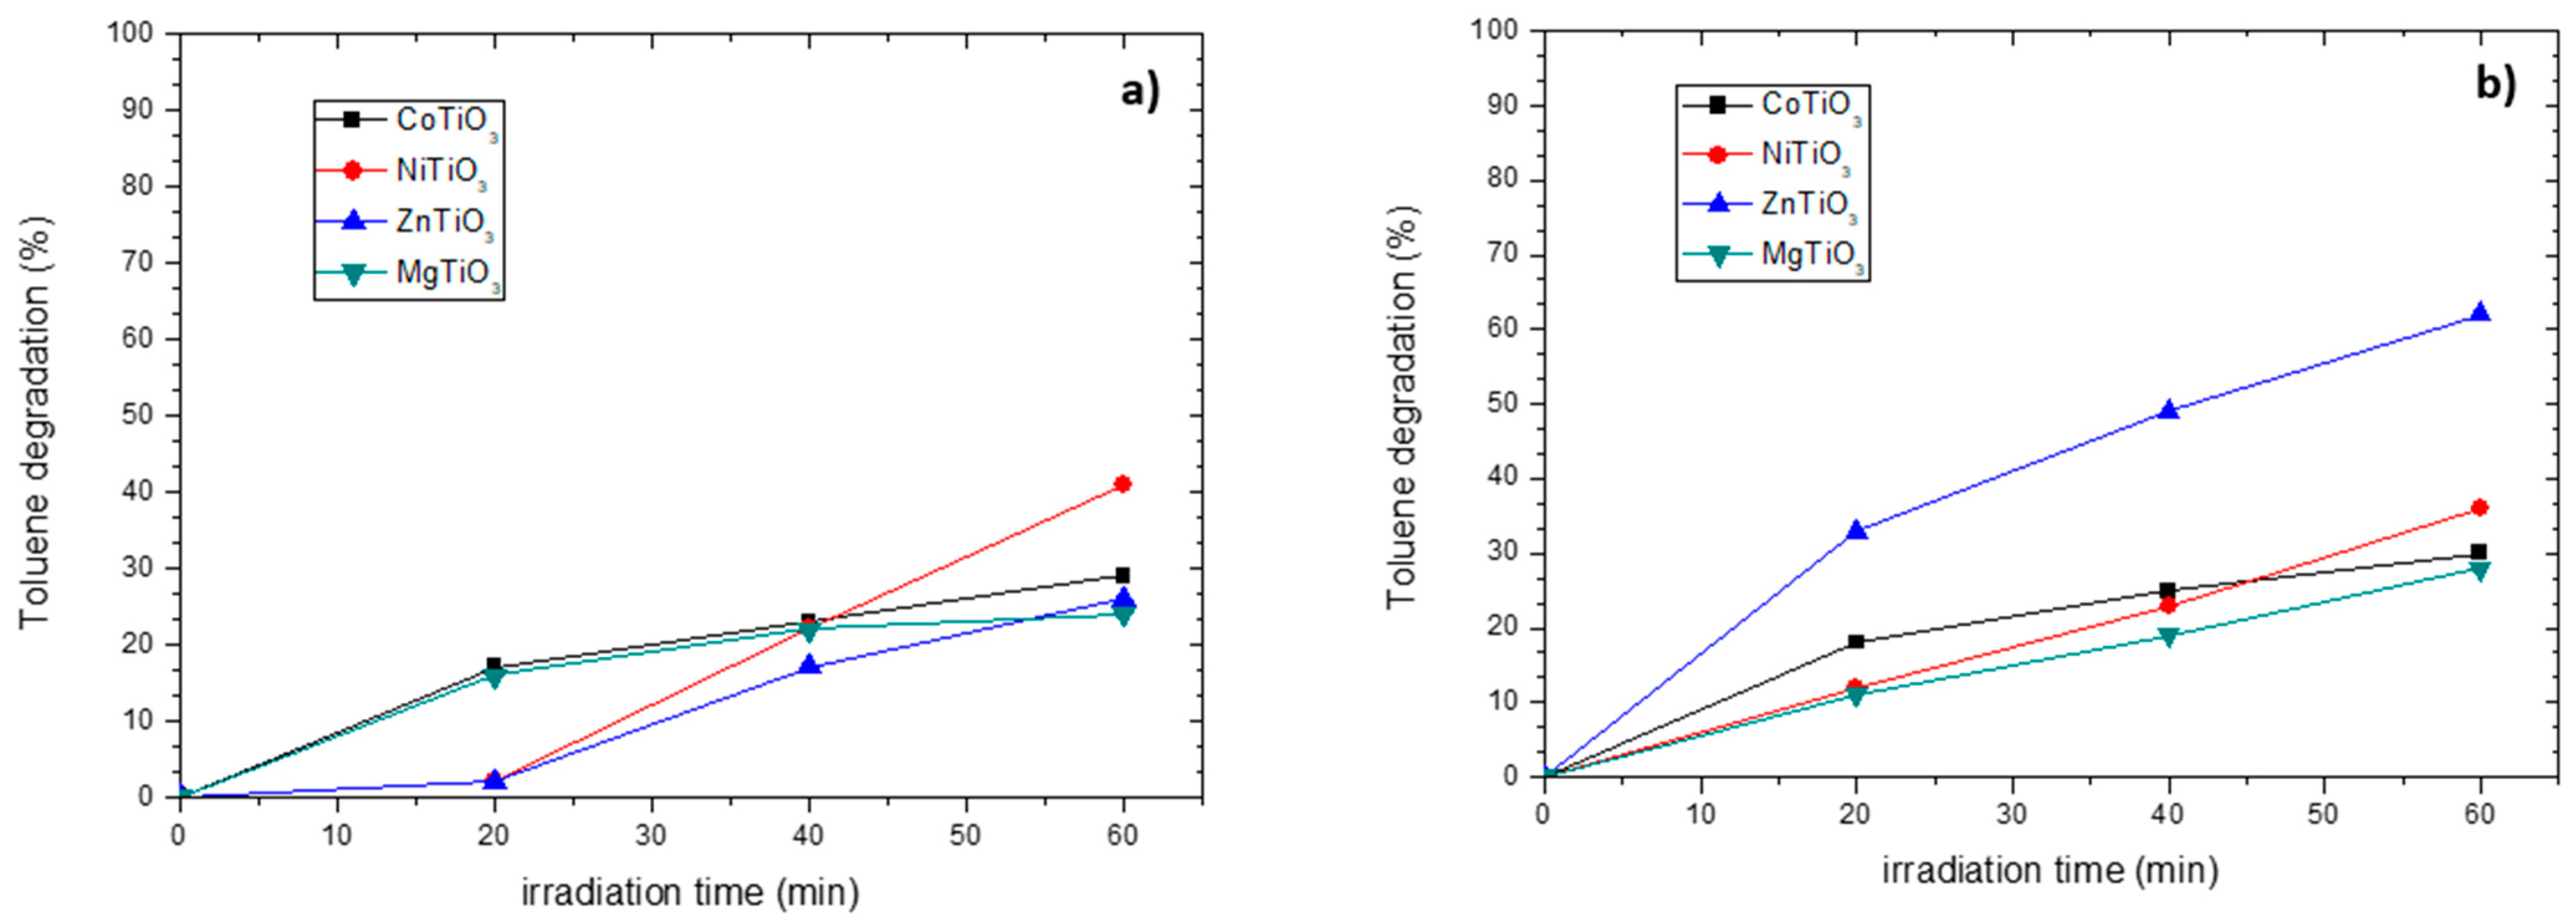
3.4. Photocatalytic Activity in Toluene Oxidation

In order to evaluate the photocatalytic activity of the obtained metal titanate nanorods ATiO3, toluene was employed as target pollutant [77]. The photodegradation reaction in gas phase was illumination by light-emitting diodes (LEDs). At the present time, traditional incandescent lamps are displaced by LEDs in many applications, due to much higher efficiency in light electricity conversion. In addition, benefits deriving from the implementation of LEDs result from the small dimensions and are long lasting. Therefore, the research has been extended with photodegradation experiment of toluene in the presence of ATiO3 under the influence of 1 h irradiation emitted by LEDs with λmax = 375 nm and λmax = 400 nm, respectively. The blank experiment was carried out to control the losses of toluene with the presence of irradiation and without photocatalysts. To exclude the effect of toluene adsorption at the surface of the photocatalyst, the amount of adsorbed toluene was measured during 30 min without light irradiation before every experiment.
The results showed that 5% of toluene was decreased after 30 min, indicating the photolysis of toluene. The photocatalytic activity of ATiO3 is presented in Figure 8. Based on the obtained results after 60 min of irradiation, it can be concluded that all of the samples presented toluene photodegradation. Under LEDs illumination with λmax = 375 nm, the highest toluene degradation rate is 41% in presence of NiTiO3 compared to the other nanomaterials which varies from 24 to 29%. So, the photocatalyst NiTiO3 exhibits the highest photocatalytic activity under λmax = 375 nm because of the low recombination rate which is shown at the PL results. In case of a longer irradiation wavelength (λmax = 400 nm), better photocatalytic activity was obtained. The highest efficiency (62%) of toluene degradation was observed for ZnTiO3 compared to the other nanomaterials which varies from 28 to 36%.
The photocatalytic reaction rate constant (k) is used to evaluate the photocatalytic activity, which is calculated by the formula ln (CO/C(t)) = kt, where CO and C(t) being the initial and reacted concentration of toluene at time t, respectively. According to these kinetic studies, the photocatalytic reaction rate constants are presented in Table 3. Particularly worth mentioning the constant in the case of ZnTiO3 under LED illumination with λmax = 400 nm is 16.08 × 10⁻³ min−1 and particular of interest the constant in case of NiTiO3 under LED illumination with λmax = 375 nm is 9.21 × 10⁻³ min−1.
The photoactivity per mass (%/mg) of every photocatalyst is calculated in Table 4. The results nominate the presented photocatalytic results and that ZnTiO3 exhibits 15.1%/mg toluene degradation which is the best photocatalytic activity per mass under LED illumination.

4. Conclusions

In the present study, we synthesized successfully a metal titanate nanorods ATiO3, A = Mg, Ni, Co, Zn with a simple and easy method. Presented results showed the effect of A-site metal in photocatalytic and optical properties. The photoactivity assessment was carried out toward the degradation of toluene in gas phase under low-powered LED light illumination with λmax 375 and 400 nm. ZnTiO3 showed the highest activity, 15.1%/mg, under LED light illumination which is the best photocatalytic activity per mass under LED illumination. The highly active zinc titanate nanorods ZnTiO3 may be a promising material for air treatment using LEDs, as well as a low-cost and suitable irradiation source, and follow the trends of green chemistry and environmentally friendly performance.

Supplementary Materials

The following are available online at https://www.mdpi.com/article/10.3390/app112210850/s1, Figure S1: Emission spectra of LEDs 375 nm, Figure S2: Emission spectra of LEDs 400 nm, Figure S3: EDX data of (a) MgTiO3, (b)CoTiO3, (c) NiTiO3 and (d) ZnTiO3, Figure S4: UV-Vis absorption of metal titanate nanorods ATiO3 (A = Mg, Co, Ni, Zn) after annealing process.

Author Contributions

Methodology, A.P.S.; V.F.; A.M.; formal analysis, A.M.; N.A.; M.M.; A.P.S.; G.K.; investigation N.A.; data curation, A.P.S.; writing—original draft preparation, A.M.; N.A.; A.P.S.; writing—review and editing, A.M; A.Z.-M.; V.B.; supervision, V.B. All authors have read and agreed to the published version of the manuscript.

Funding

This research was funded by the project “National Research Infrastructure on nanotechnology, advanced materials and micro/nanoelectronics” (MIS 5002772) which is implemented under the “Action for the Strategic Development on the Research and Technological Sector”, funded by the Operational Programme “Competitiveness, Entrepreneurship and Innovation” (NSRF 2014-2020) and co-financed by Greece and the European Union (European Regional Development Fund). The research work was supported by the Hellenic Foundation for Research and Innovation (HFRI) under the HFRI PhD Fellowship grant (Fellowship Number: 1477).

Acknowledgments

Authors acknowledge L.Papoutsakis for his contribution in TEM measurements. N. Andrigiannaki acknowledges EU Erasmus+ Internship.

Conflicts of Interest

The authors declare no conflict of interest.

References

  1. CDC. Agency for Toxic Substances and Disease Registry Public Health Statement for Ethylbenzene; Agency for Toxic Substances and Disease Registry: Atlanta, GA, USA, 2015. [Google Scholar]
  2. Dong, S.; Feng, J.; Fan, M.; Pi, Y.; Hu, L.; Han, X.; Liu, M.; Sun, J.; Sun, J. Recent developments in heterogeneous photocatalytic water treatment using visible light-responsive photocatalysts: A review. RSC Adv. 2015, 5, 14610–14630. [Google Scholar] [CrossRef]
  3. Serga, V.; Burve, R.; Krumina, A.; Pankratova, V.; Popov, A.I.; Pankratov, V. Study of phase composition, photocatalytic activity, and photoluminescence of TiO2 with Eu additive produced by the extraction-pyrolytic method. J. Mater. Res. Technol. 2021, 13, 2350–2360. [Google Scholar] [CrossRef]
  4. Li, C.; Soh, K.C.K.; Wu, P. Formability of ABO3 perovskites. J. Alloy. Compd. 2004, 372, 40–48. [Google Scholar] [CrossRef]
  5. Ishihara, T.; Properties, T. Springer Handbook of Electronic and Photonic Materials. In Springer Handbook of Electronic and Photonic Materials; Springer: Berlin/Heidelberg, Germany, 2017; pp. 1405–1420. [Google Scholar] [CrossRef] [Green Version]
  6. Kubo, A.; Giorgi, G.; Yamashita, K. MgTaO2N Photocatalysts: Perovskite vs. Ilmenite Structure. A Theoretical Investigation. J. Phys. Chem. C 2017, 121, 27813–27821. [Google Scholar] [CrossRef]
  7. Li, Z.; Yang, M.; Park, J.-S.; Wei, S.-H.; Berry, J.J.; Zhu, K. Stabilizing Perovskite Structures by Tuning Tolerance Factor: Formation of Formamidinium and Cesium Lead Iodide Solid-State Alloys. Chem. Mater. 2016, 28, 284–292. [Google Scholar] [CrossRef]
  8. Dos Santos-García, A.J.; Solana-Madruga, E.; Ritter, C.; Ávila-Brande, D.; Fabelo, O.; Sáez-Puche, R. Synthesis, structures and magnetic properties of the dimorphic Mn2CrSbO6 oxide. Dalton Trans. 2015, 44, 10665–10672. [Google Scholar] [CrossRef]
  9. Hossain, A.; Bandyopadhyay, P.; Roy, S. An overview of double perovskites A2B′B″O6 with small ions at A site: Synthesis, structure and magnetic properties. J. Alloy. Compd. 2018, 740, 414–427. [Google Scholar] [CrossRef]
  10. Liu, X.; Hong, R.; Tian, C. Tolerance factor and the stability discussion of ABO3-type ilmenite. J. Mater. Sci. Mater. Electron. 2009, 20, 323–327. [Google Scholar] [CrossRef]
  11. Wilson, N.; Muscat, J.; Mkhonto, D.; Ngoepe, P.E.; Harrison, N. Structure and properties of ilmenite from first principles. Phys. Rev. B Condens. Matter Mater. Phys. 2005, 71, 075202. [Google Scholar] [CrossRef]
  12. Bhagwat, U.O.; Wu, J.J.; Asiri, A.M.; Anandan, S. Synthesis of MgTiO3 Nanoparticles for Photocatalytic Applications. ChemistrySelect 2019, 4, 788–796. [Google Scholar] [CrossRef]
  13. Alammar, T.; Hamm, I.; Wark, M.; Mudring, A.-V. Low-temperature route to metal titanate perovskite nanoparticles for photocatalytic applications. Appl. Catal. B Environ. 2015, 178, 20–28. [Google Scholar] [CrossRef] [Green Version]
  14. Wattanawikkam, C.; Kansa-Ard, T.; Pecharapa, W. X-ray absorption spectroscopy analysis and photocatalytic behavior of ZnTiO3 nanoparticles doped with Co and Mn synthesized by sonochemical method. Appl. Surf. Sci. 2019, 474, 169–176. [Google Scholar] [CrossRef]
  15. Wattanawikkam, C.; Phoohinkong, W.; Pecharapa, W. Structural, Optical and Magnetic Properties of Diluted Magnetic Perovskite ZnTiO3 Doped with Co and Mn Prepared by Sonochemical Method. J. Nanosci. Nanotechnol. 2017, 17, 3620–3628. [Google Scholar] [CrossRef]
  16. Gayathri, S.; Jayabal, P.; Kottaisamy, M.; Ramakrishnan, V. Synthesis of the graphene-ZnTiO3 nanocomposite for solar light assisted photodegradation of methylene blue. J. Phys. D Appl. Phys. 2015, 48, 415305. [Google Scholar] [CrossRef]
  17. Debnath, A.; Srivastava, V.; Sunny, S.; Singh, S. Fabrication and characterization of metal-ferroelectric-semiconductor non-volatile memory using BaTiO3 film prepared through sol-gel process. Appl. Phys. A 2020, 126, 1–8. [Google Scholar] [CrossRef]
  18. Adhami, S.; Esfahany, M.N.; Eränen, K.; Peurla, M.; Mäkilä, E.; Murzin, D.Y.; Salmi, T. Influence of the specific surface area and silver crystallite size of mesoporous Ag/SrTiO3 on the selectivity enhancement of ethylene oxide production. J. Chem. Technol. Biotechnol. 2019, 94, 3839–3849. [Google Scholar] [CrossRef]
  19. Bautista-Ruiz, J.; Chaparro, A.; Sánchez, J. Characterization of the anticorrosive properties in bismuth-titanate films obtained by the sol-gel method. J. Phys. Conf. Ser. 2019, 1386. [Google Scholar] [CrossRef]
  20. Boudjellal, L.; Belhadi, A.; Brahimi, R.; Boumaza, S.; Trari, M. Physical and photoelectrochemical properties of the ilmenite NiTiO3 prepared by wet chemical method and its application for O2 evolution under visible light. Mater. Sci. Semicond. Process. 2018, 75, 247–252. [Google Scholar] [CrossRef]
  21. Suresh, M.; Thomas, J.; Sreemoolanadhan, H.; George, C.; John, A.; Solomon, S.; Wariar, P.; Koshy, J. Synthesis of nanocrystalline magnesium titanate by an auto-igniting combustion technique and its structural, spectroscopic and dielectric properties. Mater. Res. Bull. 2010, 45, 761–765. [Google Scholar] [CrossRef]
  22. Liu, F.; Qu, J.; Yuan, C.; Huang, X.; Chen, G.; Wang, D. Correlation between dielectric loss, microstructures and phase structures in a novel Mgn+1TinO3n+1 microwave ceramic system. Mater. Chem. Phys. 2017, 198, 35–41. [Google Scholar] [CrossRef]
  23. Liang, K.; He, H.; Ren, Y.; Wang, H.; Liao, Y.; Huang, X. Porous lithium titanate nanosheets as an advanced anode material for sodium ion batteries. J. Mater. Sci. 2020, 55, 4372–4381. [Google Scholar] [CrossRef]
  24. Pan, M.; Zhang, C.; Wang, J.; Chew, J.W.; Gao, G.; Pan, B.-C. Multifunctional Piezoelectric Heterostructure of BaTiO3@Graphene: Decomplexation of Cu-EDTA and Recovery of Cu. Environ. Sci. Technol. 2019, 53, 8342–8351. [Google Scholar] [CrossRef]
  25. Qu, Y.; Zhou, W.; Ren, Z.; Du, S.; Meng, X.; Tian, G.; Pan, K.; Wang, G.; Fu, H. Facile preparation of porous NiTiO3 nanorods with enhanced visible-light-driven photocatalytic performance. J. Mater. Chem. 2012, 22, 16471–16476. [Google Scholar] [CrossRef]
  26. Qu, Y.; Zhou, W.; Fu, H. Porous Cobalt Titanate Nanorod: A New Candidate for Visible Light-Driven Photocatalytic Water Oxidation. ChemCatChem 2014, 6, 265–270. [Google Scholar] [CrossRef]
  27. Fiévet, F.; Ammar-Merah, S.; Brayner, R.; Chau, F.; Giraud, M.; Mammeri, F.; Peron, J.; Piquemal, J.-Y.; Sicard, L.; Viau, G. The polyol process: A unique method for easy access to metal nanoparticles with tailored sizes, shapes and compositions. Chem. Soc. Rev. 2018, 47, 5187–5233. [Google Scholar] [CrossRef]
  28. Ramos-Sanchez, J.E.; Camposeco, R.; Lee, S.-W.; Rodríguez-González, V. Sustainable synthesis of AgNPs/strontium-titanate-perovskite-like catalysts for the photocatalytic production of hydrogen. Catal. Today 2020, 341, 112–119. [Google Scholar] [CrossRef]
  29. Li, X.; Ge, Z.; Xue, F.; Liu, H.; Lyu, B.; Liu, M. Lattice-oriented contact in Pd/SrTiO3 heterojunction for rapid electron transfer during photocatalytic H2 production. Mater. Res. Bull. 2020, 123, 110722. [Google Scholar] [CrossRef]
  30. Zhou, M.; Chen, J.; Zhang, Y.; Jiang, M.; Xu, S.; Liang, Q.; Li, Z. Shape-controlled synthesis of golf-like, star-like, urchin-like and flower-like SrTiO3 for highly efficient photocatalytic degradation and H2 production. J. Alloy. Compd. 2020, 817, 152796. [Google Scholar] [CrossRef]
  31. Chung, K.; Park, Y.; Kim, H.; Kim, B.; Jung, S. Effect of Liquid Phase Plasma Irradiation on Production by Photocatalytic Water Splitting over SrTiO3 Photocatalysts. ChemCatChem 2019, 11, 6451–6459. [Google Scholar] [CrossRef]
  32. Li, N.; Wu, J.; Fang, H.-B.; Zhang, X.-H.; Zheng, Y.-Z.; Tao, X. Au-nanorod-anchored {0 0 1} facets of Bi4Ti3O12 nanosheets for enhanced visible-light-driven photocatalysis. Appl. Surf. Sci. 2018, 448, 41–49. [Google Scholar] [CrossRef]
  33. El Rouby, W.; Comesana-Hermo, M.; Testa-Anta, M.; Carbó-Argibay, E.; Salgueiriño, V.; Pérez-Lorenzo, M.; Correa-Duarte, M.A. Au-decorated sodium titanate nanotubes as high-performance selective photocatalysts for pollutant degradation. J. Phys. D Appl. Phys. 2017, 50, 144002. [Google Scholar] [CrossRef]
  34. Chen, F.; Yu, C.; Wei, L.; Fan, Q.; Ma, F.; Zeng, J.; Yi, J.; Yang, K.; Ji, H. Fabrication and characterization of ZnTiO3/Zn2Ti3O8/ZnO ternary photocatalyst for synergetic removal of aqueous organic pollutants and Cr(VI) ions. Sci. Total Environ. 2020, 706, 136026. [Google Scholar] [CrossRef]
  35. Selvarajan, S.; Malathy, P.; Suganthi, A.; Rajarajan, M. Fabrication of mesoporous BaTiO3/SnO2 nanorods with highly enhanced photocatalytic degradation of organic pollutants. J. Ind. Eng. Chem. 2017, 53, 201–212. [Google Scholar] [CrossRef]
  36. da Silva, L.; Lopes, O.; de Mendonça, V.; Carvalho, K.T.G.; Longo, E.; Ribeiro, C.; Mastelaro, V.R. An Understanding of the Photocatalytic Properties and Pollutant Degradation Mechanism of SrTiO3 Nanoparticles. Photochem. Photobiol. 2016, 92, 371–378. [Google Scholar] [CrossRef]
  37. Naudin, G.; Entradas, T.; Barrocas, B.; Monteiro, O. Titanate Nanorods Modified with Nanocrystalline ZnS Particles and Their Photocatalytic Activity on Pollutant Removal. J. Mater. Sci. Technol. 2016, 32, 1122–1128. [Google Scholar] [CrossRef]
  38. Patil, R.; Hiragond, C.; Jain, G.; Khanna, P.K.; Gaikwad, V.; More, P.V. La doped BaTiO3 nanostructures for room temperature sensing of NO2/NH3: Focus on La concentration and sensing mechanism. Vacuum 2019, 166, 37–44. [Google Scholar] [CrossRef]
  39. Wang, J.; Liu, A.; Wang, C.; You, R.; Liu, F.; Li, S.; Yang, Z.; He, J.; Yan, X.; Sun, P.; et al. Solid state electrolyte type gas sensor using stabilized zirconia and MTiO3 (M: Zn, Co and Ni)-SE for detection of low concentration of SO2. Sens. Actuators B Chem. 2019, 296, 126644. [Google Scholar] [CrossRef]
  40. Chen, Y.-B. Dielectric properties and crystal structure of Mg2TiO4 ceramics substituting Mg2+ with Zn2+ and Co2+. J. Alloy. Compd. 2012, 513, 481–486. [Google Scholar] [CrossRef]
  41. Al-Hobaib, A.; El Ghoul, J.; El Mir, L. Fabrication of polyamide membrane reached by MgTiO3 nanoparticles for ground water purification. Desalination Water Treat. 2016, 57, 8639–8648. [Google Scholar] [CrossRef]
  42. Hao, F.X.; Zhang, C.; Liu, X.; Yin, Y.W.; Sun, Y.Z.; Li, X.G. Photovoltaic effect in YBa2Cu3O7−δ/Nb-doped SrTiO3 heterojunctions. Appl. Phys. Lett. 2016, 109, 131104. [Google Scholar] [CrossRef]
  43. Sharma, S.; Tomar, M.; Kumar, A.; Puri, N.; Gupta, V. Photovoltaic effect in BiFeO3/BaTiO3 multilayer structure fabricated by chemical solution deposition technique. J. Phys. Chem. Solids 2016, 93, 63–67. [Google Scholar] [CrossRef]
  44. Gupta, R.; Gupta, V.; Tomar, M. Ferroelectric PZT thin films for photovoltaic application. Mater. Sci. Semicond. Process. 2020, 105, 104723. [Google Scholar] [CrossRef]
  45. Sidheswaran, M.; Tavlarides, L.L. Visible Light Photocatalytic Oxidation of Toluene Using a Cerium-Doped Titania Catalyst. Ind. Eng. Chem. Res. 2008, 47, 3346–3357. [Google Scholar] [CrossRef]
  46. Tasbihi, M.; Lavrencic Stangar, U.; Černigoj, U.; Jirkovsky, J.; Bakardjieva, S.; Novak Tušar, N. Photocatalytic oxidation of gaseous toluene on titania/mesoporous silica powders in a fluidized-bed reactor. Catal. Today 2011, 161, 181–188. [Google Scholar] [CrossRef]
  47. Shu, Y.; Xu, Y.; Huang, H.; Ji, J.; Liang, S.; Wu, M.; Leung, D.Y. Catalytic oxidation of VOCs over Mn/TiO2/activated carbon under 185 nm VUV irradiation. Chemosphere 2018, 208, 550–558. [Google Scholar] [CrossRef]
  48. Guo, C.; Wu, X.; Yan, M.; Dong, Q.; Yin, S.; Sato, T.; Liu, S. The visible-light driven photocatalytic destruction of NOx using mesoporous TiO2 spheres synthesized via a “water-controlled release process”. Nanoscale 2013, 5, 8184–8191. [Google Scholar] [CrossRef]
  49. Wang, H.; Wu, Z.; Zhao, W.; Guan, B. Photocatalytic oxidation of nitrogen oxides using TiO2 loading on woven glass fabric. Chemosphere 2007, 66, 185–190. [Google Scholar] [CrossRef]
  50. Wang, H.; Liu, H.; Chen, Z.; Veksha, A.; Lisak, G.; You, C. Interaction between SO2 and NO in their adsorption and photocatalytic conversion on TiO2. Chemosphere 2020, 249, 126136. [Google Scholar] [CrossRef]
  51. Vildozo, D.; Portela, R.; Ferronato, C.; Chovelon, J.-M. Photocatalytic oxidation of 2-propanol/toluene binary mixtures at indoor air concentration levels. Appl. Catal. B Environ. 2011, 107, 347–354. [Google Scholar] [CrossRef]
  52. Chen, M.; Li, X.; Huang, Y.; Yao, J.; Li, Y.; Lee, S.-C.; Ho, W.; Huang, T.; Chen, K. Synthesis and characterization of Bi-BiPO4 nanocomposites as plasmonic photocatalysts for oxidative NO removal. Appl. Surf. Sci. 2020, 513, 145775. [Google Scholar] [CrossRef]
  53. Rao, F.; Zhu, G.; Wang, M.; Zubairu, S.M.; Peng, J.; Gao, J.; Hojamberdiev, M. Constructing the Pd/PdO/β-Bi2O3 microspheres with enhanced photocatalytic activity for Bisphenol A degradation and NO removal. J. Chem. Technol. Biotechnol. 2019, 95, 862–874. [Google Scholar] [CrossRef]
  54. Wang, C.-B.; Tang, C.-W.; Tsai, H.-C.; Chien, S.-H. Characterization and Catalytic Oxidation of Carbon Monoxide Over Supported Cobalt Catalysts. Catal. Lett. 2006, 107, 223–230. [Google Scholar] [CrossRef]
  55. Guo, J.; Ouyang, S.; Li, P.; Zhang, Y.; Kako, T.; Ye, J. A new heterojunction Ag3PO4/Cr-SrTiO3 photocatalyst towards efficient elimination of gaseous organic pollutants under visible light irradiation. Appl. Catal. B Environ. 2013, 134–135, 286–292. [Google Scholar] [CrossRef]
  56. Irie, H.; Maruyama, Y.; Hashimoto, K. Ag+- and Pb2+-Doped SrTiO3 Photocatalysts. A Correlation Between Band Structure and Photocatalytic Activity. J. Phys. Chem. C 2007, 111, 1847–1852. [Google Scholar] [CrossRef]
  57. Miyauchi, M.; Takashio, M.; Tobimatsu, H. Photocatalytic Activity of SrTiO3 Codoped with Nitrogen and Lanthanum under Visible Light Illumination. Langmuir 2004, 20, 232–236. [Google Scholar] [CrossRef] [PubMed]
  58. Yang, X.; Liu, S.; Li, J.; Chen, J.; Rui, Z. Promotion effect of strong metal-support interaction to thermocatalytic, photocatalytic, and photothermocatalytic oxidation of toluene on Pt/SrTiO3. Chemosphere 2020, 249, 126096. [Google Scholar] [CrossRef]
  59. Ji, W.; Shen, T.; Kong, J.; Rui, Z.; Tong, Y. Synergistic Performance between Visible-Light Photocatalysis and Thermocatalysis for VOCs Oxidation over Robust Ag/F-Codoped SrTiO3. Ind. Eng. Chem. Res. 2018, 57, 12766–12773. [Google Scholar] [CrossRef]
  60. Marchelek, M.; Grabowska, E.; Klimczuk, T.; Lisowski, W.; Zaleska-Medynska, A. Various types of semiconductor photocatalysts modified by CdTe QDs and Pt NPs for toluene photooxidation in the gas phase under visible light. Appl. Surf. Sci. 2017, 393, 262–275. [Google Scholar] [CrossRef]
  61. Suárez-Vázquez, S.; Gil, S.; García-Vargas, J.; Cruz-López, A.; Giroir-Fendler, A. Catalytic oxidation of toluene by SrTi1-XBXO3 (B = Cu and Mn) with dendritic morphology synthesized by one pot hydrothermal route. Appl. Catal. B Environ. 2018, 223, 201–208. [Google Scholar] [CrossRef]
  62. Liferovich, R.P.; Mitchell, R.H. Geikielite–ecandrewsite solid solutions: Synthesis and crystal structures of the Mg1−x ZnxTiO3 (0 ≤ x ≤ 0.8) series. Acta Crystallogr. Sect. B Struct. Sci. 2004, 60, 496–501. [Google Scholar] [CrossRef] [Green Version]
  63. Shannon, R.D.; Prewitt, C.T. Revised values of effective ionic radii. Acta Cryst. Sect. B Struct. Cryst. Cryst. Chem. 1970, 26, 1046–1048. [Google Scholar] [CrossRef]
  64. Busca, G.; Ramis, G.; Escribano, V.S.; Piaggio, P. FT Raman and FTIR studies of titanias and metatitanate powders. J. Chem. Soc. Faraday Trans. 1994, 90, 3181–3190. [Google Scholar] [CrossRef]
  65. Raveendra, R.S.; Prashanth, P.A.; Hari Krishna, R.; Bhagya, N.P.; Sathyanarayani, S.; Na-gabhushana, B.M. Carbothermal Synthesis and Photoluminescence Characteristics of Pure Un-doped ZnTiO3 Nanocrystals. J. Adv. Phys. Sci. 2016, 6, 4–7. [Google Scholar]
  66. Chai, Y.-L.; Chang, Y.-S.; Chen, G.-J.; Hsiao, Y.-J. The effects of heat-treatment on the structure evolution and crystallinity of ZnTiO3 nano-crystals prepared by Pechini process. Mater. Res. Bull. 2008, 43, 1066–1073. [Google Scholar] [CrossRef]
  67. Tang, Y.; Zhou, J.; Liu, J.; Liu, L.; Liang, S. Facile synthesis of cobalt vanadium oxides and their applications in lithium batteries. Int. J. Electrochem. Sci. 2013, 8, 1138–1145. [Google Scholar]
  68. Lakhera, S.K.; Hafeez, H.Y.; Veluswamy, P.; Ganesh, V.; Khan, A.; Ikeda, H.; Neppolian, B. Enhanced photocatalytic degradation and hydrogen production activity of in situ grown TiO2 coupled NiTiO3 nanocomposites. Appl. Surf. Sci. 2018, 449, 790–798. [Google Scholar] [CrossRef]
  69. Murcia-López, S.; Moschogiannaki, M.; Binas, V.; Andreu, T.; Tang, P.; Arbiol, J.; Biendicho, J.J.; Kiriakidis, G.; Morante, J.R. Insights into the Performance of CoxNi1–xTiO3 Solid Solutions as Photocatalysts for Sun-Driven Water Oxidation. ACS Appl. Mater. Interfaces 2017, 9, 40290–40297. [Google Scholar] [CrossRef] [PubMed] [Green Version]
  70. Materials Data on MgTiO3 (SG:148) by Materials Project. Available online: https://materialsproject.org/materials/mp-3771/ (accessed on 12 November 2021). [CrossRef]
  71. Li, M.-W.; Gao, X.-M.; Hou, Y.-L.; Wang, C.-Y. Characterization of CoTiO3 Nanocrystallites Prepared by Homogeneous Precipitation Method. J. Nano Electron. Phys. 2013, 5, 03022. [Google Scholar]
  72. Li, Y.; Xu, J.; Peng, M.; Liu, Z.; Li, X.; Zhao, S. MoS2/NiTiO3 Heterojunctions as Photocatalysts: Improved Charge Separation for Promoting Photocatalytic Hydrogen Production Activity. Catal. Surv. Asia 2019, 23, 277–289. [Google Scholar] [CrossRef]
  73. Jaramillo-Fierro, X.; Capa, L.; Medina, F.; González, S. DFT Study of Methylene Blue Adsorption on ZnTiO3 and TiO2 Surfaces (101). Molecules 2021, 26, 3780. [Google Scholar] [CrossRef]
  74. Bellam, J.B.; Ruiz-Preciado, M.A.; Edely, M.; Szade, J.; Jouanneaux, A.; Kassiba, A.H. Visible-light photocatalytic activity of nitrogen-doped NiTiO3 thin films prepared by a co-sputtering process. RSC Adv. 2015, 5, 10551–10559. [Google Scholar] [CrossRef]
  75. Wangkawong, K.; Suntalelat, S.; Tantraviwat, D.; Inceesungvorn, B. Novel CoTiO3/Ag3VO4 Composite: Synthesis, Characterization and Visible-light-driven Photocatalytic Activity. Mater. Lett. 2014, 133, 119–122. [Google Scholar] [CrossRef]
  76. Pugazhenthiran, N.; Kaviyarasan, K.; Sivasankar, T.; Emeline, A.; Bahnemann, D.; Mangalaraja, R.; Anandan, S. Sonochemical synthesis of porous NiTiO3 nanorods for photocatalytic degradation of ceftiofur sodium. Ultrason. Sonochem. 2017, 35, 342–350. [Google Scholar] [CrossRef] [PubMed]
  77. Cruz, S.L.; Rivera-García, M.T.; Woodward, J.J. Review of Toluene Actions: Clinical Evidence, Animal Studies, and Molecular Targets. J. Drug Alcohol Res. 2014, 3, 1–8. [Google Scholar] [CrossRef] [PubMed] [Green Version]
Figure 1. Formation mechanism of metal titanate nanorods ATiO3 (A = Mg, Co, Ni, Zn).
Applsci 11 10850 g001
Figure 2. XRD patterns of metal titanate nanorods ATiO3 (A = Mg, Co, Ni, Zn) after annealing process.
Applsci 11 10850 g002
Figure 3. FT-IR spectra of metal titanate nanorods ATiO3 (A = Mg, Co, Ni, Zn) after annealing process.
Applsci 11 10850 g003
Figure 4. Raman spectra of metal titanate nanorods ATiO3 (A = Mg, Co, Ni, Zn) after annealing process.
Applsci 11 10850 g004
Figure 5. SEM images of (a,e) referred to MgTiO3, (b,f) to CoTiO3, (c,g) to NiTiO3, and (d,h) to ZnTiO3 before and after annealing process, respectively. So top row images are referred to materials before annealing and bottom row images are referred to materials after annealing in an order of MgTiO3, CoTiO3, NiTiO3 and ZnTiO3.
Applsci 11 10850 g005
Figure 6. TEM images of (a) MgTiO3, (b) CoTiO3, (c) NiTiO3, and (d) ZnTiO3 after annealing process.
Applsci 11 10850 g006
Figure 7. PL spectra of metal titanate nanorods ATiO3 (A = Mg, Co, Ni, Zn) upon 330 nm excitation.
Applsci 11 10850 g007
Figure 8. Toluene decomposition under LED irradiation (a) λmax = 375 nm and (b) λmax = 400 nm of metal titanate nanorods ATiO3 (A = Mg, Co, Ni, Zn).
Applsci 11 10850 g008
Table 1. Lattice parameters, volume cell, crystallite size, ionic radius, and tolerance factor of metal titanate nanorods ATiO3 (A = Mg, Co, Ni, Zn).
SamplesLattice Parameters (Å)Volume Cell (Å3)Crystallite Size (nm)Ionic Radius of
A-Site Metal (Å)
Tolerance Factor
a (ath)b (bth)c (cth)
NiTiO35.0229 (5.0312)5.0229 (5.0312)12.9012 (13.7881)976.4819.280.690.73
MgTiO35.0465 (5.0548)5.0465 (5.0548)13.8892 (13.8992)1061.1719.500.720.75
CoTiO35.0579 (5.0662)5.0579 (5.0662)13.9177 (13.9180)1068.1428.500.740.76
ZnTiO38.4044 (8.4080)8.4044 (8.4080)8.4044 (8.4080)593.6510.401.390.99
Table 2. Band gap of metal titanate nanorods ATiO3 (A = Mg, Co, Ni, Zn).
SampleEnergy Gap (eV)Energy Gap (eV)
Data from Literature
MgTiO33.153.51 [70]
CoTiO32.792.53 [71]
NiTiO32.62.33 [72]
ZnTiO33.53.16 [73]
Table 3. Photocatalytic reaction rate constants under LED illumination of metal titanate nanorods ATiO3 (A = Mg, Co, Ni, Zn).
Photocatalystk (10−3 min−1) under λmax = 375 nmk (10−3 min−1) under λmax = 400 nm
NiTiO39.217.44
MgTiO34.435.47
CoTiO35.595.72
ZnTiO35.3716.08
Table 4. Photoactivity per mass constants under LED illumination of metal titanate nanorods ATiO3 (A = Mg, Co, Ni, Zn).
λ = 375 nm Illuminationλ = 400 nm Illumination
PhotocatalystMass (mg)Toluene Degradation (%)Photoactivity per Mass (%/mg)Mass (mg)Toluene Degradation (%)Photoactivity per Mass (%/mg)
NiTiO316.6412.513.2362.7
MgTiO313.1241.819.8281.4
CoTiO313.2292.236.4300.8
ZnTiO330.8260.84.16215.1
Publisher’s Note: MDPI stays neutral with regard to jurisdictional claims in published maps and institutional affiliations.

