Article

Assessment of the NO2 Spatio-Temporal Variability over Thessaloniki, Greece, Using MAX-DOAS Measurements and Comparison with S5P/TROPOMI Observations

by
Dimitris Karagkiozidis
1,*,
Maria-Elissavet Koukouli
1,
Alkiviadis Bais
1,
Dimitris Balis
1 and
Paraskevi Tzoumaka
2
1
Laboratory of Atmospheric Physics, Aristotle University of Thessaloniki, 54124 Thessaloniki, Greece
2
Municipality of Thessaloniki, Department of Environment, 54642 Thessaloniki, Greece
*
Author to whom correspondence should be addressed.
Appl. Sci. 2023, 13(4), 2641; https://doi.org/10.3390/app13042641
Submission received: 24 January 2023 / Revised: 13 February 2023 / Accepted: 15 February 2023 / Published: 18 February 2023
(This article belongs to the Special Issue Emerging Technologies for Air Quality Improvement)

Abstract

:
In this article, we investigate the spatio-temporal variability of tropospheric NO2 Vertical Column Densities (VCDs) and surface concentrations that were retrieved using Multi-Axis Differential Optical Absorption Spectroscopy (MAX-DOAS) measurements over Thessaloniki, Greece, for the period June 2020 to November 2022. The MAX-DOAS system captures the NO2 seasonal variability very well, reporting low concentrations during summer and higher concentrations in the winter, as well as the diurnal cycle with higher NO2 amounts in the morning followed by a reduction towards noon. The “weekend effect” is evident, with approximately 30% lower NO2 concentrations on the weekends compared to the working days. An excellent agreement is found with in situ data from a nearby air quality monitoring station with Pearson’s correlation coefficients ranging between R = 0.90 and R = 0.99. The spatial variability is assessed by comparing the NO2 concentrations at four azimuth viewing directions of the MAX-DOAS system. Despite the large variability due to short- and long-term temporal variations, higher NO2 concentrations of up to 25% (statistically significant at the 95% confidence level) are reported for the azimuth that crosses the entire city center and an urban area compared to those pointing towards the sea. The MAX-DOAS tropospheric NO2 columns are then compared to those measured by the TROPOspheric Monitoring Instrument (TROPOMI) on board the Sentinel-5P satellite. Despite the generally good correlation (R = 0.72 and R = 0.89 for the daily and monthly data, respectively), a clear underestimation of TROPOMI is found (approximately 55% in winter, 21% in spring and 40% during autumn and summer), mainly due to the much larger satellite footprint that provides a smoother perception of the NO2 concentration, while the MAX-DOAS measurements are more affected by local emissions.

1. Introduction

Atmospheric pollution and air quality are important environmental and research issues worldwide. On a global scale, nitrogen dioxide (NO2) is considered a major tropospheric gaseous pollutant in most urban and industrial environments, strongly affecting air quality and human health [1]. NO2 plays a key role in the photochemistry of the troposphere [2], acting as a precursor in the formation of tropospheric ozone (O3) and, hence, it indirectly affects the radiative forcing of the atmosphere [3]. In the boundary layer, NO2 is a short-lived pollutant that is mainly produced by the oxidation of nitrogen monoxide (NO), and it is emitted in the troposphere as a result of both natural and anthropogenic processes. The primary natural sources are soil emissions and lightning, while the main anthropogenic sources include biomass burning and fossil fuel combustion from domestic heating sources and motor vehicles [4,5]. Given the influence of NO2 on atmospheric pollution and air quality, the importance for its accurate detection, the determination of its emission sources and the investigation of its spatio-temporal variability is self-evident. Thus, continuous monitoring of NO2 concentrations has been widely performed over the past few decades using both ground-based measurements and satellite observations. Over Thessaloniki, Greece, air quality monitoring and trace gas measurements are primarily performed by ground-based in situ instruments, with some of them reporting to the European Environmental Agency [6]. These continuous in situ measurements provide valuable information on various atmospheric pollutants (including NO2) at fixed sampling stations, but their limited number does not allow a representative spatial coverage over the area of Thessaloniki. Furthermore, most of the stations have their sampling inlets installed close to the ground (a few meters above the surface) and are consequently mostly affected by local traffic emissions. Thus, these measurements are usually not representative of the average pollution levels in the local boundary layer and, moreover, they cannot provide information for the pollutants’ vertical distribution.
Ground-based Multi Axis Differential Optical Absorption Spectroscopy (MAX-DOAS) is a remote sensing measurement technique for the detection of aerosols and trace gases in the troposphere that represents a significant enhancement of the well-established zenith scattered sunlight DOAS instruments, which are mainly sensitive to stratospheric absorbers [7]. MAX-DOAS systems have been further developed during the past few decades and are widely used for the retrieval of tropospheric trace gas concentrations with characteristic narrowband absorption structures in the ultraviolet (UV) and visible ranges [8,9,10,11,12]. MAX-DOAS is based on the analysis of scattered radiation spectra measured at multiple elevation viewing directions using the differential optical absorption spectroscopy (DOAS) technique [13]. MAX-DOAS measurements are highly sensitive to various absorbers, such as NO2, HCHO, H2O, BrO, CHOCHO and SO2 in the lowest few kilometers of the atmosphere. Information about the vertical distribution of a trace gas can be obtained from a single elevation scan by applying proper inverse modeling approaches that combine the measurements with Radiative Transfer Model (RTM) simulations (e.g., [14,15,16,17]). The capability of retrieving trace gas vertical profiles, vertical column densities and surface concentrations with a generally high accuracy and temporal resolution makes the MAX-DOAS systems essential for air quality monitoring, supplementing point measurements of in situ instruments and satellite observations. Ground-based MAX-DOAS systems have been used in numerous recent publications for the assessment of air pollution, especially in urban environments, and for understanding of the physical and chemical processes in the boundary layer (e.g., [18,19]). Additionally, data derived from MAX-DOAS instruments are widely used for comparison and validation of multiple satellite products, including tropospheric NO2 (e.g., [20,21,22]).
Even though ground-based MAX-DOAS is a well-established remote sensing technique for the determination of trace gas concentration levels in the troposphere and the application of such instruments to air quality monitoring is widespread, the sparsity of such systems on a global scale inhibits large-scale monitoring of NO2. Satellite instruments do not suffer from this limitation; they provide daily global coverage and, thus, their importance to air quality, climate change and understanding of the dynamics in the boundary layer is widely recognized. Satellite observations contribute to the continuous monitoring of NO2 on both regional and global scales, estimation of NOx emission sources and provide valuable information for the understanding of NO2 transport phenomena. Over the past decades, NO2 has been continuously monitored from space by multiple satellite instruments, such as the Global Ozone Monitoring Experiment (GOME) on ERS-2 [23], Scanning Imaging Absorption SpectroMeter for Atmospheric CHartographY (SCIAMACHY) on ENVISAT [24], Ozone Monitoring Instrument (OMI) on EOS-Aura [25], Global Ozone Monitoring Experiment-2 (GOME-2) on MetOp A, B and C platforms [26] and, most recently, since October 2017 from the TROPOspheric Monitoring Instrument (TROPOMI) on board Sentinel-5 Precursor (S5P) [27]. The S5P/TROPOMI NO2 observations have already demonstrated their monitoring capabilities in various air quality-related fields, such as estimating NOx emissions at the urban scale [28,29] and evaluating the effect of the recent COVID-19 pandemic on NO2 levels [30,31], while an extensive validation against global ground-based measurements has been presented in [22]. The main disadvantages of such satellite instruments are their low temporal sampling with one or two overpasses per day at any given location, which does not allow the observation of diurnal cycles, as well as their coarse spatial resolution. With respect to the spatial sampling, the pixel size of the space borne instruments has been greatly improved, initially starting from several hundreds of kilometers (40 × 320 km2 for GOME) to a few kilometers (13 × 24 km2 for OMI) and currently to 3.5 × 5.5 km2 for TROPOMI. This improvement, joined by the continuous efforts in improving the NO2 data quality by updating the retrieval algorithms of S5P/TROPOMI, highly increases the usability of this dataset in numerous different scientific and research fields.
The main aims of this study are to assess the ability of the MAX-DOAS measurements to monitor the air quality in Thessaloniki in terms of tropospheric NO2 by comparison with in situ data, and to validate the corresponding S5P/TROPOMI product, accounting also for the spatial features detected by the MAX-DOAS. By establishing the linkages among the three different sources of information on NO2 in the area, we will set the scene for a future synergistic use of these datasets to achieve a more comprehensive characterization of NO2 in Thessaloniki.
This article is structured as follows: In Section 2, a description is given for the instruments and data that are used in this study. In Section 3, the results of the NO2 spatio-temporal variability using MAX-DOAS observations are presented along with comparisons with in situ measurements. In Section 4, the comparison and validation of S5P/TROPOMI observations using ground-based MAX-DOAS data from Thessaloniki are discussed, and in Section 5 the main conclusions of this study are summarized.

2. Data and Methodology

2.1. MAX-DOAS Observations

Monitoring of trace gases in the troposphere is routinely performed at the Laboratory of Atmospheric Physics (40.634° N, 22.956° E, 60 m above sea level), in the Aristotle University of Thessaloniki (LAP.AUTH), Greece, by multiple MAX-DOAS instruments. These systems have participated in various intercomparison and validation campaigns, such as the Cabauw Intercomparison of Nitrogen Dioxide Measuring Instruments 2 (CINDI-2, http://www.tropomi.eu/data-products/cindi-2/, accessed on 20 January 2023) and the TROpomi vaLIdation eXperiment 2019 (TROLIX’19, https://ruisdael-observatory.nl/trolix19-tropomi-validation-experiment-2019/, accessed on 20 January 2023), and they contribute data to global projects and networks, e.g., the Fiducial Reference Measurements for Ground-Based DOAS Air-Quality Observations (FRM4DOAS, https://frm4doas.aeronomie.be/, accessed on 20 January 2023), the Quality Assurance for Essential Climate Variables (QA4ECV, http://www.qa4ecv.eu/, accessed on 20 January 2023) and the Network for Detection of Atmospheric Composition Change (NDACC, https://ndacc.larc.nasa.gov/, accessed on 20 January 2023). The measurement site is located in an urban, moderately polluted environment, at the center of the city of Thessaloniki. The MAX-DOAS instruments have been gradually upgraded over the past decade by making changes to their design, using newer and improved spectrographs and by updating the operating software. Additionally, the processing and calibration of the recorded spectra have been further developed in order to increase their accuracy, improve their stability over time and provide data of higher quality.
In this study, the spatio-temporal variability of NO2 over Thessaloniki is assessed by analyzing spectra recorded by a 2D MAX-DOAS system, Phaethon, which operates at LAP.AUTH since June 2020, using the DOAS technique. The entrance optics of the instrument are mounted on a two-axis tracker that allows for a full azimuthal and elevation rotation (0–360°). The system is configured to perform elevation scans, from the zenith to near the horizon, at different azimuth directions in the southern sector, as illustrated in Figure 1, since the other azimuths are partly or fully blocked by buildings of the city and the university campus. The elevation scans consist of measurements of scattered radiation spectra at the elevation angles of 30, 15, 12, 10, 8, 6, 5, 4, 3, 2 and 1°, with about 1 min integration time per angle, in addition to a zenith-sky measurement (90°) prior to each scan that is used as a reference Fraunhofer spectrum (FRS) for the determination of the trace gas differential Slant Column Densities (dSCDs). The recorded spectra are analyzed using the QDOAS (version 3.2, September 2017) software that is developed by BIRA-IASB (https://uv-vis.aeronomie.be/software/QDOAS/, accessed on 20 January 2023). The NO2 dSCDs are retrieved in the visible range, using the spectral fitting window 425–490 nm, following the recommendations from the CINDI-2 campaign [32]. Along with the NO2 cross-sections at 298 K and 220 K [33], the following trace gas cross-sections are included in the DOAS analysis: O3 at 223 K [34], O4 at 293 K [35] and H2O at 296 K [36]. A ring spectrum, calculated by QDOAS according to [37], was also included, and a fifth-order polynomial is used to remove the broadband spectral features. The MAX-DOAS system performs elevation scans at four different azimuth viewing directions, i.e., at 142° (SE), 185° (S), 220° (SW) and 255° (W) (Figure 1). The two former directions (SE and S) cross the city center and point to urban and suburban areas, while the other two directions (SW and W) cross a small portion of the city (about 1 km) and point towards the sea. The NO2 vertical profile for each elevation scan is retrieved by applying the Mexican MAX-DOAS Fit (MMF) v2020_04 [38] inversion algorithm on the measured dSCDs, which is based on the Optimal Estimation Method (OEM). The NO2 Vertical Column Densities (VCDs) are calculated by integrating the retrieved vertical profiles, while the “surface concentration” is the average concentration of the lowermost 200 m of the troposphere. MMF includes a quality flagging algorithm that is based on multiple criteria, and, in this study, the data that are flagged as erroneous were discarded from the analysis. In [39], more details are given about the instrumentation, the settings that are used for the retrieval of NO2 dSCDs and the input parameters for the inversion algorithm that is applied for the retrieval of NO2 vertical profiles.

2.2. S5P/TROPOMI

The TROPOMI satellite instrument is a nadir-viewing imaging spectrometer that is mounted on the Sentinel-5 Precursor (S5P) platform. S5P was launched on 13 October 2017 and flies in a sun-synchronous orbit with a local overpass time at approximately 13:30 local time. TROPOMI covers a large wavelength range that extends from the UV to the shortwave infrared and provides daily global coverage. The main objective of the Copernicus Sentinel-5P mission is to perform atmospheric measurements with high spatial resolution around the globe. The initial, already high, spatial resolution of TROPOMI was 3.5 × 7 km2 and from 6 August 2019 it was further improved to 3.5 × 5.5 km2. The NO2 data are continuously validated by the Mission Performance Center Validation Data Analysis Facility (MPC VDAF, http://mpc-vdaf.tropomi.eu/, accessed on 20 January 2023). In this study, we used the v2.2 S5P/TROPOMI NO2 tropospheric vertical column density dataset that is publicly available via the ESA Sentinel-5P Product Algorithm Laboratory (S5P-PAL) containing modified Copernicus Sentinel data processed by S[&]T (https://data-portal.s5p-pal.com/products/no2.html, accessed on 20 January 2023). The overpass data for Thessaloniki cover the period from June 2020 to November 2022. Since clouds have a very strong impact on the column retrievals of all species (including NO2), we filtered the TROPOMI data with a quality assurance value (qa_value) > 0.99, a criterion that filters out cloudy pixels for a cloud fraction > 20%. This strict filtering choice was made in order to ensure that all measurements under cloudy conditions were discarded from the analysis, even though the recommendation from the TROPOMI Algorithm Theoretical Basis Document (ATBD) of the tropospheric NO2 data products (http://www.tropomi.eu/data-products/nitrogen-dioxide, accessed on 20 January 2023) is to filter the data with a qa_value > 0.75. We opted for the strict filtering since cloud presence is relatively less frequent in Thessaloniki and thus during the period of study the satellite sampling and the number of collocated TROPOMI and MAX-DOAS measurements was large enough to provide statistically robust comparison and validation results. The NO2 concentration levels in Thessaloniki are mainly due to local NOx emission sources, especially within the city center [40,41,42,43], where the MAX-DOAS system is installed. The relatively larger satellite footprint compared to the MAX-DOAS geometry would mainly result in a smoother perception of the NO2 concentration. Hence, the TROPOMI tropospheric NO2 column data are spatially averaged within 5 km from the overpass location.

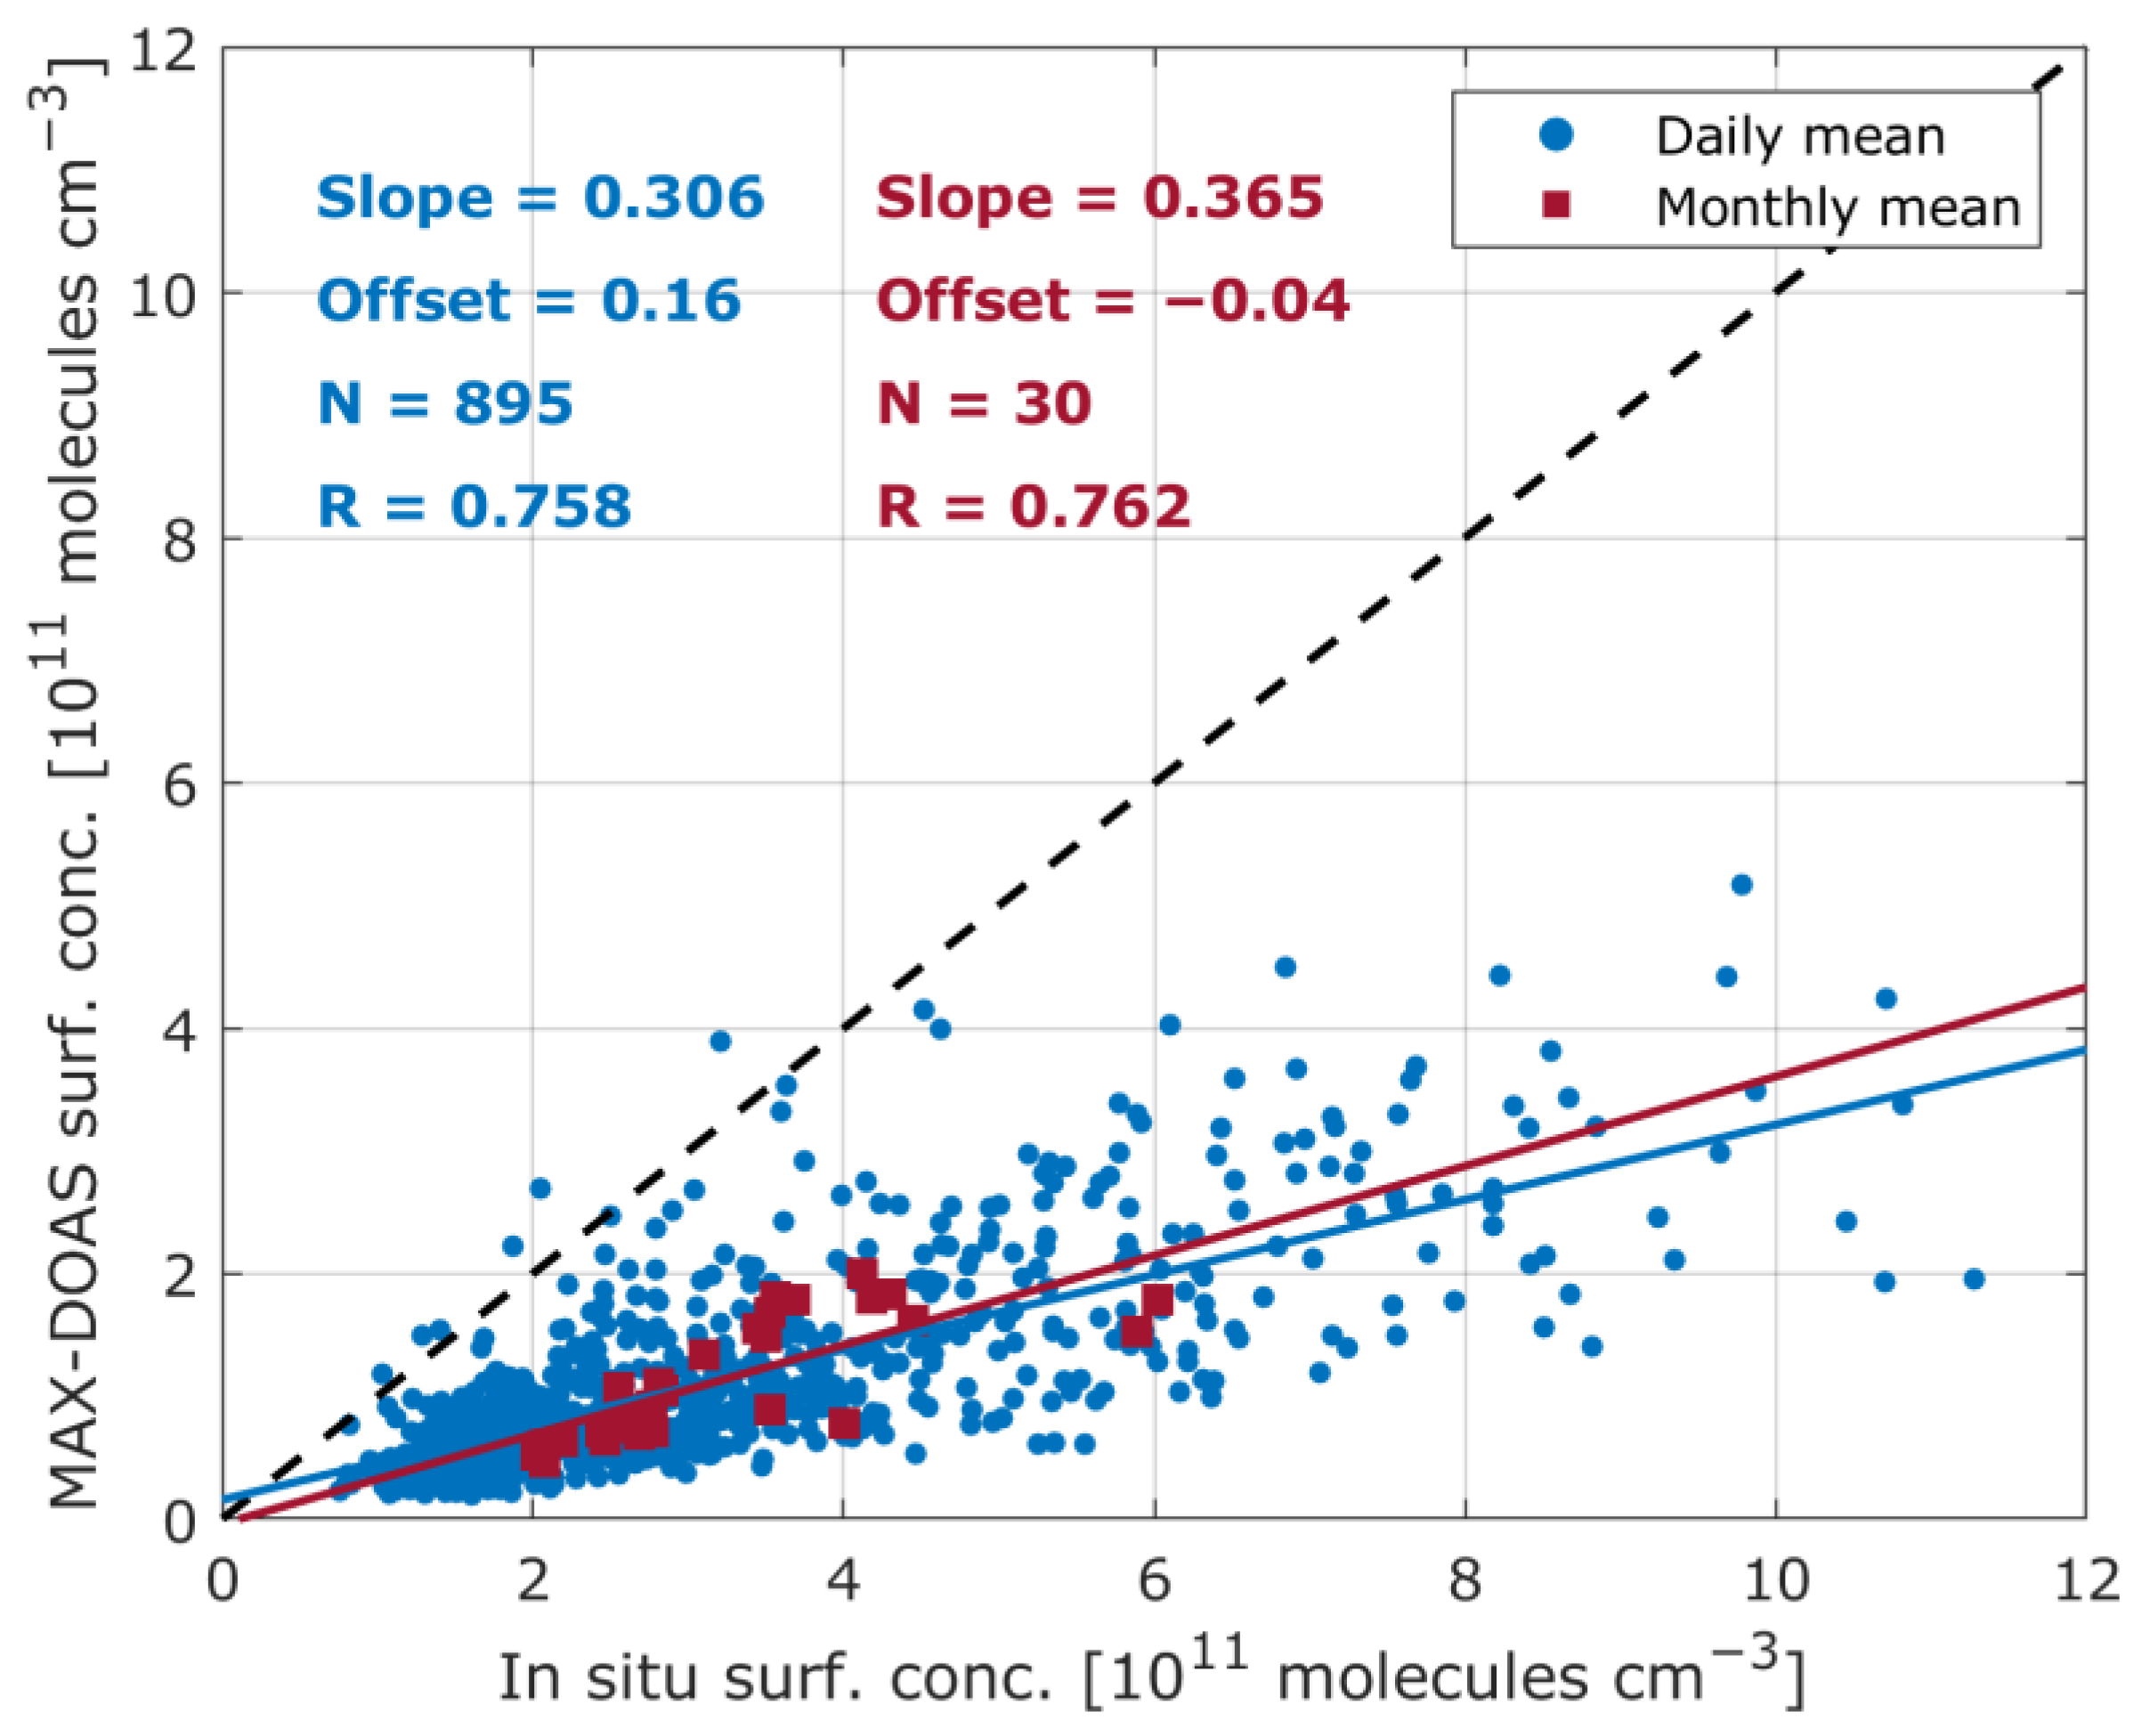
2.3. In Situ Measurements

NO2 concentrations near the surface are routinely monitored in Thessaloniki by in situ chemiluminescence analyzers that are administrated by the Network for Air Quality Monitoring of the Municipality of Thessaloniki (http://www.envdimosthes.gr, accessed on 20 January 2023). The main advantage of in situ instruments compared to remote sensing systems, such as the MAX-DOAS, is their relatively lower procurement cost and their ability to measure NO2 concentrations continuously (also at nighttime) and irrespective of weather conditions, while the MAX-DOAS requires sunlight and thus its operation is limited to daytime. The highest temporal resolution of the in situ data that are publicly available is hourly averaged concentrations. The MAX-DOAS-derived diurnal and weekly cycles of the surface NO2 concentrations are compared with in situ data measured in a background urban environment (40.644° N, 22.957° E, 174 m above sea level) (Figure 1). As described in [39], this particular site is selected because it is less affected by local NOx traffic emissions and the reported data are considered more representative of the average NO2 concentrations in the local boundary layer. The in situ dataset that is used in this study spans from 1 June 2020 to 30 November 2022 with very few gaps in the time series due to maintenance of the instrumentation.

3. Results and Discussion

In this study the MAX-DOAS tropospheric NO2 vertical columns, referred to hereafter as NO2 VCDs, are calculated by integrating the NO2 vertical profiles, retrieved by the inversion algorithm (MMF) which is applied to the dSCDs. The NO2 VCDs can also be derived by applying either the geometrical approximation [7] to the dSCDs measured at 30 or 15° elevation angles or to a mix of them, or by using proper differential Air Mass Factors (dAMFs), calculated by RTM simulations (e.g., [20]). In any case, the NO2 vertical columns are a good indicator of the pollution levels around a measurement site; however, when inversion techniques are applied, additional information can be retrieved for the concentration levels near the surface, which is essential especially in the context of air quality monitoring. In this section, the temporal and spatial variability of NO2 VCDs and surface concentrations using MAX-DOAS observations is discussed. The temporal variability is assessed by calculating seasonal (Section 3.1), diurnal (Section 3.2) and weekly cycles (Section 3.3) for different seasons, which are compared with the in situ data. The spatial NO2 variations are investigated (Section 3.4) by comparing the concentration levels at the four azimuth viewing directions for two different time periods during the day.

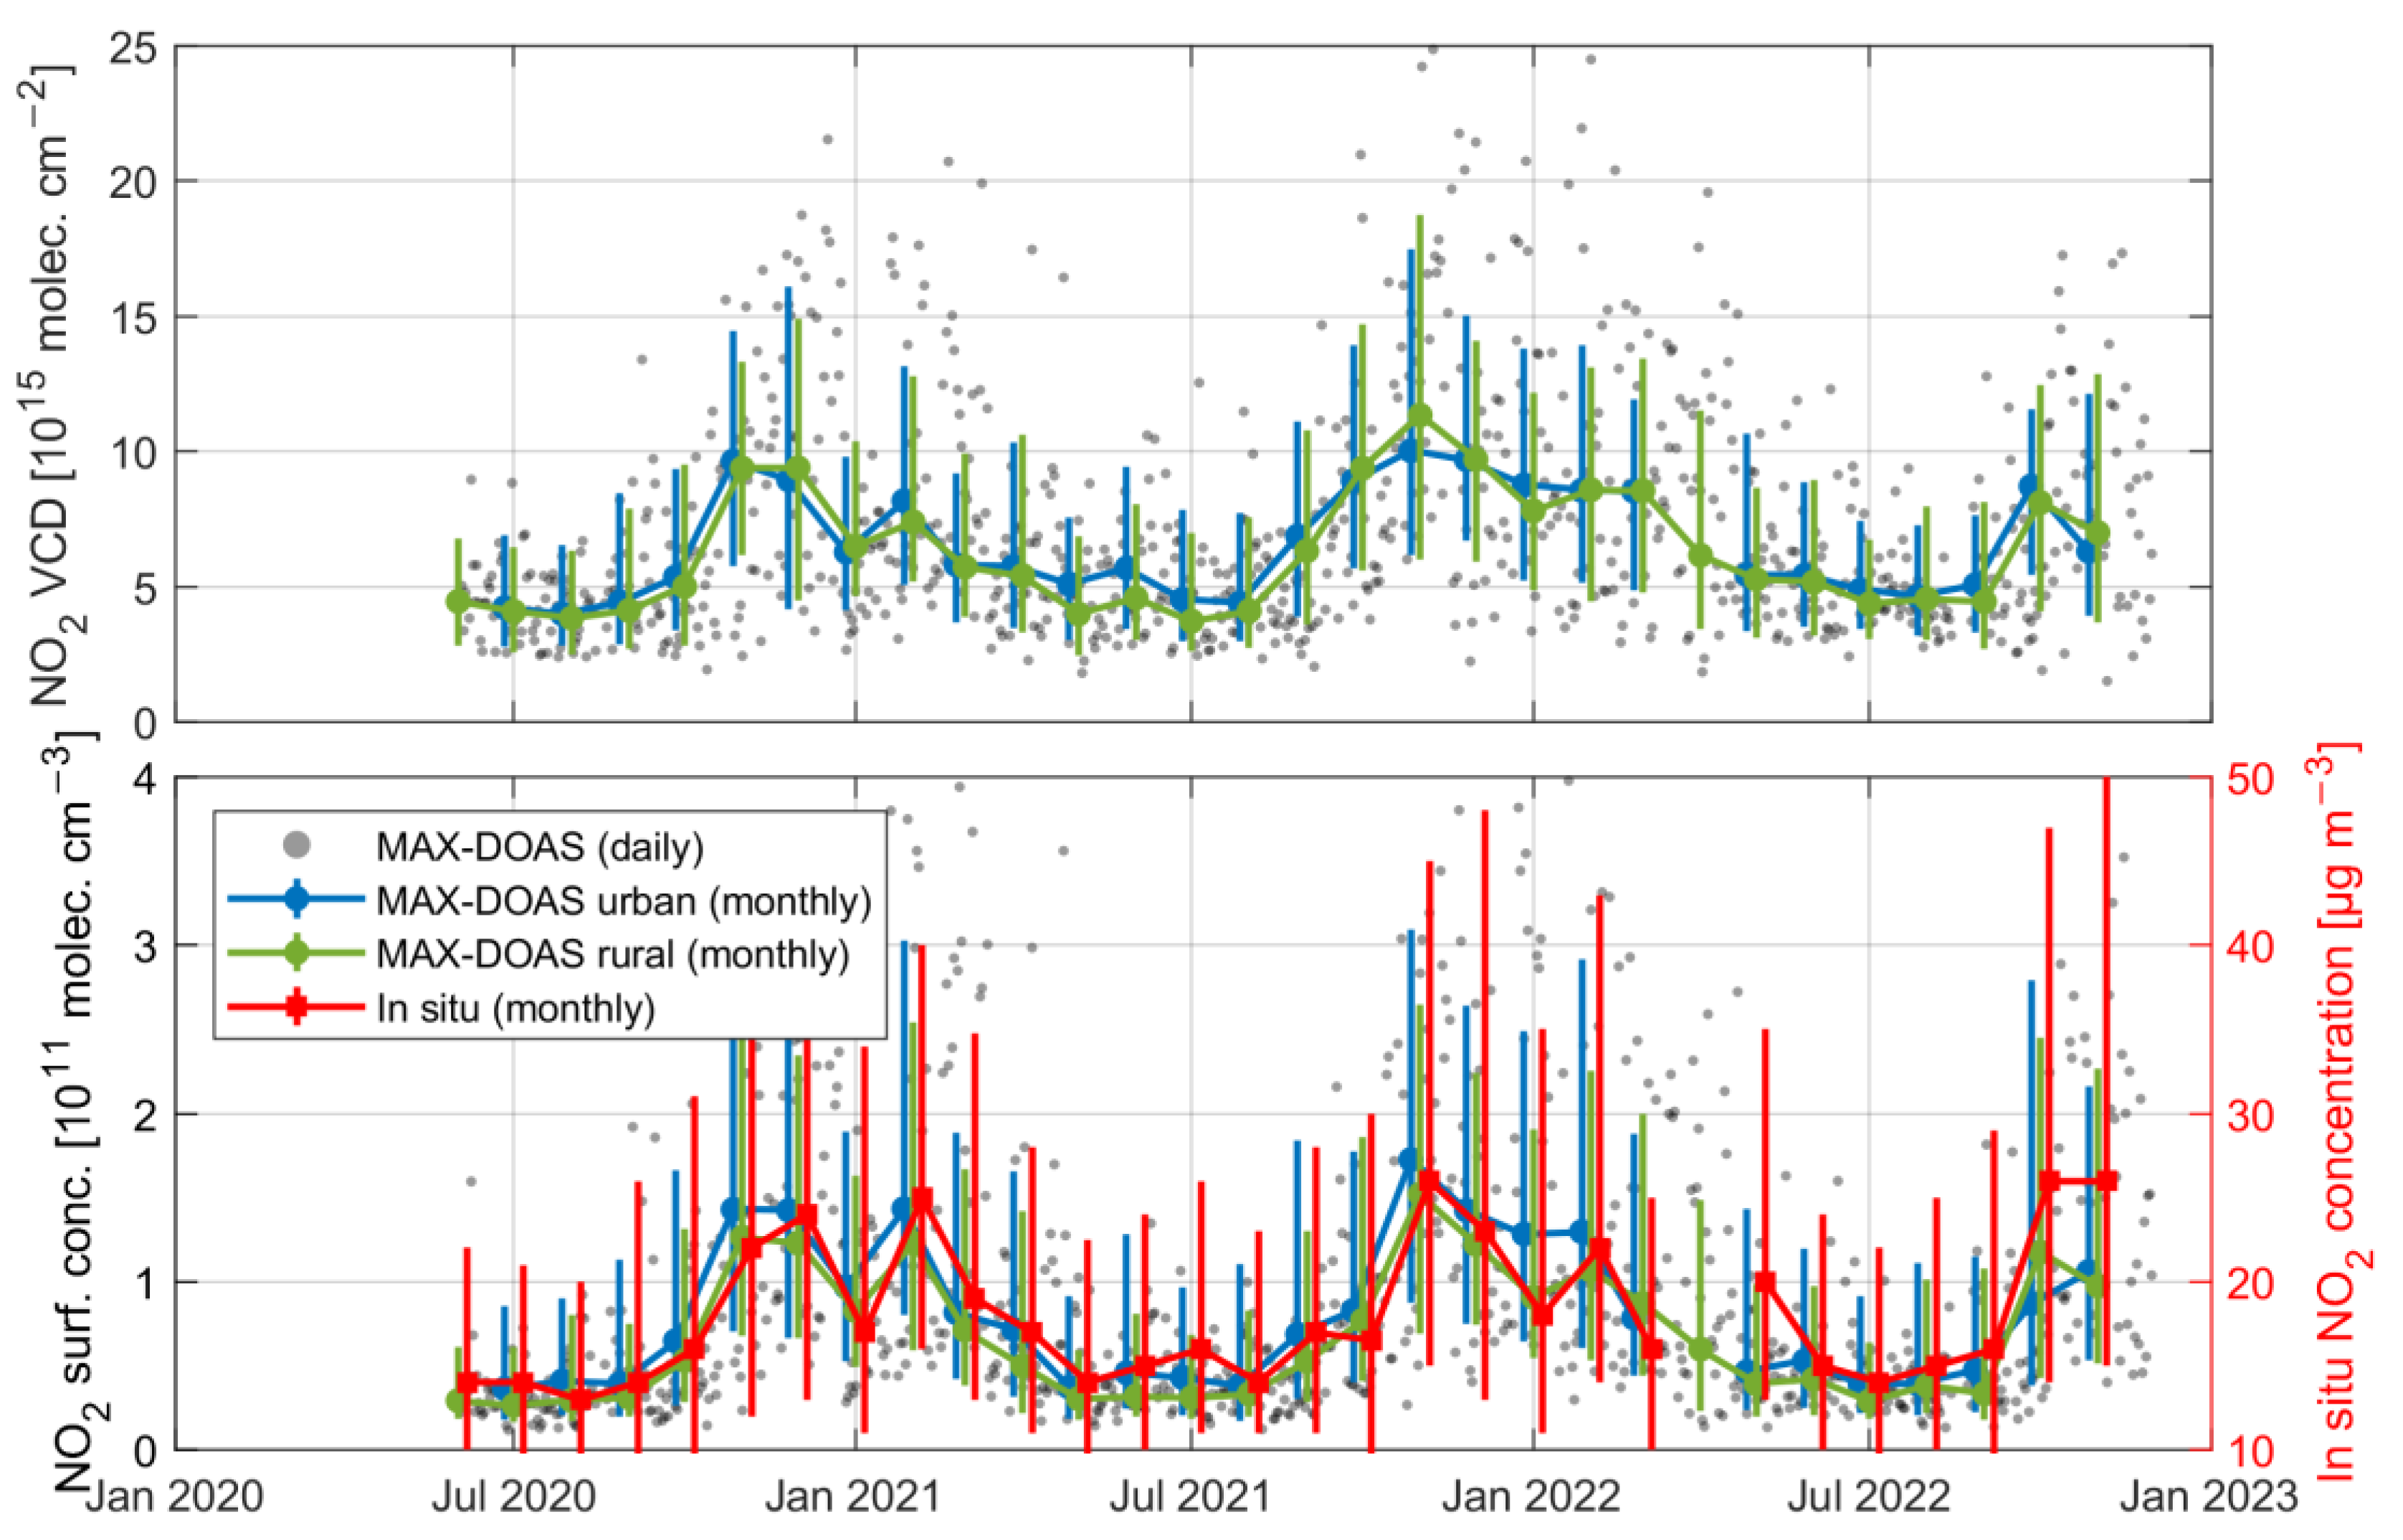
3.1. Seasonal Variability
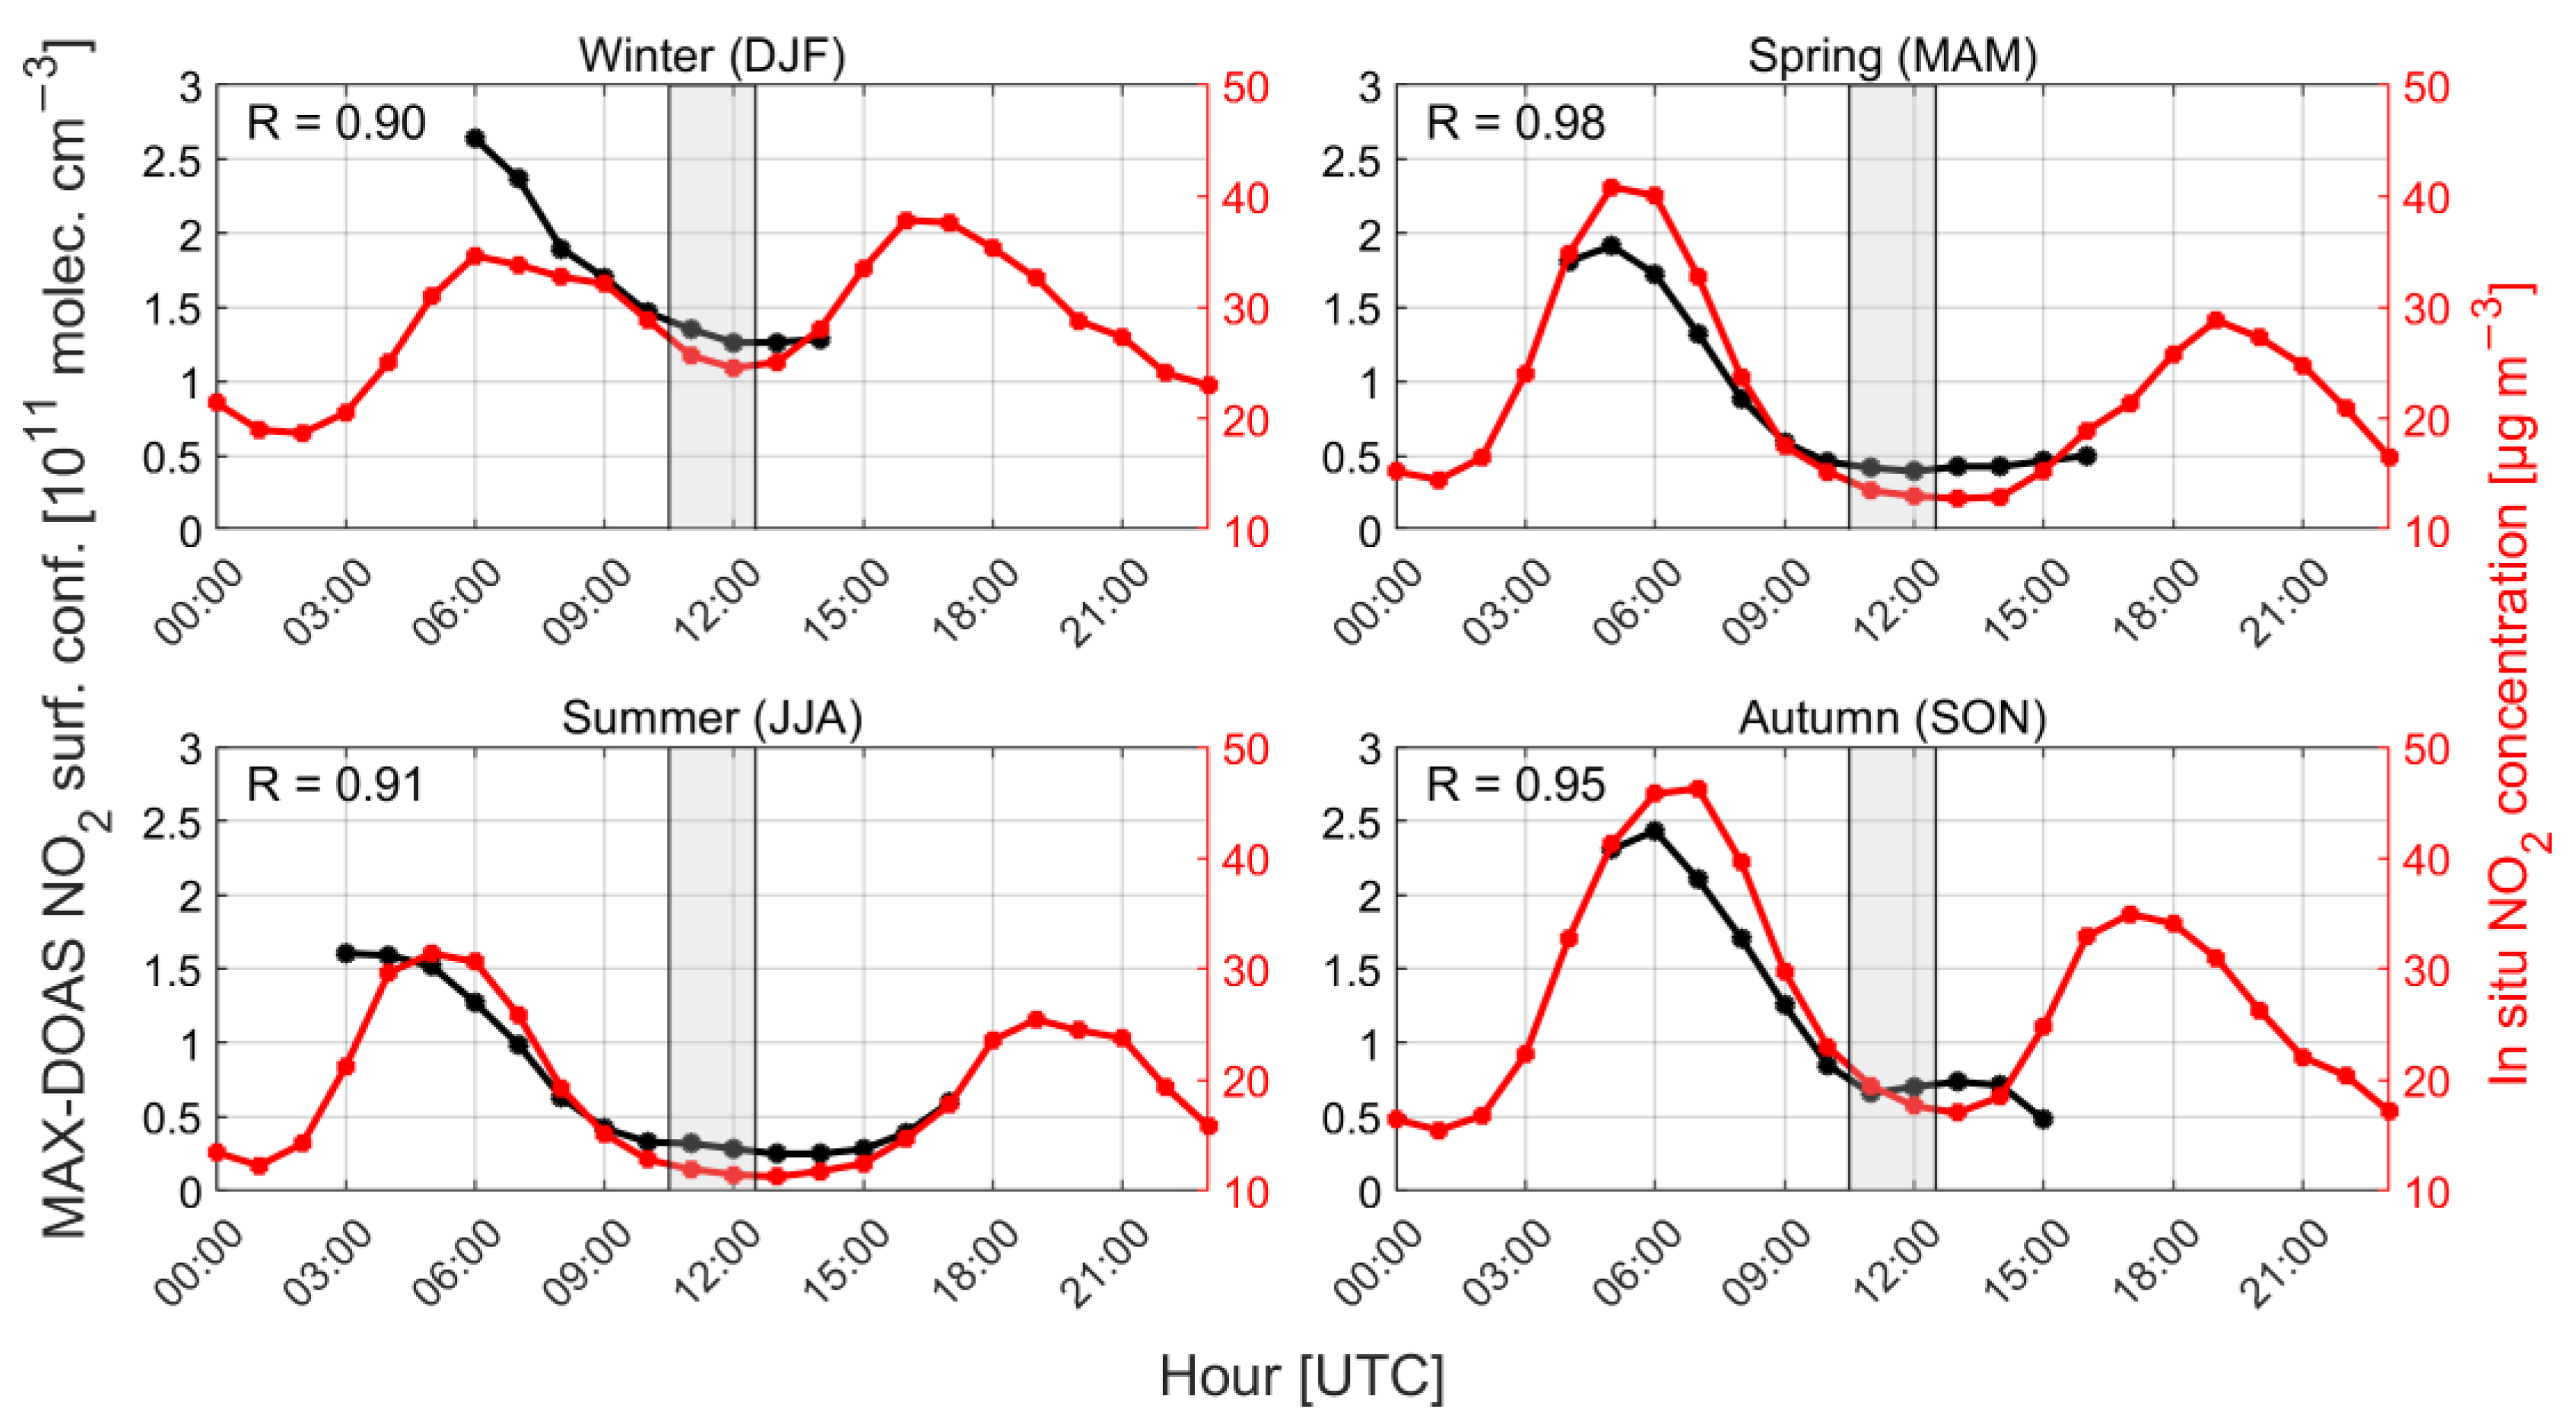
Figure 2 shows the time series of the daily and monthly median NO2 VCDs (upper panel) and the corresponding surface concentrations (bottom panel) retrieved by the MAX-DOAS for the period of study. The data are aggregated separately for the urban (SE and S) and rural (W and SW) azimuths (blue and green lines with markers, respectively). The gray dots represent the MAX-DOAS daily median values, while the red line with markers indicates the monthly median values, derived from the in situ instrument. The in situ NO2 time series is plotted against the MAX-DOAS surface NO2 concentrations only, in order to compare meaningful quantities. The error bars of the monthly median values indicate the monthly variability as the interquartile range (IQR), i.e., the difference between the 75th and 25th percentiles. In June 2020 and April 2022, the MAX-DOAS was configured to record spectra only in the SW direction and thus measurements pointing towards urban areas are not available during these months.
Here, and in the following sections, the MAX-DOAS and in situ surface concentrations are presented in different axes (due to their different units) to demonstrate the co-variability of the two datasets since a quantitative comparison between the two systems is beyond the scope of this study. It also follows that since these two time series are not temporally synchronized, even though both medians represent the daylight measurements, the monthly median NO2 concentrations have not necessarily been derived by measurements acquired at the same time intervals during each day. In this work, we mainly aim to conduct a qualitative comparison and investigate whether similar temporal NO2 variation patterns are captured by the two instruments, indicating that they can equally contribute to air quality monitoring. In a previous study covering a shorter time period [39], a direct 1:1 comparison between MAX-DOAS and in situ NO2 hourly mean concentrations showed that the MAX-DOAS was low-biased by ~55–60%. This was attributed to the fact that the MAX-DOAS probes air masses along the line of sight of a few kilometers, while the air quality station measurements are conducted in situ. A similar comparison of the daily and monthly mean surface concentrations for the whole time period can be found in Appendix A.
The NO2 VCDs and surface concentrations show a similar seasonal cycle, i.e., lower values during summer and higher values during winter. Similar results using MAX-DOAS measurements in urban environments have been reported for other locations (e.g., [18,44,45,46]). In urban environments, NO2 is mainly distributed in the lowermost troposphere, usually within the first kilometer, since its emission sources are mainly located close to the ground (e.g., road transport emissions). Thus, the NO2 VCDs are mostly affected by the concentration levels in the lowermost layers of the troposphere and hence the vertical columns and surface concentrations are expected to reveal similar patterns. The seasonal NO2 variability captured for the urban and rural azimuths is similar for the whole period, with average differences (rural–urban) of about −5% for the VCDs and −18% for the surface concentrations. However, shorter-term temporal variations are masked in monthly values, and as it will be discussed later in Section 3.4, differences between azimuths can be larger when shorter time intervals are considered. The seasonal cycles of the surface concentrations retrieved by the in situ and the MAX-DOAS measurements are in very good agreement. The lower NO2 levels during all summer periods, the significant reduction in January 2021 and the peaks during the cold periods (e.g., November, December 2020; February, November 2021; and October, November 2022) are well captured by both instruments. The median NO2 VCD for the period of study retrieved by the MAX-DOAS is 5.94 ± 4.90 × 10¹⁵ molecules/cm2 and the median NO2 surface concentration is 0.61 ± 0.83 × 10¹¹ molecules/cm3. The lowermost monthly median VCDs and surface concentrations were reported in July 2020 (4.16 × 10¹⁵ molecules/cm2 and 0.31 × 10¹¹ molecules/cm3, respectively), while the highest were found in November 2021 (10.73 × 10¹⁵ molecules/cm2 and 1.61 × 10¹¹ molecules/cm3, respectively). The monthly variability (i.e., the interquartile range), presented by the error bars, is significant, reaching maximum values in November 2021. The monthly variability captured by the in situ data is even larger, since the site is affected more by local emissions. The monthly median of the in situ data in May 2022 was unusually high, affected by days that were characterized by extreme NO2 levels, probably due to very local events and activities that could not be captured by the MAX-DOAS. The relatively lower NO2 concentrations that were reported by both systems during summer are related to the reduced emission sources (e.g., absence of domestic heating) and to the shorter lifetime of NO2 caused by the enhanced photolysis rate due to stronger solar radiation.

3.2. Diurnal Cycles

In the boundary layer, NO2 is a short-lived product, with typical lifetime of a few hours, depending on the season [47], and, as a result, the NO2 amounts are expected to be highly variable during the day. The diurnal variability of the NO2 surface concentrations retrieved by the MAX-DOAS and the in situ instrument for all seasons is presented in Figure 3, in order to evaluate the performance of the instruments under different pollution levels and to investigate their diurnal cycles in more detail. The seasonal hourly mean NO2 concentrations were calculated when at least 100 measurements were available. In this section (and also in Section 3.3), all azimuth viewing directions of the MAX-DOAS (Figure 1) were included in the calculation of the means.
The in situ instrument reports NO2 concentrations throughout the day (and also during the night), while the MAX-DOAS can only operate when solar scattered radiation is present. Thus, the secondary NO2 peak that is evident in the in situ data at ~16:00–17:00 UTC during autumn and winter and at ~19:00–20:00 UTC during spring and summer cannot be revealed by the MAX-DOAS. However, both instruments show very similar diurnal cycles for all seasons. The Pearson’s correlation coefficients (R) for the two datasets are displayed in the plots and they range from 0.90 during winter to 0.98 during spring, indicating that the two systems can equally contribute to air quality monitoring.
The early morning NO2 peak (~1.9–2.6 × 10¹¹ molecules/cm3 in winter, spring and autumn) in the MAX-DOAS data that is found during the rush hours (i.e., between ~04:00 and 06:00 UTC) is due to the increased morning traffic emissions and to the accumulated NO2 in the boundary layer during the night. This morning peak is reduced by 25–30% during summer (reaching ~1.61 × 10¹¹ molecules/cm3). Afterwards, the NO2 concentrations rapidly drop as a result of enhanced consumption processes (photochemical destruction). The reduction is stronger and faster in summer and spring due to increased solar radiation. The NO2 surface concentrations reach minimum values for all seasons between ~11:00 and 13:00 UTC (approximately 0.25 and 1.25 × 10¹¹ molecules/cm3 in summer and winter, respectively), when the sun is high, leading to an increased photolysis rate in addition to the reduced traffic-related emissions. In the afternoon and evening, the photolysis rate weakens and NO2 begins to accumulate, leading to the secondary peak as mentioned already. This afternoon increase is only marginally captured by the MAX-DOAS during winter and summer due to the lack of sunlight and, hence, observations. The high NO2 concentrations that were reported in the morning by both instruments and at night by the in situ instrument only are also attributed to the shallow boundary layer due to the absence of solar radiation and the lower air temperatures. Especially during winter, when the boundary layer height in Thessaloniki reaches minimum values [48], the vertical displacement of ~100 m of the two sites is no longer negligible. In this case, even though a very good correlation is found (R = 0.9), the MAX-DOAS reports higher morning surface NO2 concentrations than in the other seasons, with a higher reduction rate between 06:00 to 09:00 UTC compared to the in situ instrument.

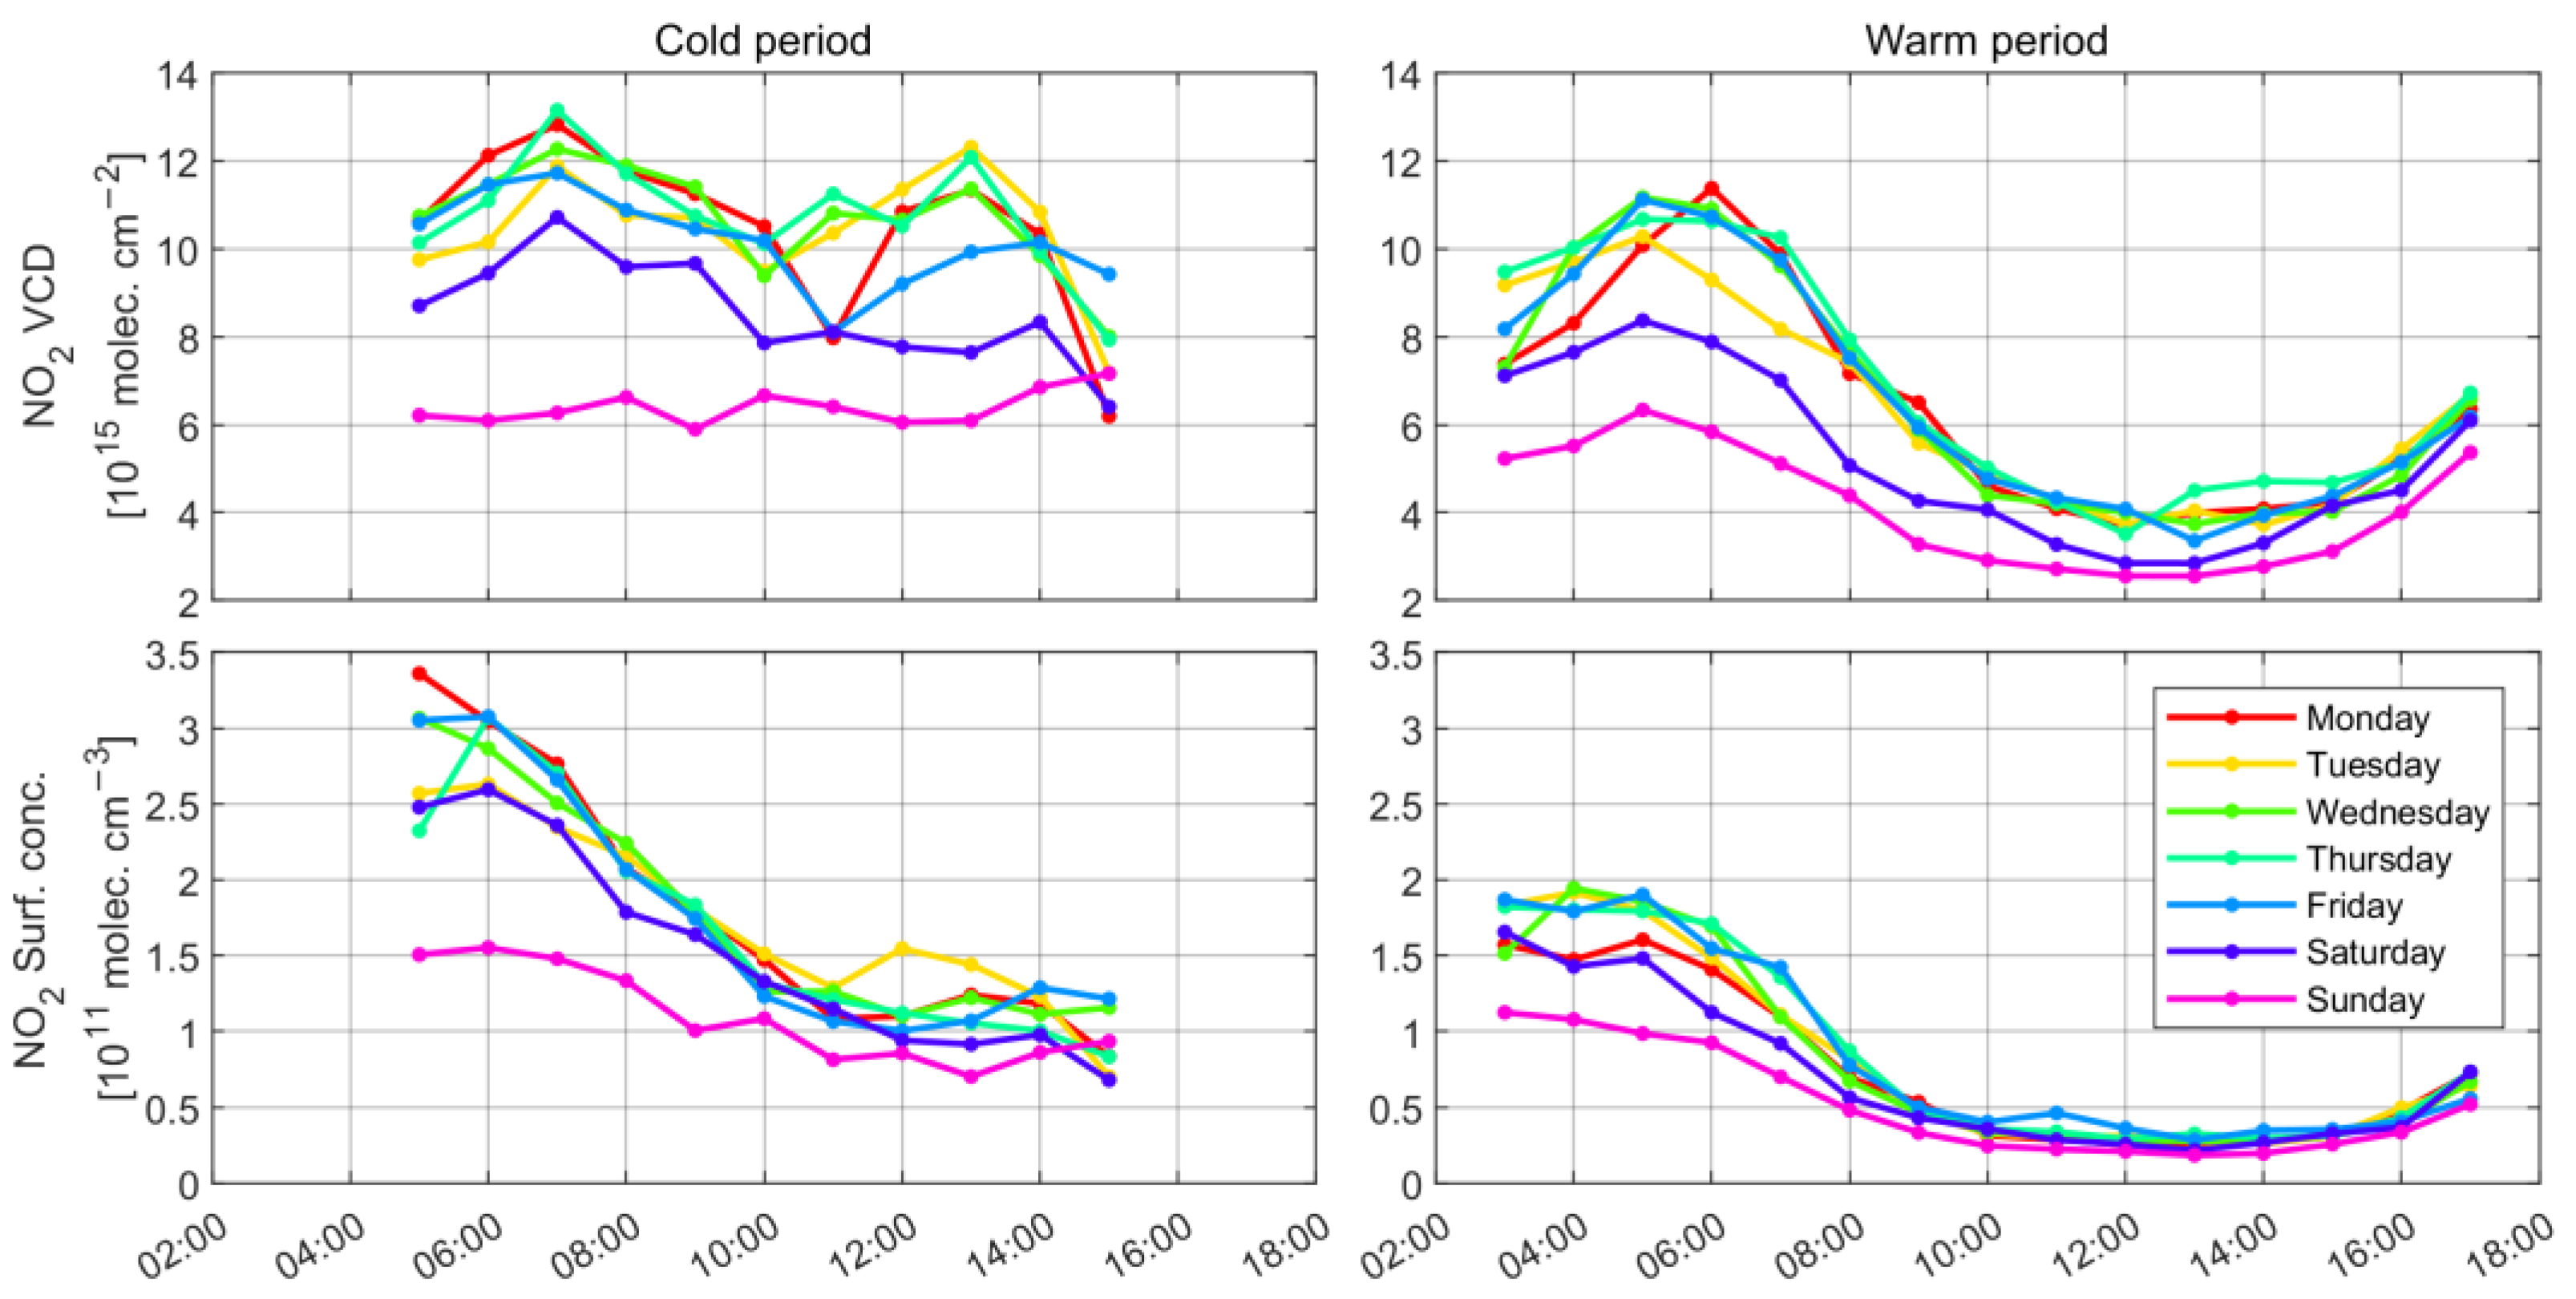
3.3. Day of the Week Variability

NO2 is emitted in the troposphere by anthropogenic activities (e.g., industrial and road transport emission sources) that usually follow a weekly cycle. Normally, such activities are enhanced during the working days, and they are significantly reduced at weekends, leading to strong weekday-to-weekend variations of NO2 concentrations in urban environments, a phenomenon that is known as the “weekend effect”. The weekend effect has been investigated in the past using both ground-based MAX-DOAS data (e.g., [18,19,42,49,50]) and satellite observations (e.g., [51,52,53]). In these studies, a significant reduction of the NO2 concentration in weekends is reported, with a clear Sunday minimum of up to 50% compared to the working days. Here, we investigate the day of week variability of NO2 surface concentrations in Thessaloniki using MAX-DOAS observations and in situ measurements for comparison. Figure 4 shows the average weekly cycles of NO2 surface concentrations for all seasons measured by both instruments.
The two datasets reveal similar weekly patterns with Pearson’s correlation coefficients that range between 0.93 (in spring) and 0.99 (in autumn). The weekend effect for all seasons is investigated by comparing the mean NO2 surface concentrations on the weekends (Saturday and Sunday) and the traditional resting day of Sunday alone with the mean concentration during the working days (Monday to Friday). Significantly lower NO2 concentrations are found for both datasets during weekends for all seasons, i.e., the MAX-DOAS (in situ) reports a reduction of 19% (18%) in winter, 29% (31%) in spring, 30% (28%) in summer and 30% (27%) in autumn. The reduction rate is even larger on Sundays, i.e., 30% (29%) in winter, 37% (40%) in spring, 40% (39%) in summer and 43% (41%) in autumn. The two systems reveal that the weekend effect is more evident during the warm period and less distinct in winter. The stronger reduction in the warm period is associated with the shorter atmospheric lifetime of NO2, due to higher photochemical destruction rates, resulting in less accumulation in the working days. Additionally, the expansion of the boundary layer to higher altitudes in summer due to stronger solar radiation allows for a greater dispersion of NO2, leading to lower concentrations at the lowermost layers compared with the cold period. A reduction of the NO2 vertical column with increasing boundary layer height in Thessaloniki, especially during summer, was also found by [43] using MAX-DOAS measurements and chemical transport model simulations.
Figure 5 shows the diurnal variation of tropospheric NO2 VCDs (top row) and surface concentrations (bottom row) in a weekly cycle retrieved by the MAX-DOAS over Thessaloniki for each day of the week. The analysis was conducted separately for the cold period (October–February, left column) and the warm period (May–September, right column). The variability of the NO2 levels in Thessaloniki from Monday to Friday is not very pronounced; however, the weekend effect is strong for both time periods.
On Saturdays (dark blue line in Figure 5), the NO2 amounts are generally lower than on the working days but are of comparable magnitude in the early morning and late afternoon. The strongest reduction of the NO2 vertical column and surface concentrations is found on Sundays (purple line in Figure 5) throughout the day. This is mainly related to the decreased human activities on the resting day and especially to the absence of NOx emissions from heavy road transport to and from work. As already discussed in Section 3.2, the diurnal variability patterns of tropospheric NO2 are rather different for the two time periods, mainly due to different NOx emission strengths and the lifetime of NO2 in the troposphere, in addition to the different boundary layer structure that has a strong effect on the accumulation and dispersion of NO2.

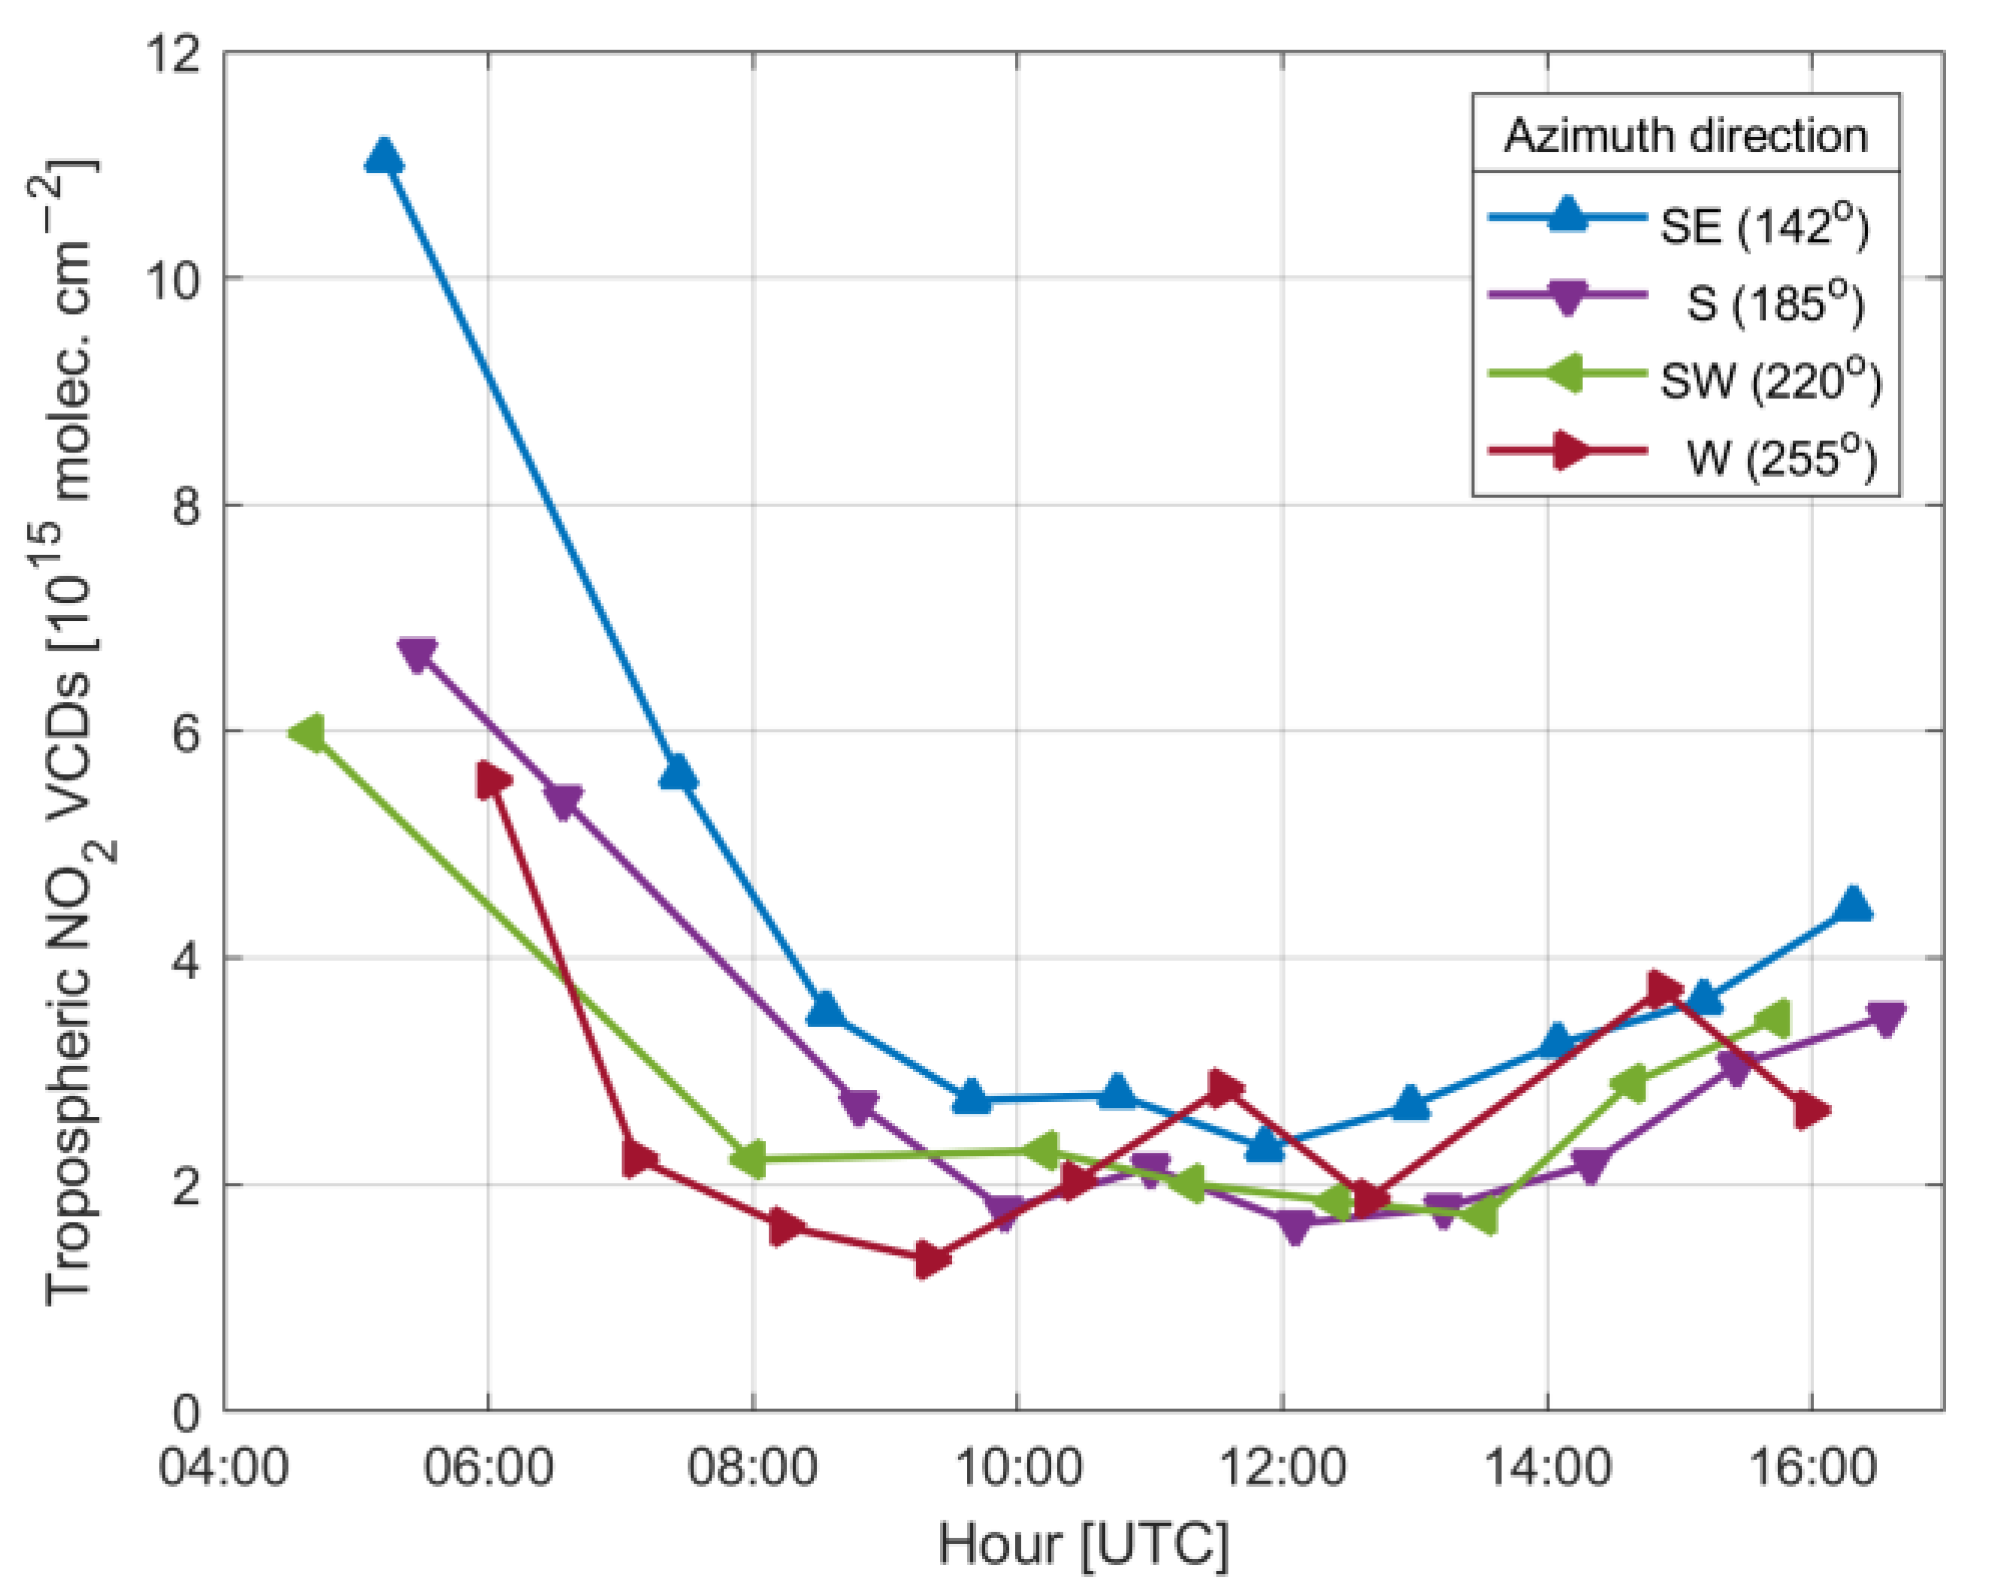
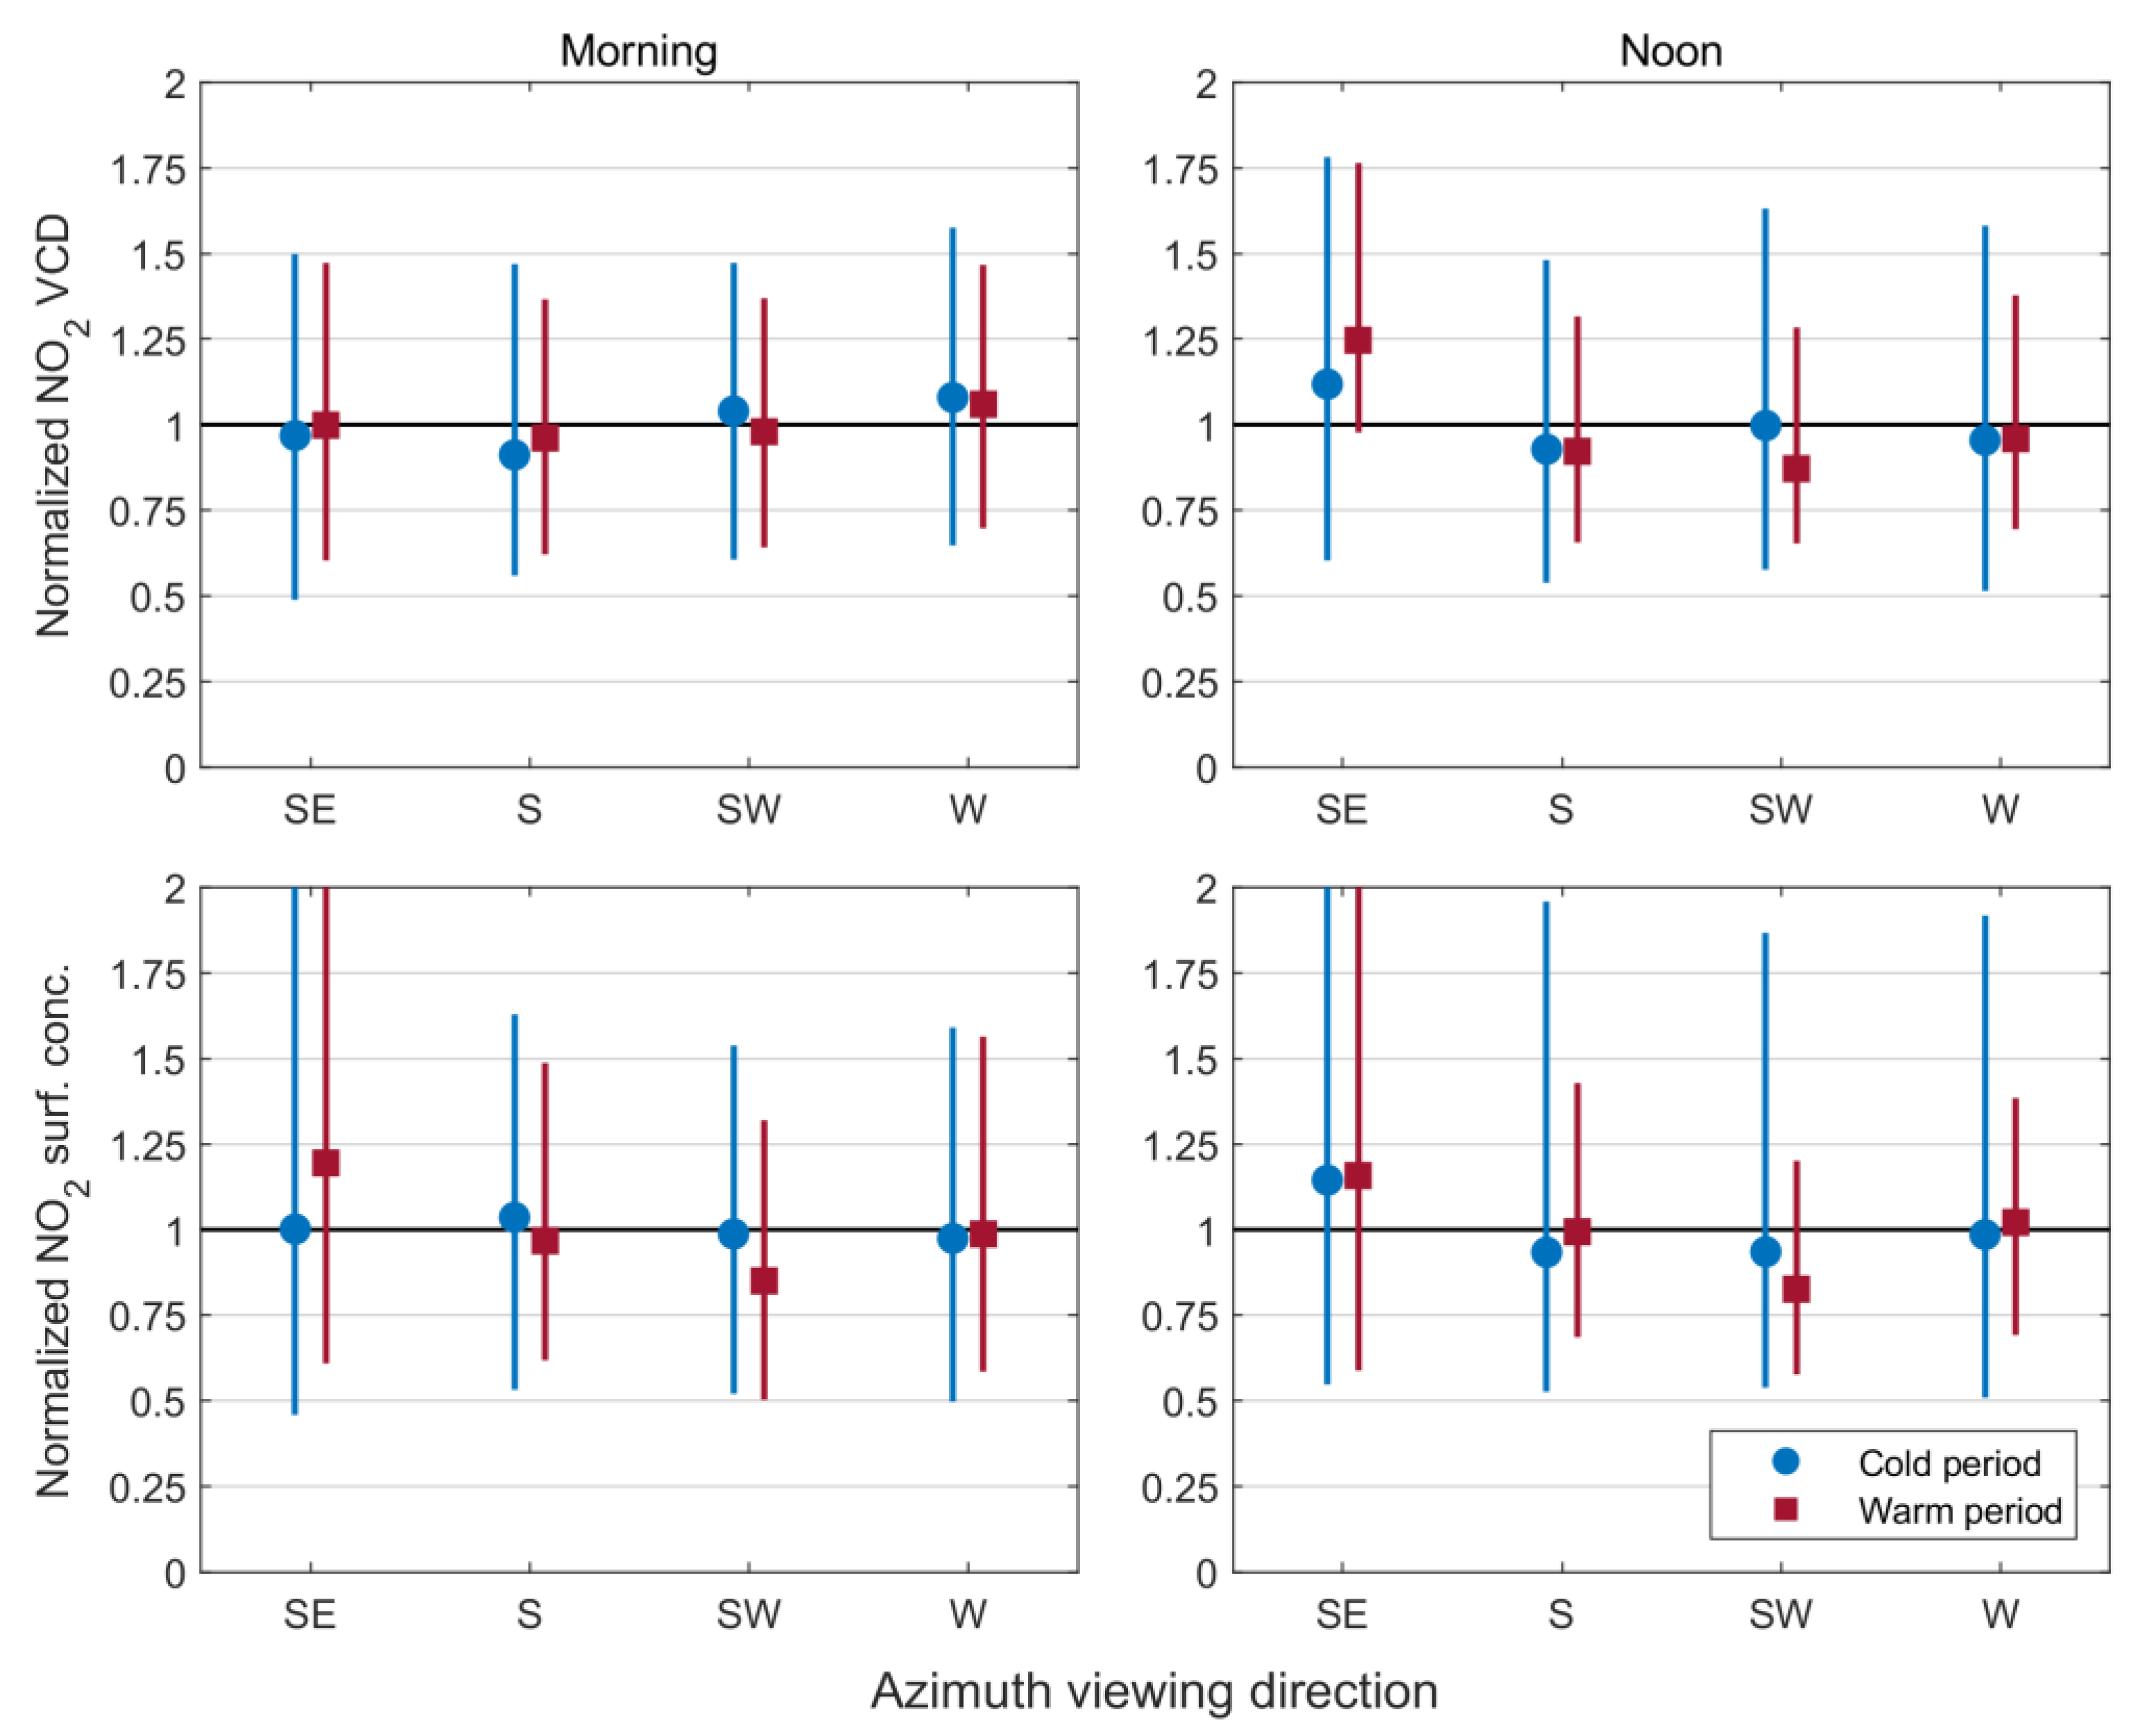
3.4. Spatial Distribution

Since in urban environments, especially in large cities, emission sources of various sizes and strengths are distributed in different areas, the NO2 concentrations can vary rapidly in space. In situ (point measurements) or MAX-DOAS observations at one azimuth (1D systems), that provide information about the NO2 content in a particular direction, are usually not representative for the NO2 amounts in the surrounding areas. However, by using MAX-DOAS measurements at multiple azimuths (2D systems), valuable information for the assessment of the NO2 spatial distribution can be retrieved, allowing for the investigation of possible NO2 horizontal inhomogeneities and a better characterization of the NO2 field around the measurement site. In this study, the spatial variability of NO2 over Thessaloniki was investigated by comparing the NO2 vertical columns and surface concentrations measured at different azimuth viewing directions (see Figure 1) over the period of study. These viewing geometries can be roughly distinguished to those representing urban/suburban environments, across the city center and pointing to heavy-traffic roads (azimuths of 142° and 185°) and to those pointing towards the sea (220° and 255°). On short timescales (e.g., on a daily basis), spatial differences in the NO2 amounts can occur. Figure 6 shows an example of the diurnal variability of the NO2 VCDs during a sunny summer day for all azimuth directions, which are represented by lines of different colors. On this day, 15% of the data were flagged as invalid by the inversion algorithm (MMF) and thus they were rejected from the analysis, leading to some missing values in the time series. The morning peak and the secondary afternoon increase of NO2 that were related to enhanced traffic emissions, along with the strong reduction of NO2 at noon due to increased photochemical reactions (see also Section 3.2), are well captured in all viewing directions. However, the NO2 columns in the SE direction were systematically and significantly larger compared to the other azimuths, especially in the morning, likely related to the inhomogeneous emissions within the city.
As already discussed in Section 3.2, the concentration of NO2 in the boundary layer changes rapidly with time (both in the short- and long-term), prohibiting a detailed investigation of its horizontal distribution. Even on a daily basis, a full measurement sequence for all viewing directions lasts for about 1 hour (~15 min per elevation scan for each azimuth and ~2 min per scan for dark signal measurements). This constrains the time step of measurements at each azimuth angle to at most one per hour. The NO2 variability over the whole period of study (~2.5 years) was analyzed separately for the cold and warm periods, aiming at the investigation of possible differences in spatial distribution patterns. In order to reduce the effect of the NO2 temporal variability, the analysis was focused on two periods of different, but less variable, NO2 levels, i.e., in the morning, when NO2 is high, and during noon hours, when the NO2 concentrations reach minimum values. Anthropogenic activities that lead to the emission of tropospheric NO2 peak at different times during the cold and warm periods (Figure 5). Hence, in our analysis, morning hours were considered as between 06:00 and 09:00 UTC for the cold period and between 04:00 and 07:00 UTC for the warm period. Similarly, the time intervals 10:00–12:00 and 11:00–14:00 UTC were used for the noon hours for the cold and warm periods, respectively.
Figure 7 shows the normalized median NO2 VCDs and surface concentrations for the four azimuths (x axis, see also Figure 1). The data were normalized by dividing the medians with the average VCD or surface concentration of all azimuths for the corresponding period, while the error bars indicate the variability for each azimuth as the interquartile range. The top row of panels represents the NO2 VCDs and the bottom row the NO2 surface concentrations, while each column refers to a different time period of the day. In the morning, the normalized NO2 VCDs and surface concentrations along the different azimuths reveal a generally homogenous spatial distribution for the cold period (Figure 7, blue dots). This is probably related to the relatively longer lifetime of NO2 in the troposphere, due to weaker photochemical destruction, that allows stronger dispersion of the pollutant, leading to better horizontal mixing. Furthermore, meteorological parameters, (e.g., wind direction and speed) can also affect the horizontal dispersion of NO2. Although a detailed investigation of these effects is beyond the scope of this study, the influence of wind speed and direction is briefly addressed in Appendix B. During the warm period (Figure 7, red squares), the NO2 VCDs also show a similar (homogenous) horizontal distribution. However, despite the large variability, the NO2 surface concentrations for the SE direction are generally higher than in the other azimuths, while the lowest concentrations are reported for the SW direction. The SW direction points towards the sea (Figure 1) and the effective horizontal path extends over the bay, where NO2 is expected to be significantly lower than in the urban environment. Even though the W direction is also towards the sea, it crosses part of the western sector of the urban Thessaloniki, where industrial activities take place, and thus the reported NO2 concentrations are generally higher than in the SW direction. Finally, the SE direction crosses the entire city center and an urban area of persistent traffic-related NOx emissions, resulting in locally increased NO2 loads.
During noon hours, when the NO2 levels overall significantly drop, the median NO2 VCDs and surface concentrations are higher for the SE direction in both periods. This effect is stronger during the warm period due to the enhanced NO2 photolysis rates and the generally weaker winds that suppress the dispersion, leading to less homogenous horizontal distribution. Similar results have been reported in [46]. For the same reasons that are discussed for the morning hours, the median NO2 concentrations for the SW direction are significantly lower than the other viewing directions, especially during the warm period.
The variability of NO2 in all azimuths is large, due to highly variable emission sources, and thus quantitative estimates cannot be easily unveiled from Figure 7. Hence, the percentage differences of the median NO2 VCDs and surface concentrations for each azimuth from the average of all directions are summarized in Table 1 for the cold and warm periods. In the morning, the median NO2 surface concentrations are ~20% above average for the SE direction and ~15% below average for the SW direction during the warm period. For noon hours, the median NO2 VCDs are ~12% (25%) higher for the cold (warm) period, while the respective surface concentrations are ~15% (16%) higher. Similarly, the noon NO2 load in the SW direction is approximately 17% lower than in the other azimuths.
The statistical significance of the differences between the NO2 VCDs and surface concentrations for the rural (SW) and urban (SE) azimuths was assessed by the Student’s t-test. Despite the large range of variability, the differences were found to be statistically significant at the 95% confidence level in all cases, except for the VCDs in the morning, due to the more homogenous horizontal distribution of NO2, as previously discussed. Statistically significant differences were found also between other azimuths, but the most consistent pattern is that for the SE direction.

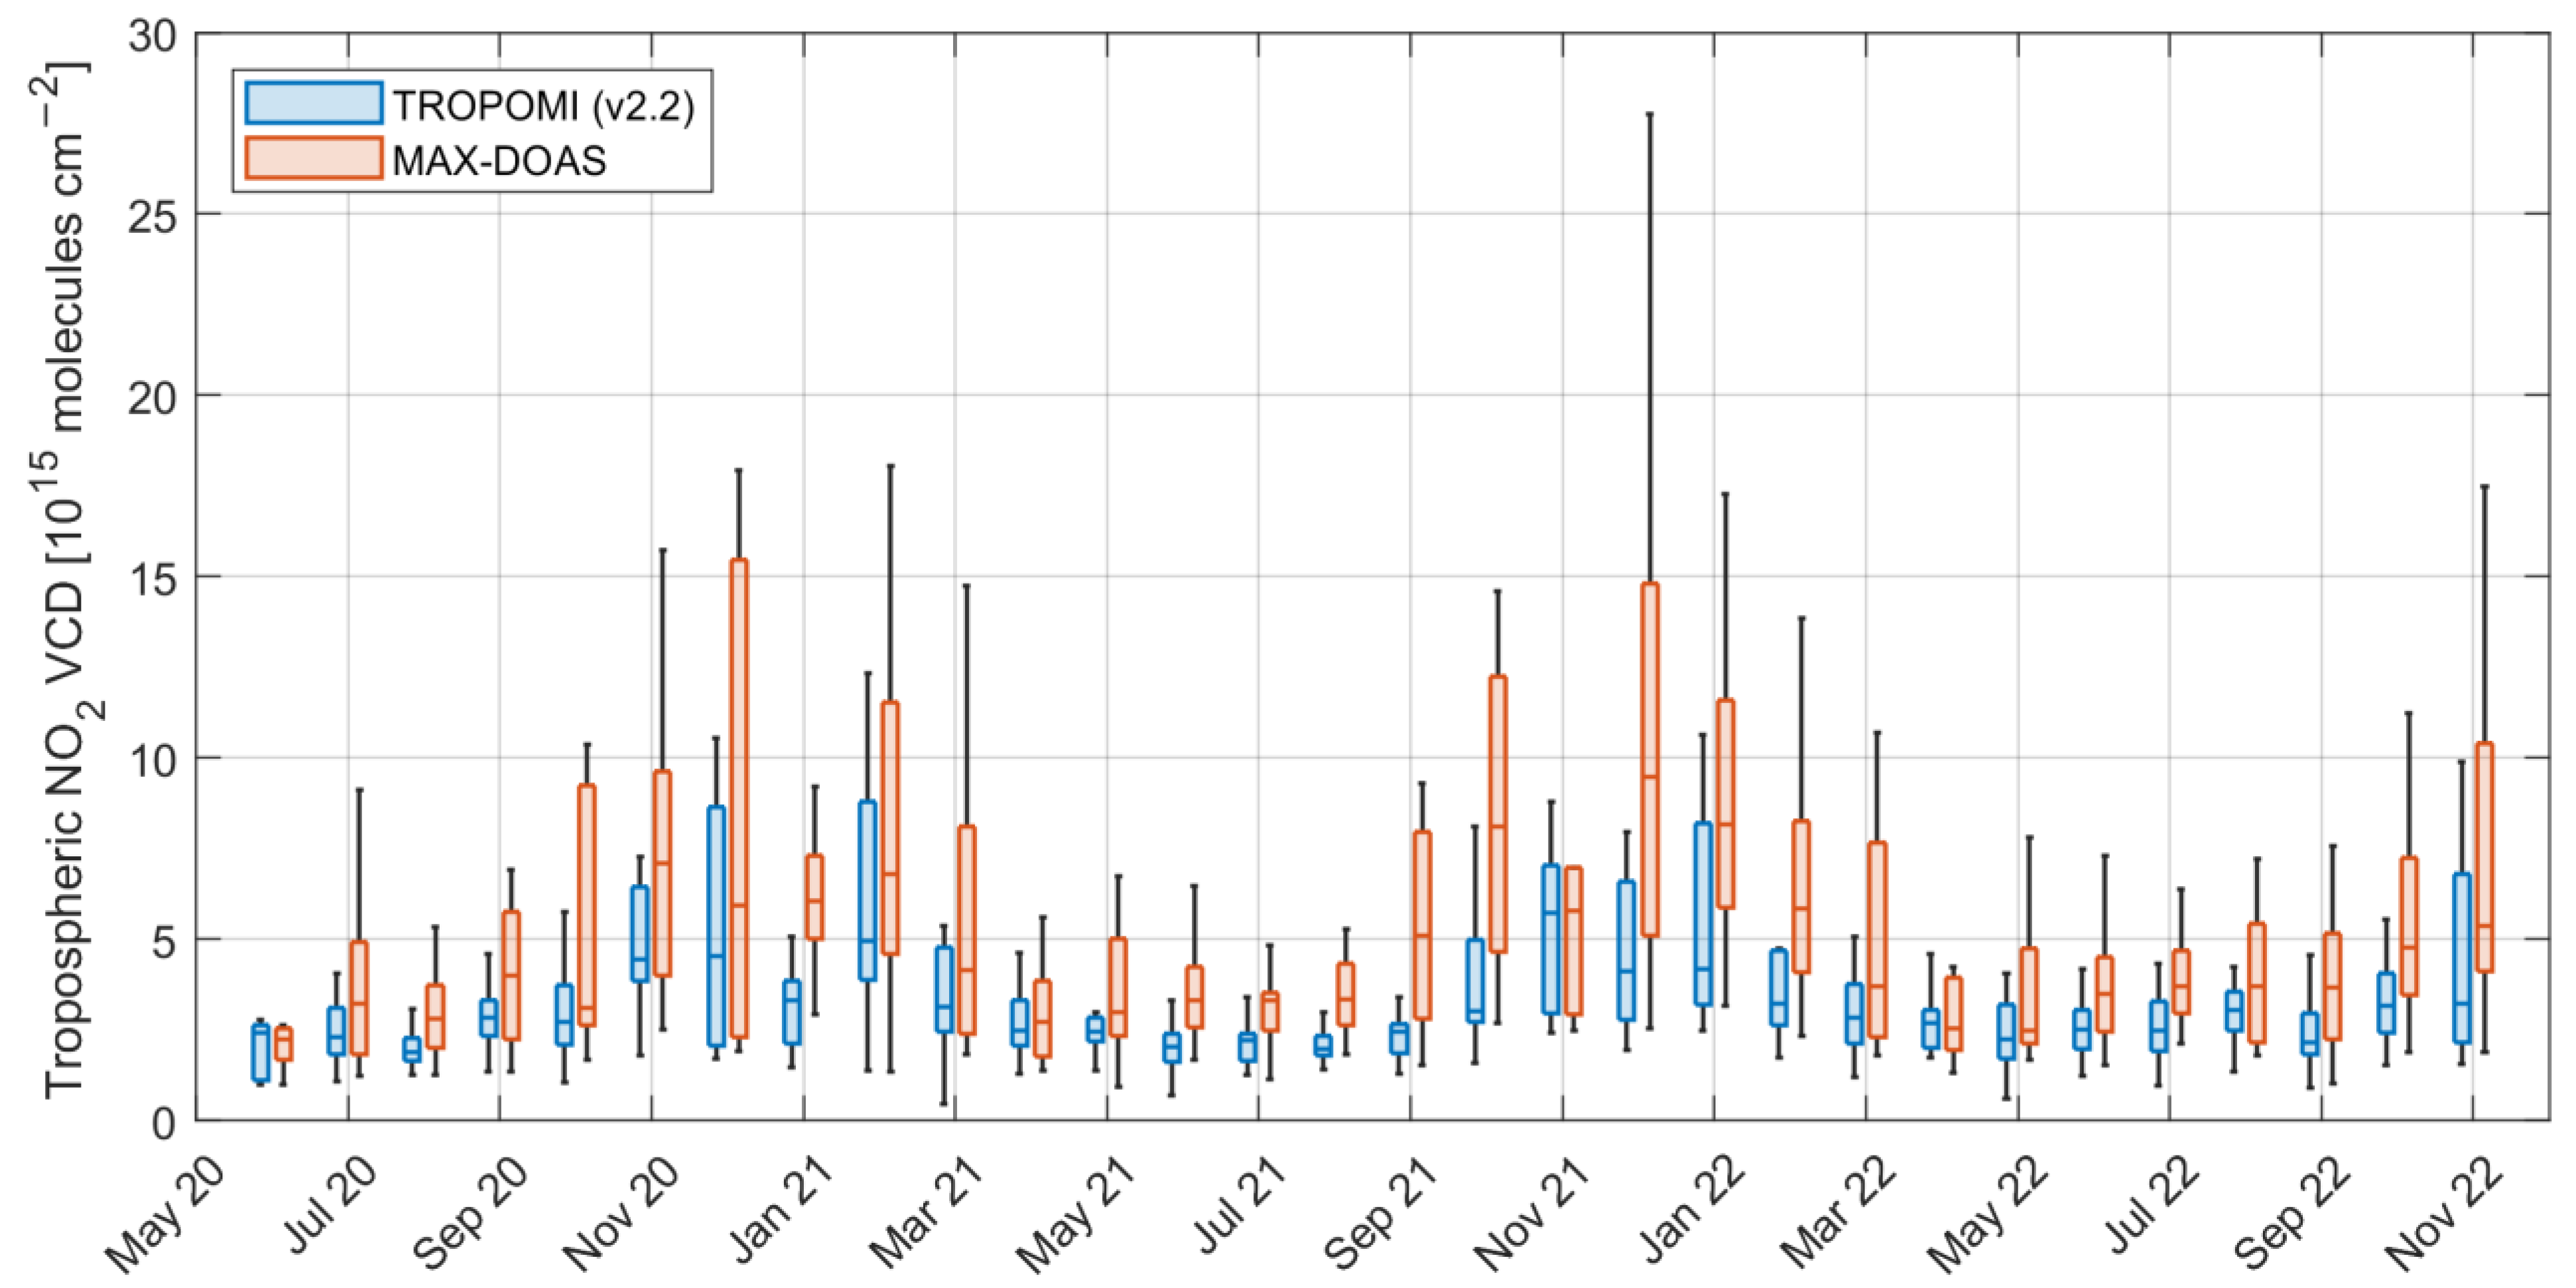
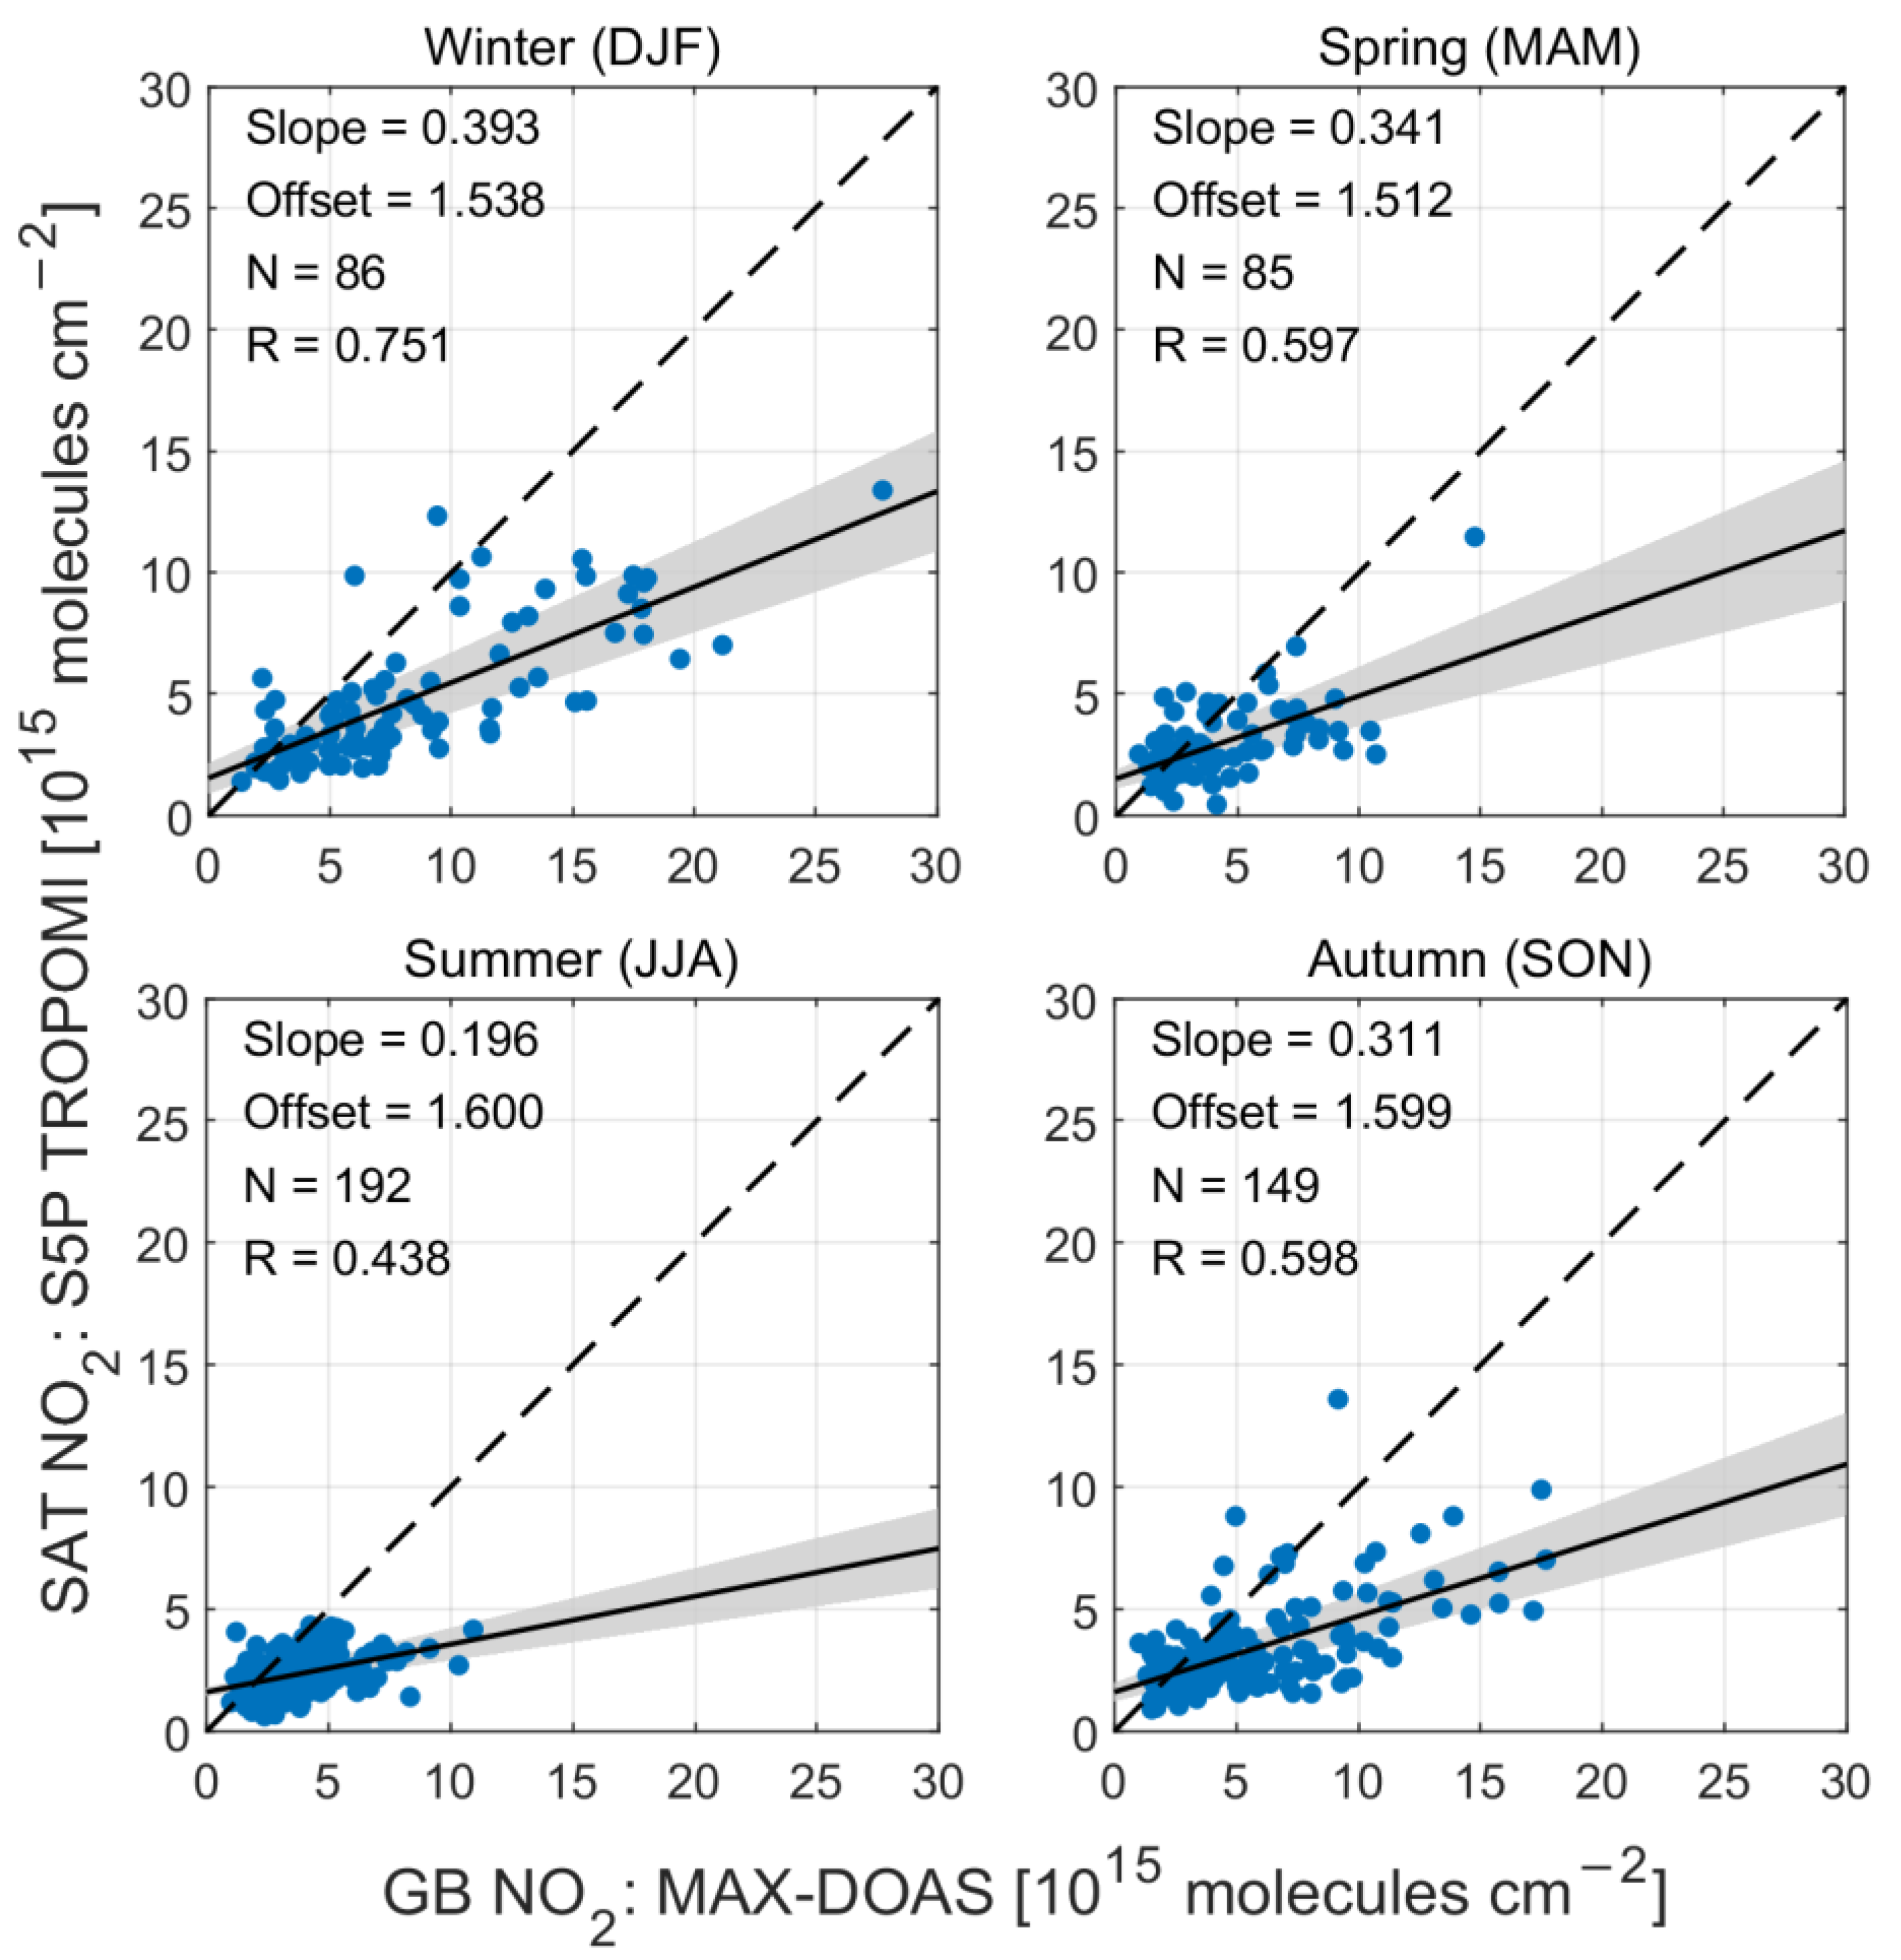
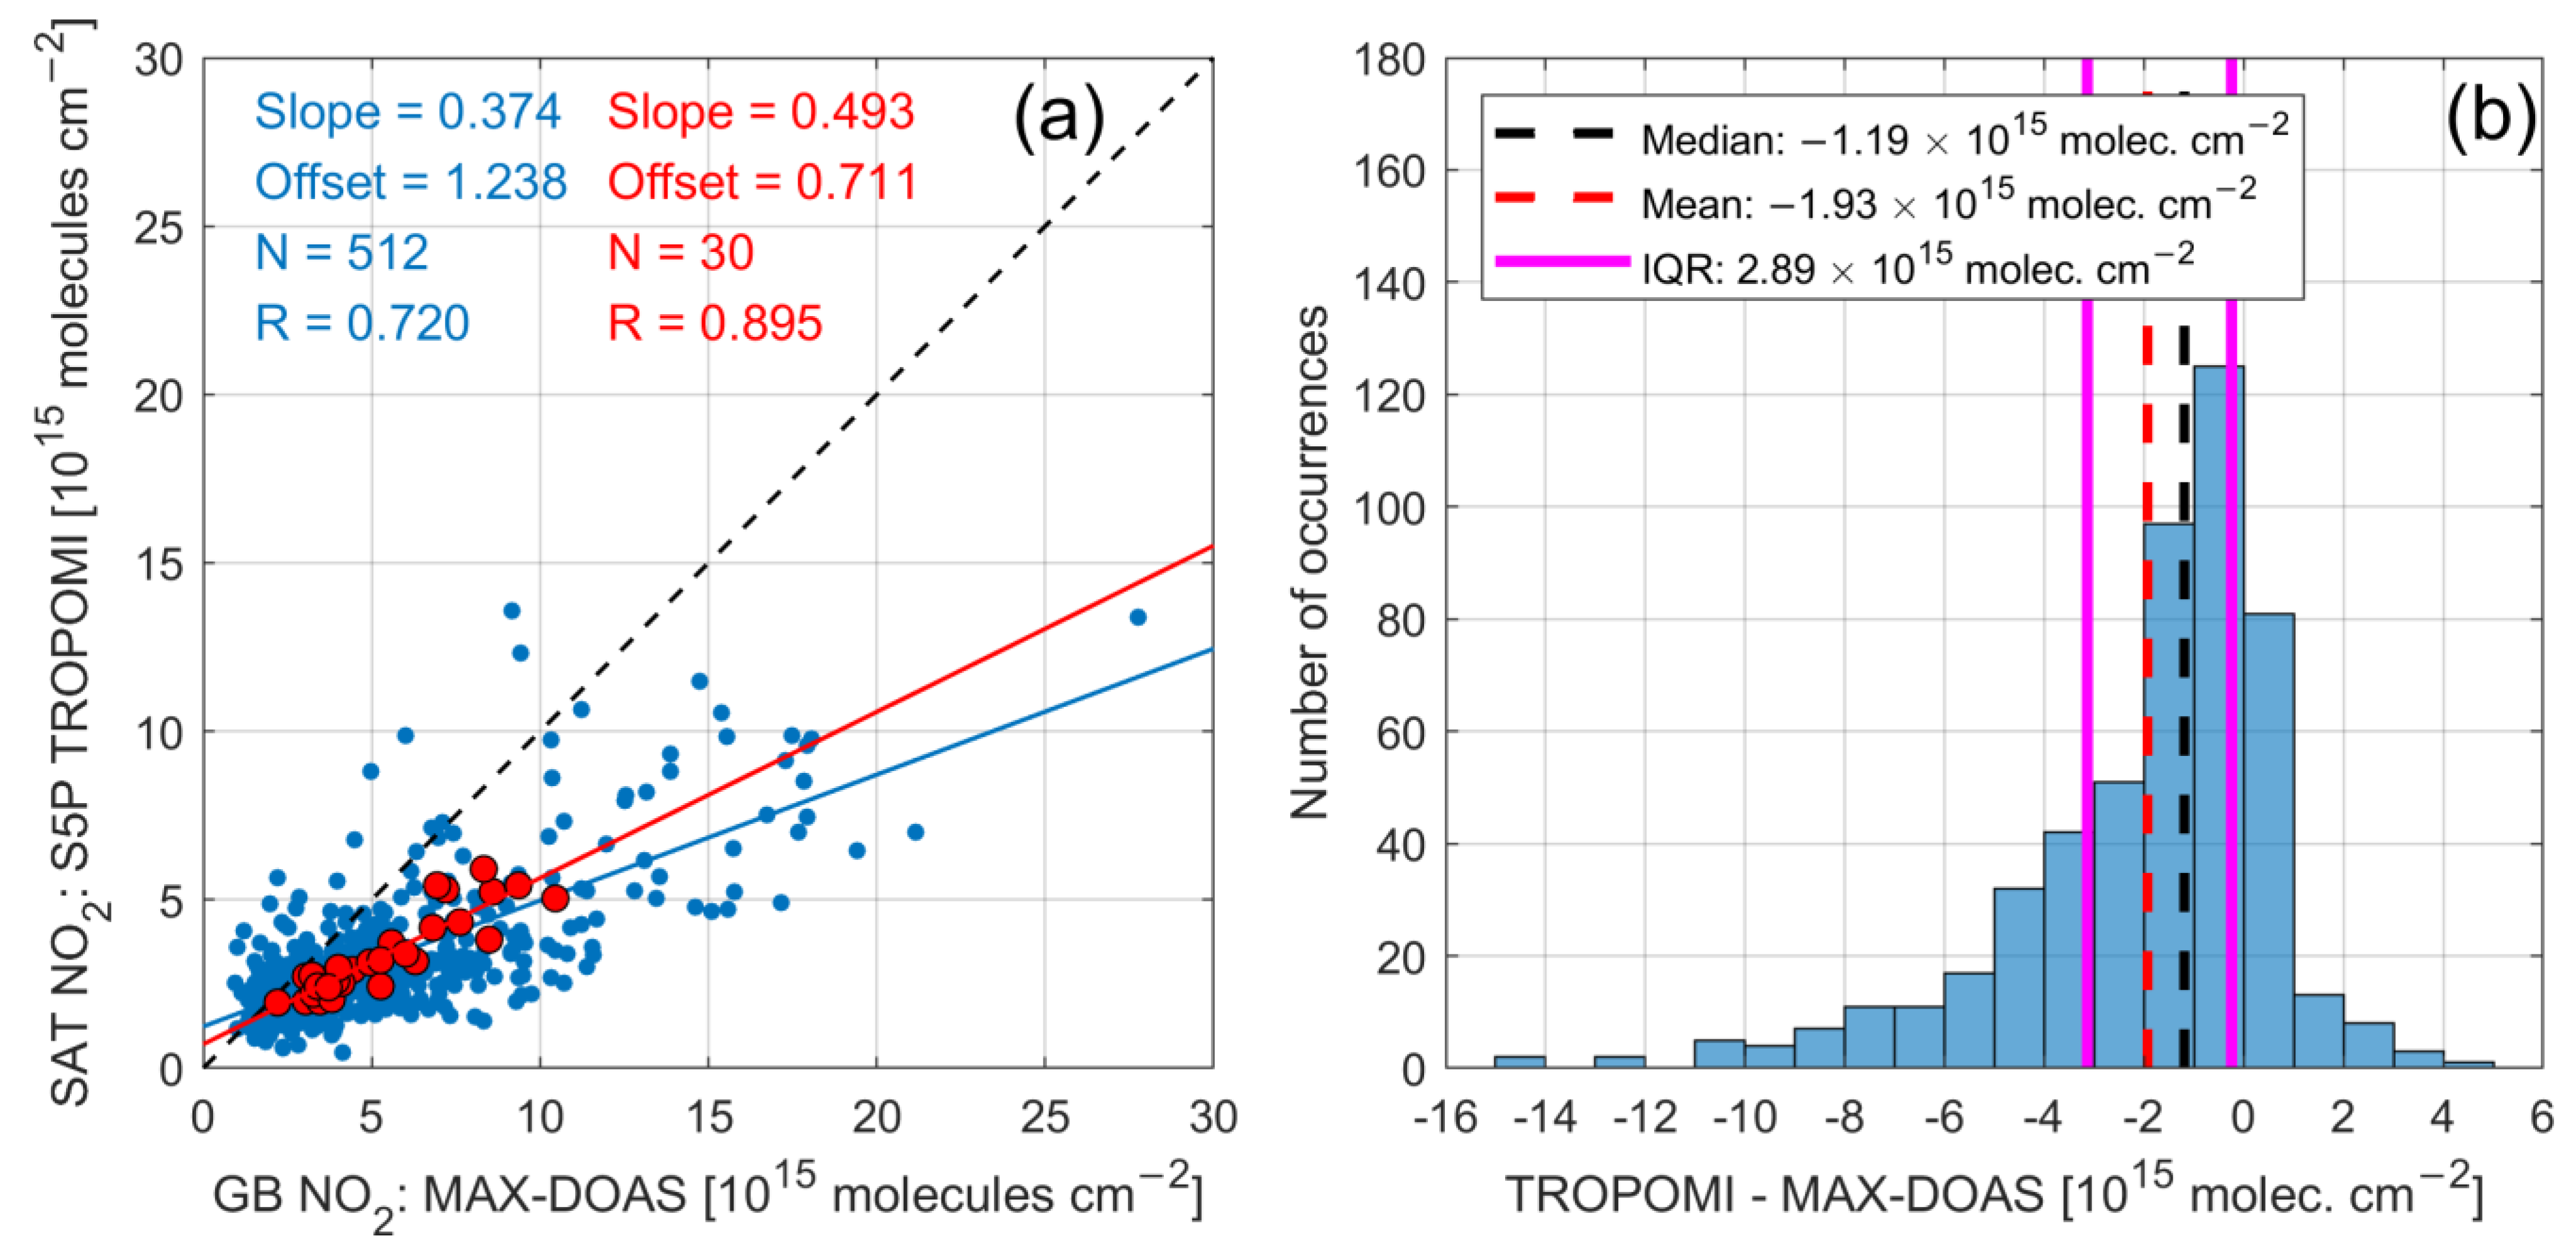
4. Comparison with S5P/TROPOMI

In this section, the tropospheric NO2 vertical columns retrieved by TROPOMI for Thessaloniki (considering only cloud-free satellite pixels) are compared and validated using collocated ground-based MAX-DOAS measurements.
Since TROPOMI data are limited to only one overpass per day, short-term (e.g., diurnal) NO2 variations cannot be investigated with satellite data. TROPOMI passes over Thessaloniki between approximately 10:30 and 12:30 UTC (Figure 3), when the NO2 concentrations are usually low for the reasons discussed in Section 3.2. However, NO2 is a highly variable pollutant and, thus, in order to compare meaningful results, the collocated ground-based and satellite observations should have a short time difference. In this study, the collocations are calculated by averaging MAX-DOAS measurements within ±15 min of the satellite overpass time. Figure 8 shows the time series of the collocated tropospheric NO2 vertical column measurements in box-and-whisker plots over the whole period of study (30 months), from June 2020 to November 2022. The seasonal variations of NO2 are well captured by both instruments and the reported seasonal patterns are similar over the period of study. The higher tropospheric NO2 columns during winter are consistent with the results presented in Section 3.1. Furthermore, higher variability of NO2 VCDs is found during the cold period for both ground-based and satellite observations, especially for those of the MAX-DOAS. This is expected since NOx emissions are stronger during wintertime, which, combined with the lower photolysis rate of NO2 due to limited sunlight and the more variable weather patterns, results in higher spatio-temporal variability. The highest monthly variations, represented by the interquartile range, are found during December 2020, February 2021 and December 2021 (ranging between 5.72–13.17 × 10¹⁵ molecules/cm2 for the MAX-DOAS and 4.90–6.59 × 10¹⁵ molecules/cm2 for TROPOMI). These are consistent with Figure 2, indicating that pollution events were well captured by both ground-based and satellite instruments.
Figure 9 presents the comparison of TROPOMI tropospheric NO2 vertical columns against MAX-DOAS measurements in scatter plots for the four seasons of the whole period of study. Overall, TROPOMI systematically reports lower NO2 columns than the MAX-DOAS. The underestimation of satellite-derived tropospheric NO2 compared to MAX-DOAS observations is also found in recent publications (e.g., [54,55,56]) and it is more evident in highly polluted and in extremely highly polluted environments [22].
The MAX-DOAS probes air masses along the line of sight of the telescope, pointing at different elevation angles, from near the horizon to the zenith. The measurements are sensitive to local emissions located on this line of sight and at distances up to a few kilometers. The NO2 columns that are reported by satellite instruments are essentially averaged over the sub-satellite pixel area (3.5 × 5.5 km² for S5P/TROPOMI), which contains different emissions sources, resulting, generally, in the underestimation of the NO2 columns. The highest correlation between the two instruments is found in winter (R = 0.75), while significantly lower correlations are found during spring (R = 0.6), autumn (R = 0.6) and summer (R = 0.44). For all seasons, a negative bias is found for TROPOMI with median differences of −2.91 ± 3.77 × 10¹⁵ molecules/cm2 in winter, −0.57 ± 2.13 × 10¹⁵ molecules/cm2 in spring, −1.04 ± 1.55 × 10¹⁵ molecules/cm2 in summer and −1.42 ± 2.97 × 10¹⁵ molecules/cm2 in autumn. These biases correspond to mean fractional biases of about −55% during winter, −21% in spring and −40% in summer and autumn.
Figure 10 shows the consolidated comparison (i.e., without seasonal discrimination) of TROPOMI and MAX-DOAS tropospheric NO2 columns in a scatter plot (Figure 10a) over the whole period of study. The blue markers indicate the daily collocated observations, while the red dots represent the monthly mean vertical columns. Figure 10b shows the frequency distribution of the absolute daily differences between TROPOMI and MAX-DOAS. The black and red dashed lines indicate the median and mean difference, respectively, while the solid magenta lines represent the 25th and 75th percentiles of the distribution. The correlation coefficient of the daily collocated data is 0.72, with slope and offset values of 0.37 and 1.24, respectively. For the monthly means, the statistics are significantly improved with R = 0.89 and slope and offset values of 0.49 and 0.71, respectively. A clear negative bias is found with median and mean differences of −1.19 and −1.93 (×1015 molecules/cm2), respectively (which corresponds to a mean fractional bias of approximately −37%), and an interquartile range of 2.89 × 10¹⁵ molecules/cm2. These results are consistent with the findings in the latest issue of the quarterly Routine Operations Consolidated Validation Report (http://mpc-vdaf.tropomi.eu/, accessed on 20 January 2023), where for the S5P/TROPOMI tropospheric NO2 product, a median bias of −1.8 × 10¹⁵ molecules/cm2 (about −35%) was found over the full satellite mission using NDACC-affiliated MAX-DOAS data from 30 measurement sites.

5. Summary and Conclusions

In this study, the spatio-temporal variability of tropospheric NO2 over Thessaloniki, Greece, was investigated using vertical column and surface concentration data that were retrieved by MAX-DOAS observations during the period June 2020–November 2022. The NO2 seasonal, diurnal and weekly cycles were investigated and the surface concentrations that were retrieved by the MAX-DOAS were compared with in situ data from a nearby air quality station, which is mostly unaffected by local emissions and, hence, is more representative of the average NO2 levels in the local boundary layer. The comparison of the two ground-based datasets was conducted in order to evaluate the performance of the MAX-DOAS instrument in the context of air quality monitoring in Thessaloniki.
The tropospheric NO2 VCDs and surface concentrations, retrieved by the MAX-DOAS, show a similar seasonal cycle, i.e., lower values during summer and higher values during winter. The higher columns in winter are due to enhanced anthropogenic emissions (e.g., domestic heating) and the longer lifetime of NO2 in this season. Hourly mean NO2 surface concentrations measured by the MAX-DOAS reveal a clear diurnal pattern with an early morning peak during the rush hours, followed by a reduction around noon as a result of stronger photolysis rates. The increased morning concentrations are due to the enhanced traffic-related NOx emissions and the accumulation of NO2 in the boundary layer during the night. The morning peak during summer is significantly reduced (by approximately 25–30%) compared with the other seasons. Additionally, the NO2 day of the week variability and the weekend effect were investigated. The NO2 surface concentrations retrieved by the MAX-DOAS were significantly lower on the weekend (by 20–30%), especially on Sundays (by 30–40%), compared with the working days. In all cases, the NO2 temporal variations that were captured by the MAX-DOAS are in agreement with the in situ measurements with Pearson’s correlation coefficients ranging from 0.90 to 0.99, indicating that the two systems are equally capable of monitoring the variability of NO2 over Thessaloniki.
The NO2 spatial variability was investigated by comparing the concentrations reported by the MAX-DOAS for four azimuth viewing directions. In order to reduce the effect of the NO2 temporal variability, the analysis was conducted separately for the morning hours, when the NO2 levels are high, and for noon hours, when the NO2 concentrations reach minimum values. On a long timescale (i.e., during the 30 months in this study), the spatial NO2 variability is masked by the strong short-term temporal variations. However, despite the large variability, higher NO2 concentrations of up to 25% were found for the SE azimuth that crosses the entire city center and extends over an urban area compared with azimuths towards the sea (e.g., SW). Differences between the SE and SW directions were statistically significant at the 95% confidence level for all cases, except for the VCDs in the morning.
The tropospheric NO2 VCDs in Thessaloniki, retrieved by the MAX-DOAS, were compared with collocated measurements of the TROPOMI instrument on board the Sentinel-5P satellite, aiming at the validation of the satellite product against the well-established ground-based observations. The comparisons were conducted for all seasons in order to investigate any seasonal effects and to evaluate their agreement under both low and high NO2 concentration levels. The seasonal NO2 variations were well captured by both instruments, with increased VCDs during the cold period due to enhanced emissions and a reduction during the warm period as a result of stronger photochemical destruction of NO2. Even though a generally good correlation was found between MAX-DOAS and TROPOMI (R = 0.72 and R = 0.89 for the daily and monthly means, respectively), TROPOMI underestimates the tropospheric NO2 VCDs by approximately 55% in winter, 21% in spring and 40% during autumn and summer. The consolidated median and mean absolute differences (i.e., without seasonal discrimination) are −1.19 and −1.93 (×1015 molecules/cm2), respectively, and they correspond to a mean fractional bias of approximately −37%, which is in agreement with the latest S5P MPC VDAF validation report (http://mpc-vdaf.tropomi.eu/, accessed on 20 January 2023). This clearly negative bias is mainly caused by the much larger satellite footprint, resulting in a smoother perception of the NO2 concentrations, while the MAX-DOAS measurements are affected more by local emissions.

Author Contributions

Conceptualization, A.B. and D.K.; Investigation, D.K.; Methodology, D.K., M.-E.K., A.B. and D.B.; Resources, D.K., M.-E.K. and P.T.; Software, D.K. and M.-E.K.; Formal analysis, D.K. and M.-E.K.; Data curation, D.K., M.-E.K. and P.T.; Validation, D.K. and M.-E.K.; Supervision, A.B. and D.B.; Writing—original draft, D.K.; Writing—review and editing, D.K., M.-E.K., A.B., D.B. and P.T. All authors have read and agreed to the published version of the manuscript.

Funding

This research is co-financed by Greece and the European Union (European Social Fund- ESF) through the Operational Programme «Human Resources Development, Education and Lifelong Learning» in the context of the project “Strengthening Human Resources Research Potential via Doctorate Research—2nd Cycle” (MIS-5000432), implemented by the State Scholarships Foundation (ΙΚΥ).

Institutional Review Board Statement

Not applicable.

Informed Consent Statement

Not applicable.

Data Availability Statement

The MAX-DOAS data used in this study are available from the corresponding author upon request. The air quality monitoring station data are available from the Municipality of Thessaloniki, Department of Environment, upon request. The meteorological data are publicly available from https://meteo3.geo.auth.gr/stations/orofi_Data.HTML, accessed on 20 January 2023. The S5P/TROPOMI data are publicly available from the Sentinel-5P Product Algorithm Laboratory (S5P-PAL; S5P-PAL Data portal) and contain modified Copernicus Sentinel data processed by S[&]T.

Acknowledgments

We acknowledge support of this work by the project “PANhellenic infrastructure for Atmospheric Composition and climatE change” (MIS 5021516), which is implemented under the Action “Reinforcement of the Research and Innovation Infrastructure”, funded by the Operational Programme “Competitiveness, Entrepreneurship and Innovation” (NSRF 2014–2020) and co-financed by Greece and the European Union (European Regional Development Fund). Results presented in this work have been produced using the Aristotle University of Thessaloniki (AUTh) High Performance Computing Infrastructure and Resources. M.-E.K. would like to acknowledge the support provided by the AUTh IT Center throughout the progress of this research work. We thank Caroline Fayt ([email protected]), Michel Van Roozendael ([email protected]) and Thomas Danckaert ([email protected]) for the free use of the QDOAS software, Robert Spurr for the free use of the VLIDORT radiative transfer code package and Martina Michaela Friedrich ([email protected]) for providing the MMF algorithm.

Conflicts of Interest

The authors declare no conflict of interest.

Appendix A

Figure A1. Scatter plot of the daily and monthly mean surface concentrations that were retrieved by the MAX-DOAS and the in situ instruments for the period of study.
Applsci 13 02641 g0a1

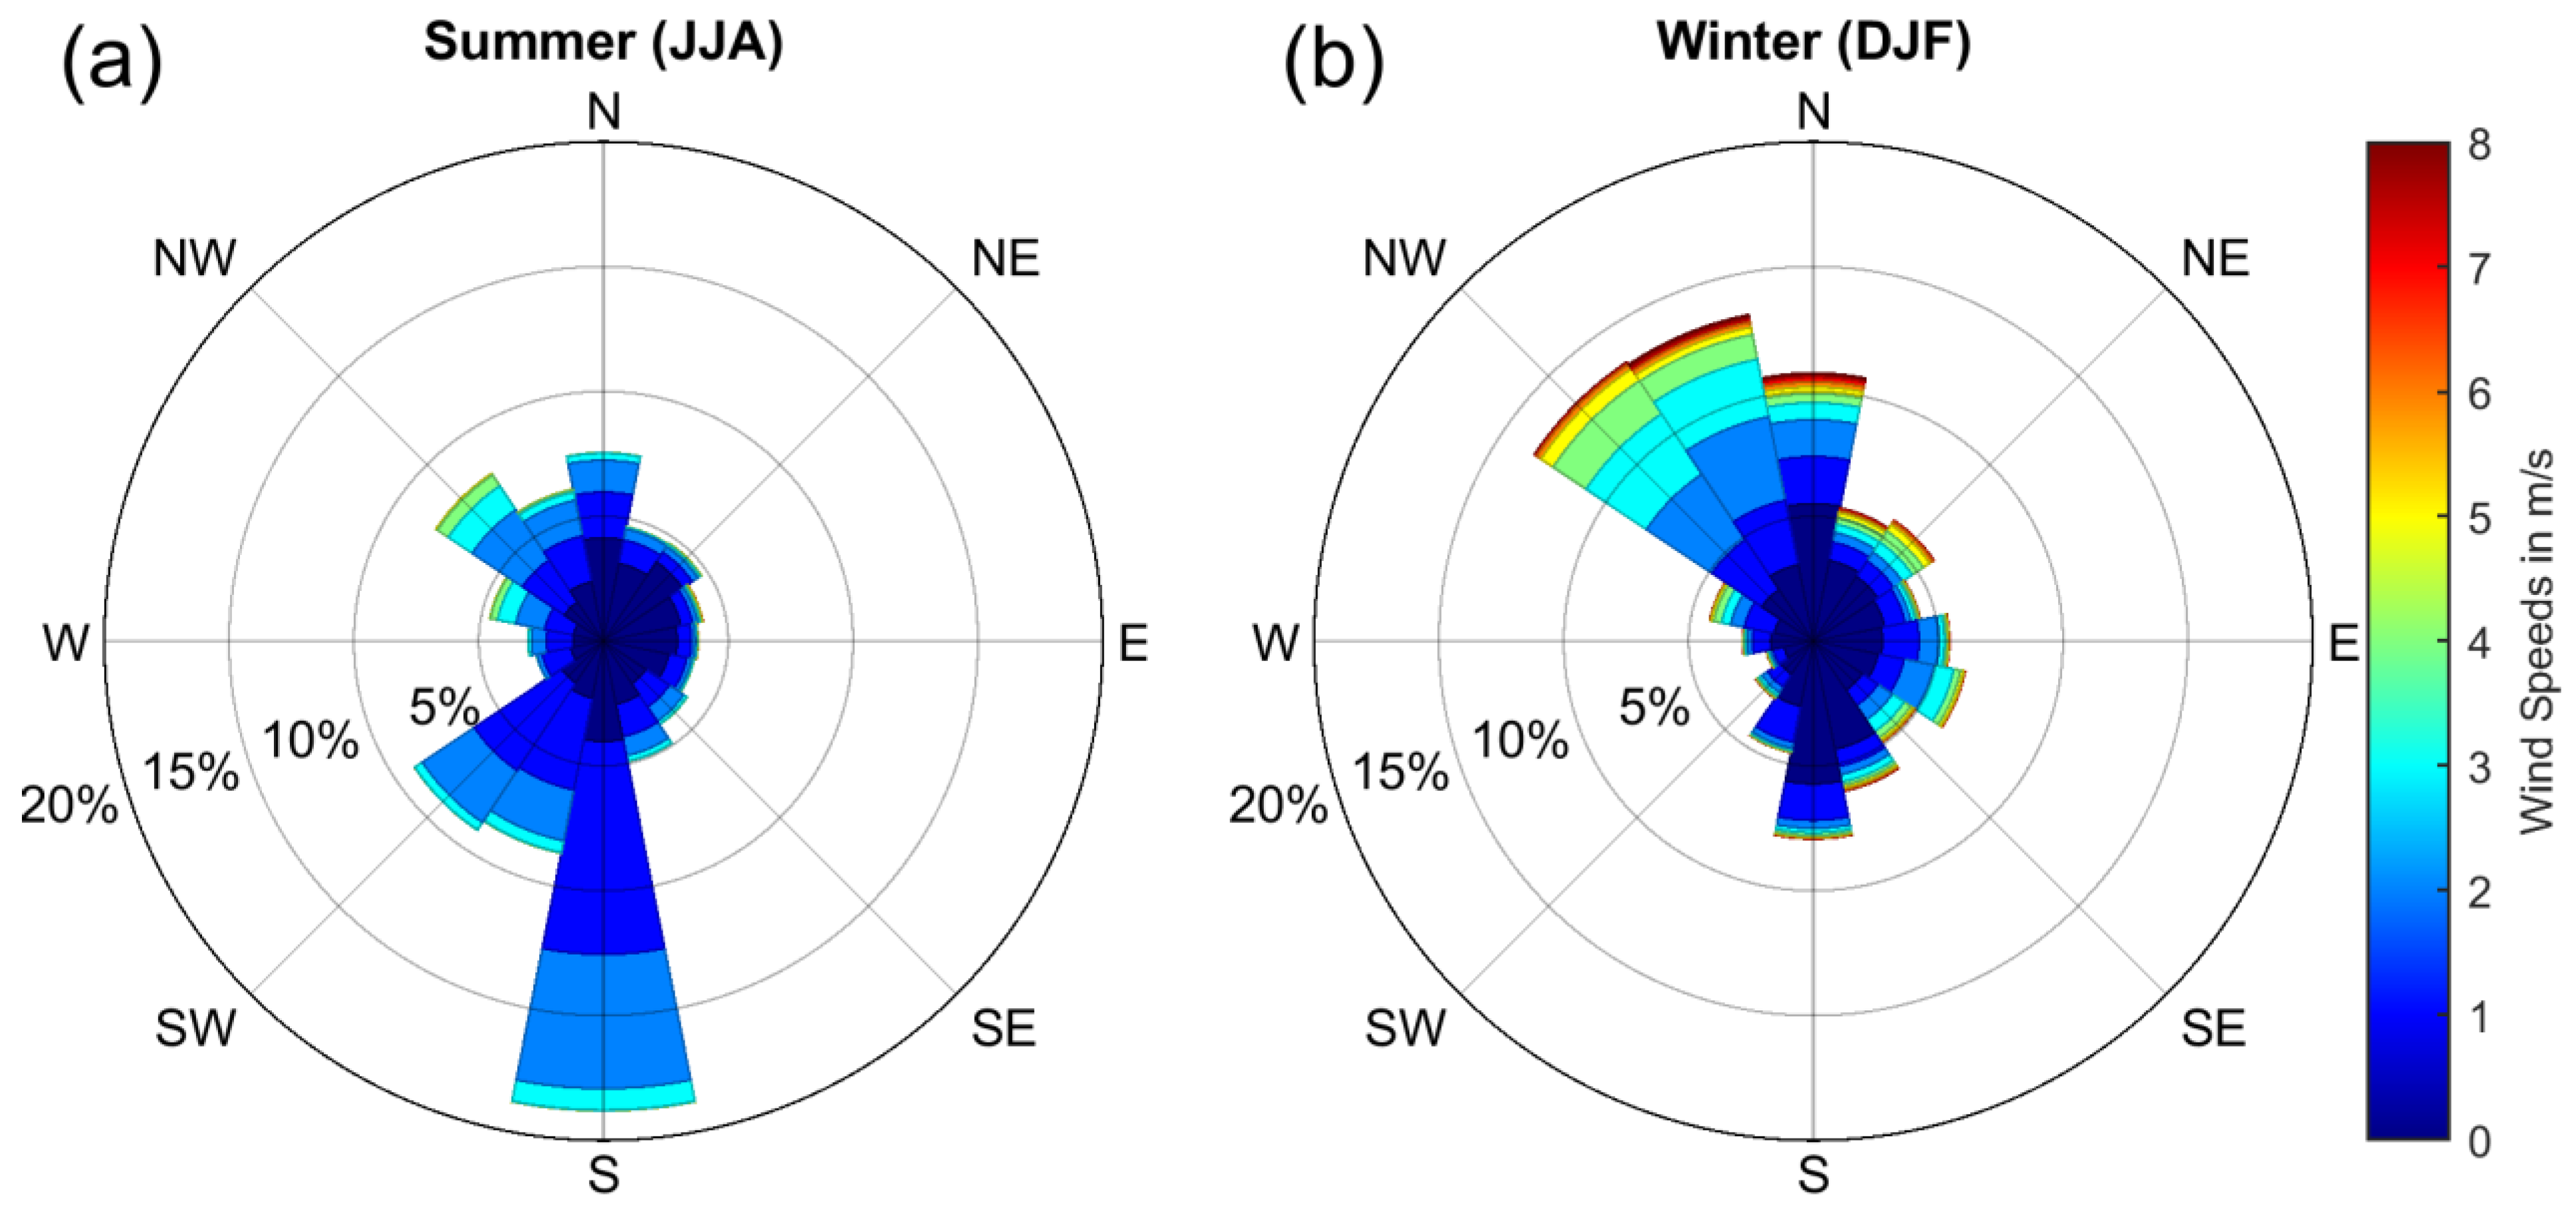
Appendix B. Prevailing Meteorological Conditions over Thessaloniki

This section describes briefly the dominant wind patterns over Thessaloniki for the period of study (June 2020 to November 2022). Wind speed and direction (averaged over 10 min intervals) are continuously monitored by a meteorological station that is installed on the rooftop (~25 m above ground) of the Department of Meteorology and Climatology building, which is located inside the University campus at a horizontal distance of about 300 m from the location of the MAX-DOAS instrument. The wind data are publicly available via the corresponding website (https://meteo3.geo.auth.gr/stations/orofi_Data.HTML, accessed on 20 January 2023).
Figure A2 shows the wind rose diagrams over Thessaloniki for summer and winter. In summer, the prevailing wind directions are S–SW and are usually characterized by low wind speeds (on average < 3 m/s), while northern winds are less frequent. The presence of southern winds is a result of the coastal orientation of the city (Figure 1) and the temperature difference between the land and the sea (which is more pronounced during the warm period due stronger solar radiation) that allow the formation of sea breeze circulation [57,58,59]. The wind pattern is different in winter with the dominant winds blowing from N–NW directions being generally stronger (reaching speeds of over 8 m/s) than in summer. According to [57], the wind patterns in the cold period are caused by the combination of low-pressure systems over the Mediterranean Sea and anticyclones over central Europe.
Figure A2. Wind rose diagrams (binned by 22.5°) over Thessaloniki during summer (a) and winter (b) for the period June 2020 to November 2022.
Applsci 13 02641 g0a2
The variability of the NO2 concentration levels is not only related to the spatial distribution of its emission sources, but it is also associated with certain meteorological parameters, such as wind direction and speed, since the latter significantly contribute to the vertical and horizontal dispersion of air pollutants. The effect of wind speed on the tropospheric vertical columns and surface concentrations of NO2 in Thessaloniki for the two dominant wind directions, N–NW and S–SW, is depicted in Figure A3. For northern wind regimes, the NO2 VCDs and surface concentrations have similar variation patterns, i.e., higher NO2 amounts are reported for low wind speeds, followed by a clear gradual reduction with increasing wind speed. This is expected, since such wind conditions contribute more efficiently to the dispersion of NO2, which is transported from the urban area towards the sea. For southern winds, a reduction in the NO2 levels is also evident for low to moderate wind speeds (up to 4 m/s); however, a non-negligible enhancement is found for higher wind speeds (>4 m/s), especially for the surface concentrations. This finding is consistent with similar results in [58] and [40]. According to these studies, given the topography of the greater area of Thessaloniki, such conditions favor the accumulation of air pollutants. Furthermore, these wind-direction-related patterns of NO2 could also be associated with larger-scale NO2 transport events from southern Greece; however, additional investigation is required for the determination of NO2 emission sources and the assessment of NO2 transport phenomena, which is beyond the scope of this study.
Figure A3. Tropospheric vertical columns (upper panels) and surface concentrations (bottom panels) of NO2 as a function of wind speed. The left and right columns correspond to N–NW and S–SW wind directions, respectively.
Applsci 13 02641 g0a3

References

  1. World Health Organization (WHO). Ambient Air Pollution: A Global Assessment of Exposure and Burden of Disease; World Health Organisation: Bonn, Germany, 2016; ISBN 9789241511353.
  2. Seinfeld, J.H.; Pandis, S.N.; Noone, K. Atmospheric Chemistry and Physics: From Air Pollution to Climate Change. Phys. Today 1998, 51, 88–90. [Google Scholar] [CrossRef]
  3. Solomon, S.; Portmann, R.W.; Sanders, R.W.; Daniel, J.S.; Madsen, W.; Bartram, B.; Dutton, E.G. On the role of nitrogen dioxide in the absorption of solar radiation. J. Geophys. Res. Atmos. 1999, 104, 12047–12058. [Google Scholar] [CrossRef]
  4. Lee, D.; Köhler, I.; Grobler, E.; Rohrer, F.; Sausen, R.; Gallardo-Klenner, L.; Olivier, J.; Dentener, F.; Bouwman, A. Esti-mations of global no, emissions and their uncertainties. Atmos. Environ. 1997, 31, 1735–1749. [Google Scholar] [CrossRef]
  5. Zhang, R.; Tie, X.; Bond, D.W. Impacts of anthropogenic and natural NOx sources over the U.S. on tropospheric chemistry. Proc. Natl. Acad. Sci. USA 2003, 100, 1505–1509. [Google Scholar] [CrossRef] [PubMed] [Green Version]
  6. European Environmental Agency, EEA. Air Quality in Europe—2020 Report; Publications Office of the European Union: Luxembourg, 2020; ISBN 978-92-9480-292-7. ISSN 1977-8449. Available online: https://www.eea.europa.eu/publications/air-quality-in-europe-2020-report (accessed on 20 January 2023).
  7. Hönninger, G.; von Friedeburg, C.; Platt, U. Multi axis differential optical absorption spectroscopy (MAX-DOAS). Atmos. Chem. Phys. 2004, 4, 231–254. [Google Scholar] [CrossRef] [Green Version]
  8. Hönninger, G.; Platt, U. Observations of BrO and its vertical distribution during surface ozone depletion at Alert. Atmos. Environ. 2002, 36, 2481–2489. [Google Scholar] [CrossRef]
  9. Bobrowski, N.; Hönninger, G.; Galle, B.; Platt, U. Detection of bromine monoxide in a volcanic plume. Nature 2003, 423, 273–276. [Google Scholar] [CrossRef]
  10. Wittrock, F.; Oetjen, H.; Richter, A.; Fietkau, S.; Medeke, T.; Rozanov, A.; Burrows, J.P. MAX-DOAS measurements of atmospheric trace gases in Ny-Ålesund—Radiative transfer studies and their application. Atmos. Chem. Phys. 2004, 4, 955–966. [Google Scholar] [CrossRef] [Green Version]
  11. Wagner, T.; Dix, B.; Friedeburg, C.V.; Frieß, U.; Sanghavi, S.; Sinreich, R.; Platt, U. MAX-DOAS O4measurements: A new technique to derive information on atmospheric aerosols-Principles and information content. J. Geophys. Res. Atmos. 2004, 109. [Google Scholar] [CrossRef] [Green Version]
  12. Van Roozendael, M.; Fayt, C.; Post, P.; Hermans, C.; Lambert, J. Retrieval of Tropospheric BrO and NO2 from UV-Visible Observations; Springer: Berlin/Heidelberg, Germany, 2004; pp. 155–165. [Google Scholar] [CrossRef]
  13. Platt, U.; Stutz, J. Differential Optical Absorption Spectroscopy: Principles and Applications, Physics of Earth and Space Environments; Springer: Berlin/Heidelberg, Germany, 2008. [Google Scholar]
  14. Irie, H.; Takashima, H.; Kanaya, Y.; Boersma, K.F.; Gast, L.; Wittrock, F.; Brunner, D.; Zhou, Y.; Van Roozendael, M. Eight-component retrievals from ground-based MAX-DOAS observations. Atmos. Meas. Tech. 2011, 4, 1027–1044. [Google Scholar] [CrossRef] [Green Version]
  15. Vlemmix, T.; Hendrick, F.; Pinardi, G.; De Smedt, I.; Fayt, C.; Hermans, C.; Piters, A.; Wang, P.; Levelt, P.; Van Roozendael, M. MAX-DOAS observations of aerosols, formaldehyde and nitrogen dioxide in the Beijing area: Comparison of two profile retrieval approaches. Atmos. Meas. Tech. 2015, 8, 941–963. [Google Scholar] [CrossRef] [Green Version]
  16. Bösch, T.; Rozanov, V.; Richter, A.; Peters, E.; Rozanov, A.; Wittrock, F.; Merlaud, A.; Lampel, J.; Schmitt, S.; de Haij, M.; et al. BOREAS—A new MAX-DOAS profile retrieval algorithm for aerosols and trace gases. Atmos. Meas. Tech. 2018, 11, 6833–6859. [Google Scholar] [CrossRef] [Green Version]
  17. Beirle, S.; Dörner, S.; Donner, S.; Remmers, J.; Wang, Y.; Wagner, T. The Mainz profile algorithm (MAPA). Atmos. Meas. Tech. 2019, 12, 1785–1806. [Google Scholar] [CrossRef] [Green Version]
  18. Ma, J.Z.; Beirle, S.; Jin, J.L.; Shaiganfar, R.; Yan, P.; Wagner, T. Tropospheric NO2 vertical column densities over Beijing: Results of the first three years of ground-based MAX-DOAS measurements (2008–2011) and satellite validation. Atmos. Meas. Tech. 2013, 13, 1547–1567. [Google Scholar] [CrossRef] [Green Version]
  19. Wang, Y.; Lampel, J.; Xie, P.; Beirle, S.; Li, A.; Wu, D.; Wagner, T. Ground-based MAX-DOAS observations of tropospheric aerosols, NO2, SO2 and HCHO in Wuxi, China, from 2011 to 2014. Atmos. Chem. Phys. 2017, 17, 2189–2215. [Google Scholar] [CrossRef] [Green Version]
  20. Drosoglou, T.; Bais, A.F.; Zyrichidou, I.; Kouremeti, N.; Poupkou, A.; Liora, N.; Giannaros, C.; Koukouli, M.E.; Balis, D.; Melas, D. Comparisons of ground-based tropospheric NO2 MAX-DOAS measurements to satellite observations with the aid of an air quality model over the Thessaloniki area, Greece. Atmos. Meas. Tech. 2017, 17, 5829–5849. [Google Scholar] [CrossRef] [Green Version]
  21. Pinardi, G.; Van Roozendael, M.; Hendrick, F.; Theys, N.; Abuhassan, N.; Bais, A.; Boersma, F.; Cede, A.; Chong, J.; Donner, S.; et al. Validation of tropospheric NO2 column meas-urements of GOME-2A and OMI using MAX-DOAS and direct sun network observations. Atmos. Meas. Tech. 2020, 13, 6141–6174. [Google Scholar] [CrossRef]
  22. Verhoelst, T.; Compernolle, S.; Pinardi, G.; Lambert, J.-C.; Eskes, H.J.; Eichmann, K.-U.; Fjæraa, A.M.; Granville, J.; Niemeijer, S.; Cede, A.; et al. Ground-based validation of the Copernicus Sentinel-5P TROPOMI NO2 measurements with the NDACC ZSL-DOAS, MAX-DOAS and Pandonia global networks. Atmos. Meas. Tech. 2021, 14, 481–510. [Google Scholar] [CrossRef]
  23. Burrows, J.P.; Weber, M.; Buchwitz, M.; Rozanov, V.; Ladstätter-Weißenmayer, A.; Richter, A.; DeBeek, R.; Hoogen, R.; Bramstedt, K.; Eichmann, K.-U.; et al. The Global Ozone Monitoring Experiment (GOME): Mission Concept and First Scientific Results. J. Atmos. Sci. 1999, 56, 151–175. [Google Scholar] [CrossRef]
  24. Bovensmann, H.; Burrows, J.P.; Buchwitz, M.; Frerick, J.; Noël, S.; Rozanov, V.V.; Chance, K.V.; Goede, A.P.H. SCI-AMACHY: Mission Objectives and Measurement Modes. J. Atmos. Sci. 1999, 56, 127–150. [Google Scholar] [CrossRef]
  25. Levelt, P.; van den Oord, G.; Dobber, M.; Malkki, A.; Visser, H.; de Vries, J.; Stammes, P.; Lundell, J.; Saari, H. The ozone monitoring instrument. IEEE Trans. Geosci. Remote Sens. 2006, 44, 1093–1101. [Google Scholar] [CrossRef]
  26. Munro, R.; Lang, R.; Klaes, D.; Poli, G.; Retscher, C.; Lindstrot, R.; Huckle, R.; Lacan, A.; Grzegorski, M.; Holdak, A.; et al. The GOME-2 instrument on the Metop series of satellites: Instrument design, calibration, and level 1 data processing—An overview. Atmos. Meas. Tech. 2016, 9, 1279–1301. [Google Scholar] [CrossRef] [Green Version]
  27. Veefkind, J.; Aben, I.; McMullan, K.; Förster, H.; de Vries, J.; Otter, G.; Claas, J.; Eskes, H.; de Haan, J.; Kleipool, Q.; et al. TROPOMI on the ESA Sentinel-5 Precursor: A GMES mission for global observations of the atmospheric composition for climate, air quality and ozone layer applications. Remote Sens. Environ. 2012, 120, 70–83. [Google Scholar] [CrossRef]
  28. Goldberg, D.L.; Lu, Z.; Streets, D.G.; de Foy, B.; Griffin, D.; McLinden, C.A.; Lamsal, L.N.; Krotkov, N.A.; Eskes, H. Enhanced Capabilities of TROPOMI NO2: Estimating NOX from North American Cities and Power Plants. Environ. Sci. Technol. 2019, 53, 12594–12601. [Google Scholar] [CrossRef]
  29. Lorente, A.; Boersma, K.F.; Eskes, H.J.; Veefkind, J.P.; van Geffen, J.H.G.M.; de Zeeuw, M.B.; Denier van der Gon, H.A.C.; Beirle, S.; Krol, M.C. Quantification of nitrogen oxides emissions from build-up of pollution over Paris with TROPOMI. Sci. Rep. 2019, 9, 20033. [Google Scholar] [CrossRef] [Green Version]
  30. Bauwens, M.; Compernolle, S.; Stavrakou, T.; Müller, J.-F.; Van Gent, J.; Eskes, H.; Levelt, P.F.; Van Der, A.R.; Veefkind, J.P.; Vlietinck, J.; et al. Impact of Coronavirus Outbreak on NO2 Pollution Assessed Using TROPOMI and OMI Observations. Geophys. Res. Lett. 2020, 47, e2020GL087978. [Google Scholar] [CrossRef] [PubMed]
  31. Levelt, P.F.; Zweers, D.C.S.; Aben, I.; Bauwens, M.; Borsdorff, T.; De Smedt, I.; Eskes, H.J.; Lerot, C.; Loyola, D.G.; Romahn, F.; et al. Air quality impacts of COVID-19 lockdown measures detected from space using high spatial resolution observations of multiple trace gases from Sentinel-5P/TROPOMI. Atmos. Meas. Tech. 2022, 22, 10319–10351. [Google Scholar] [CrossRef]
  32. Kreher, K.; Van Roozendael, M.; Hendrick, F.; Apituley, A.; Dimitropoulou, E.; Frieß, U.; Richter, A.; Wagner, T.; Lampel, J.; Abuhassan, N.; et al. Intercomparison of NO2, O4, O3 and HCHO slant column measurements by MAX-DOAS and zenith-sky UV–visible spec-trometers during CINDI-2. Atmos. Meas. Tech. 2020, 13, 2169–2208. [Google Scholar] [CrossRef]
  33. Vandaele, A.; Hermans, C.; Simon, P.; Carleer, M.; Colin, R.; Fally, S.; Mérienne, M.; Jenouvrier, A.; Coquart, B. Meas-urements of the NO2 absorption cross-section from 42 000 cm−1 to 10 000 cm−1 (238–1000 nm) at 220 K and 294 K. J. Quant. Spectrosc. Ra. 1998, 59, 171–184. [Google Scholar] [CrossRef] [Green Version]
  34. Serdyuchenko, A.; Gorshelev, V.; Weber, M.; Chehade, W.; Burrows, J.P. High spectral resolution ozone absorption cross-sections—Part 2: Temperature dependence. Atmos. Meas. Tech. 2014, 7, 625–636. [Google Scholar] [CrossRef] [Green Version]
  35. Thalman, R.; Volkamer, R. Temperature dependent absorption cross-sections of O2–O2 collision pairs between 340 and 630 nm and at atmospherically relevant pressure. Phys. Chem. Chem. Phys. 2013, 15, 15371–15381. [Google Scholar] [CrossRef] [PubMed]
  36. Rothman, L.S.; Gordon, I.E.; Barber, R.J.; Dothe, H.; Gamache, R.R.; Goldman, A.; Perevalov, V.; Tashkun, S.A.; Tennyson, J. HITEMP, the high-temperature molecular spectroscopic database. J. Quant. Spectrosc. Radiat. Transf. 2010, 111, 2139–2150. [Google Scholar] [CrossRef]
  37. Chance, K.V.; Spurr, R.J.D. Ring effect studies: Rayleigh scattering, including molecular parameters for rotational Raman scattering, and the Fraunhofer spectrum. Appl. Opt. 1997, 36, 5224–5230. [Google Scholar] [CrossRef] [Green Version]
  38. Friedrich, M.M.; Rivera, C.; Stremme, W.; Ojeda, Z.; Arellano, J.; Bezanilla, A.; García-Reynoso, J.A.; Grutter, M. NO2 vertical profiles and column densities from MAX-DOAS measurements in Mexico City. Atmos. Meas. Tech. 2019, 12, 2545–2565. [Google Scholar] [CrossRef] [Green Version]
  39. Karagkiozidis, D.; Friedrich, M.M.; Beirle, S.; Bais, A.; Hendrick, F.; Voudouri, K.A.; Fountoulakis, I.; Karanikolas, A.; Tzoumaka, P.; Van Roozendael, M.; et al. Retrieval of tropospheric aerosol, NO2, and HCHO vertical profiles from MAX-DOAS observations over Thessaloniki, Greece: Intercomparison and validation of two inversion algo-rithms. Atmos. Meas. Tech. 2022, 15, 1269–1301. [Google Scholar] [CrossRef]
  40. Poupkou, A.; Nastos, P.; Melas, D.; Zerefos, C. Climatology of Discomfort Index and Air Quality Index in a Large Urban Mediterranean Agglomeration. Water Air Soil Pollut. 2011, 222, 163–183. [Google Scholar] [CrossRef]
  41. Koukouli, M.-E.; Skoulidou, I.; Karavias, A.; Parcharidis, I.; Balis, D.; Manders, A.; Segers, A.; Eskes, H.; van Geffen, J. Sudden changes in nitrogen dioxide emissions over Greece due to lockdown after the outbreak of COVID-19. Atmos. Meas. Tech. 2021, 21, 1759–1774. [Google Scholar] [CrossRef]
  42. Koukouli, M.-E.; Pseftogkas, A.; Karagkiozidis, D.; Skoulidou, I.; Drosoglou, T.; Balis, D.; Bais, A.; Melas, D.; Hatzianastassiou, N. Air Quality in Two Northern Greek Cities Revealed by Their Tropospheric NO2 Levels. Atmosphere 2022, 13, 840. [Google Scholar] [CrossRef]
  43. Skoulidou, I.; Koukouli, M.-E.; Manders, A.; Segers, A.; Karagkiozidis, D.; Gratsea, M.; Balis, D.; Bais, A.; Gerasopoulos, E.; Stavrakou, T.; et al. Evaluation of the LOTOS-EUROS NO2 simulations using ground-based measurements and S5P/TROPOMI observations over Greece. Atmos. Meas. Tech. 2021, 21, 5269–5288. [Google Scholar] [CrossRef]
  44. Hendrick, F.; Müller, J.-F.; Clémer, K.; Wang, P.; De Mazière, M.; Fayt, C.; Gielen, C.; Hermans, C.; Ma, J.Z.; Pinardi, G.; et al. Four years of ground-based MAX-DOAS observations of HONO and NO2 in the Beijing area. Atmos. Chem. Phys. 2014, 14, 765–781. [Google Scholar] [CrossRef] [Green Version]
  45. Blechschmidt, A.-M.; Arteta, J.; Coman, A.; Curier, L.; Eskes, H.; Foret, G.; Gielen, C.; Hendrick, F.; Marécal, V.; Meleux, F.; et al. Comparison of tropospheric NO2 columns from MAX-DOAS re-trievals and regional air quality model simulations. Atmos. Chem. Phys. 2020, 20, 2795–2823. [Google Scholar] [CrossRef] [Green Version]
  46. Chan, K.L.; Wiegner, M.; van Geffen, J.; De Smedt, I.; Alberti, C.; Cheng, Z.; Ye, S.; Wenig, M. MAX-DOAS measurements of tropospheric NO2 and HCHO in Munich and the comparison to OMI and TROPOMI satellite observations. Atmos. Meas. Tech. 2020, 13, 4499–4520. [Google Scholar] [CrossRef]
  47. Beirle, S.; Boersma, K.F.; Platt, U.; Lawrence, M.G.; Wagner, T. Megacity Emissions and Lifetimes of Nitrogen Oxides Probed from Space. Science 2011, 333, 1737–1739. [Google Scholar] [CrossRef] [PubMed]
  48. Siomos, N.; Balis, D.S.; Voudouri, K.A.; Giannakaki, E.; Filioglou, M.; Amiridis, V.; Papayannis, A.; Fragkos, K. Are EARLINET and AERONET climatologies consistent? The case of Thessaloniki, Greece. Atmos. Meas. Tech. 2018, 18, 11885–11903. [Google Scholar] [CrossRef] [Green Version]
  49. Gratsea, M.; Vrekoussis, M.; Richter, A.; Wittrock, F.; Schönhardt, A.; Burrows, J.; Kazadzis, S.; Mihalopoulos, N.; Gerasopoulos, E. Slant column MAX-DOAS measurements of nitrogen dioxide, formaldehyde, glyoxal and oxygen dimer in the urban environment of Athens. Atmos. Environ. 2016, 135, 118–131. [Google Scholar] [CrossRef]
  50. Schreier, S.F.; Richter, A.; Peters, E.; Ostendorf, M.; Schmalwieser, A.W.; Weihs, P.; Burrows, J.P. Dual ground-based MAX-DOAS observations in Vienna, Austria: Evaluation of horizontal and temporal NO2, HCHO, and CHOCHO distributions and comparison with independent data sets. Atmos. Environ. X 2019, 5, 100059. [Google Scholar] [CrossRef]
  51. Beirle, S.; Platt, U.; Wenig, M.; Wagner, T. Weekly cycle of NO2 by GOME measurements: A signature of anthropogenic sources. Atmos. Chem. Phys. 2003, 3, 2225–2232. [Google Scholar] [CrossRef] [Green Version]
  52. Stavrakou, T.; Müller, J.-F.; Bauwens, M.; Boersma, K.F.; van Geffen, J. Satellite evidence for changes in the NO2 weekly cycle over large cities. Sci. Rep. 2020, 10, 10066. [Google Scholar] [CrossRef]
  53. Goldberg, D.L.; Anenberg, S.C.; Kerr, G.H.; Mohegh, A.; Lu, Z.; Streets, D.G. TROPOMI NO2 in the United States: A Detailed Look at the Annual Averages, Weekly Cycles, Effects of Temperature, and Correlation with Surface NO2 Concen-trations. Earth’s Future 2021, 9, e2020EF001665. [Google Scholar] [CrossRef]
  54. Griffin, D.; Zhao, X.; McLinden, C.A.; Boersma, F.; Bourassa, A.; Dammers, E.; Degenstein, D.; Eskes, H.; Fehr, L.; Fioletov, V.; et al. High-Resolution Mapping of Nitrogen Dioxide With TROPOMI: First Results and Validation Over the Canadian Oil Sands. Geophys. Res. Lett. 2019, 46, 1049–1060. [Google Scholar] [CrossRef] [Green Version]
  55. Dimitropoulou, E.; Hendrick, F.; Pinardi, G.; Friedrich, M.M.; Merlaud, A.; Tack, F.; De Longueville, H.; Fayt, C.; Hermans, C.; Laffineur, Q.; et al. Validation of TROPOMI tropospheric NO2 columns using dual-scan mul-ti-axis differential optical absorption spectroscopy (MAX-DOAS) measurements in Uccle, Brussels. Atmos. Meas. Tech. 2020, 13, 5165–5191. [Google Scholar] [CrossRef]
  56. Zhao, X.; Griffin, D.; Fioletov, V.; McLinden, C.; Cede, A.; Tiefengraber, M.; Müller, M.; Bognar, K.; Strong, K.; Boersma, F.; et al. Assessment of the quality of TROPOMI high-spatial-resolution NO2 data products in the Greater Toronto Area. Atmos. Meas. Tech. 2020, 13, 2131–2159. [Google Scholar] [CrossRef]
  57. Moussiopoulos, N.; Vlachokostas, C.; Tsilingiridis, G.; Douros, I.; Hourdakis, E.; Naneris, C.; Sidiropoulos, C. Air quality status in Greater Thessaloniki Area and the emission reductions needed for attaining the EU air quality legislation. Sci. Total Environ. 2009, 407, 1268–1285. [Google Scholar] [CrossRef]
  58. Kassomenos, P.; Kelessis, A.; Paschalidou, A.; Petrakakis, M. Identification of sources and processes affecting particulate pollution in Thessaloniki, Greece. Atmos. Environ. 2011, 45, 7293–7300. [Google Scholar] [CrossRef]
  59. Giannaros, T.M.; Melas, D. Study of the urban heat island in a coastal Mediterranean City: The case study of Thessaloniki, Greece. Atmos. Res. 2012, 118, 103–120. [Google Scholar] [CrossRef]
Figure 1. The locations of the MAX-DOAS instrument (white star) and the in situ NO2 measurement site (purple triangle). The four different azimuth viewing directions of the MAX-DOAS observations are represented by the solid red lines. The base map is taken from © Google Maps, https://www.google.com/maps, accessed on 20 January 2023.
Applsci 13 02641 g001
Figure 2. The time series of NO2 vertical columns (upper) and surface concentrations (bottom) retrieved by the MAX-DOAS in Thessaloniki, Greece (gray dots represent the daily medians, while the blue and green lines with markers represent the monthly medians for the urban and rural azimuth viewing directions, respectively). The monthly median NO2 surface concentrations measured by the in situ instrument are shown in red (right ordinate). The error bars of the monthly medians represent the variability as the interquartile range.
Applsci 13 02641 g002
Figure 3. The diurnal variability of NO2 surface concentrations revealed by the MAX-DOAS (black) and the in situ (red) measurements for all seasons. The gray-shaded rectangles indicate the range of S5P/TROPOMI overpass times for Thessaloniki.
Applsci 13 02641 g003
Figure 4. The day of week variability of NO2 surface concentrations revealed by the MAX-DOAS (black) and the in situ (red) measurements for all seasons.
Applsci 13 02641 g004
Figure 5. The mean diurnal variability of NO2 vertical columns and surface concentrations derived by the MAX-DOAS observations for each day of the week for the cold and warm periods.
Applsci 13 02641 g005
Figure 6. An example of the NO2 VCDs diurnal variability for all azimuth viewing directions of the MAX-DOAS during a clear-sky summer day (30 July 2022).
Applsci 13 02641 g006
Figure 7. Distribution of the normalized MAX-DOAS measurements of NO2 VCDs (top row) and surface concentrations (bottom row) for all azimuth viewing angles during morning (left column) and noon (right column) hours. Data are presented separately for the cold (blue) and warm (red) periods.
Applsci 13 02641 g007
Figure 8. Time series of monthly mean tropospheric NO2 vertical columns in Thessaloniki from collocated ground-based MAX-DOAS and S5P/TROPOMI observations for the period June 2020–November 2022.
Applsci 13 02641 g008
Figure 9. Scatter plots of the daily collocated tropospheric NO2 VCDs that are reported by the MAX-DOAS and S5P/TROPOMI for all seasons. The gray shaded areas represent the 95% confidence interval of the linear regression fit (solid black line).
Applsci 13 02641 g009
Figure 10. The consolidated comparison of tropospheric NO2 vertical columns (a) between the MAX-DOAS and S5P/TROPOMI for the daily (blue) and monthly mean (red) collocated measurements and the frequency distribution (b) of their absolute differences.
Applsci 13 02641 g010
Table 1. Percentage difference of the median NO2 VCDs and surface concentrations for each azimuth from the average concentration of all azimuths for the morning and noon hours and for the cold and warm periods. The highest differences are marked in bold.
SE (142°)S (185°)SW (220°)W (255°)
cold/warmcold/warmcold/warmcold/warm
MorningNO2 vertical columns−3.2/−0.1%−8.8/−3.9%4.0/−2.0%8.0/6.0%
NO2 surface concentrations0.2/19.4%3.6/−3.3%−1.2/−14.9%−2.6/−1.27%
NoonNO2 vertical columns11.9/24.7%−7.1/−7.7%−0.2/−12.9%−4.5/−4.1%
NO2 surface concentrations14.5/15.8%−6.6/−0.6%−6.4/−17.4%−1.5/2.1%
Disclaimer/Publisher’s Note: The statements, opinions and data contained in all publications are solely those of the individual author(s) and contributor(s) and not of MDPI and/or the editor(s). MDPI and/or the editor(s) disclaim responsibility for any injury to people or property resulting from any ideas, methods, instructions or products referred to in the content.

