
Influence of Optimal Intensity Measures Selection in Engineering Demand Parameter of Fixed Jacket Offshore Platform


Abstract
:1. Introduction
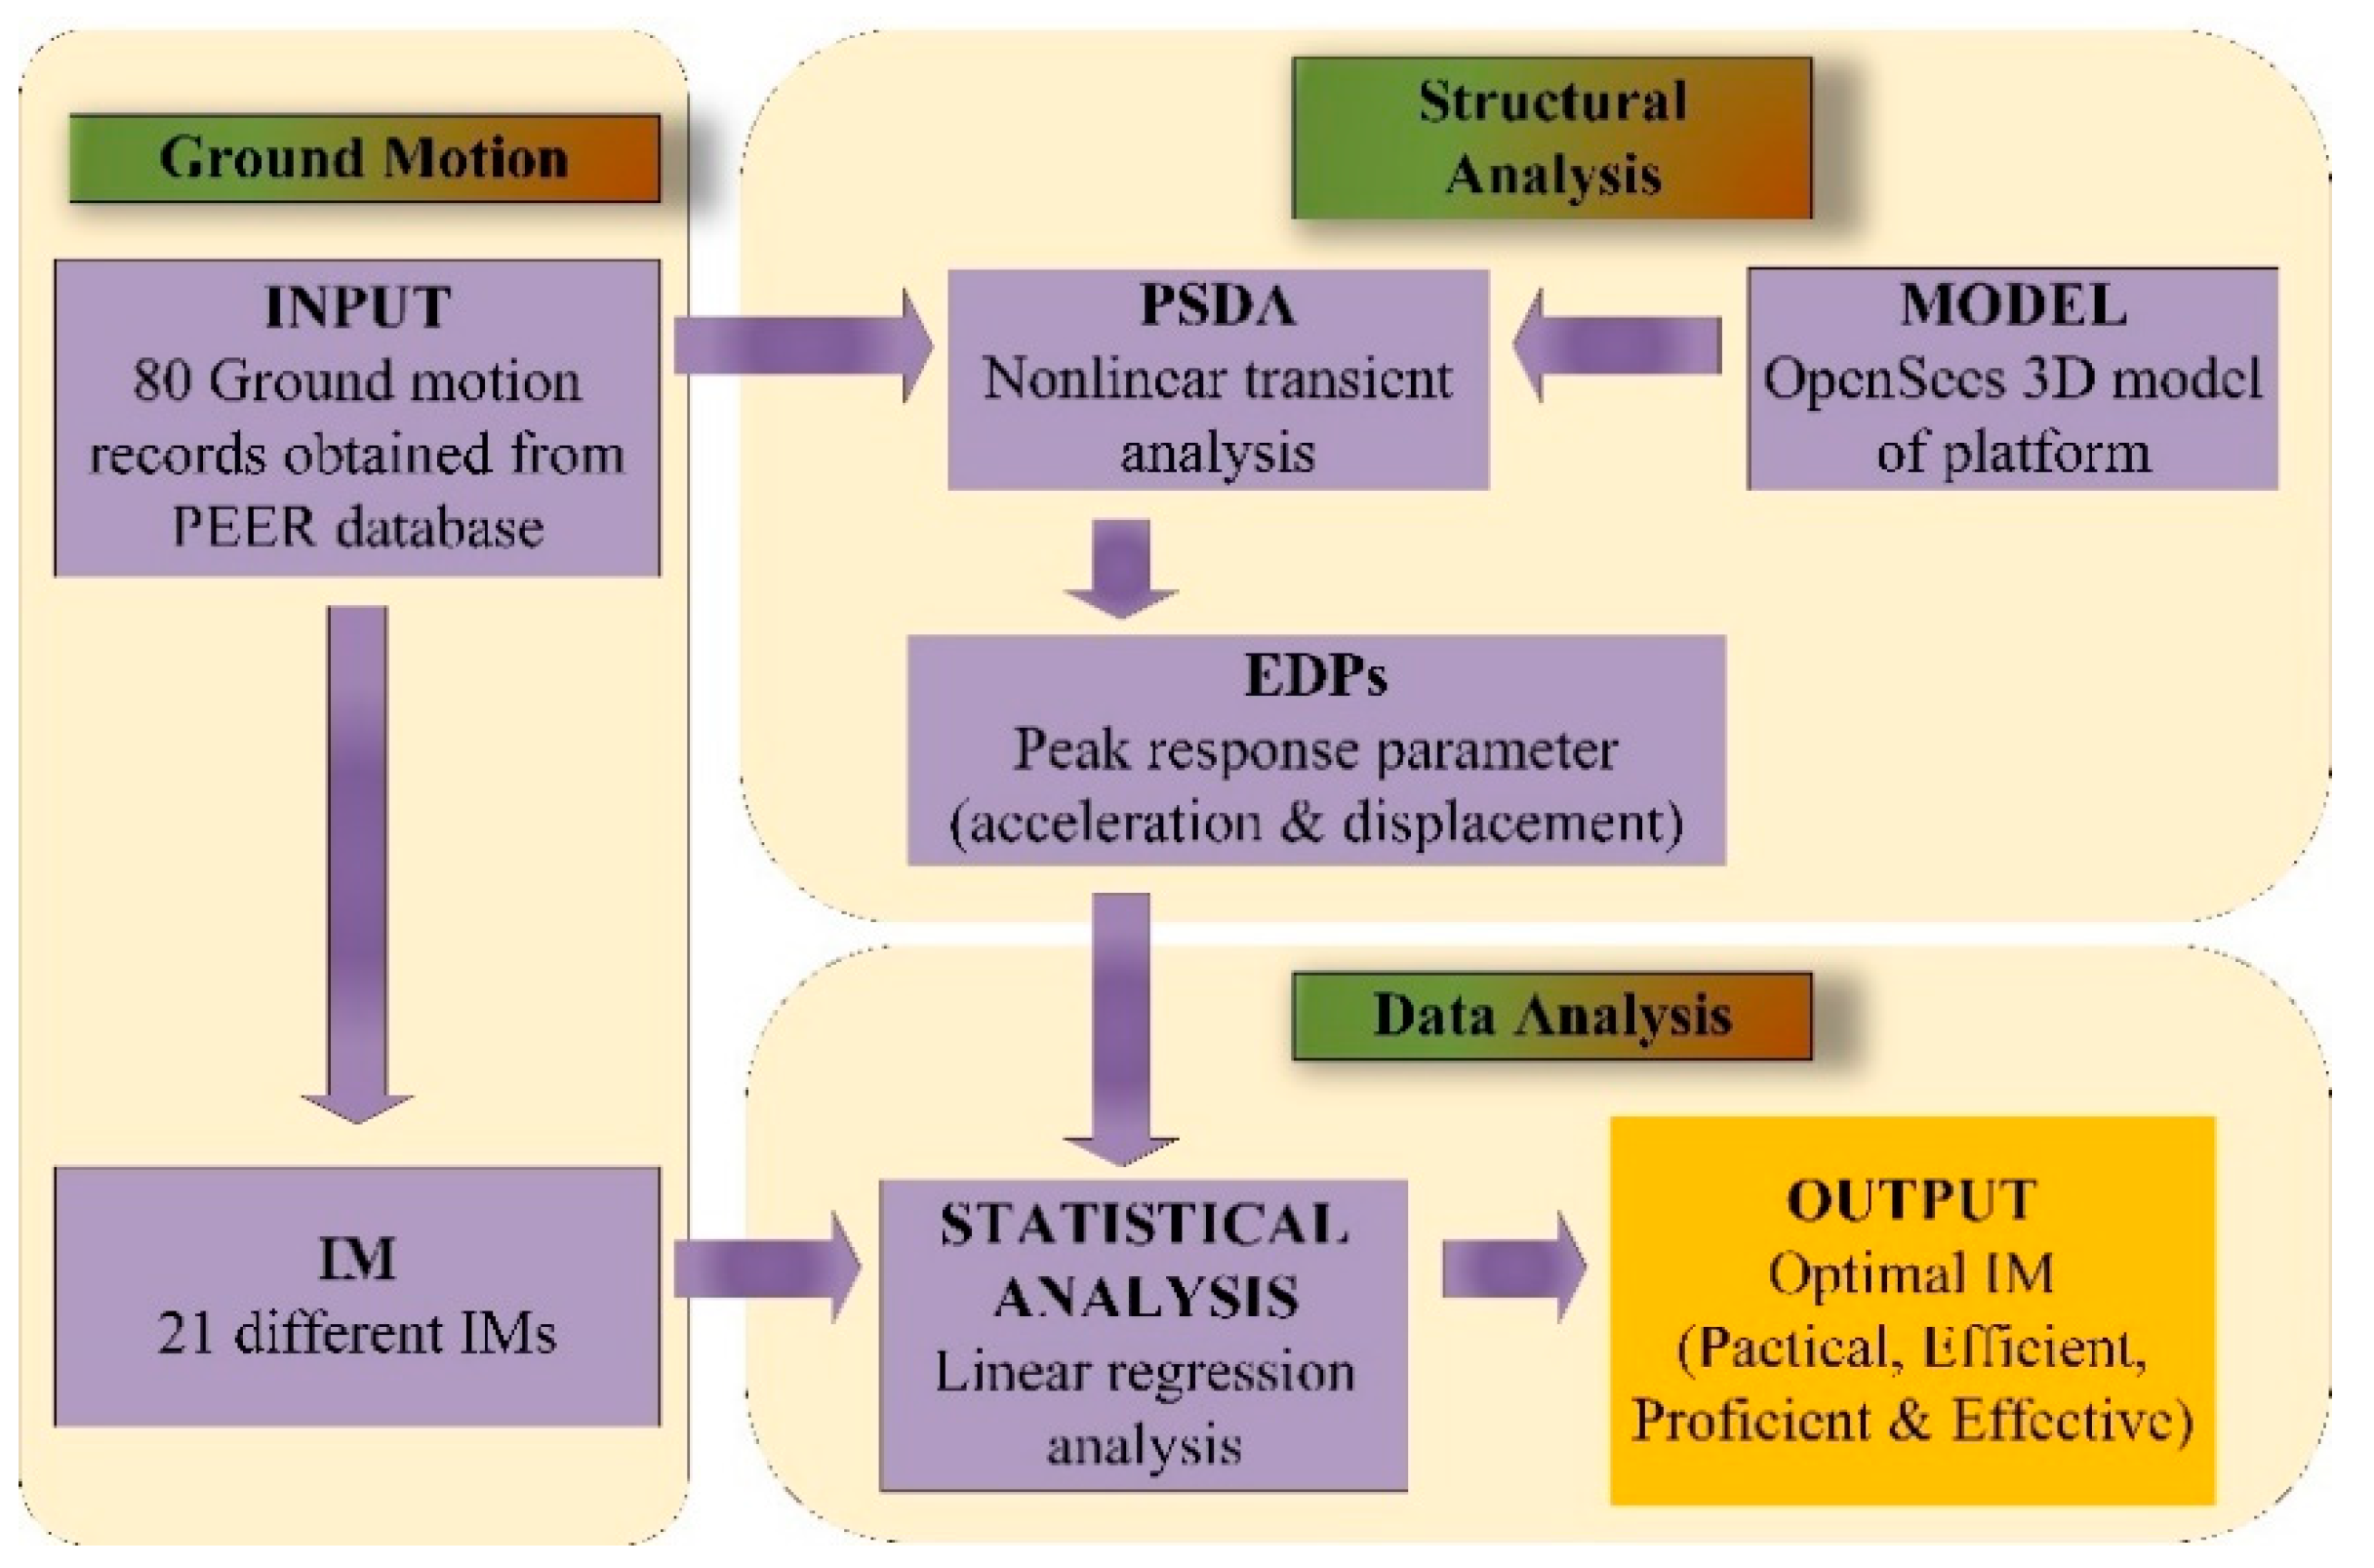
2. Methodology
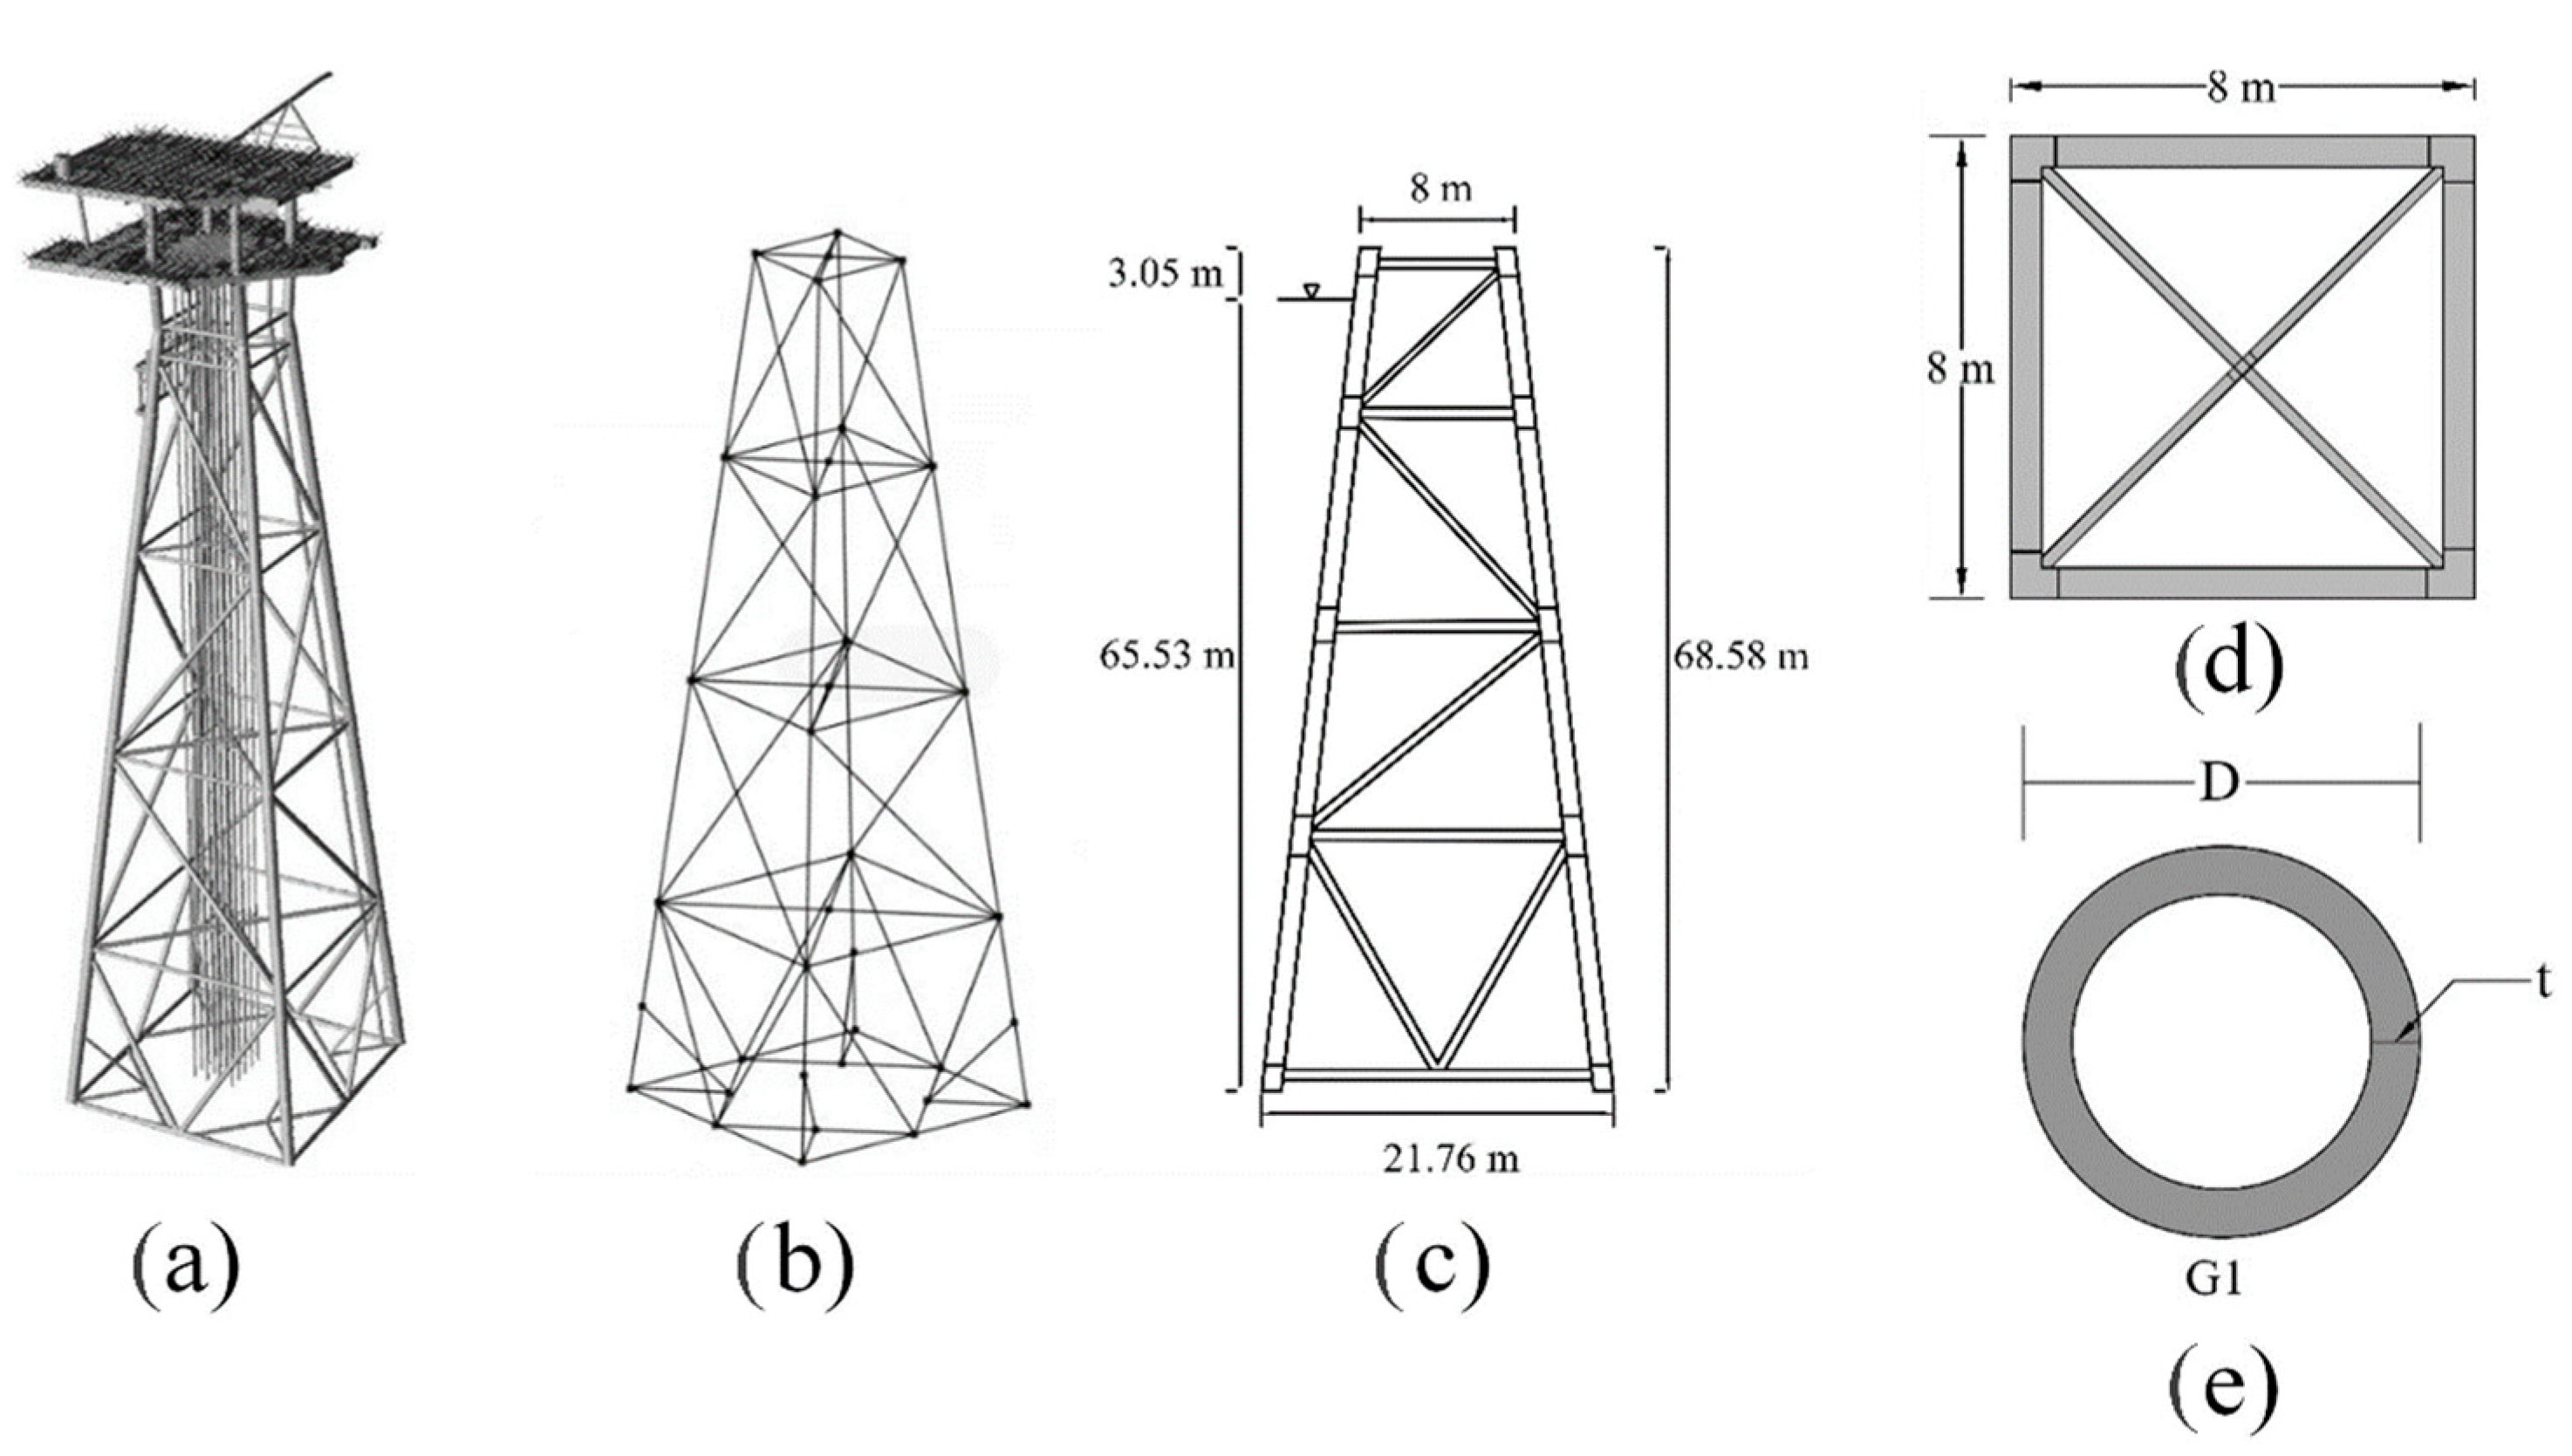
2.1. Description of Model
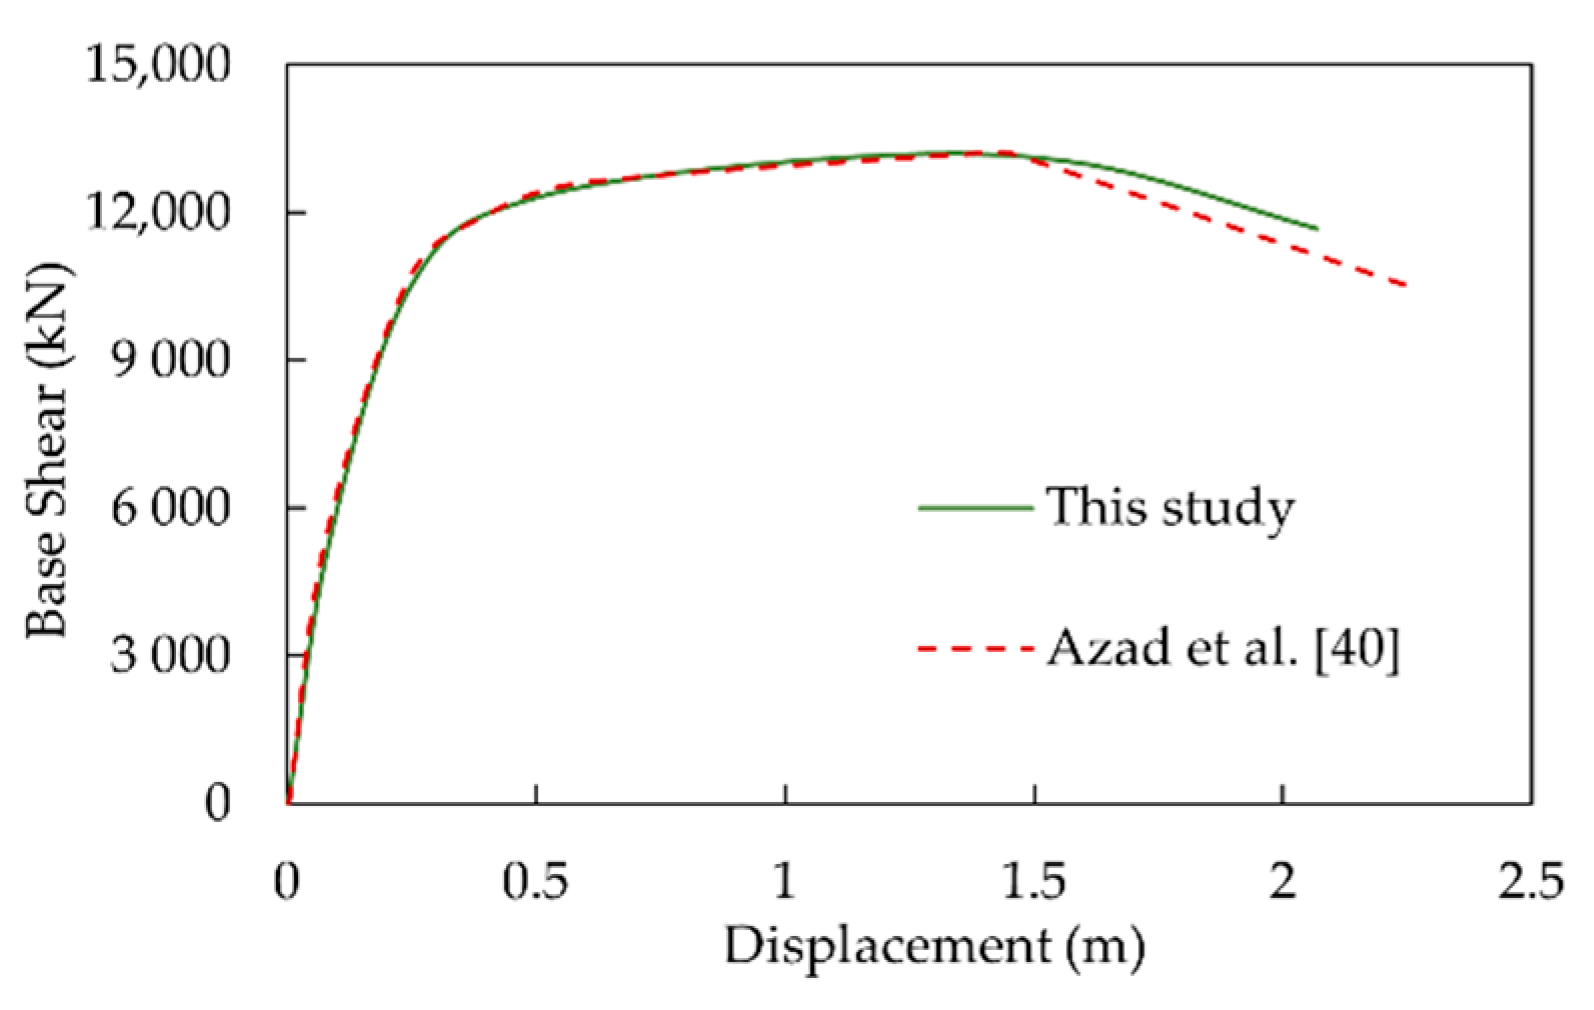
2.2. Validation of the Model
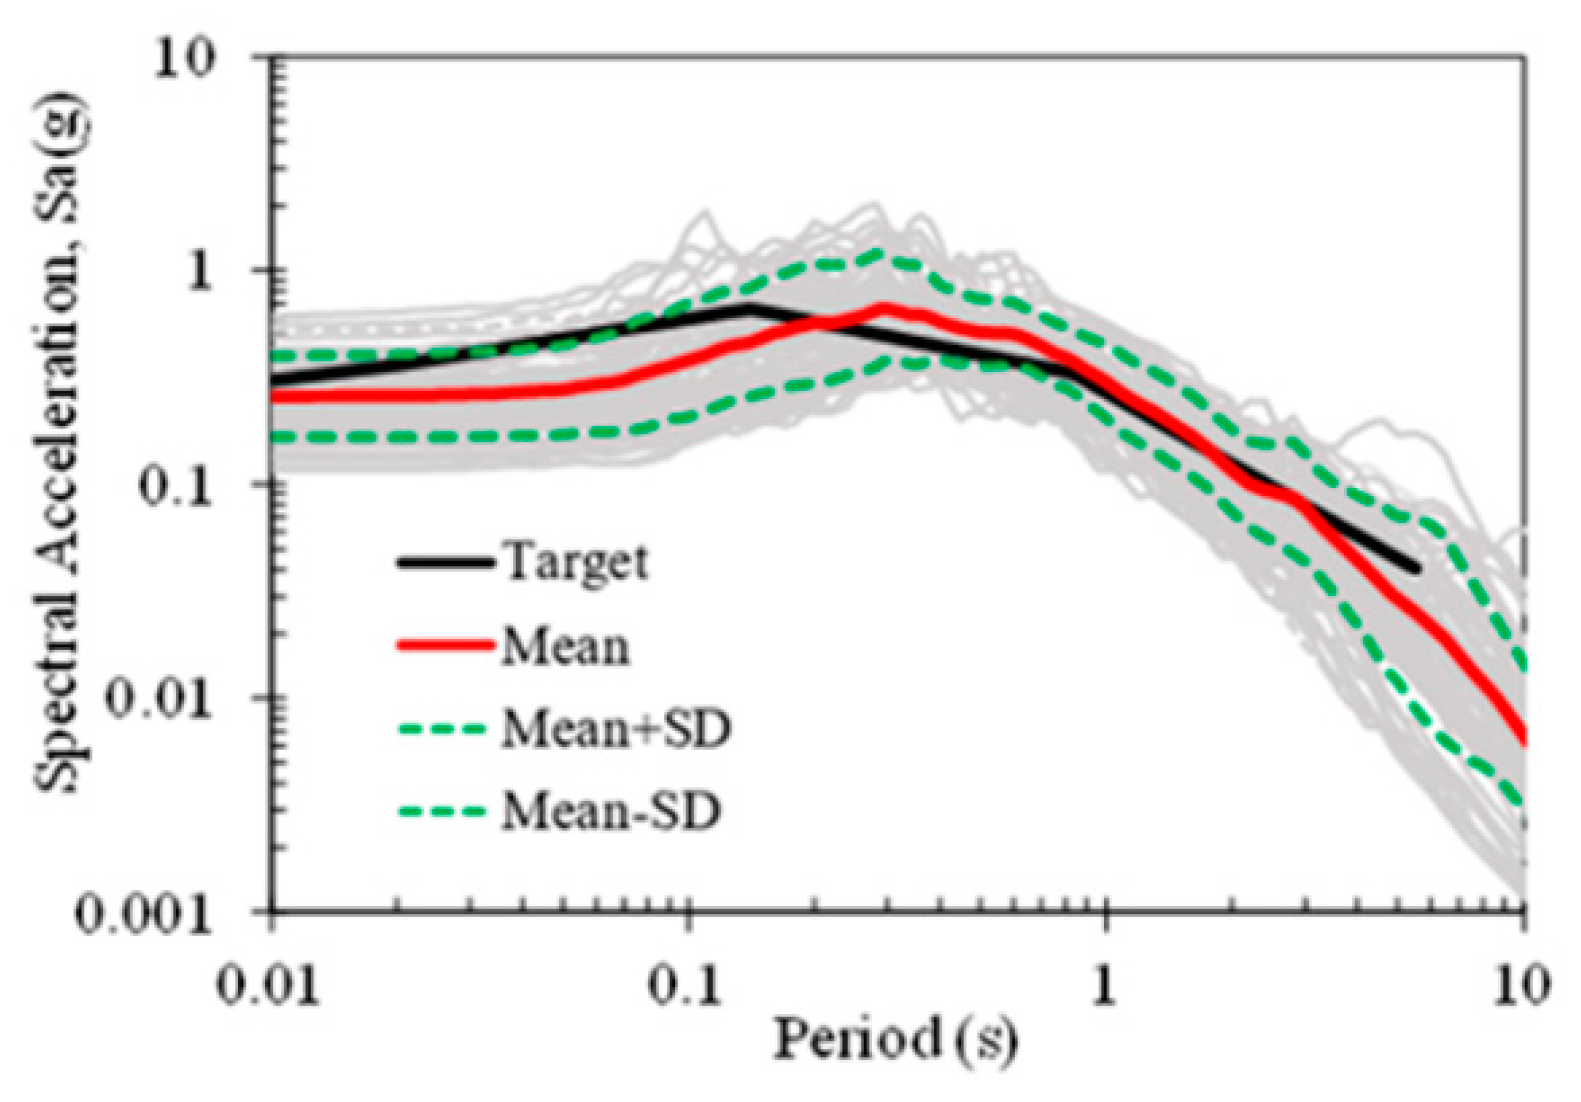
2.3. Ground Motion Selection
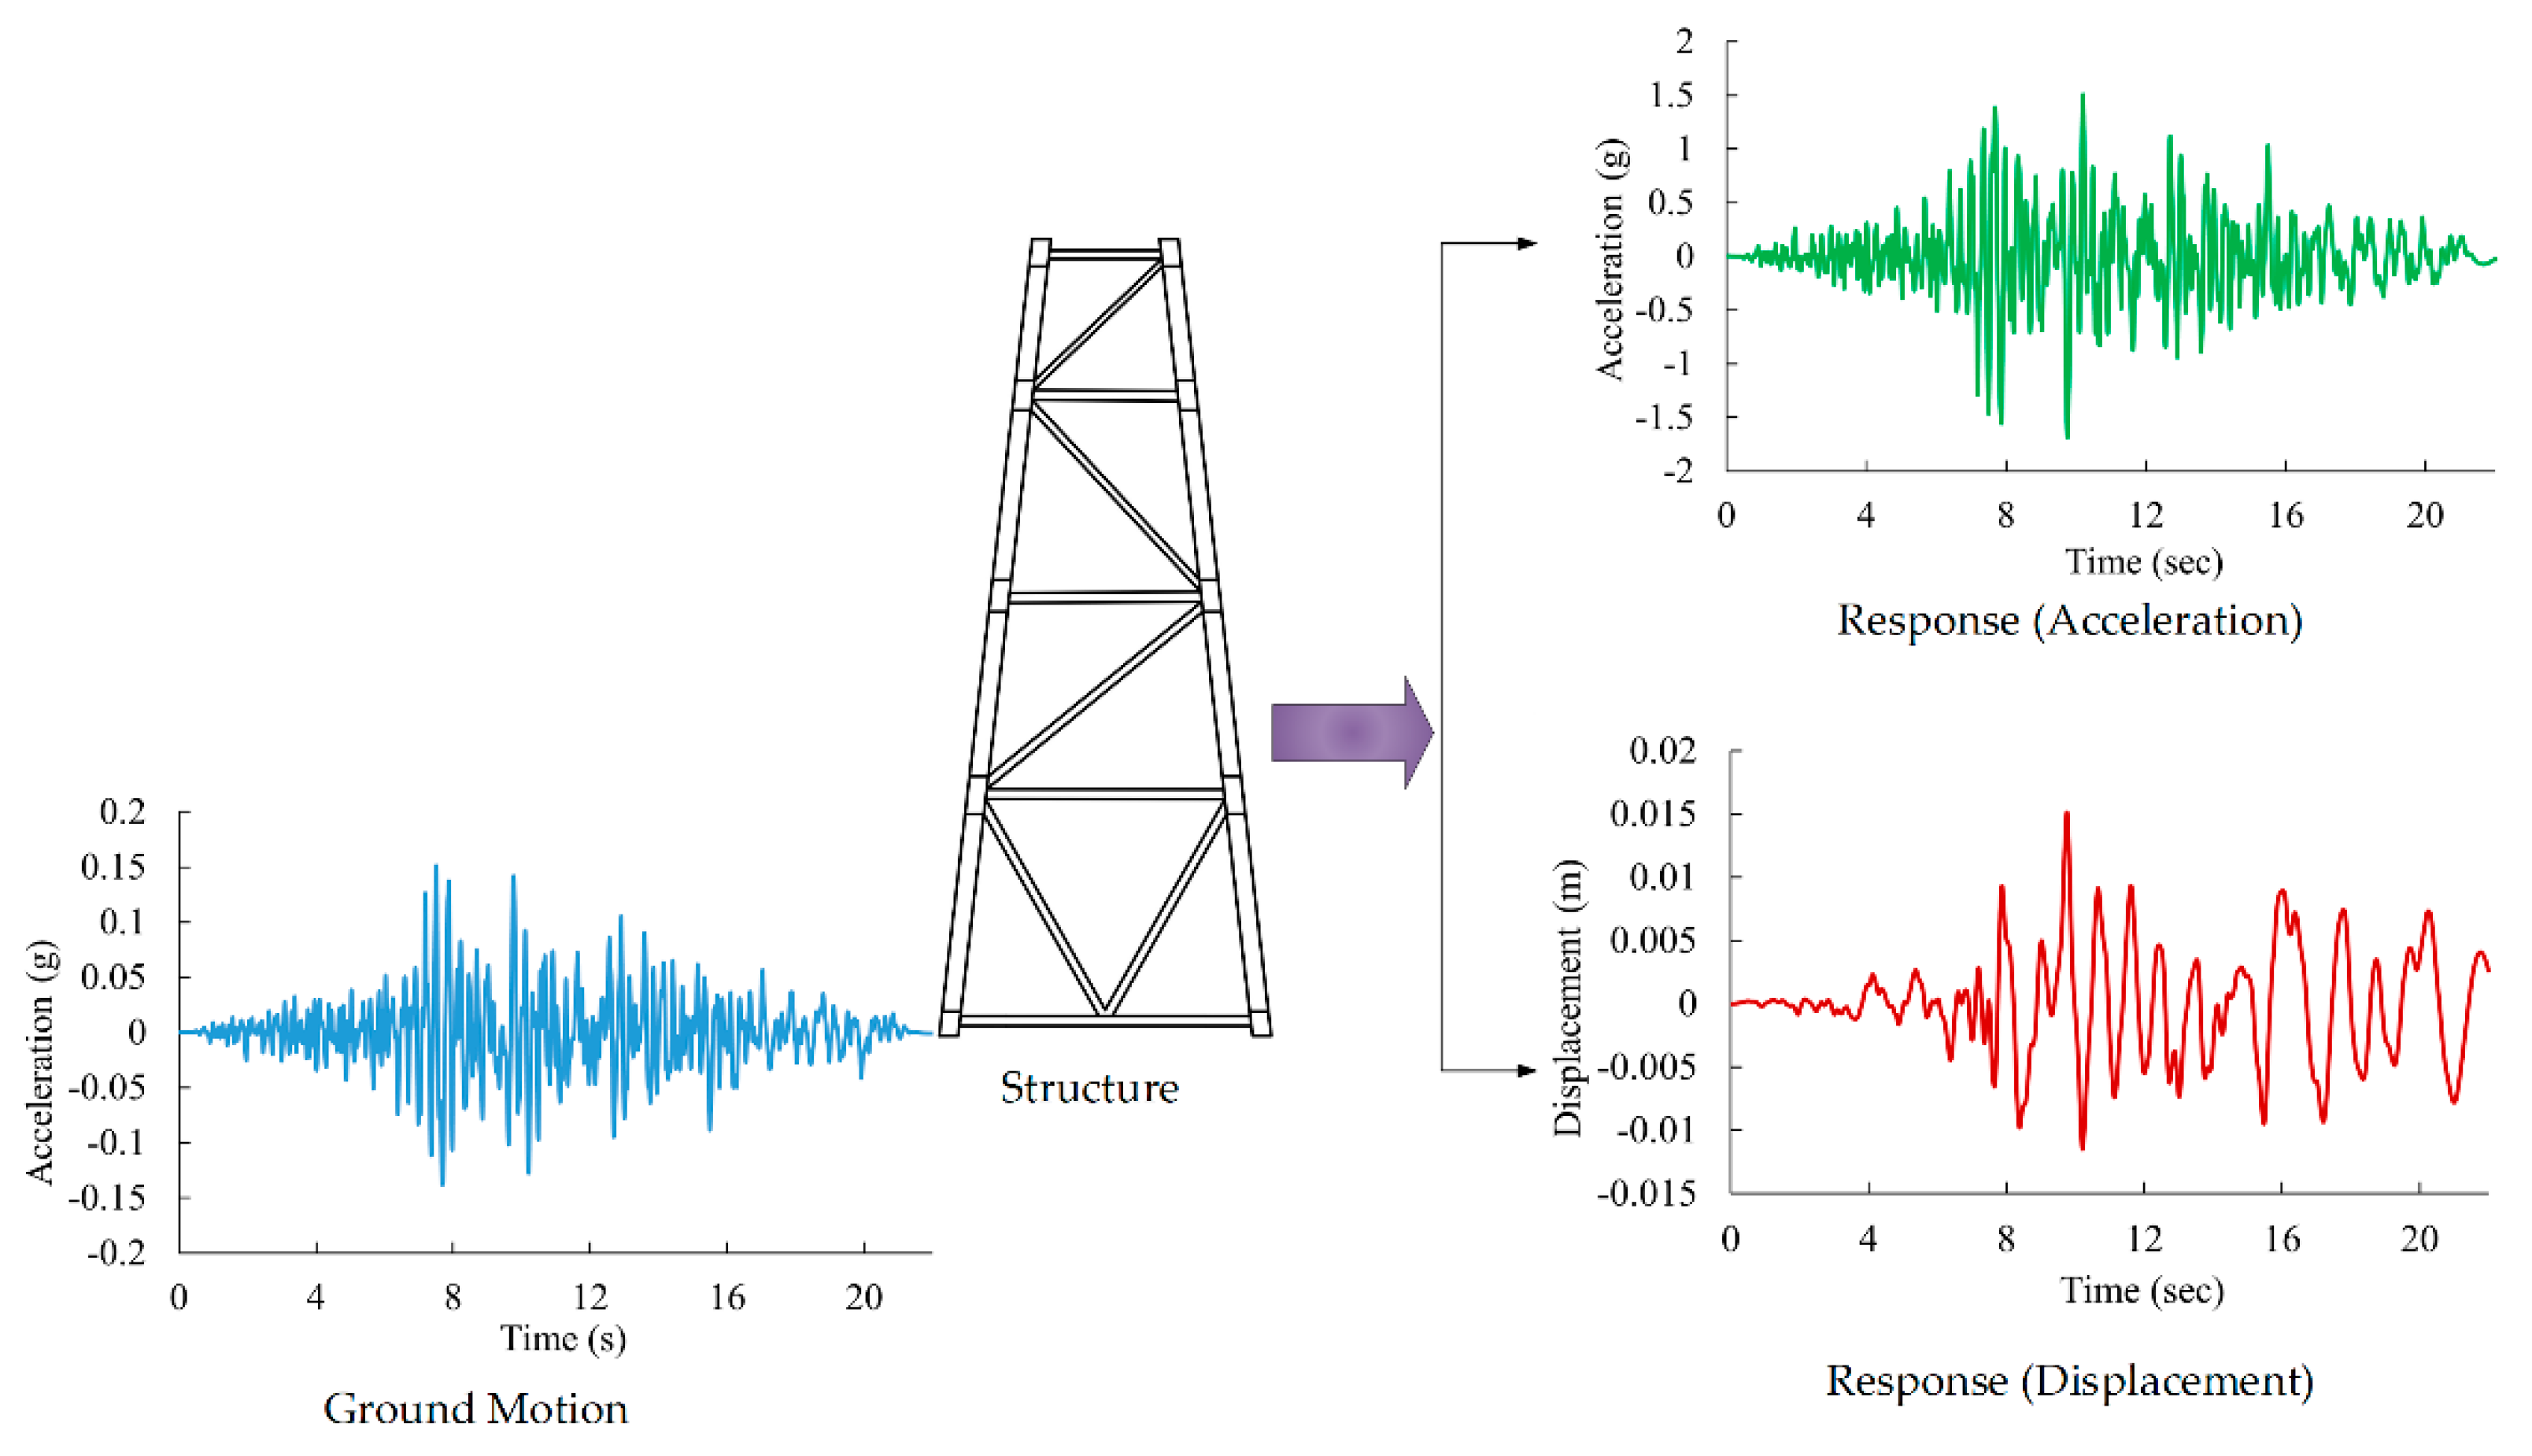
2.4. Finite Element Responses from OpenSees Software
2.5. Intensity Measures Selection
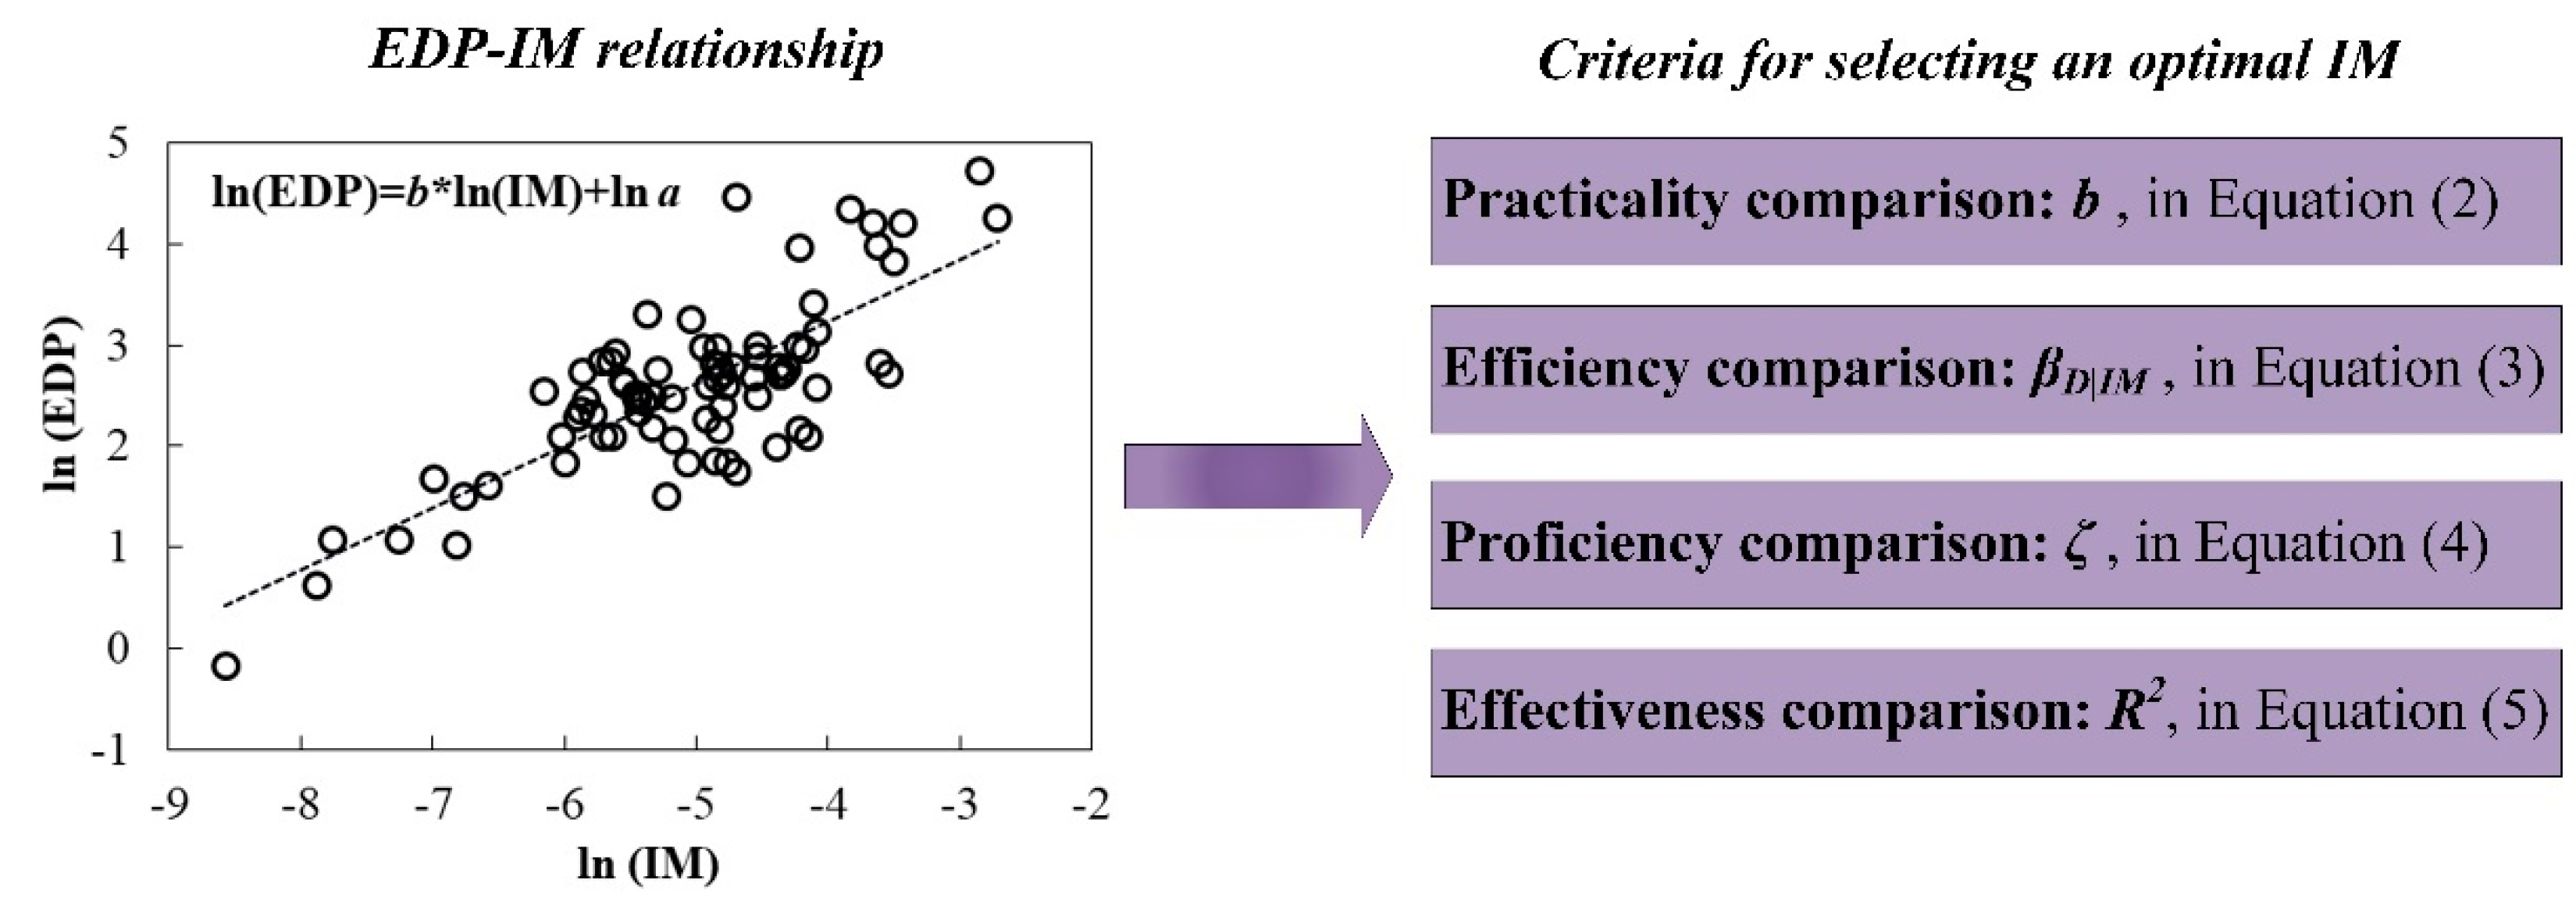
3. Probabilistic Seismic Demand Model
4. Characteristics of Optimal IM
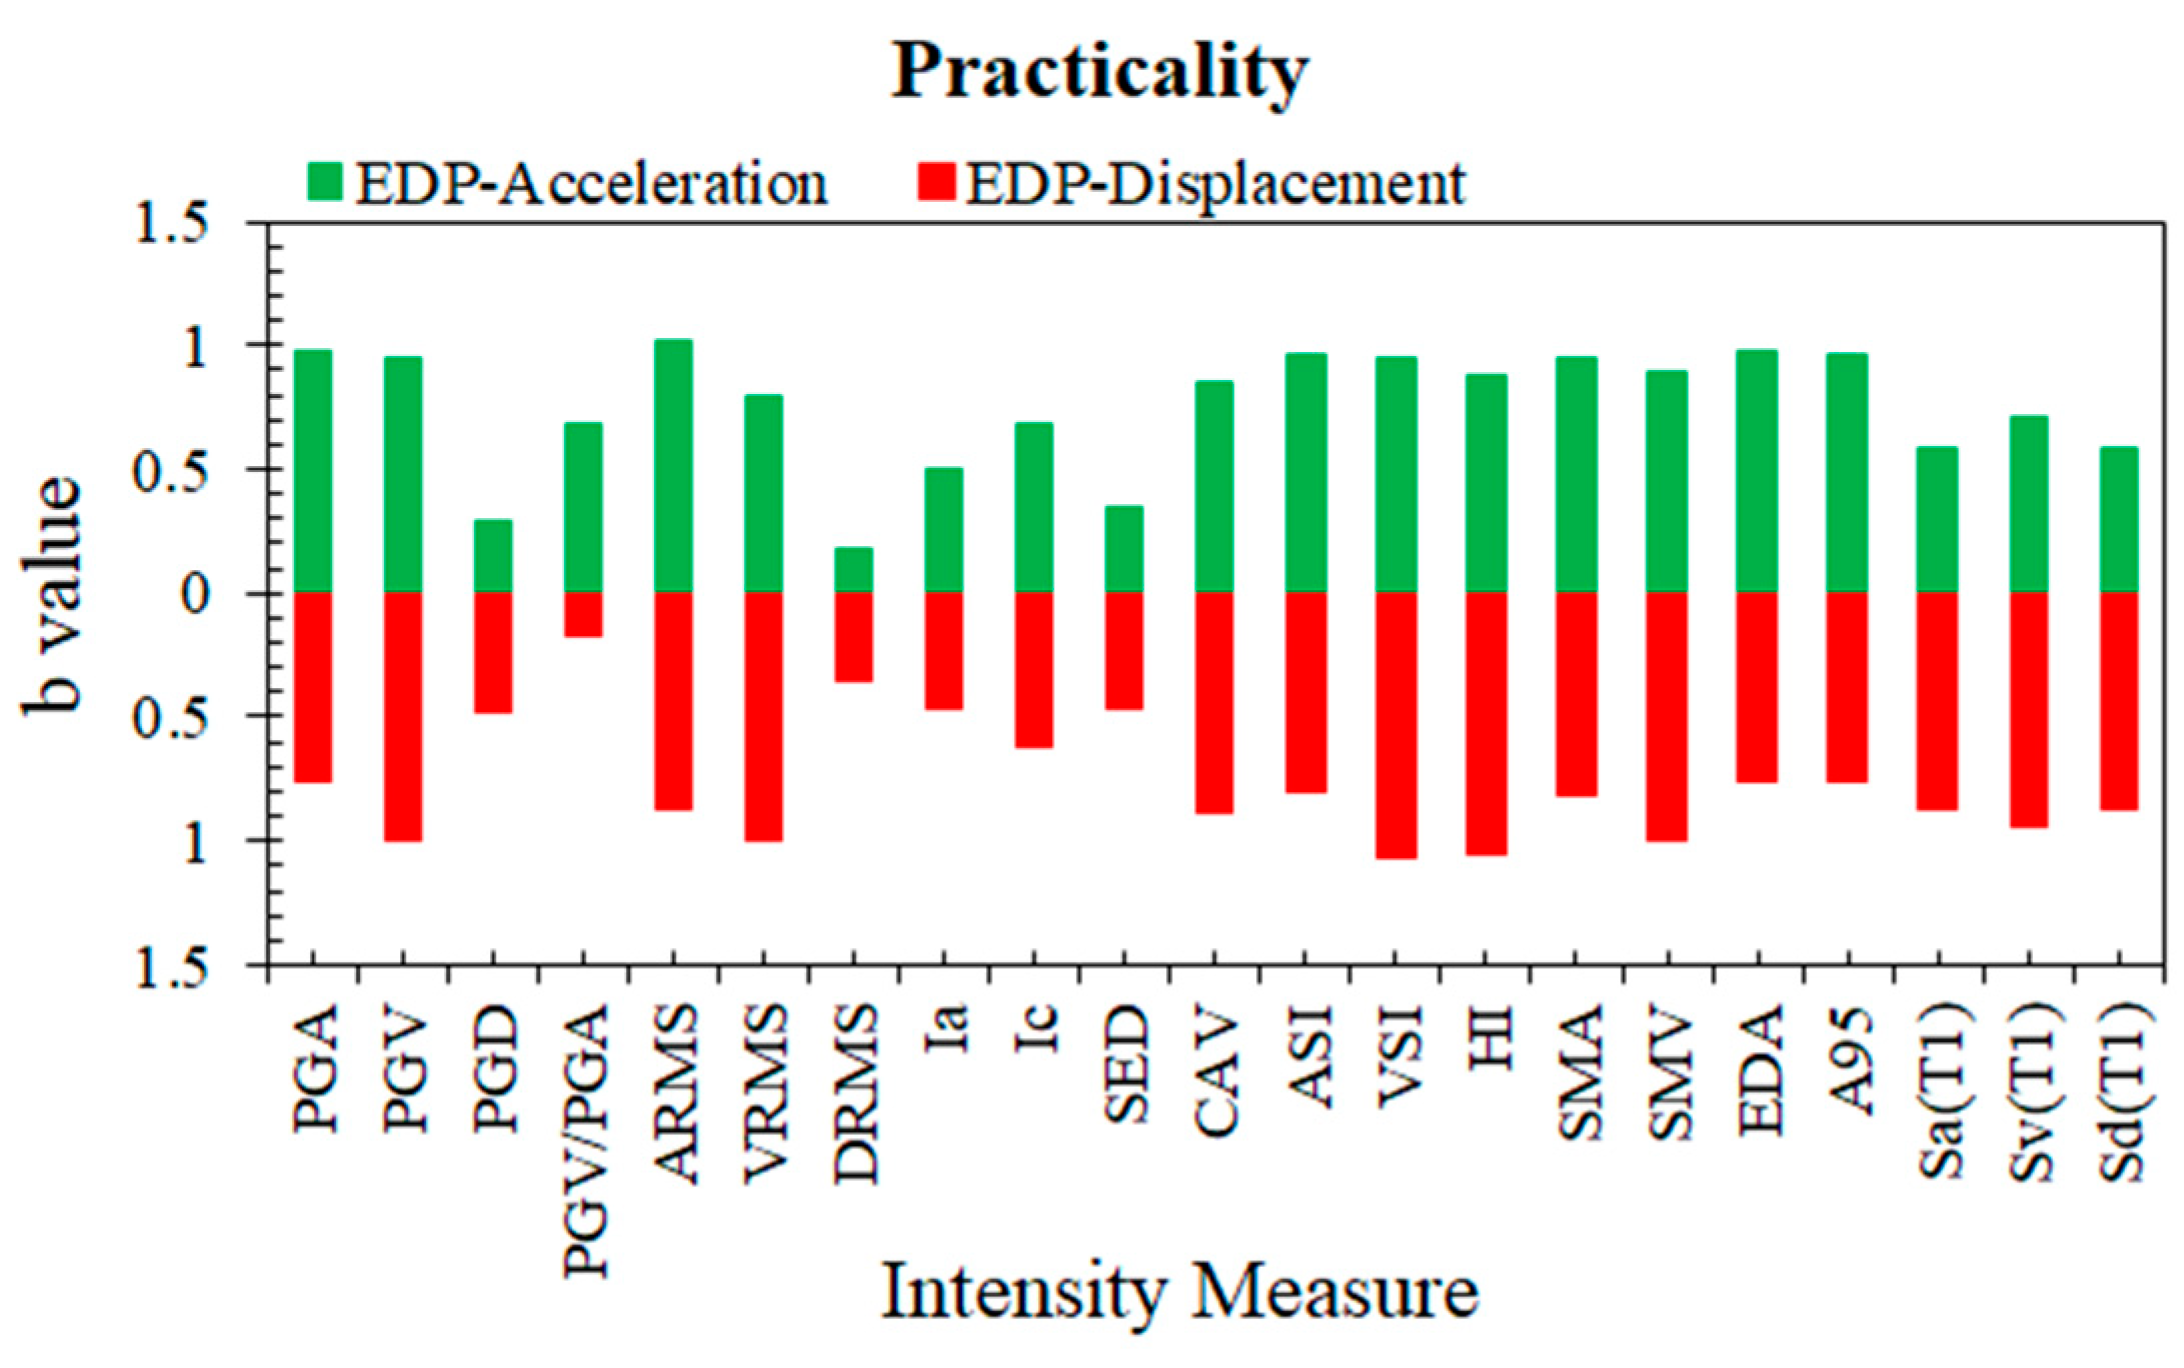
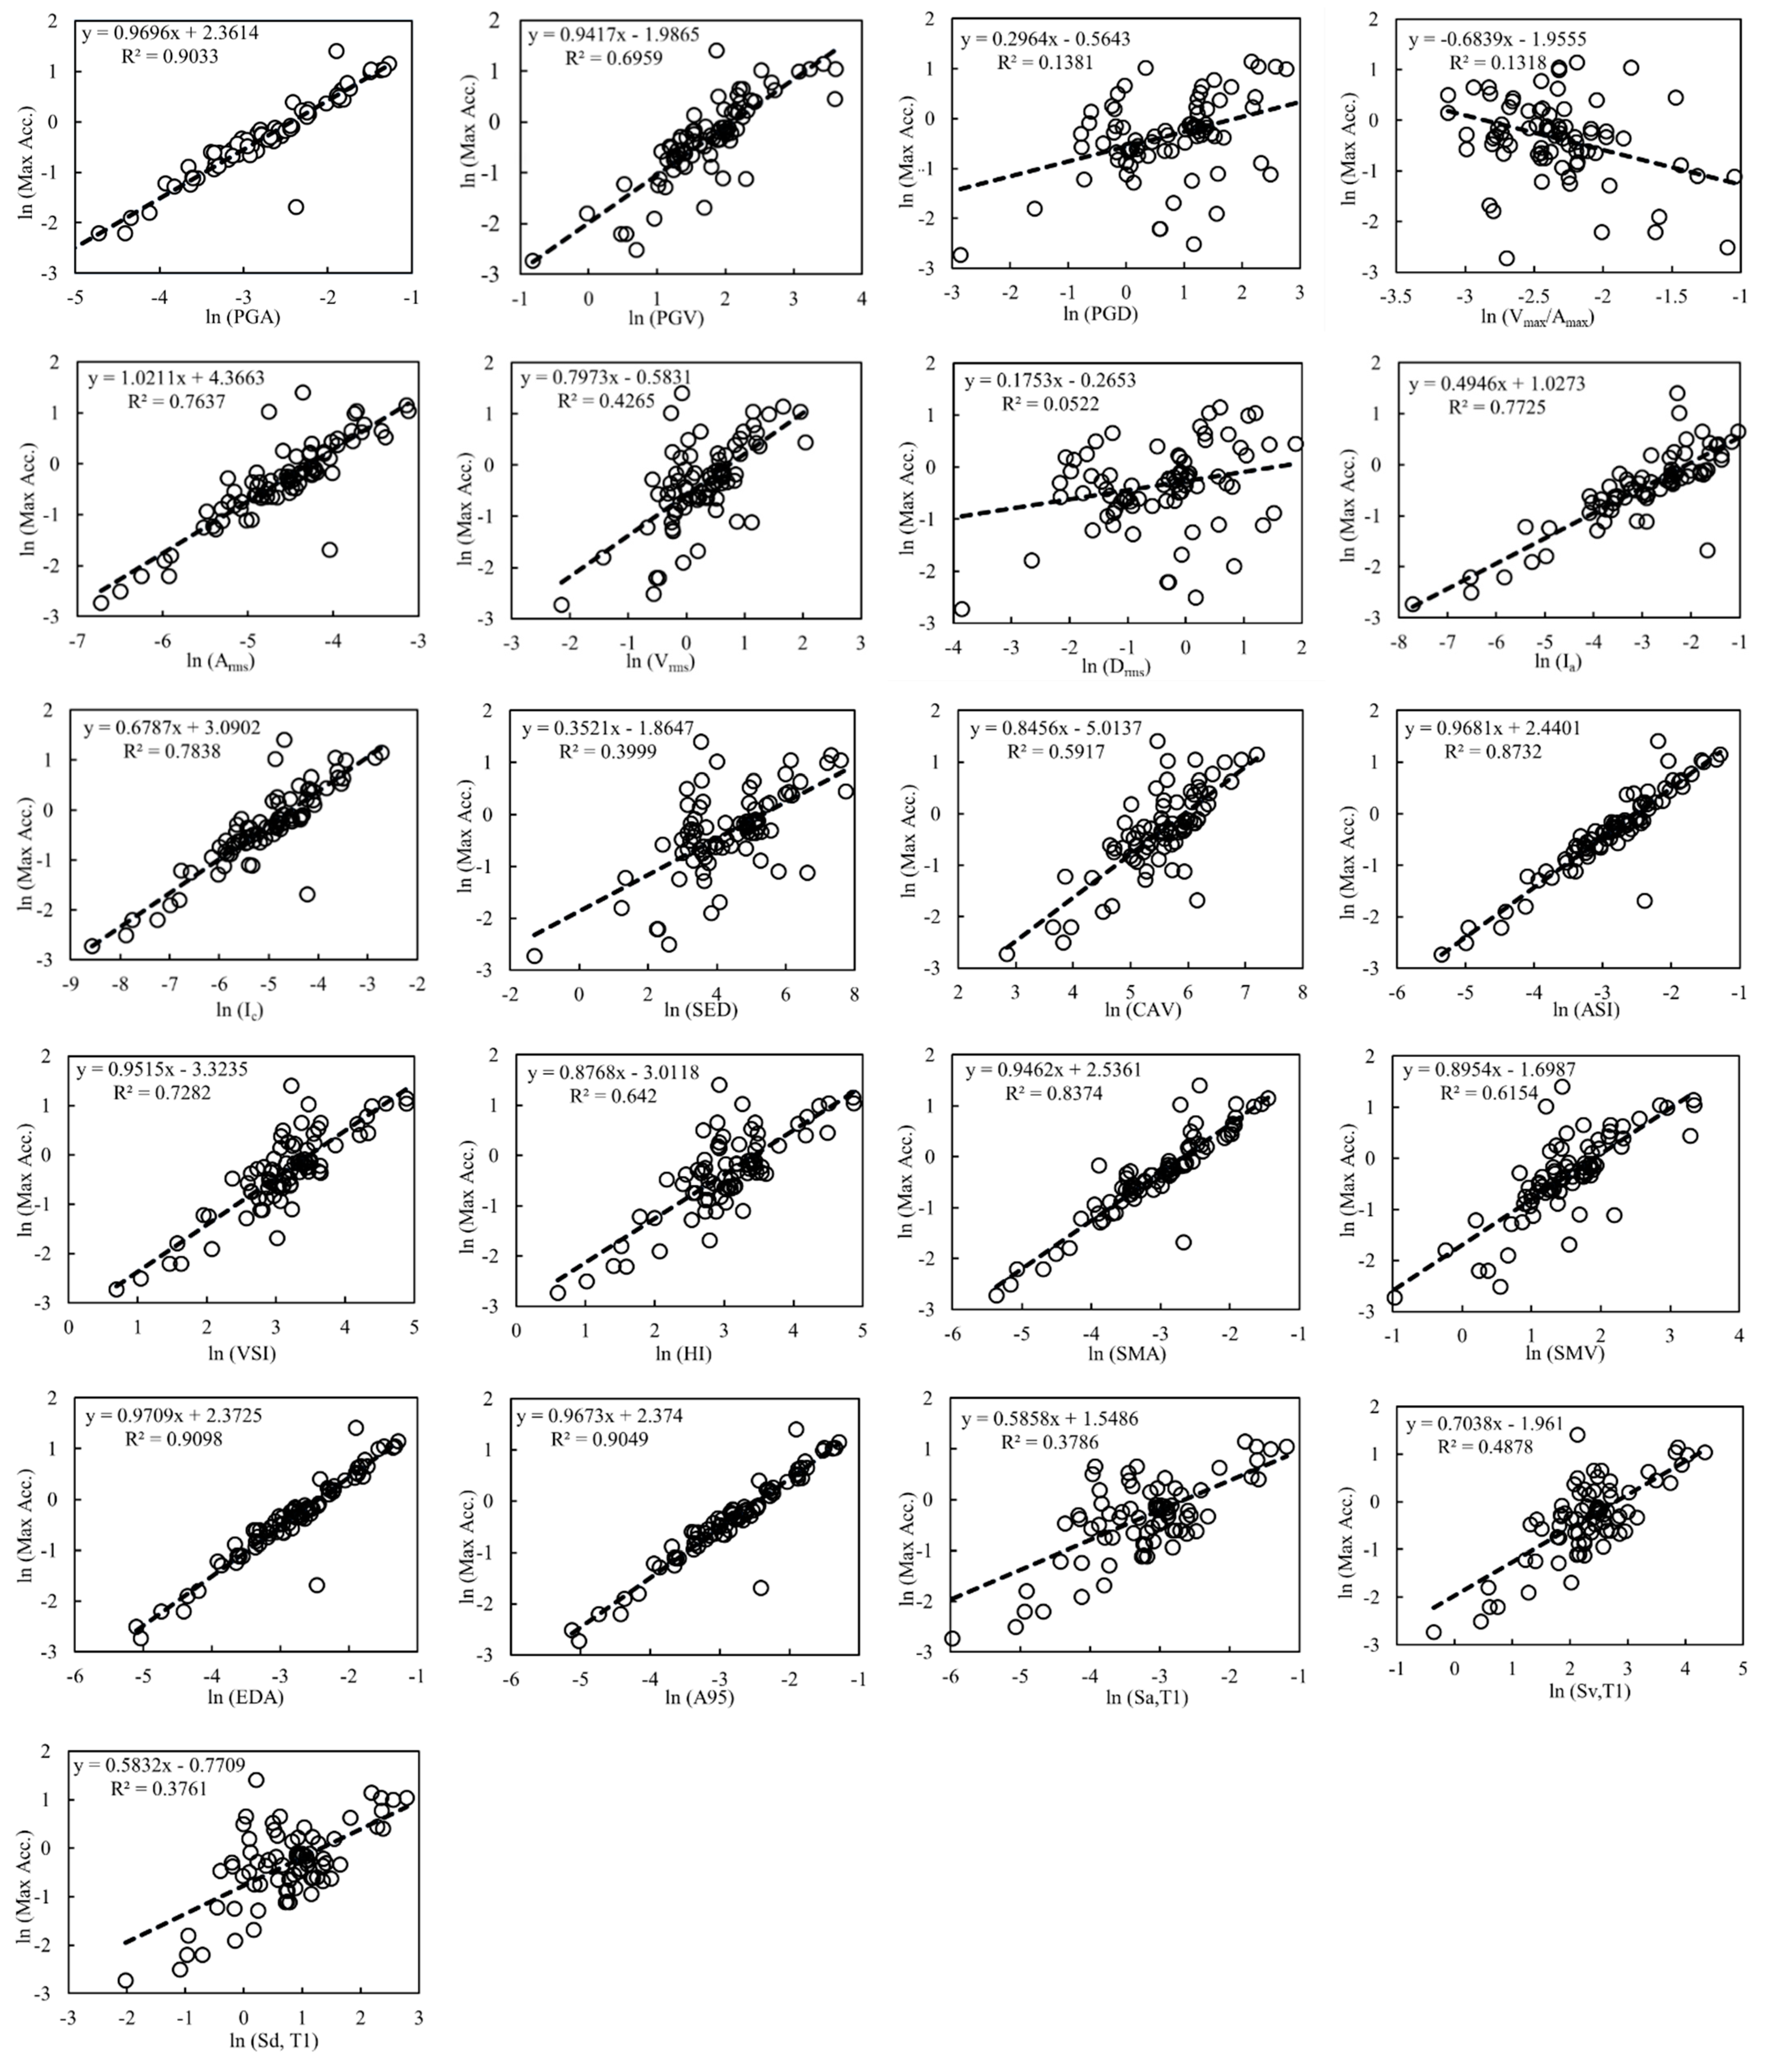
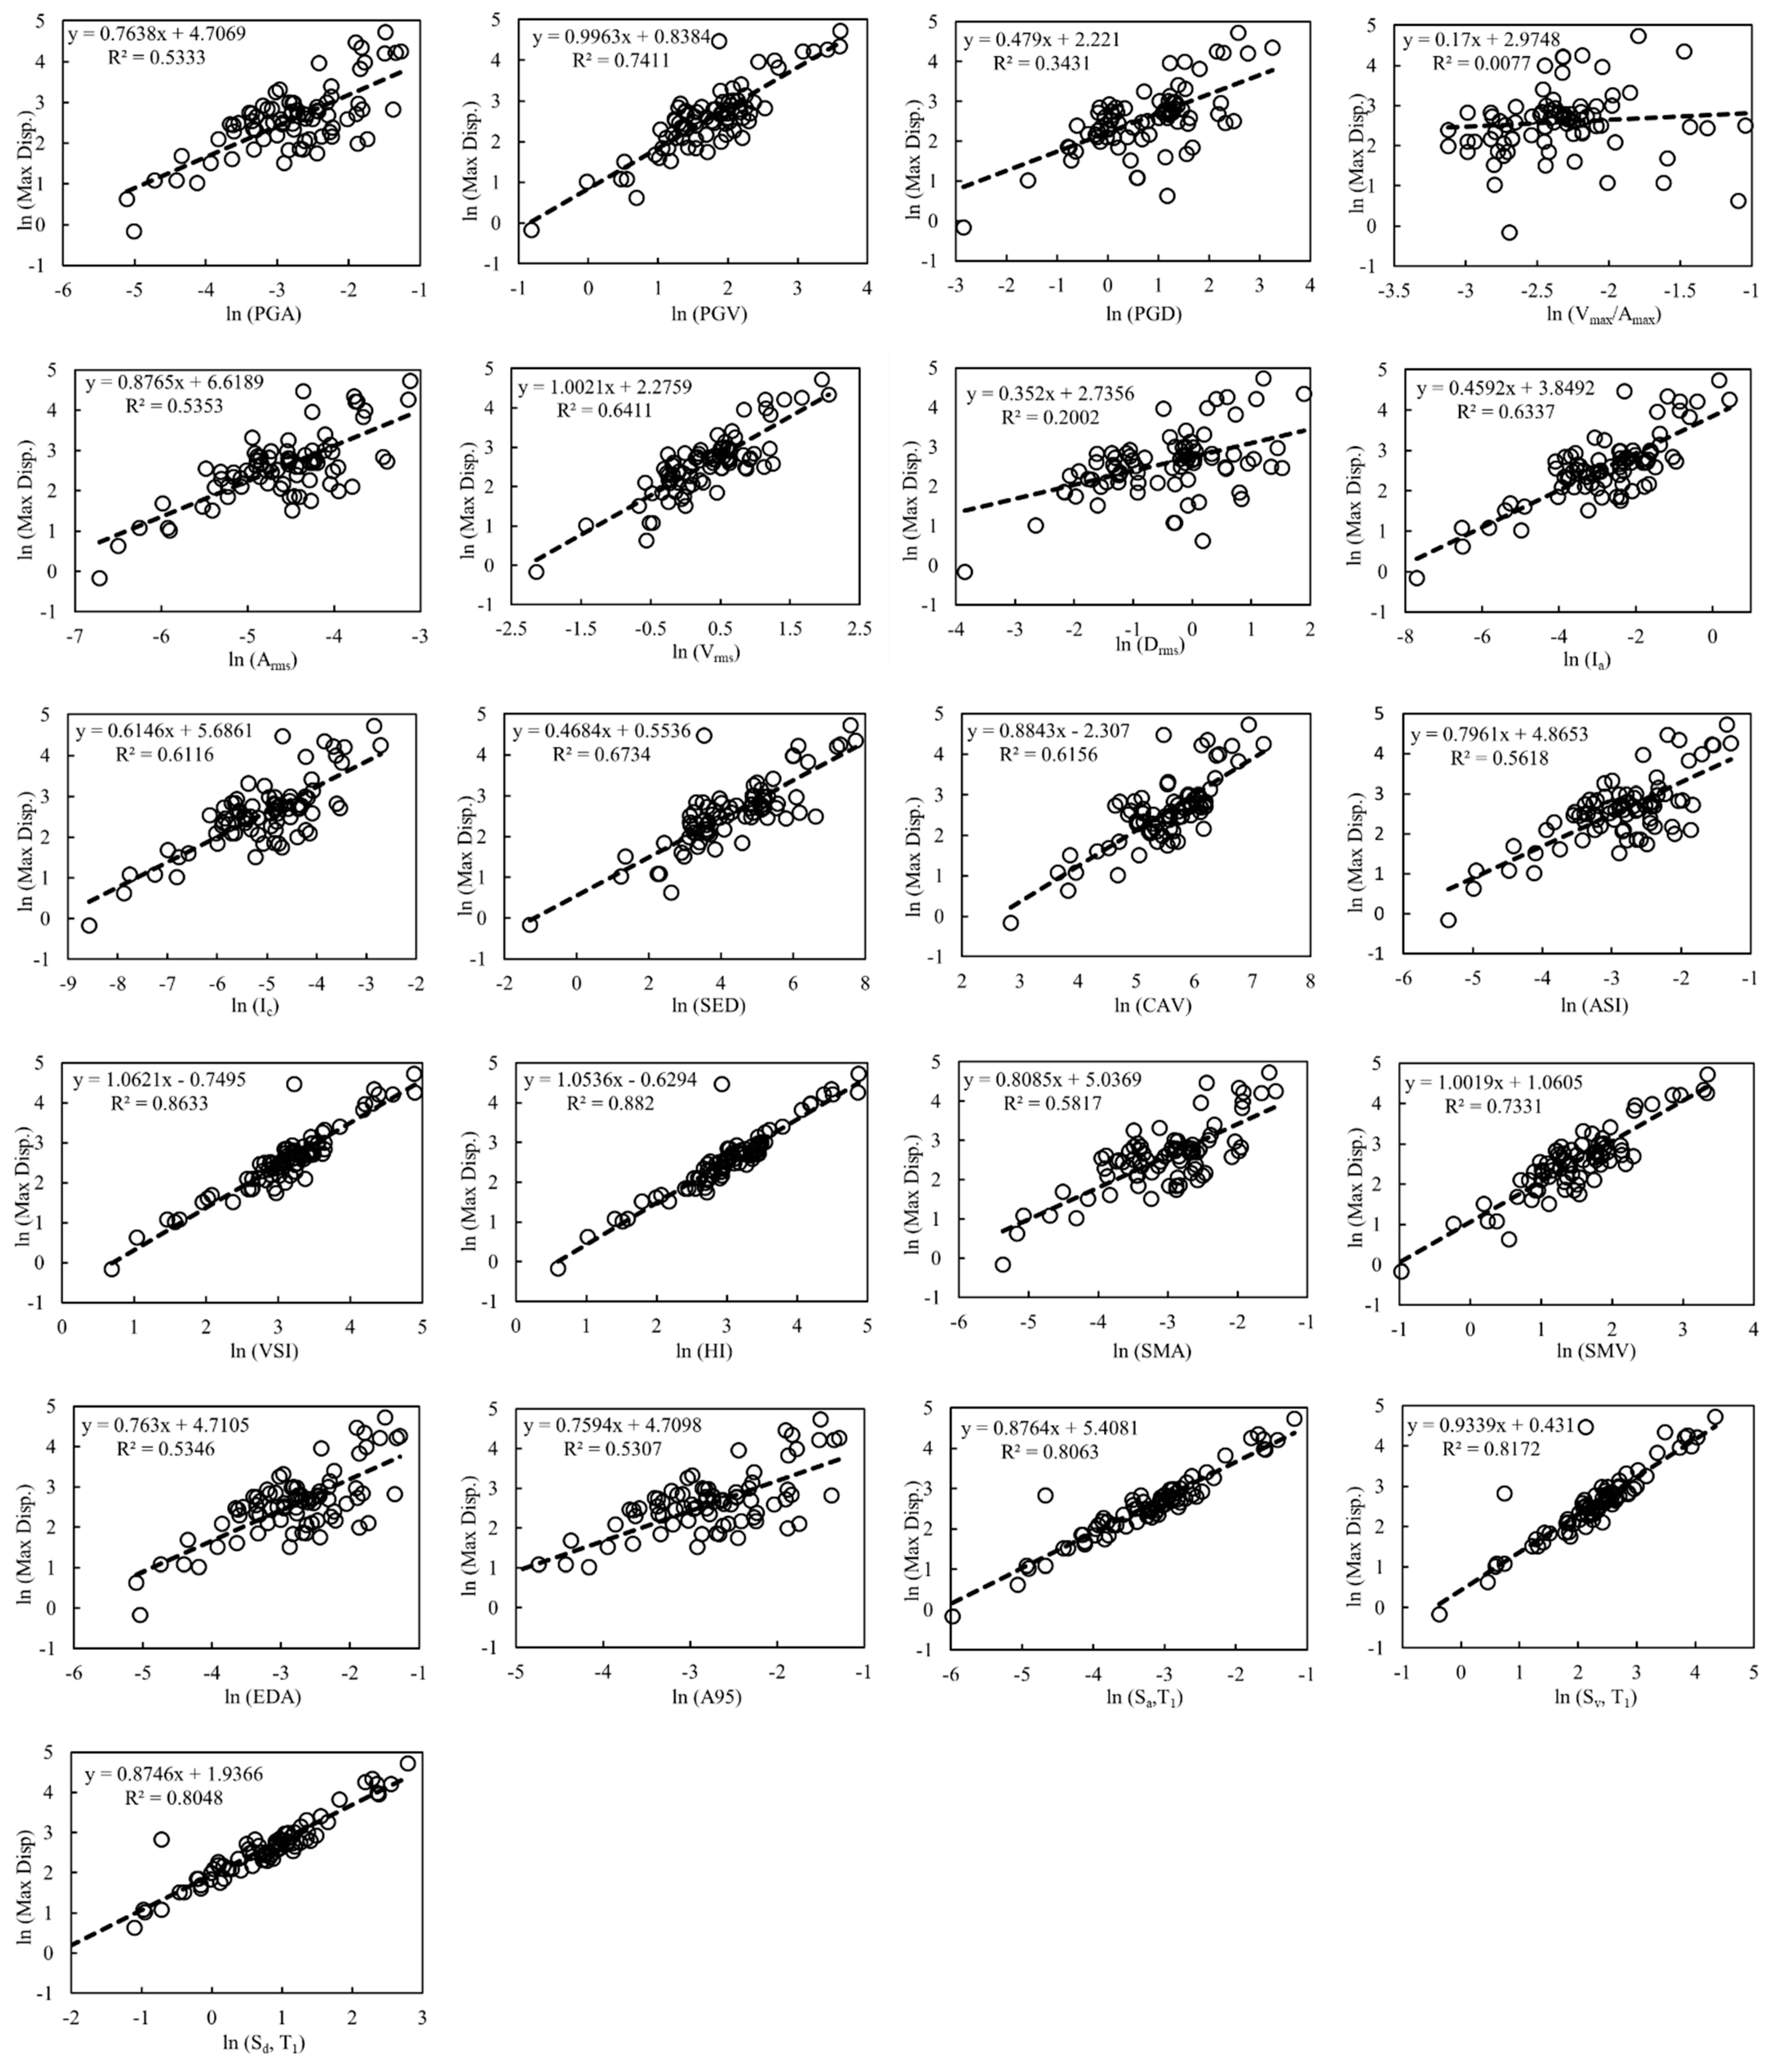
4.1. Practicality
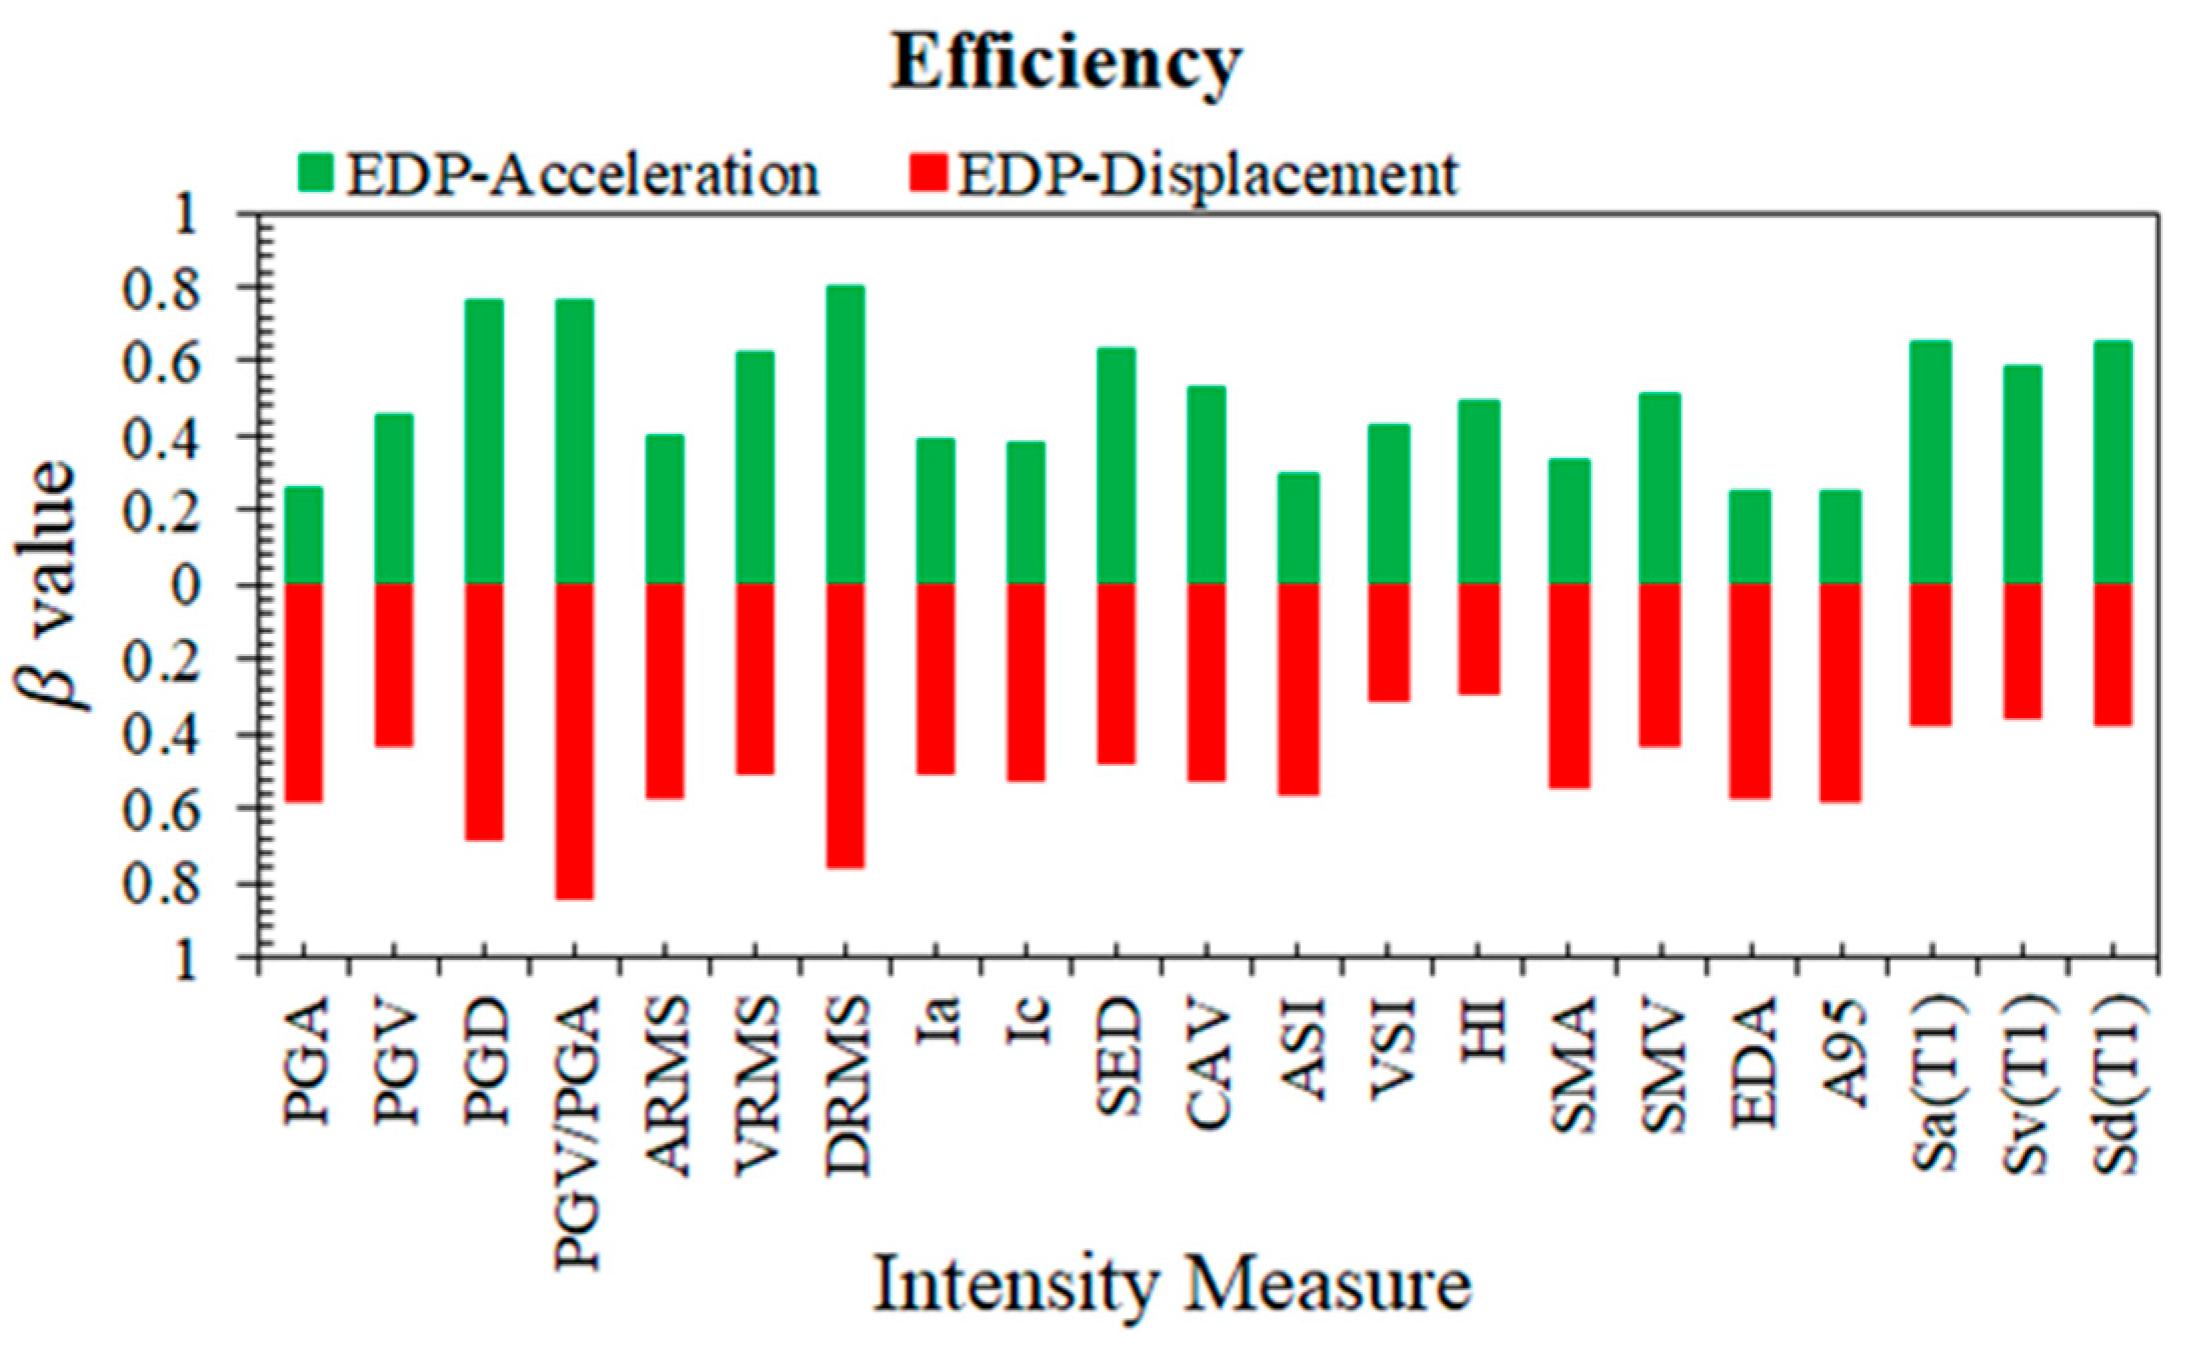
4.2. Efficiency
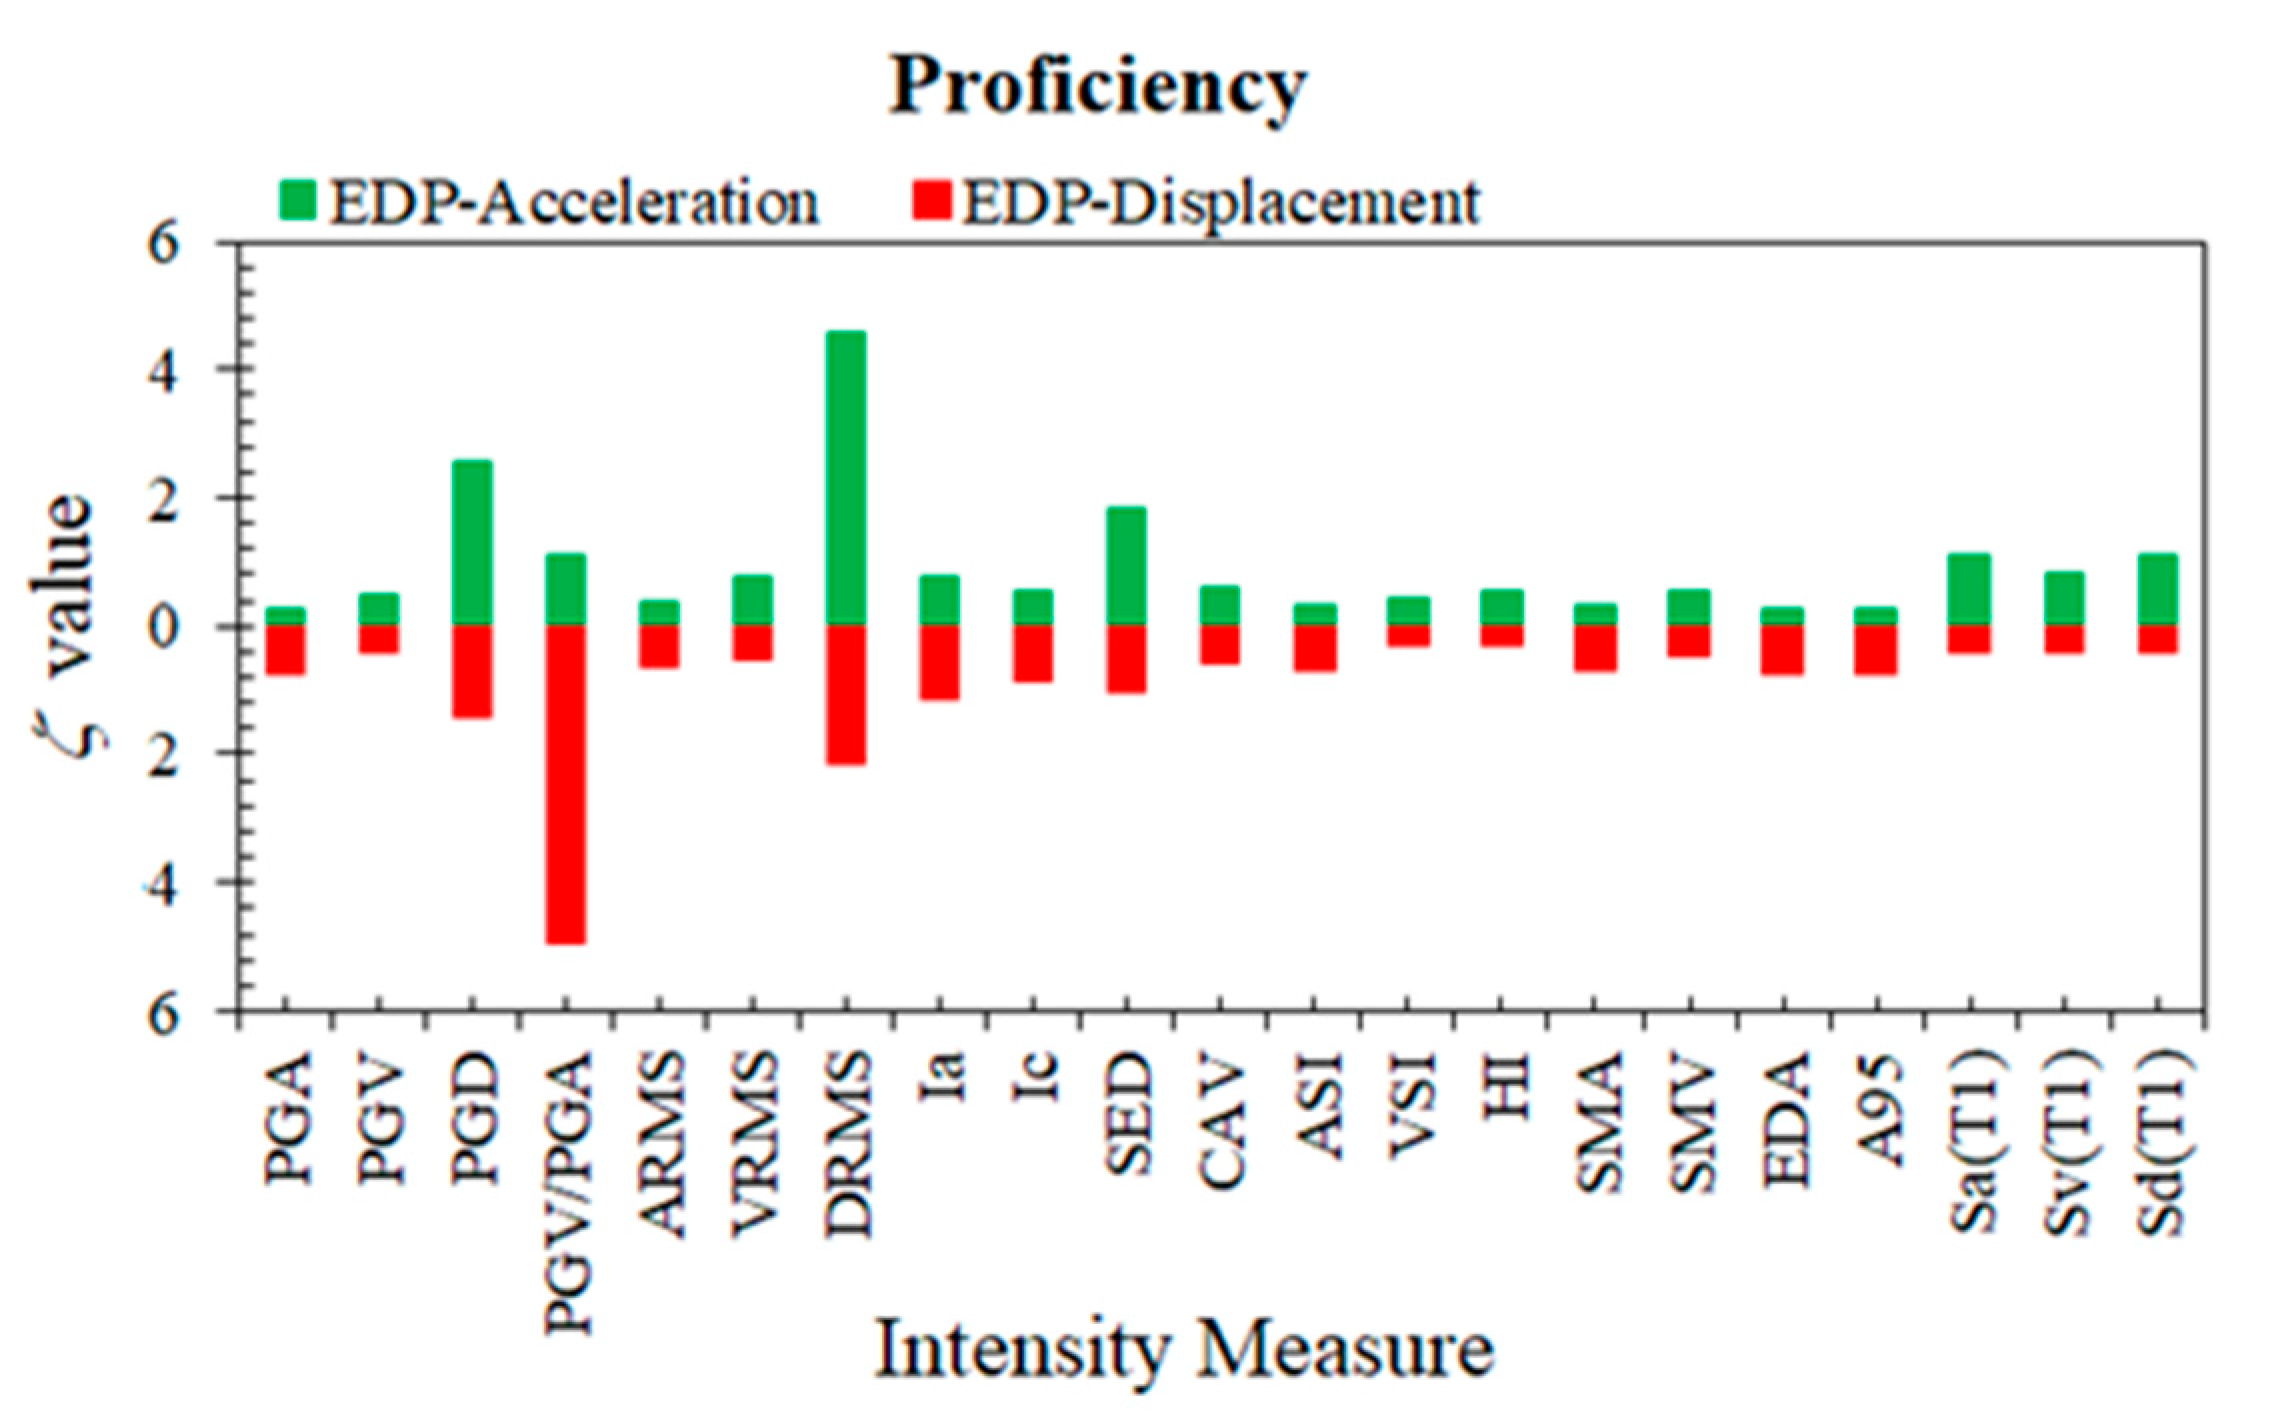
4.3. Proficiency
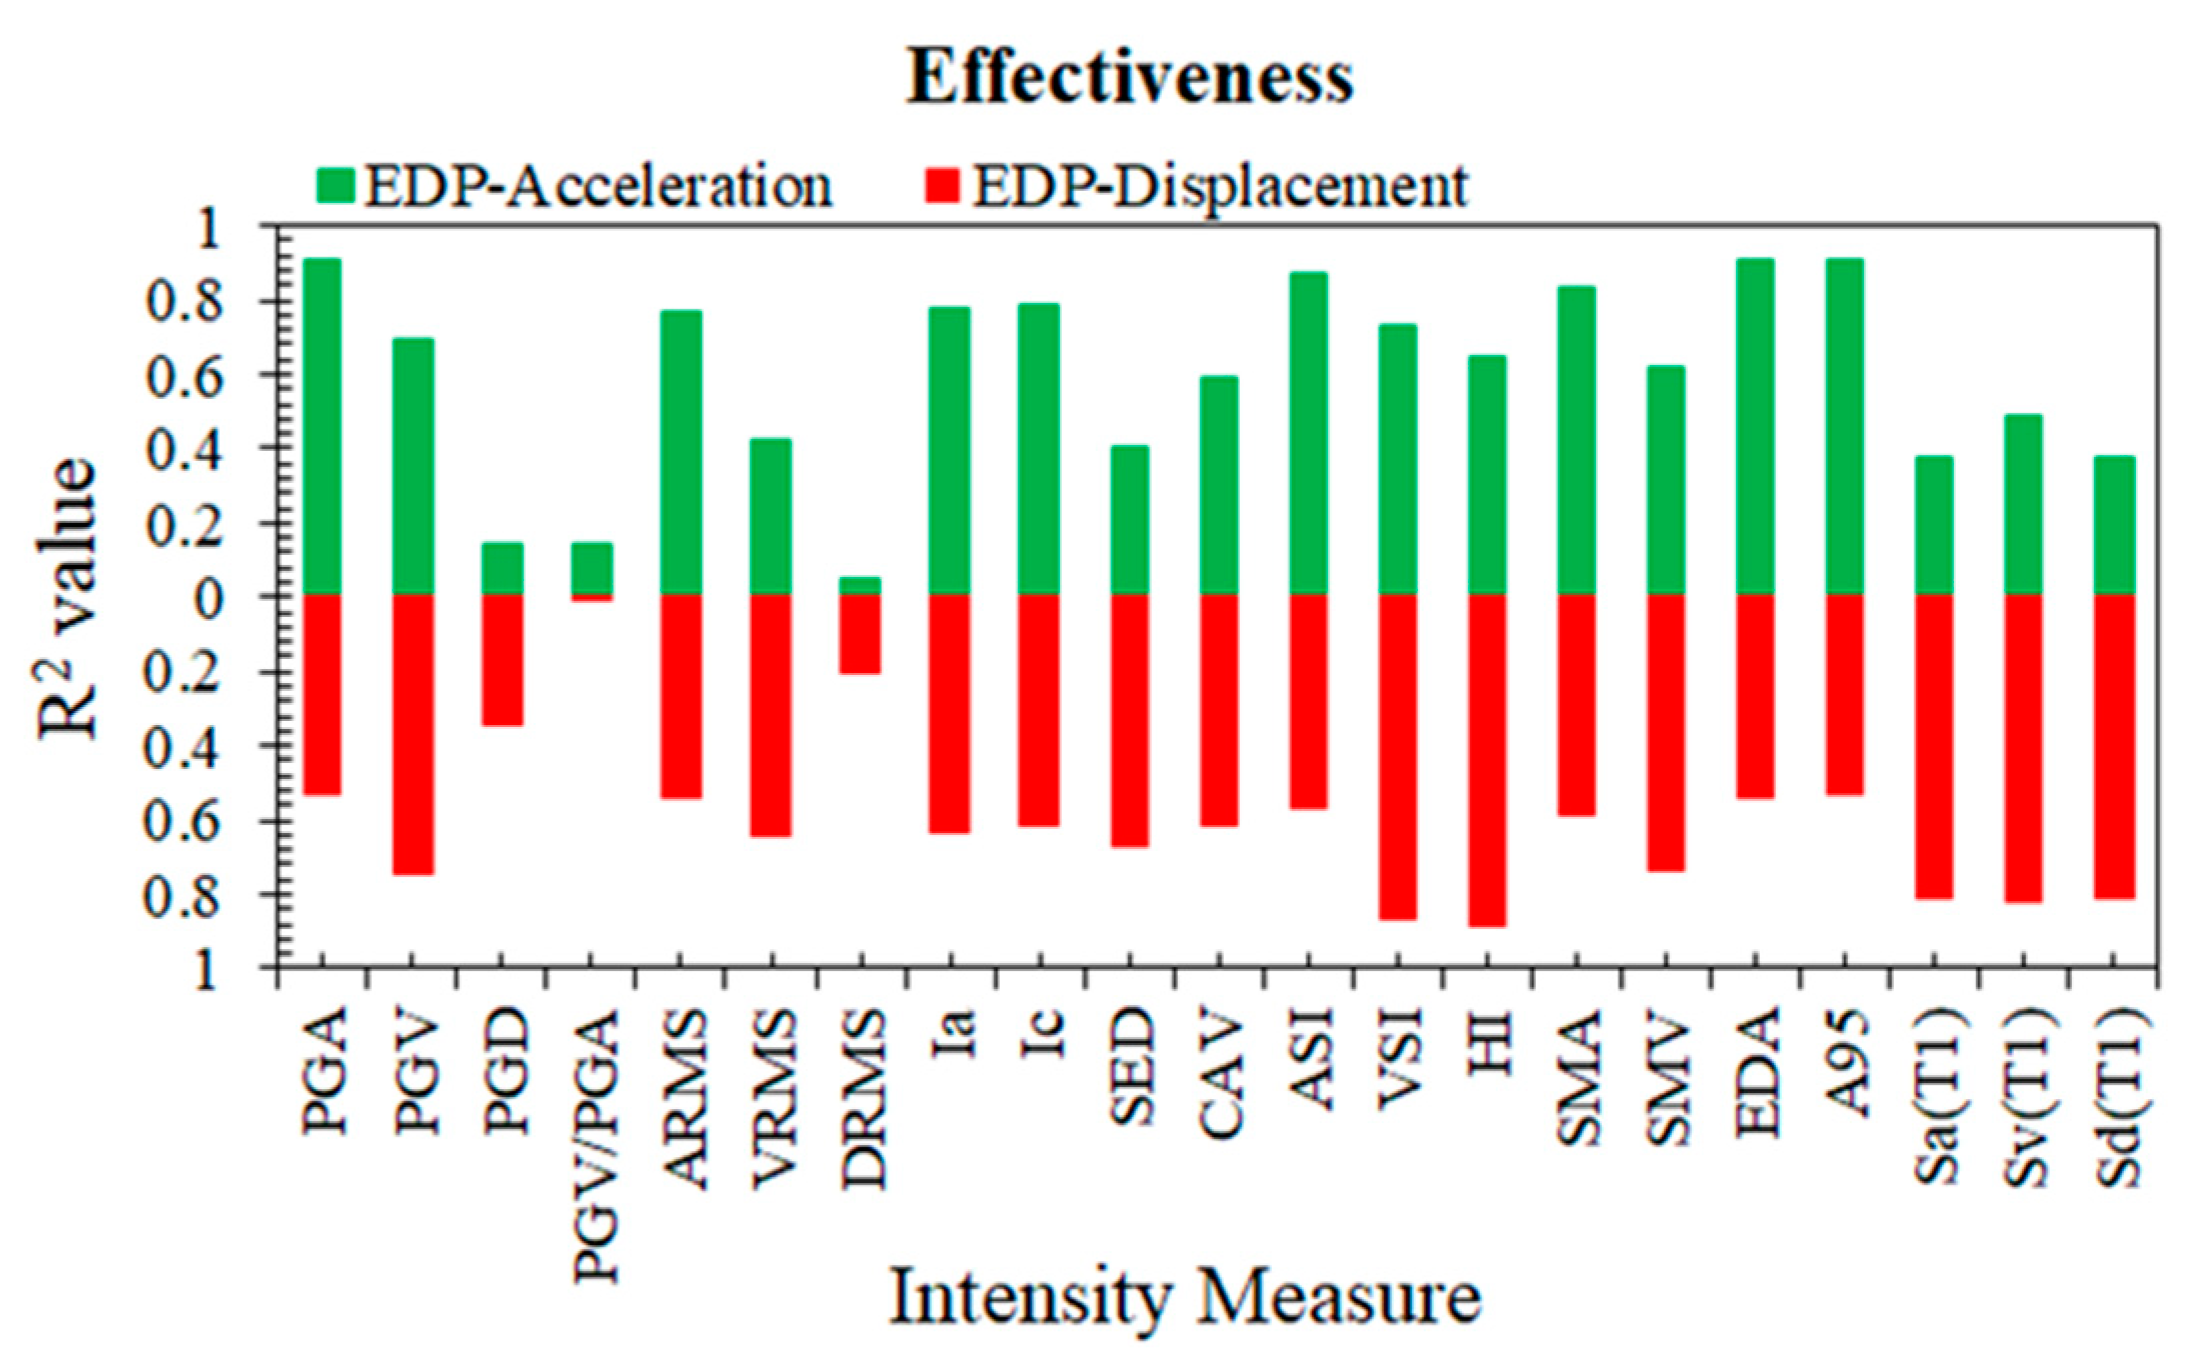
4.4. Effectiveness
5. Result and Discussion
5.1. Practicality Comparison
5.2. Efficiency Comparison
5.3. Proficiency Comparison
5.4. Effectiveness Comparison
6. Conclusions
- The significant IMs (EDA, A95, and PGA) are unrelated to the damping ratio, which is more rational for such structures.
- As an offshore platform is a mass-sensitive structure and the inertia force influences the performance of selection criteria, the optimality of IM depends on the structure’s demand parameter.
- Based on comparing practicality, efficiency, proficiency, and effectiveness, acceleration-type IMs, i.e., EDA, A95, PGA, are the most optimal IMs because these IMs rank top consistently in all criteria considering maximum acceleration as the demand parameter of the structure. In case of maximum acceleration as EDP, the seismic response of an offshore platform is sensitive to acceleration rather than velocity or displacement.
- Velocity-type IMs, i.e., HI and VSI, are the two most optimal IMs in all selected categories of optimal IM when maximum displacement as EDP is considered. The platform’s response is reactive to velocity instead of acceleration or displacement if the EDP is maximum displacement.
- A significant IM can improve the accuracy of the computation of seismic performance analysis. For offshore platforms, EDA and A95 parameter perform better than PGA and Sa. Moreover, these IMs (EDA and A95) are structure-independent and thus becoming irrelative to the damping ratio.
- For both cases of peak acceleration and displacement as EDPs, displacement-type IMs (PGD, Drms) are the weakest or least significant IMs subjected to the seismic demand of an offshore platform.
Author Contributions
Funding
Institutional Review Board Statement
Informed Consent Statement
Data Availability Statement
Conflicts of Interest
Appendix A
| R2 | β | b | ζ | R2 | β | b | ζ | ||
| IM Type | IM | EDP: Max Acceleration | EDP: Max Displacement | ||||||
| Acceleration-related | PGA | 0.903 | 0.256 | 0.970 | 0.264 | 0.533 | 0.576 | 0.764 | 0.754 |
| CAV | 0.592 | 0.526 | 0.846 | 0.622 | 0.616 | 0.523 | 0.884 | 0.591 | |
| Ia | 0.773 | 0.392 | 0.495 | 0.793 | 0.634 | 0.510 | 0.459 | 1.111 | |
| Ic | 0.784 | 0.382 | 0.679 | 0.563 | 0.612 | 0.526 | 0.615 | 0.855 | |
| Arms | 0.764 | 0.400 | 1.021 | 0.392 | 0.535 | 0.575 | 0.877 | 0.656 | |
| SMA | 0.837 | 0.332 | 0.947 | 0.350 | 0.582 | 0.545 | 0.809 | 0.675 | |
| EDA | 0.910 | 0.247 | 0.971 | 0.255 | 0.535 | 0.575 | 0.763 | 0.754 | |
| A95 | 0.905 | 0.254 | 0.967 | 0.262 | 0.531 | 0.578 | 0.759 | 0.761 | |
| ASI | 0.873 | 0.293 | 0.968 | 0.303 | 0.562 | 0.558 | 0.796 | 0.701 | |
| Sa (T1) | 0.379 | 0.648 | 0.586 | 1.107 | 0.806 | 0.371 | 0.876 | 0.423 | |
| Velocity-related | PGV | 0.696 | 0.454 | 0.942 | 0.482 | 0.741 | 0.429 | 0.996 | 0.431 |
| Vrms | 0.427 | 0.623 | 0.797 | 0.781 | 0.641 | 0.505 | 1.002 | 0.504 | |
| SED | 0.400 | 0.637 | 0.352 | 1.810 | 0.673 | 0.482 | 0.468 | 1.029 | |
| SMV | 0.615 | 0.510 | 0.895 | 0.570 | 0.733 | 0.436 | 1.002 | 0.435 | |
| Sv (T1) | 0.488 | 0.589 | 0.704 | 0.836 | 0.817 | 0.361 | 0.934 | 0.386 | |
| HI | 0.642 | 0.492 | 0.877 | 0.561 | 0.882 | 0.290 | 1.054 | 0.275 | |
| VSI | 0.728 | 0.429 | 0.952 | 0.451 | 0.863 | 0.312 | 1.062 | 0.294 | |
| Displacement-related | PGD | 0.138 | 0.764 | 0.296 | 2.576 | 0.343 | 0.683 | 0.479 | 1.427 |
| Drms | 0.052 | 0.801 | 0.175 | 4.568 | 0.200 | 0.754 | 0.352 | 2.142 | |
| Sd (T1) | 0.376 | 0.650 | 0.583 | 1.114 | 0.805 | 0.373 | 0.875 | 0.426 | |
| Time-related | V/A | 0.138 | 0.764 | 0.684 | 1.117 | 0.008 | 0.840 | 0.170 | 4.941 |
| IM (Unit) | Value |
| PGA (g) | 0.151 |
| PGV (cm/s) | 8.866 |
| PGD (cm) | 3.599 |
| PGV/PGA (s) | 0.059 |
| ARMS (g) | 0.034 |
| VRMS (cm/s) | 2.535 |
| DRMS (cm) | 1.397 |
| Ia (m/s) | 0.388 |
| Ic | 0.029 |
| SED (cm2/s) | 141.353 |
| CAV (cm/s) | 486.707 |
| ASI (g*s) | 0.159 |
| VSI (cm) | 37.093 |
| HI (cm) | 29.624 |
| SMA (g) | 0.138 |
| SMV (cm/s) | 8.435 |
| EDA (g) | 0.150 |
| A95 (g) | 0.149 |
| Sa, T1 (g) | 0.032 |
| Sv, T1 (cm/s) | 11.865 |
| Sd, T1 (cm) | 1.646 |
References
- Abdel Raheem, S.; Abdel Aal, E.; Abdel Shafy, A.; Fahmy, M.; Omar, M.; Mansour, M. In-place analysis for design-level assessment of the fixed offshore platform. Ships Offshore Struct. 2020, 16, 892–903. [Google Scholar] [CrossRef]
- Jin, Q.; Li, X.; Sun, N.; Zhou, J.; Guan, J. Experimental and numerical study on tuned liquid dampers for controlling earthquake response of jacket offshore platform. Marine Struct. 2007, 20, 238–254. [Google Scholar] [CrossRef]
- Tian, X.; Wang, Q.; Liu, G.; Liu, Y.; Xie, Y.; Deng, W. Topology optimization design for offshore platform jacket structure. Appl. Ocean Res. 2019, 84, 38–50. [Google Scholar] [CrossRef]
- Konstandakopoulou, F.; Konstantinidou, M.; Pnevmatikos, N.; Hatzigeorgiou, G. Safety and Performance of Offshore Platforms Subjected to Repeated Earthquakes. Infrastructures 2020, 5, 38. [Google Scholar] [CrossRef] [Green Version]
- Nielson, B.; DesRoches, R. Seismic fragility methodology for highway bridges using a component level approach. Earthq. Eng. Struct. Dyn. 2007, 36, 823–839. [Google Scholar] [CrossRef]
- Muntasir Billah, A.; Shahria Alam, M. Seismic fragility assessment of highway bridges: A state-of-the-art review. Struct. Infrastruct. Eng. 2014, 11, 804–832. [Google Scholar] [CrossRef]
- Kostinakis, K.; Fontara, I.; Athanatopoulou, A. Scalar Structure-Specific Ground Motion Intensity Measures for Assessing the Seismic Performance of Structures: A Review. J. Earthq. Eng. 2017, 22, 630–665. [Google Scholar] [CrossRef]
- Zhang, Y.; Ding, Y.; Pang, Y. Selection of Optimal Intensity Measures in Seismic Damage Analysis of Cable-Stayed Bridges Subjected to Far-Fault Ground Motions. J. Earthq. Tsunami 2015, 9, 1550003. [Google Scholar] [CrossRef]
- Liang, C.; Chen, J.; Xu, Q.; Li, J. Correlation Study between Seismic Intensity Measures and Nonlinear Response of Arch Dam via Endurance Time Analysis. KSCE J. Civ. Eng. 2020, 25, 256–271. [Google Scholar] [CrossRef]
- Ghimire, S.; Guéguen, P.; Astorga, A. Analysis of the efficiency of intensity measures from real earthquake data recorded in buildings. Soil Dyn. Earthq. Eng. 2021, 147, 106751. [Google Scholar] [CrossRef]
- Pejovic, R. Optimal intensity measures for probabilistic seismic demand models of RC high-rise buildings. Earthq. Struct. 2017, 13, 221–230. [Google Scholar]
- Kostinakis, K.; Athanatopoulou, A.; Morfidis, K. Correlation between ground motion intensity measures and seismic damage of 3D R/C buildings. Eng. Struct. 2015, 82, 151–167. [Google Scholar] [CrossRef]
- Padgett, J.; Nielson, B.; DesRoches, R. Selection of optimal intensity measures in probabilistic seismic demand models of highway bridge portfolios. Earthq. Eng. Struct. Dyn. 2008, 37, 711–725. [Google Scholar] [CrossRef]
- Jiang, L.; Zhong, J.; He, M.; Yuan, W. Optimal Seismic Intensity Measure Selection for Isolated Bridges under Pulse-Like Ground Motions. Adv. Civ. Eng. 2019, 2019, 3858457. [Google Scholar] [CrossRef]
- Dehghanpoor, A.; Thambiratnam, D.; Zhang, W.; Chan, T.; Taciroglu, E. An extended probabilistic demand model with optimal intensity measures for seismic performance characterization of isolated bridges under coupled horizontal and vertical motions. Bull. Earthq. Eng. 2021, 19, 2291–2323. [Google Scholar] [CrossRef]
- Wei, B.; Hu, Z.; He, X.; Jiang, L. Evaluation of optimal ground motion intensity measures and seismic fragility analysis of a multi-pylon cable-stayed bridge with super-high piers in Mountainous Areas. Soil Dyn. Earthq. Eng. 2020, 129, 105945. [Google Scholar] [CrossRef]
- O’Reilly, G. Seismic intensity measures for risk assessment of bridges. Bull. Earthq. Eng. 2021, 19, 3671–3699. [Google Scholar] [CrossRef]
- Nguyen, D.; Lee, T.; Phan, V. Optimal Earthquake Intensity Measures for Probabilistic Seismic Demand Models of Base-Isolated Nuclear Power Plant Structures. Energies 2021, 14, 5163. [Google Scholar] [CrossRef]
- Nguyen, D.; Thusa, B.; Han, T.; Lee, T. Identifying significant earthquake intensity measures for evaluating seismic damage and fragility of nuclear power plant structures. Nucl. Eng. Technol. 2020, 52, 192–205. [Google Scholar] [CrossRef]
- Tsinidis, G.; Di Sarno, L.; Sextos, A.; Furtner, P. Optimal intensity measures for the structural assessment of buried steel natural gas pipelines due to seismically induced axial compression at geotechnical discontinuities. Soil Dyn. Earthq. Eng. 2020, 131, 106030. [Google Scholar] [CrossRef]
- Shakib, H.; Jahangiri, V. Intensity measures for the assessment of the seismic response of buried steel pipelines. Bull. Earthq. Eng. 2016, 14, 1265–1284. [Google Scholar] [CrossRef]
- Hariri-Ardebili, M.; Saouma, V. Probabilistic seismic demand model and optimal intensity measure for concrete dams. Struct. Saf. 2016, 59, 67–85. [Google Scholar] [CrossRef]
- Li, Z.; Wu, Z.; Lu, X.; Zhou, J.; Chen, J.; Liu, L.; Pei, L. Efficient seismic risk analysis of gravity dams via screening of intensity measures and simulated non-parametric fragility curves. Soil Dyn. Earthq. Eng. 2021, 152, 107040. [Google Scholar] [CrossRef]
- Huang, Z.; Pitilakis, K.; Argyroudis, S.; Tsinidis, G.; Zhang, D. Selection of optimal intensity measures for fragility assessment of circular tunnels in soft soil deposits. Soil Dyn. Earthq. Eng. 2021, 145, 106724. [Google Scholar] [CrossRef]
- Bakalis, K.; Kohrangi, M.; Vamvatsikos, D. Seismic intensity measures for above-ground liquid storage tanks. Earthq. Eng. Struct. Dyn. 2018, 47, 1844–1863. [Google Scholar] [CrossRef]
- Babaei, S.; Amirabadi, R.; Sharifi, M. Evaluation of Optimal IM-EDP pairs for Typical South Pars Fixed Pile-Founded Offshore Platforms. Intl. J. Marit. Technol. 2021, 15, 29–49. [Google Scholar]
- Babaei, S.; Amirabadi, R.; Sharifi, M.; Ventura, C. Optimal probabilistic seismic demand model for fixed pile-founded offshore platforms considering soil-pile-structure interaction. Structures 2021, 33, 4330–4343. [Google Scholar] [CrossRef]
- Vazirizade, S.; Azizsoltani, H.; Haldar, A. Reliability estimation of jacket type offshore platforms against seismic and wave loadings applied in time domain. Ships Offshore Struct. 2020, 1–10. [Google Scholar] [CrossRef]
- Abyani, M.; Bahaari, M.; Zarrin, M.; Nasseri, M. Effects of sample size of ground motions on seismic fragility analysis of offshore jacket platforms using Genetic Algorithm. Ocean Eng. 2019, 189, 106326. [Google Scholar] [CrossRef]
- Zhao, S.; Bi, C.; Sun, Z. Engineering analysis of the dynamic characteristics of an electrical jacket platform of an offshore wind farm under seismic loads. Appl. Ocean Res. 2021, 112, 102692. [Google Scholar] [CrossRef]
- Konstandakopoulou, F.; Papagiannopoulos, G.; Pnevmatikos, N.; Hatzigeorgiou, G. Seismic Hazard Assessment of Offshore Platforms. Intl. J. Civ. Environ. Eng. 2019, 13, 272–276. [Google Scholar]
- Zarrin, M.; Mostafa Gharabaghi, A.; Poursha, M. A multi-mode N2 (MN2) pushover procedure for ductility level seismic performance evaluation of jacket type offshore platforms. Ocean Eng. 2021, 220, 108440. [Google Scholar] [CrossRef]
- Dastan Diznab, M.; Mehdigholi, H.; Seif, M. Seismic performance assessment of fixed offshore structures by endurance time method. Ships Offshore Struct. 2019, 14, 709–722. [Google Scholar] [CrossRef]
- Bezir, F.; Cicek, K.; Sari, A. Seismic Fragility Analysis of Jacket Type Offshore Structures. In Proceedings of the International Conference on Earthquake Engineering and Seismology (5ICEES), Ankara, Turkey, 8–11 October 2019; Volume 8, p. 11. [Google Scholar]
- Regenhardt, T.; Azad, M.; Punurai, W.; Beer, M. A Novel Application of System Survival Signature in Reliability Assessment of Offshore Structures. In Advances in Intelligent Systems and Computing. Proceedings of the International Conference on Intelligent Computing & Optimization; Vasant, P., Zelinka, I., Weber, G.W., Eds.; Springer: Cham, Switzerland, 2018; Volume 866, pp. 11–20. [Google Scholar]
- Behrensdorf, J.; Azad, M.; Broggi, M.; Punurai, W.; Beer, M. Reliability based optimization of inspection and maintenance schedules for offshore jacket structures subject to marine corrosion. In Proceedings of the Seventh Asian-Pacific Symposium on Structural Reliability and Its Applications (APSSRA2020), Tokyo, Japan, 4–7 October 2020. [Google Scholar]
- Recommended Practice for Planning, Designing, and Constructing Fixed Offshore Platforms, 21st ed.; American Petroleum Institute: Washington, DC, USA, 2000.
- Yue, Q.; Zhang, L.; Zhang, W.; Kärnä, T. Mitigating ice-induced jacket platform vibrations utilizing a TMD system. Cold Regions Sci. Technol. 2009, 56, 84–89. [Google Scholar] [CrossRef]
- Mazzoni, S.; McKenna, F.; Scott, M.H.; Fenves, G.L. OpenSees Command Language Manual; Pacific Earthquake Engineering Research (PEER) Center: Berkeley, UC, USA, 2006; p. 264. [Google Scholar]
- Azad, M.; Punurai, W.; Sinsabvarodom, C.; Asavadorndeja, P. Effects of Redundancy in Bracing Systems on the Fragility Curve Development of Steel Jacket Offshore Platform. Eng. J. 2019, 23, 123–133. [Google Scholar] [CrossRef]
- Punurai, W.; Azad, M.; Pholdee, N.; Bureerat, S.; Sinsabvarodom, C. A novel hybridized metaheuristic technique in enhancing the diagnosis of cross-sectional dent damaged offshore platform members. Comput. Intell. 2019, 36, 132–150. [Google Scholar] [CrossRef]
- Nour El-Din, M.; Kim, J. Seismic performance of pile-founded fixed jacket platforms with chevron braces. Struct. Infrastruct. Eng. 2014, 11, 776–795. [Google Scholar] [CrossRef]
- PEER Ground Motion Database—PEER Center. Available online: https://ngawest2.berkeley.edu/ (accessed on 8 July 2021).
- Kramer, S.L. Geotechnical Earthquake Engineering; Prentice Hall. Inc.: Upper Saddle River, NJ, USA, 1996. [Google Scholar]
- Reed, J.; Kassawara, R. A criterion for determining exceedance of the operating basis earthquake. Nucl. Eng. Des. 1990, 123, 387–396. [Google Scholar] [CrossRef] [Green Version]
- Arias, A. A Measure of Earthquake Intensity. In Seismic Design for Nuclear Power Plants; Hansen, R.J., Ed.; MIT Press: Cambridge MA, USA, 1970; pp. 438–483. [Google Scholar]
- Park, Y.; Ang, A.; Wen, Y. Seismic Damage Analysis of Reinforced Concrete Buildings. J. Struct. Eng. 1985, 111, 740–757. [Google Scholar] [CrossRef]
- Housner, G.; Jennings, P. Generation of Artificial Earthquakes. J. Eng. Mech. Div. 1964, 90, 113–150. [Google Scholar] [CrossRef]
- Nuttli, O.W. The Relation of Sustained Maximum Ground Acceleration and Velocity to Earthquake Intensity and Magnitude; US Army Engineer Waterways Experiment Station: Vicksburg, MS, USA, 1979.
- Sarma, S.; Yang, K. An evaluation of strong motion records and a new parameter A95. Earthq. Eng. Struct. Dyn. 1987, 15, 119–132. [Google Scholar] [CrossRef]
- Von, T.; Rochim, L.H.; Scott, G.A.; Wilson, J.A. Earthquake ground motions for design and analysis of dams. In Earthquake Engineering and Soil Dynamics II—Recent Advances in Ground-Motion Evaluation; Geotechnical Special Publication: Park City, UT, USA, 1988; Volume 20, pp. 463–481. [Google Scholar]
- Housner, G. Behavior of Structures During Earthquakes. J. Eng. Mech. Div. 1959, 85, 109–129. [Google Scholar] [CrossRef]
- Cornell, C.; Jalayer, F.; Hamburger, R.; Foutch, D. Probabilistic Basis for 2000 SAC Federal Emergency Management Agency Steel Moment Frame Guidelines. J. Struct. Eng. 2002, 128, 526–533. [Google Scholar] [CrossRef] [Green Version]
- Mackie, K.; Stojadinović, B. Probabilistic Seismic Demand Model for California Highway Bridges. J. Bridge Eng. 2001, 6, 468–481. [Google Scholar] [CrossRef] [Green Version]
- Wang, X.; Shafieezadeh, A.; Ye, A. Optimal intensity measures for probabilistic seismic demand modeling of extended pile-shaft-supported bridges in liquefied and laterally spreading ground. Bull. Earthq. Eng. 2017, 16, 229–257. [Google Scholar] [CrossRef]


| Group | Element Numbers | Outside Diameter, D (m) | Thickness, t (m) |
|---|---|---|---|
| G1 | 1 to 20 | 1.067 | 0.038 |
| G2 | 21 to 28 | 0.457 | 0.010 |
| G3 | 29 to 32 | 0.406 | 0.013 |
| G4 | 33 to 44 | 0.356 | 0.010 |
| G5 | 45 to 52 | 0.457 | 0.013 |
| G6 | 53 to 60; 117 to 120 | 0.356 | 0.013 |
| G7 | 61 to 68 | 0.406 | 0.016 |
| G8 | 69 to 72 | 0.324 | 0.010 |
| G9 | 73 to 80; 85 to 92 | 0.559 | 0.013 |
| G10 | 81 to 84 | 0.559 | 0.019 |
| G11 | 93 to 116 | 0.610 | 0.025 |
| IM | Description | Definition | Units | References |
|---|---|---|---|---|
| Structure-Independent | ||||
| Acceleration-Related | ||||
| PGA | Peak Ground Acceleration | Max|a(t)|, a(t) is acc. time history | g | Kramer [44] |
| CAV | Cumulative Absolute Velocity | , ttot is total duration | cm/s | Reed and Kassawara [45] |
| Ia | Arias Intensity | m/s | Arias [46] | |
| Ic | Characteristic Intensity | Park et al. [47] | ||
| Arms | Root-Mean Square of Acceleration | g | Housner and Jennings [48] | |
| SMA | Sustained Maximum Acceleration | Third largest peak in a(t) | g | Nuttli [49] |
| EDA | Effective Design Acceleration | Peak acc. after filtering out frequencies beyond 9 Hz. | g | Reed and Kassawara [45] |
| A95 | A95 parameter | Acc. level below which 95% of the total Arias Intensity is contained | g | Sarma and Yang [50] |
| Velocity-Related | ||||
| PGV | Peak Ground Velocity | Max|v(t)|, v(t) is vel. time history | cm/s | Kramer [44] |
| Vrms | Root-Mean Square of Velocity | cm/s | Housner and Jennings [48] | |
| SED | Specific Energy Density | cm2/s | ||
| SMV | Sustained Maximum Velocity | Third largest peak in v(t) | cm/s | Nuttli [49] |
| Displacement-Related | ||||
| PGD | Peak Ground Displacement | Max|u(t)|, u(t) is disp. time history | cm | Kramer [44] |
| Drms | Root-Mean Square of Displacement | cm | Housner and Jennings [48] | |
| Time-Related | ||||
| V/A | Peak vel./acc. ratio | PGV/PGA | s | Kramer [44] |
| Structure-Based | ||||
| Acceleration-Related | ||||
| ASI | Acceleration Spectrum Intensity | g*s | Von Thun et al. [51] | |
| Sa (T1) | Spectrum Acceleration | Spectrum Acceleration at the first-natural period, T1 | g | |
| Velocity-Related | ||||
| Sv (T1) | Spectrum Velocity | Spectrum velocity at the first-natural period, T1 | cm/s | |
| HI | Housner Intensity | cm | Housner [52] | |
| VSI | Velocity Spectrum Intensity | cm | Von Thun et al. [51] | |
| Displacement-Related | ||||
| Sd (T1) | Spectrum Displacement | Spectrum displacement at the first-natural period, T1 | cm | |
Publisher’s Note: MDPI stays neutral with regard to jurisdictional claims in published maps and institutional affiliations. |
© 2021 by the authors. Licensee MDPI, Basel, Switzerland. This article is an open access article distributed under the terms and conditions of the Creative Commons Attribution (CC BY) license (https://creativecommons.org/licenses/by/4.0/).
Share and Cite
Sarker, S.; Kim, D.; Azad, M.S.; Sinsabvarodom, C.; Guk, S. Influence of Optimal Intensity Measures Selection in Engineering Demand Parameter of Fixed Jacket Offshore Platform. Appl. Sci. 2021, 11, 10745. https://doi.org/10.3390/app112210745
Sarker S, Kim D, Azad MS, Sinsabvarodom C, Guk S. Influence of Optimal Intensity Measures Selection in Engineering Demand Parameter of Fixed Jacket Offshore Platform. Applied Sciences. 2021; 11(22):10745. https://doi.org/10.3390/app112210745
Chicago/Turabian StyleSarker, Sajib, Dookie Kim, Md Samdani Azad, Chana Sinsabvarodom, and Seongoh Guk. 2021. "Influence of Optimal Intensity Measures Selection in Engineering Demand Parameter of Fixed Jacket Offshore Platform" Applied Sciences 11, no. 22: 10745. https://doi.org/10.3390/app112210745
APA StyleSarker, S., Kim, D., Azad, M. S., Sinsabvarodom, C., & Guk, S. (2021). Influence of Optimal Intensity Measures Selection in Engineering Demand Parameter of Fixed Jacket Offshore Platform. Applied Sciences, 11(22), 10745. https://doi.org/10.3390/app112210745