Article

Metabolic Profiling of Type 2 Diabetes Patients after Bariatric Surgery by Raman Spectroscopy

1
Dipartimento di Scienze Biomediche e Cliniche “L. Sacco”, Università di Milano, 20157 Milan, Italy
2
S.C. CHIRURGIA GENERALE TRADATE, Ospedale Galmarini di Tradate, ASST dei SETTE LAGHI, 21049 Tradate, Italy
3
Nanomedicine and Molecular Imaging Lab., Istituti Clinici Scientifici Maugeri IRCCS, 27100 Pavia, Italy
*
Authors to whom correspondence should be addressed.
Appl. Sci. 2021, 11(22), 10710; https://doi.org/10.3390/app112210710
Submission received: 12 October 2021 / Revised: 8 November 2021 / Accepted: 10 November 2021 / Published: 12 November 2021
(This article belongs to the Special Issue Applications of Biophotonics in Biology and Medicine)

Abstract

:
Background: Bariatric surgery (BS) is an important procedure used for the treatment of morbid obesity and has been proven to improve, or even cure, type 2 diabetes mellitus (T2DM). However, of the patients with T2DM who initially go into remission, a proportion experience a relapse during the follow-up. In this context, Raman spectroscopy (RS) could be a promising technique for monitoring the metabolic profile of patients after surgical treatment with the aim of improving their postsurgical management. Methods: Fourteen obese patients with T2DM were recruited. Clinical parameters, adipokines, ghrelin, Fibroblast growth factor 19 (FGF-19) values, and Raman spectra were collected and analyzed before and after surgery. RS results were compared with profiles obtained from 23 healthy subjects (HC), to observe whether the metabolic fingerprint of bariatric patients normalized during the surgical follow-up. Results: The reduction in anthropometric measures and improved glycemic control and lipid profile after surgical treatment highlighted the benefits of BS. Consequently, adipokines, ghrelin and FGF-19 concentration returned to normal values after surgery. However, RS data highlighted an altered metabolic profile even after BS. Conclusion: RS suggests that BS does not fully restore the metabolic profile of patients in the immediate follow-up after the surgery.

Graphical Abstract

1. Introduction

Morbid obesity, which represents one of the major risk factors for developing T2DM, is a clinical condition characterized by an excess of fat mass [1]. The prevalence of T2DM is increasing worldwide, along with an increase in obesity [2]. The spread of T2DM and obesity is responsible for increased cardiovascular morbidity and mortality [3].
The therapeutic approaches currently available to manage T2DM in patients with obesity are divided into non-surgical treatments (such as an adequate diet, physical activity, and pharmacological treatments) and bariatric and metabolic surgery (BS). BS is considered a valid therapeutic option for those patients where lifestyle interventions and drug therapy are ineffective [4,5,6]. Furthermore, several studies have reported the supremacy of BS over non-surgical treatment on the glyco-metabolic profile of patients with T2DM and obesity [7,8,9].
To date, BS includes different types of interventions: restrictive, hypo-absorptive, malabsorptive, and all three combined, with each intervention affecting the hormonal and glyco-metabolic profile in a different way [10,11].
BS guarantees rapid and considerable weight loss and significantly reduces calorie intake [9,10,11]. In addition, changes in the entero-hormonal pattern after BS play a decisive role in decreasing postprandial glycaemia and increasing insulin secretion. Many studies support the hypothesis that the anatomical changes induced by surgery not only play a decisive role in weight reduction, but also modify the release of gut peptides, including incretin and peptide glucagon-like peptide-1 (GLP-1), leading to improvements in glycemic homeostasis [12,13].
The remission of T2DM after BS is described in many cases and measured by achieving specific targets relating to fasting glycemia and glycated hemoglobin (HbA1c) in the absence of hypoglycemic therapy [14,15]. However, this is not a sustainable outcome in all patients, as some studies have shown a long-term relapse of T2DM in those subjects who initially went into remission [16,17,18,19,20]. Old age, disease duration, poor metabolic control, and the intensity of treatment have all been identified as unfavorable factors in T2DM remission [16,17,21,22]. However, the ability to accurately predict BS failure or the eventual recurrence of obesity would be useful for clinical practitioners when selecting those patients who could benefit from more intensive follow-up and/or associated drug treatment after BS. In this context, the study of the serum metabolic profiles of T2DM patients before and after BS would be necessary in order to understand the effectiveness of surgery.
Raman spectroscopy (RS) is an optical technique that offers the possibility of gaining an overview of the biochemical profile of the sample without any preparative process and at almost no cost except for instrumentation. RS is based on the analysis of the light scattered inelastically by a sample under the irradiation of an intense laser source. When applied to the study of biological samples, RS is able to provide a rapid overview of multiple molecules of different natures, such as proteins, small metabolites, and lipids [23]. However, even if the obtained spectra are in rich information, RS does not provide directly quantitative information on the expression of specific genes or proteins, with only a few specific exceptions, such as hemoglobin and other metalloproteins [24].
RS provides a promising non-invasive approach to studying metabolic conditions by detecting HbA1c and glucose levels for monitoring diabetes [25]. Previous studies have demonstrated RS’s potential in discriminating, with high sensitivity and specificity, between healthy and T2DM subjects [26,27,28]. This result is in accordance with several other articles in which RS appears to perform well in case-control studies focused on diagnosing diseases with metabolic implications [25]. Furthermore, RS is able to provide information about the composition of lipoproteins. Ricciardi et al., have demonstrated the suitability of RS for the characterization of the main classes of lipoproteins, suggesting that RS is a valid and reproducible approach that requires less labor than traditional lipidomic analysis [29].
However, the literature on the use of RS to assess the effectiveness of a treatment is, to the best of our knowledge, very limited.
The aim of the present study is thus to investigate the metabolic Raman fingerprint in obese T2DM patients (Ob-T2DM) before and after BS, in order to prove the effectiveness of RS as a tool for monitoring BS efficacy and the clinical management of patients. Raman spectra were acquired from the serum of Ob-T2DM patients before BS and between six and twelve months after the surgery when patients were in remission from the disease. A control group of healthy subjects (HC) was also enlisted in order to observe whether the metabolic fingerprint of bariatric patients normalizes over time. We also conducted an integrative analysis that evaluated the clinical parameters and dosing of adipokines, ghrelin and FGF-19, so as to effectively characterize the efficacy of BS in selected patients.

2. Materials and Methods

2.1. Study Population

A group of 14 obese patients of either sex, with a BMI > 35 kg/m2, diagnosed with type 2 diabetes, and aged <65 years was recruited (Ob-T2DM). All Ob-T2DM subjects underwent BS with duodenal diverted sleeve gastrectomy with ileal interposition (DDSG-II), at the Department of General Surgery, Luigi Sacco Hospital in Milan (Italy) between 2008 and 2012. The patients were studied before and during clinical remission after the surgery. The diagnosis of T2DM was determined according to the American Diabetes Association criteria [30].
At baseline, we collected data on both anthropometric (body weight, BMI, waist, and hip circumference) and laboratory values. Patients were scheduled for follow-up to assess the durability of glycemic control. T2DM remission was based on HbA1c below 6% (42 mmol/mol) [14,31,32].
A control group of 23 healthy volunteers (HC) without a history of obesity and T2DM (mean age 43.1 ± 13.2 years; mean body mass index [BMI] 21.7 ± 2.2 kg/m2) was examined.
The present study was conducted according to the principles expressed in the Declaration of Helsinki. Informed consent was obtained from all of the individual participants included in the study.

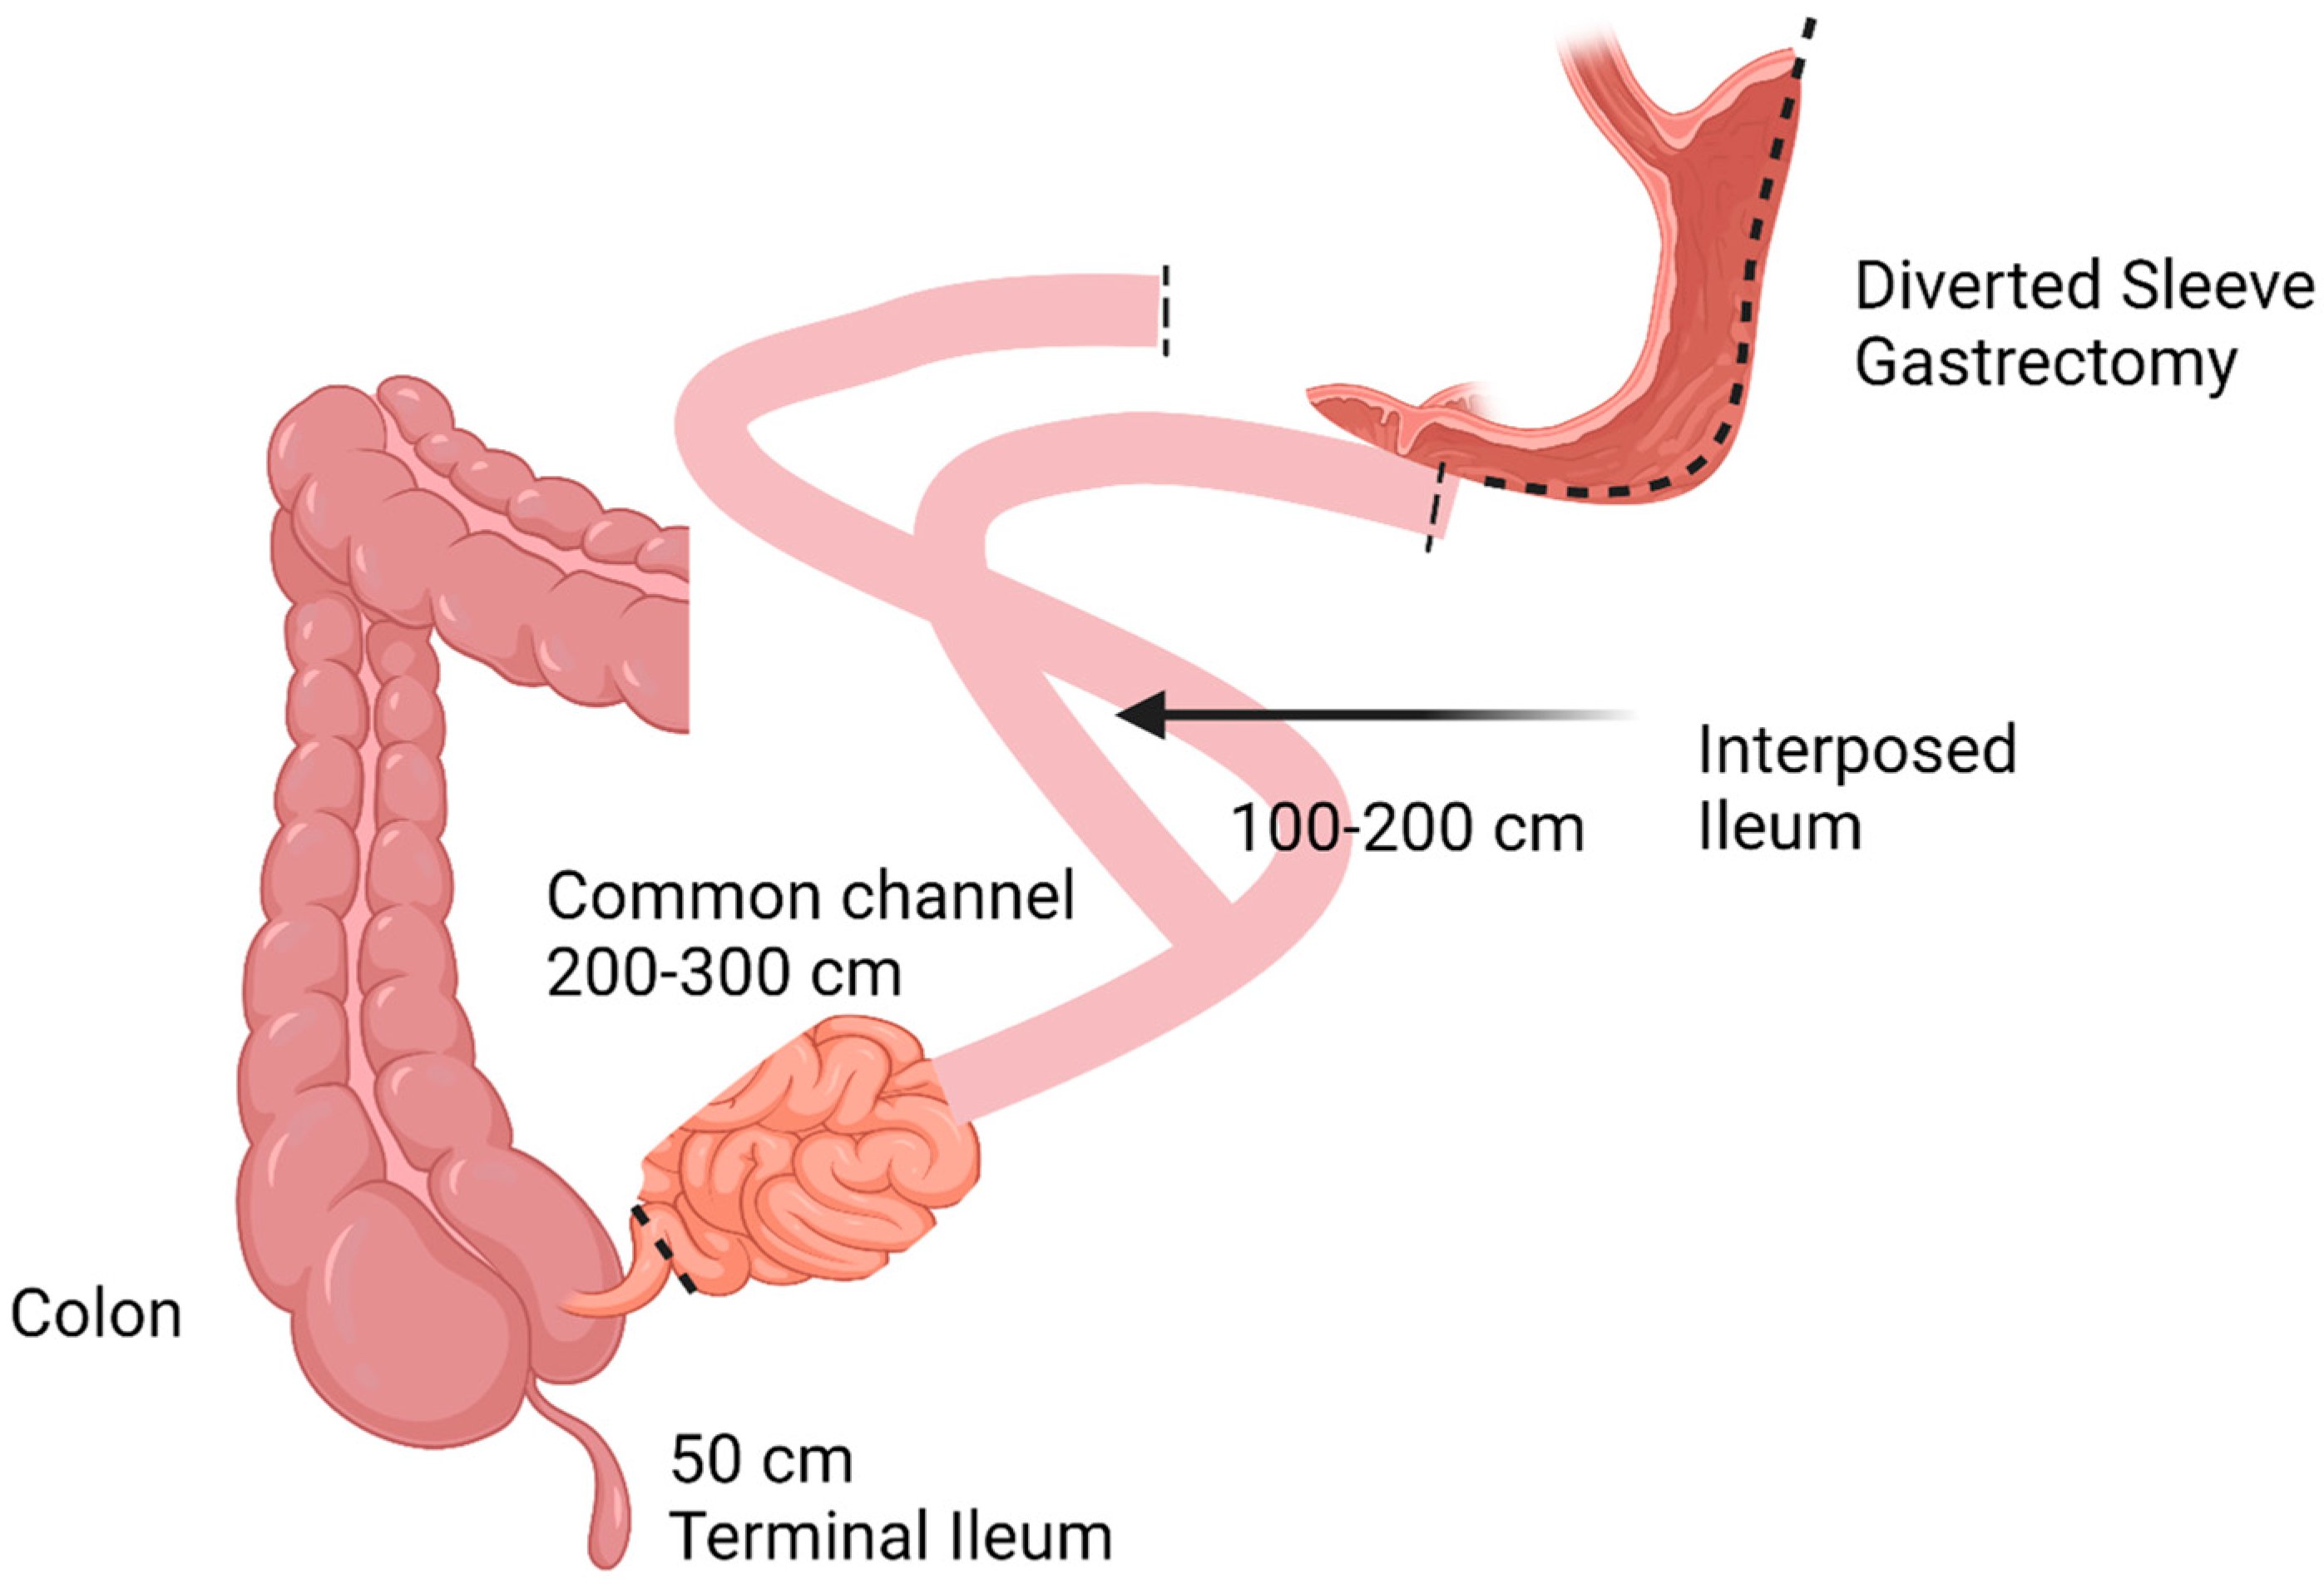
2.2. Brief Description of Surgical Procedures

All patients underwent laparoscopic surgery under general anesthesia as described by Foschi et al. [33]. The surgical procedure involves two main steps: overmesocolic with performance of sleeve gastrectomy followed by ileal interposition. Fasting glucose levels were used to select the length of the ileum loop (Figure 1) [33].

2.3. Serum Biochemistry

Blood samples were collected at baseline and at follow-up visits in serum (clot activator) tubes. Serum samples were separated by blood centrifugation at 1000× g for 10 min at room temperature. Samples were stored at −80 °C until use.
The serum concentration of the adipokines leptin and adiponectin, the gastrointestinal hormone ghrelin, and the enterokine FGF-19 were analyzed by commercially available enzyme-linked immunoassay (ELISA) kits (R&D System for leptin and FGF-19; Merck for ghrelin and adiponectin) according to manufacturers’ protocols. Measurements were performed in duplicate.

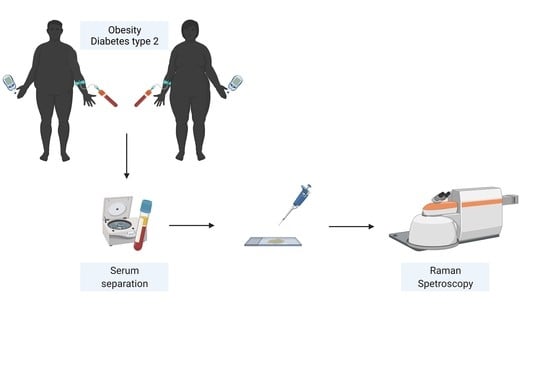
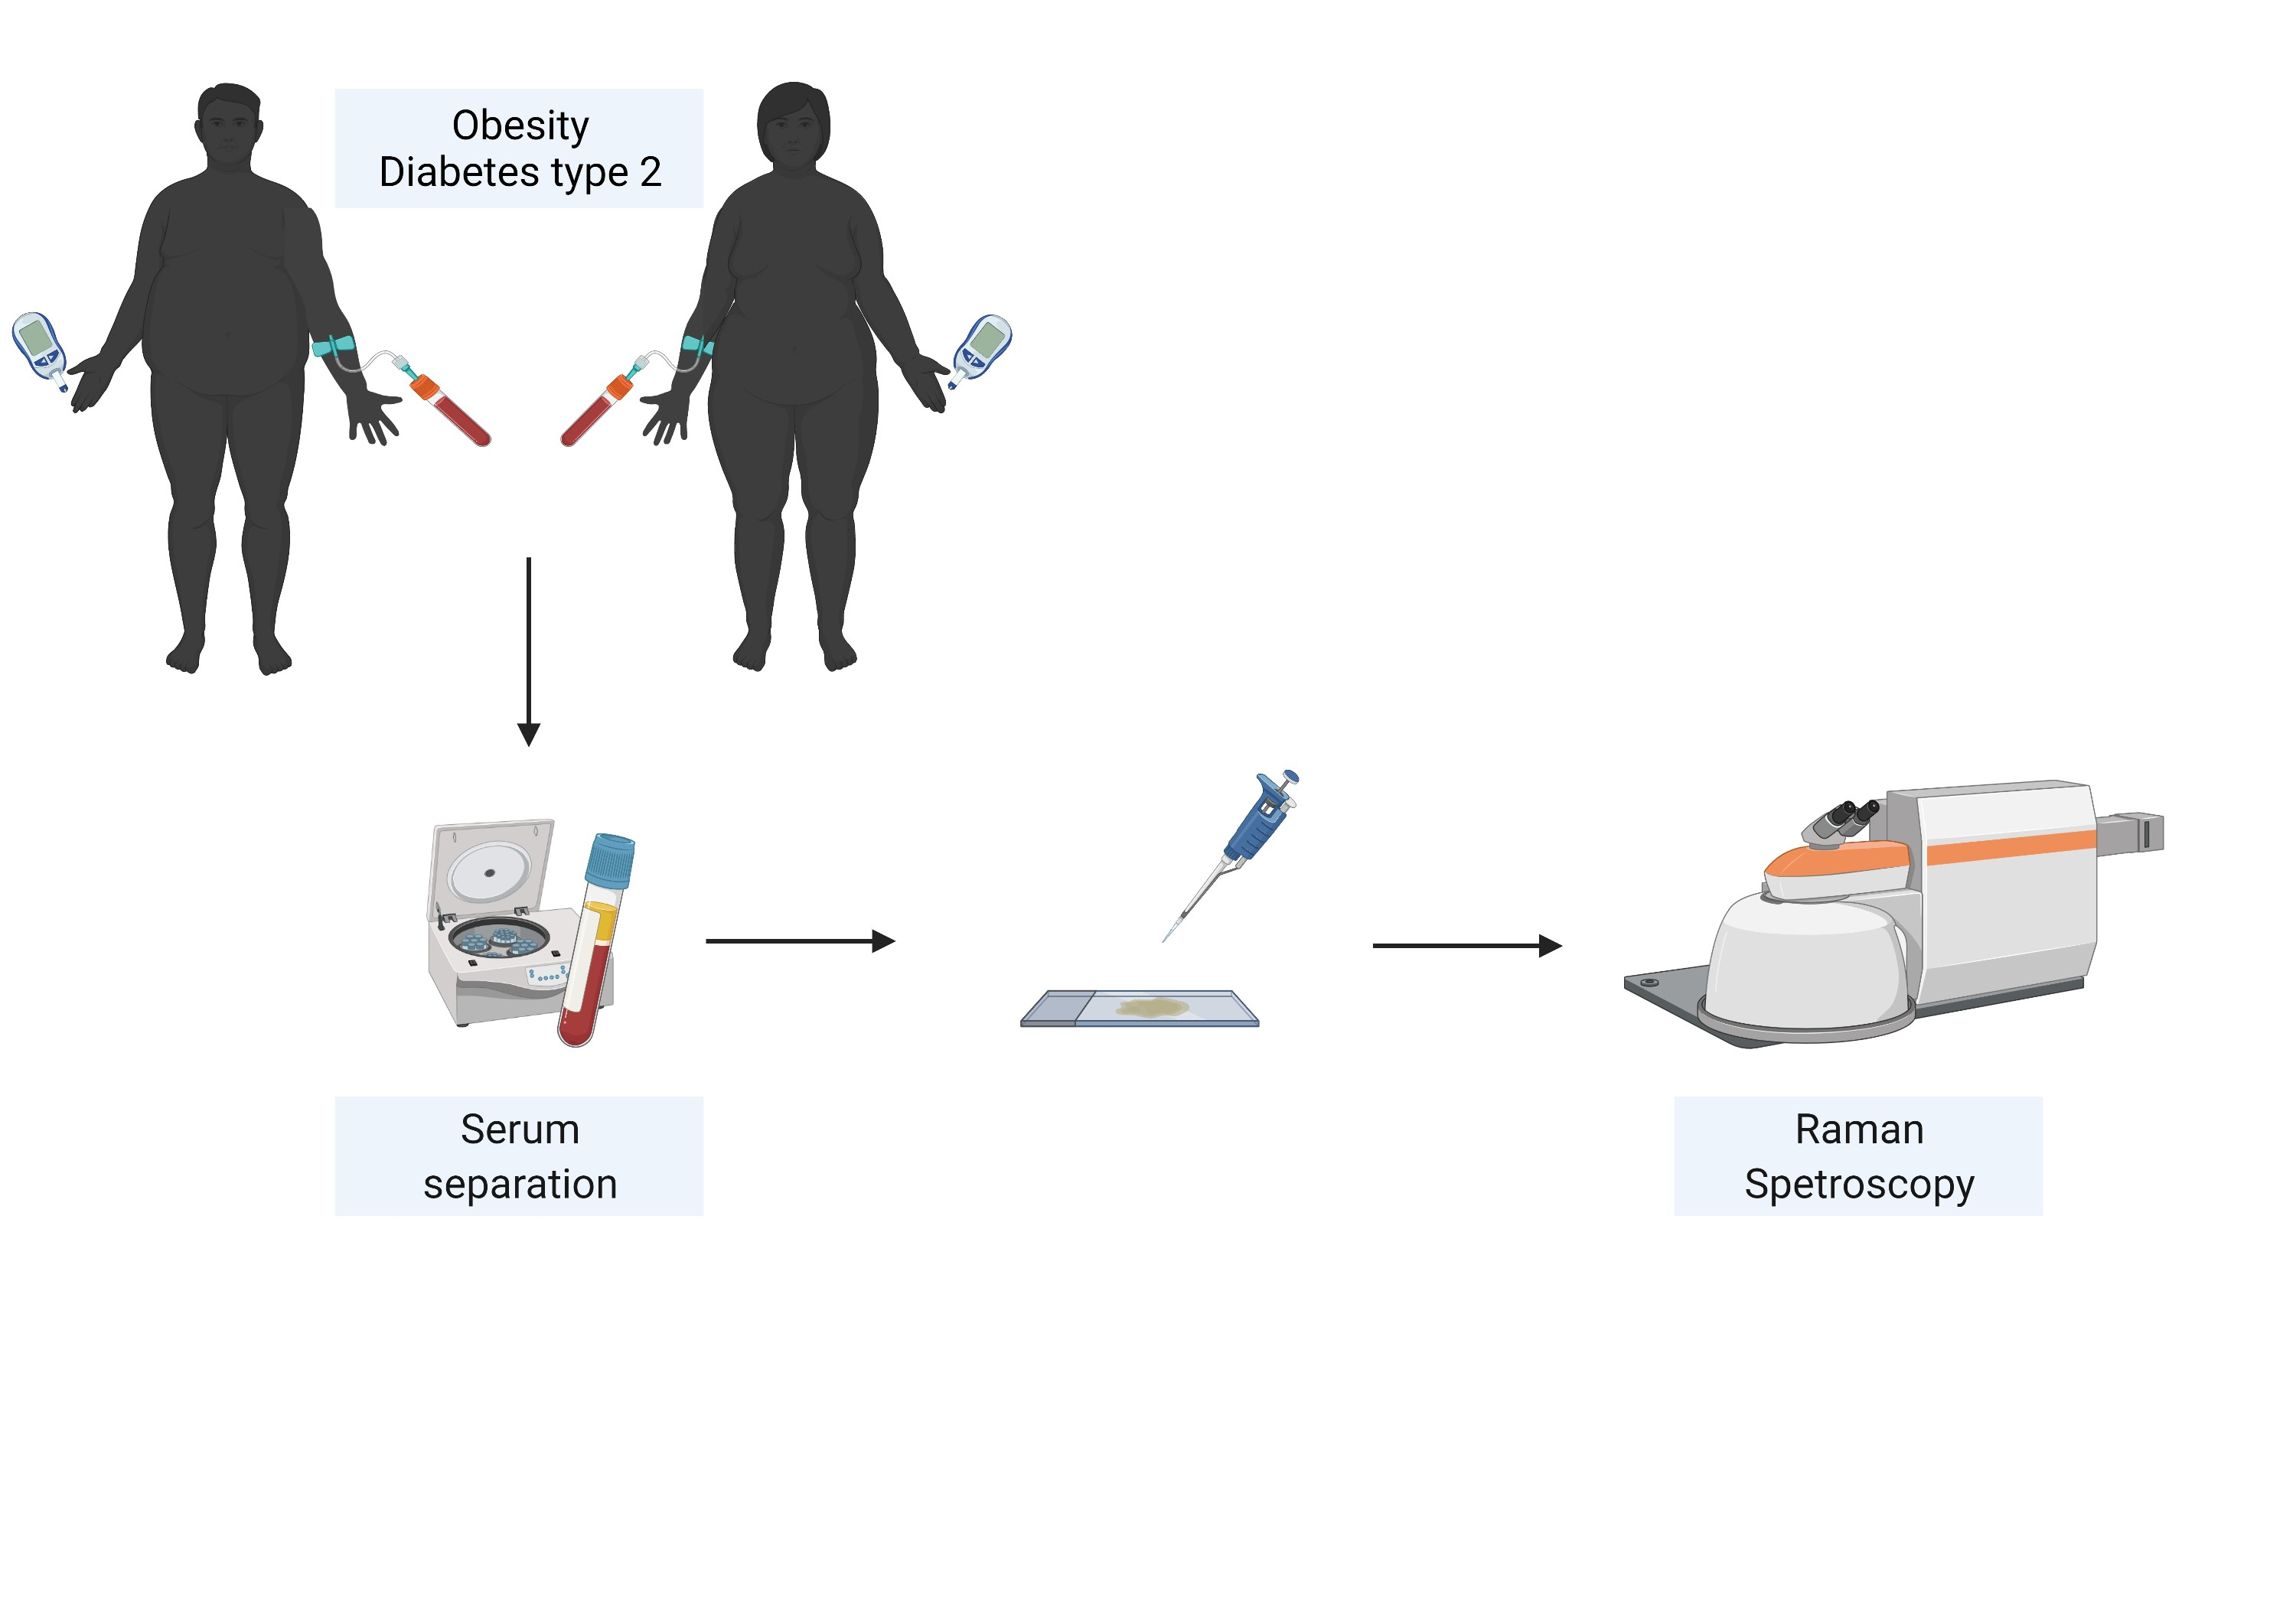
2.4. Raman Spectroscopy

An InVia Reflex confocal Raman microscope [Renishaw, Wootton-under-Edge, UK] equipped with a laser wavelength of 785 nm was used to acquire all spectra. The Raman spectrometer was calibrated daily with a silicon wafer using the peak at 520.7 cm−1.
The acquisition of Raman spectra from the serum of the subjects included was performed according to a protocol previously described [34].
Briefly, a small drop of serum (4 µL) was placed onto the surface of a CaF2 slide (Crystran, Dorset, UK) and dried for 20 min at room temperature. The Raman spectra were acquired using a 785-nm laser, a 1200 l/mm grating, and a 100× objective. All spectra were acquired in the region of 400 to 1800 cm−1. For each sample, three spectra were collected from different positions in the drop. The software package WIRE 5 (Renishaw, UK) was used for spectral acquisition and to remove cosmic rays and background fluorescence using a 5th order polynomial fit. Spectra of each sample were vector normalized, and the average of the three spectra was considered as the final spectrum representative of each subject. Spectrum normalization and data analysis were carried out using OriginPro software (OriginLab Corporation, Northampton, MA, USA).

2.5. Statistical Analysis

Data were presented as mean ± SD. We verified the normal distribution of the data and considered the data as normal only if the Shapiro–Wilk test accepted the null hypothesis of the normal distribution. We performed parametric [t test] or non-parametric [Mann–Whitney test] tests to compare mean values between groups. Statistical significance was set at p < 0.05. Multivariate analysis of data was carried out using the principal component analysis (PCA) tool function of Orange data mining software [35,36].

3. Results

3.1. Clinical Characteristics of Study Groups

Fourteen subjects with obesity and T2DM undergoing BS with DDSG-II were included in the study. All patients were examined before and after surgery. At baseline, body weight, BMI, waist and hips circumference, insulin levels, glycemia, HAb1c%, total cholesterol, and triglycerides were significantly higher in the Ob-T2DM group, whereas HDL cholesterol concentrations were lower (Table 1).
As expected, after a variable post-surgical period of 6–12 months, Ob-T2D patients experienced a significant reduction in all anthropometric measurements (weight, BMI, waist and hips circumference), suggesting a return to non-obese condition. Furthermore, insulinemia improved as evidenced by the decrease in insulin concentrations. There was also a significant decrease in the HbA1c mean values as a result of the T2DM remission. We observed an expected significant reduction in circulating triglycerides and total cholesterol, as well as an increase in HDL-cholesterol concentrations after BS (Table 1). All these data evidenced that BS is effective in achieving the clinical remission of obesity and T2DM.

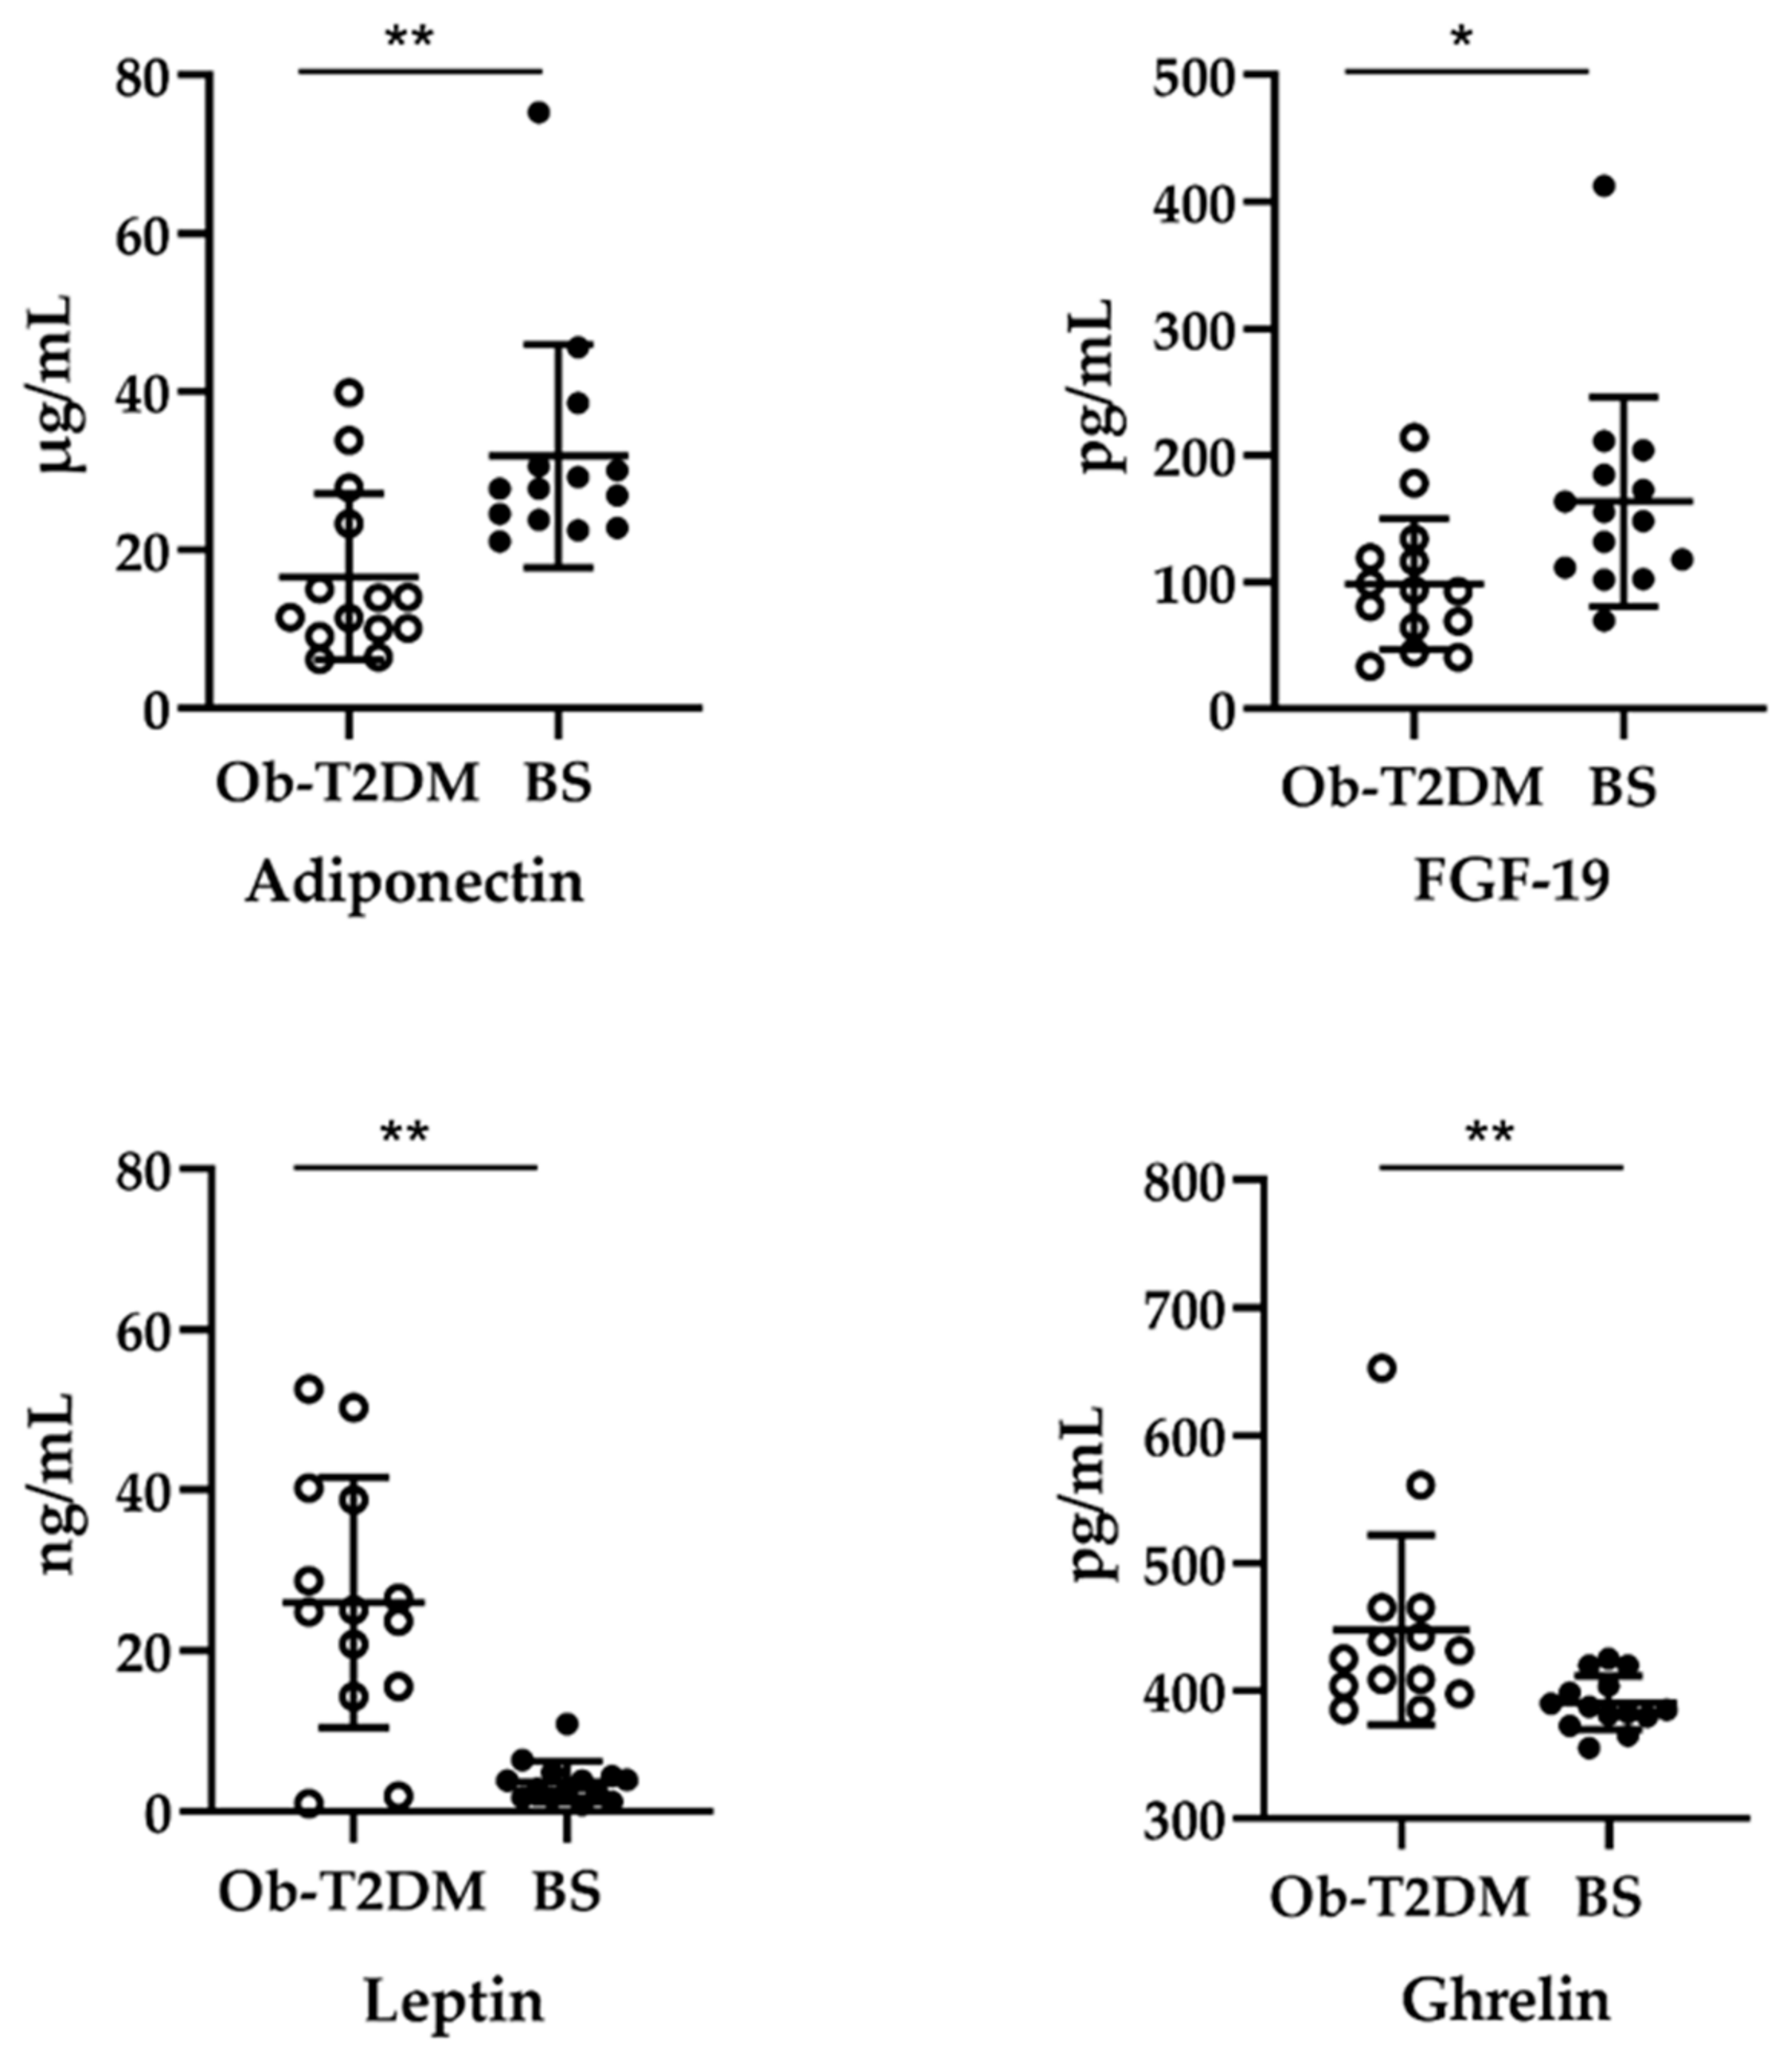
3.2. Effect of Bariatric Surgery on Serum Adipokines, Ghrelin, and FGF-19

To evaluate if BS with DDSG-II normalized the release of serum adipokines, ghrelin, and FGF-19, we assessed patients’ levels before and after BS, in order to correlate the effect of BS on T2DM resolution.
Analysis of circulating adipokines, ghrelin, and serum FGF-19 levels between groups showed interesting trends (Figure 2). The results demonstrated that after BS the serum adiponectin and FGF-19 mean levels increased, while the serum leptin and ghrelin concentrations markedly decreased (* p < 0.05; ** p < 0.005) (Figure 2), reaching values similar to those observed in the literature [37,38,39,40,41]. These data confirmed a return to normal values, and corroborated clinical data on the beneficial effects of BS in selected patients.

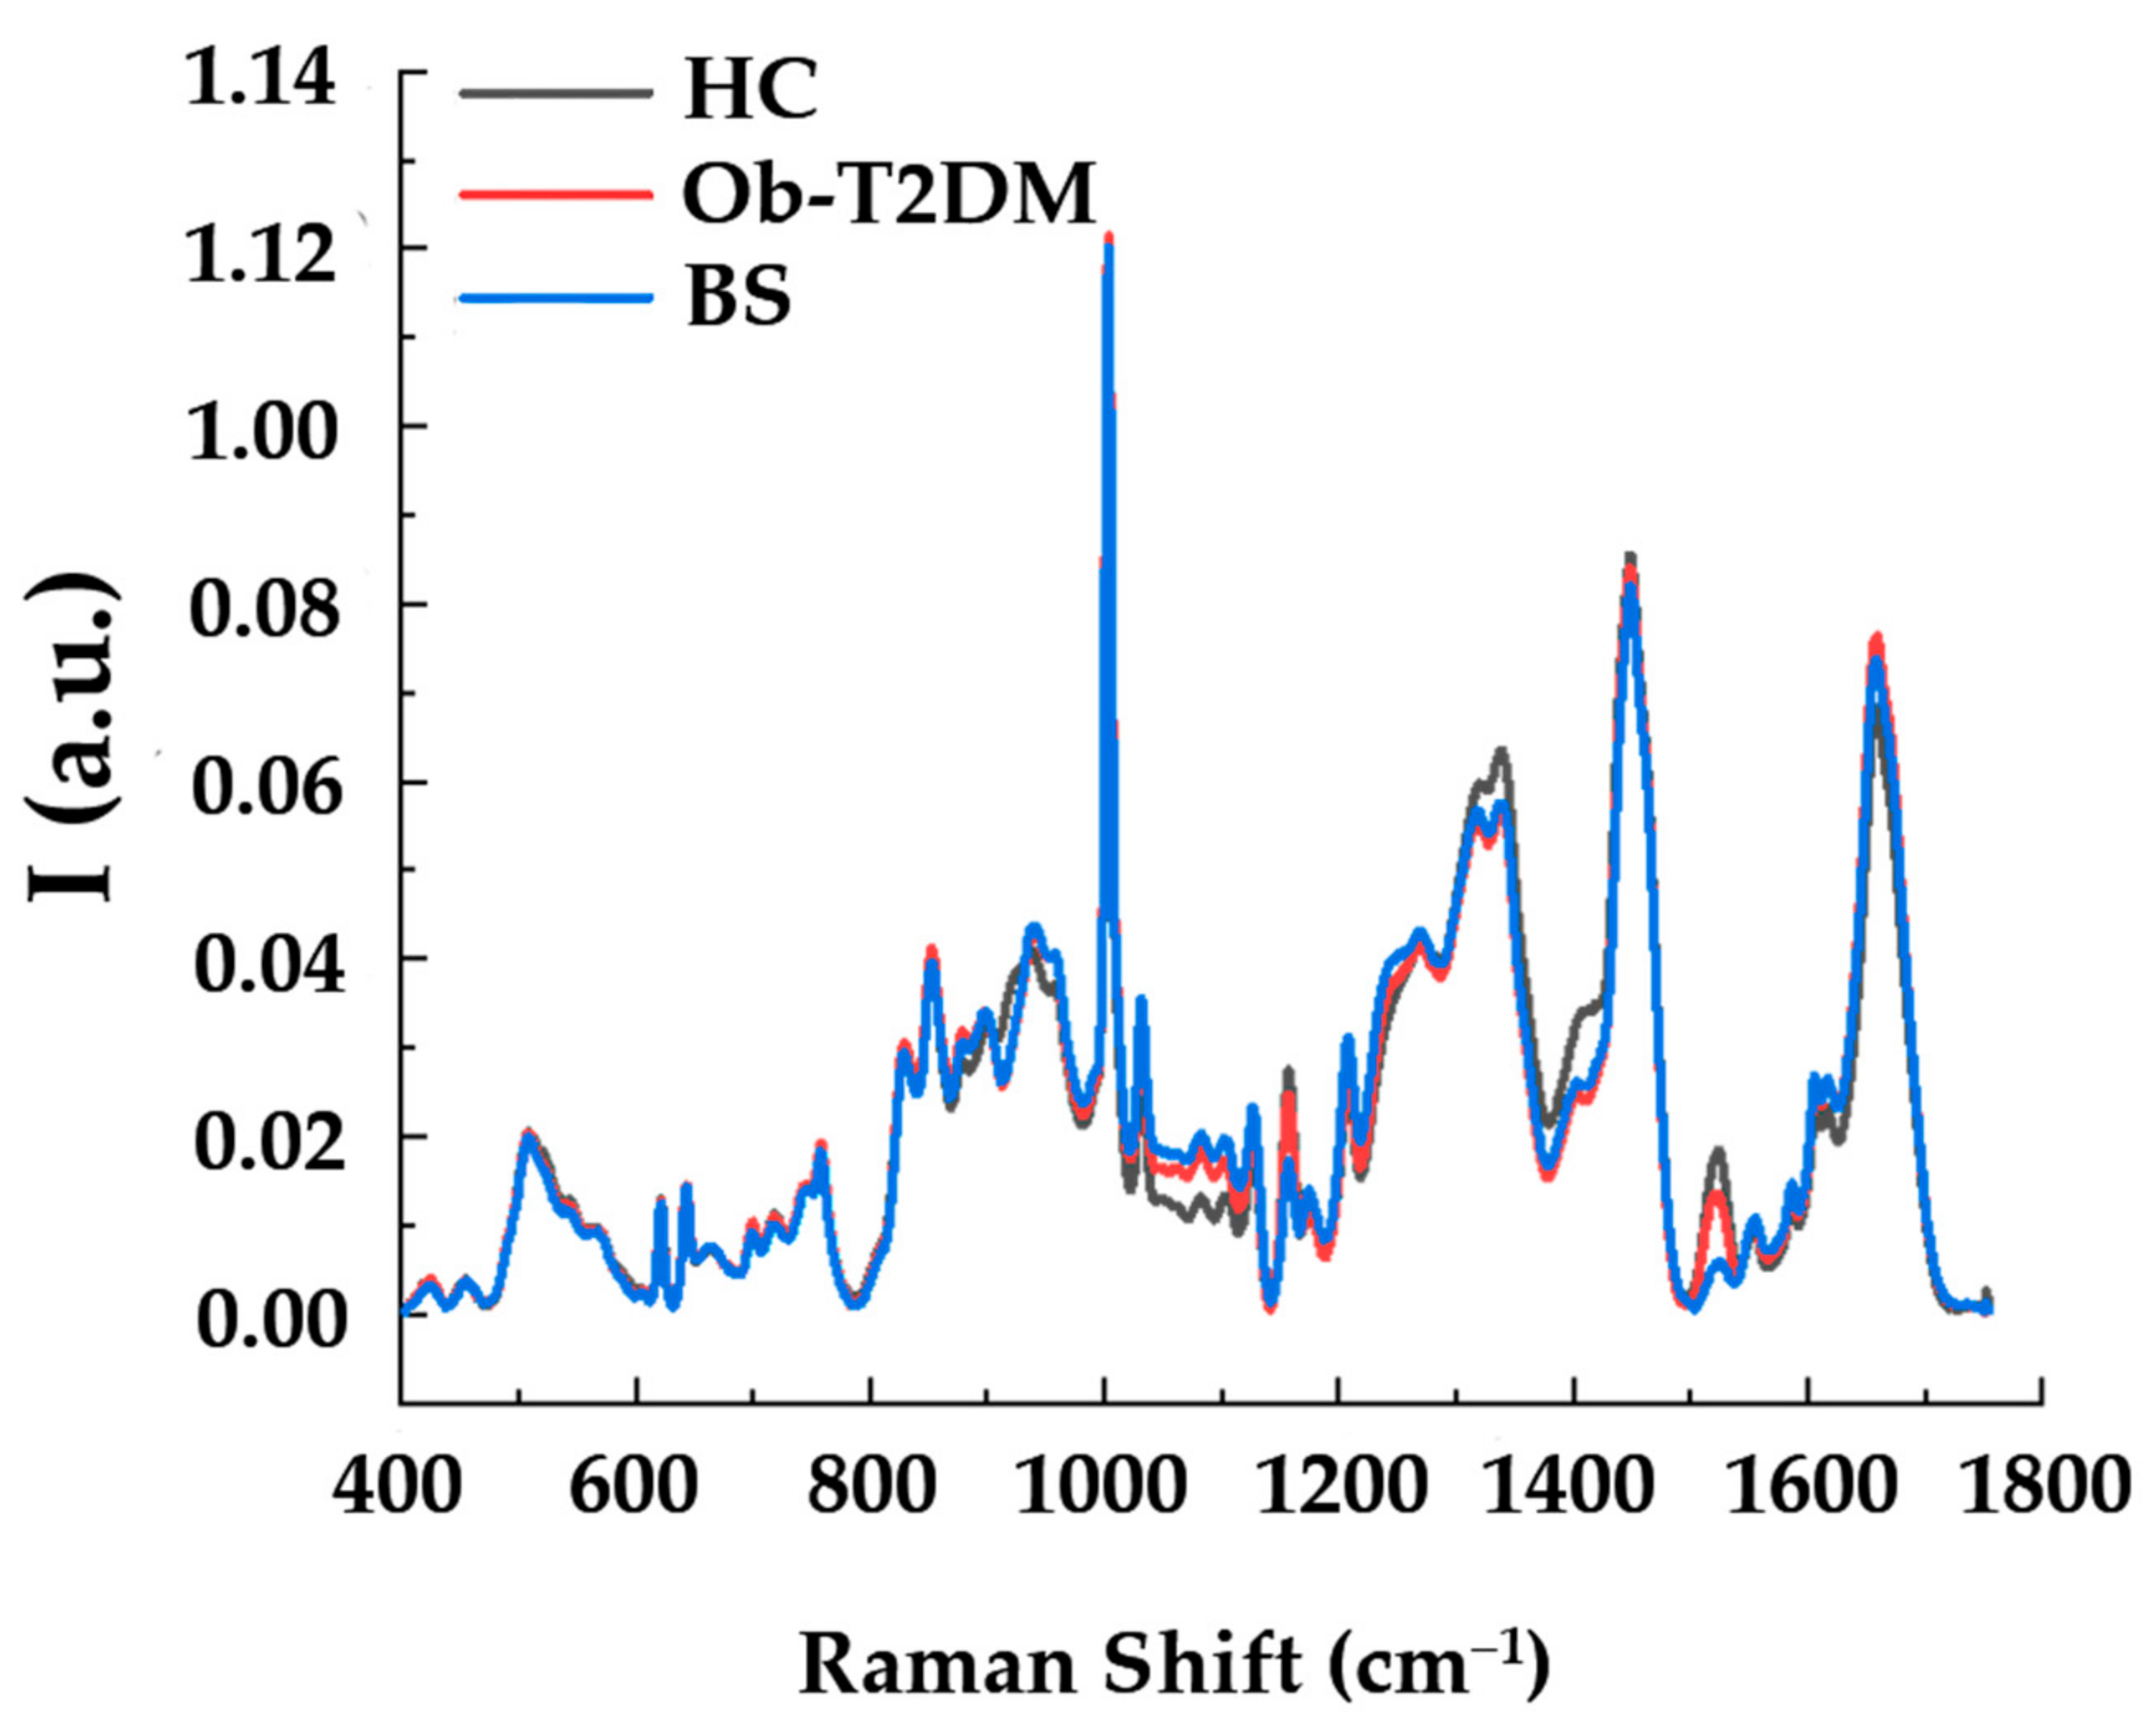
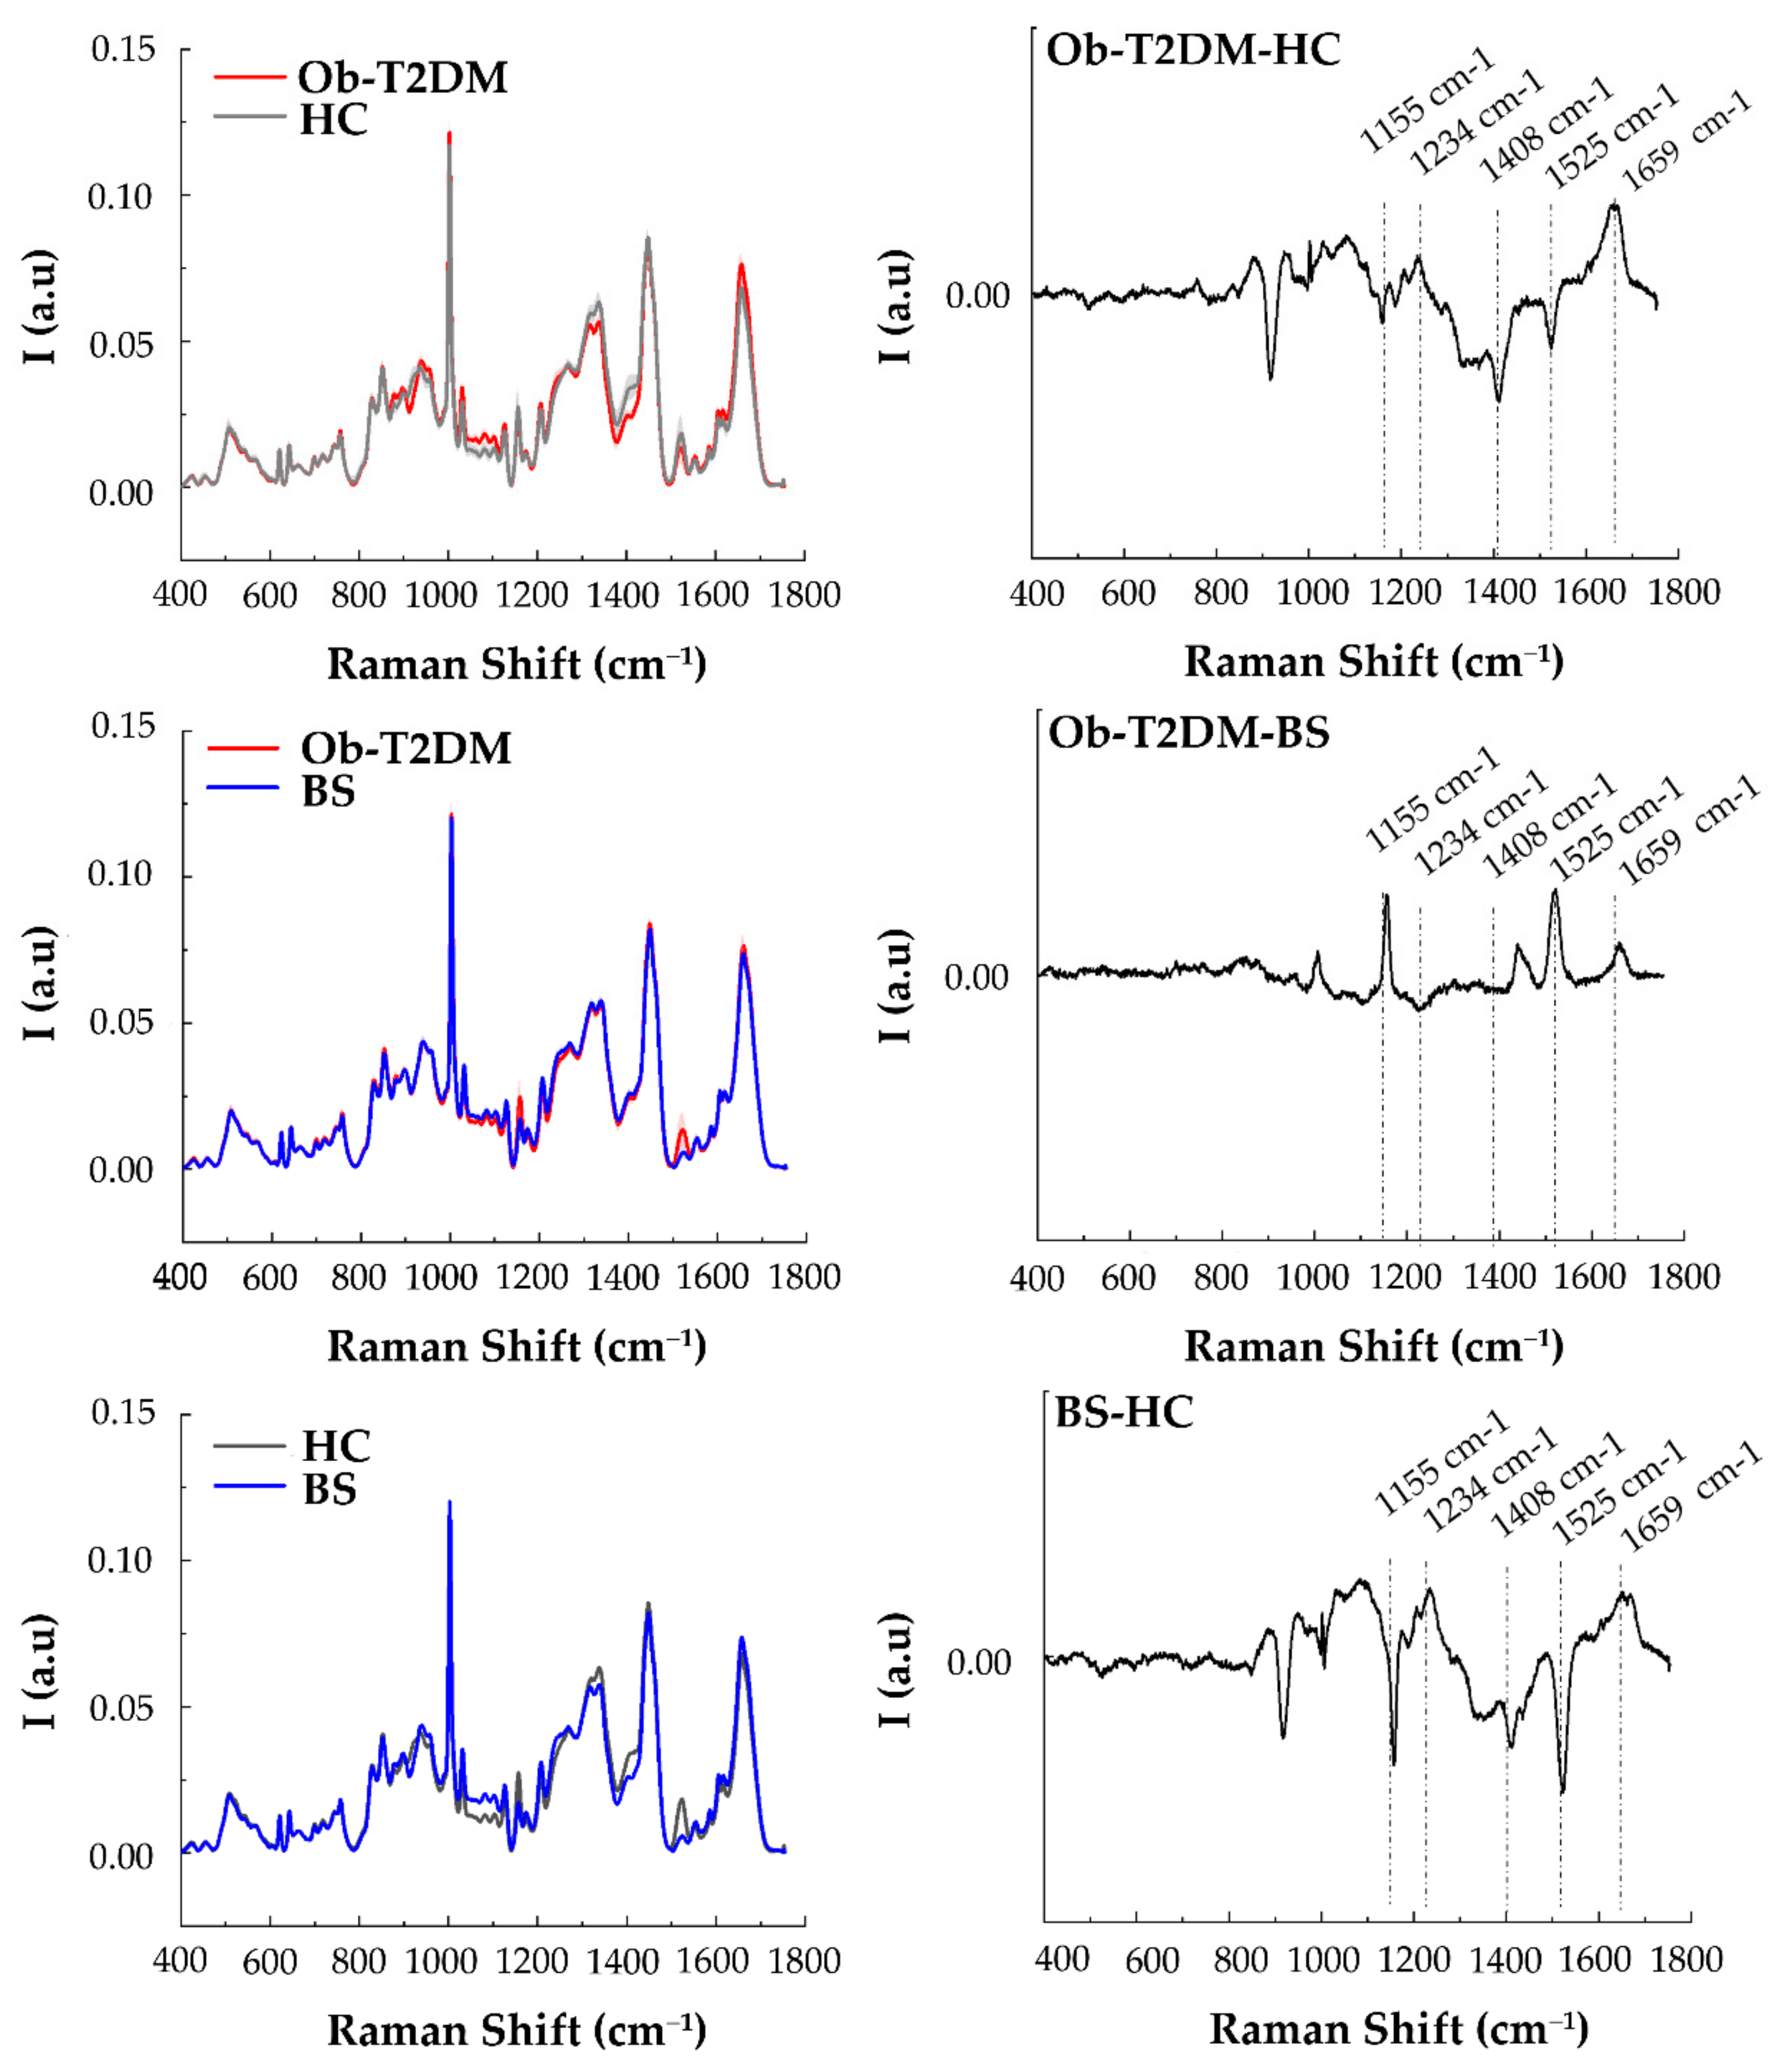
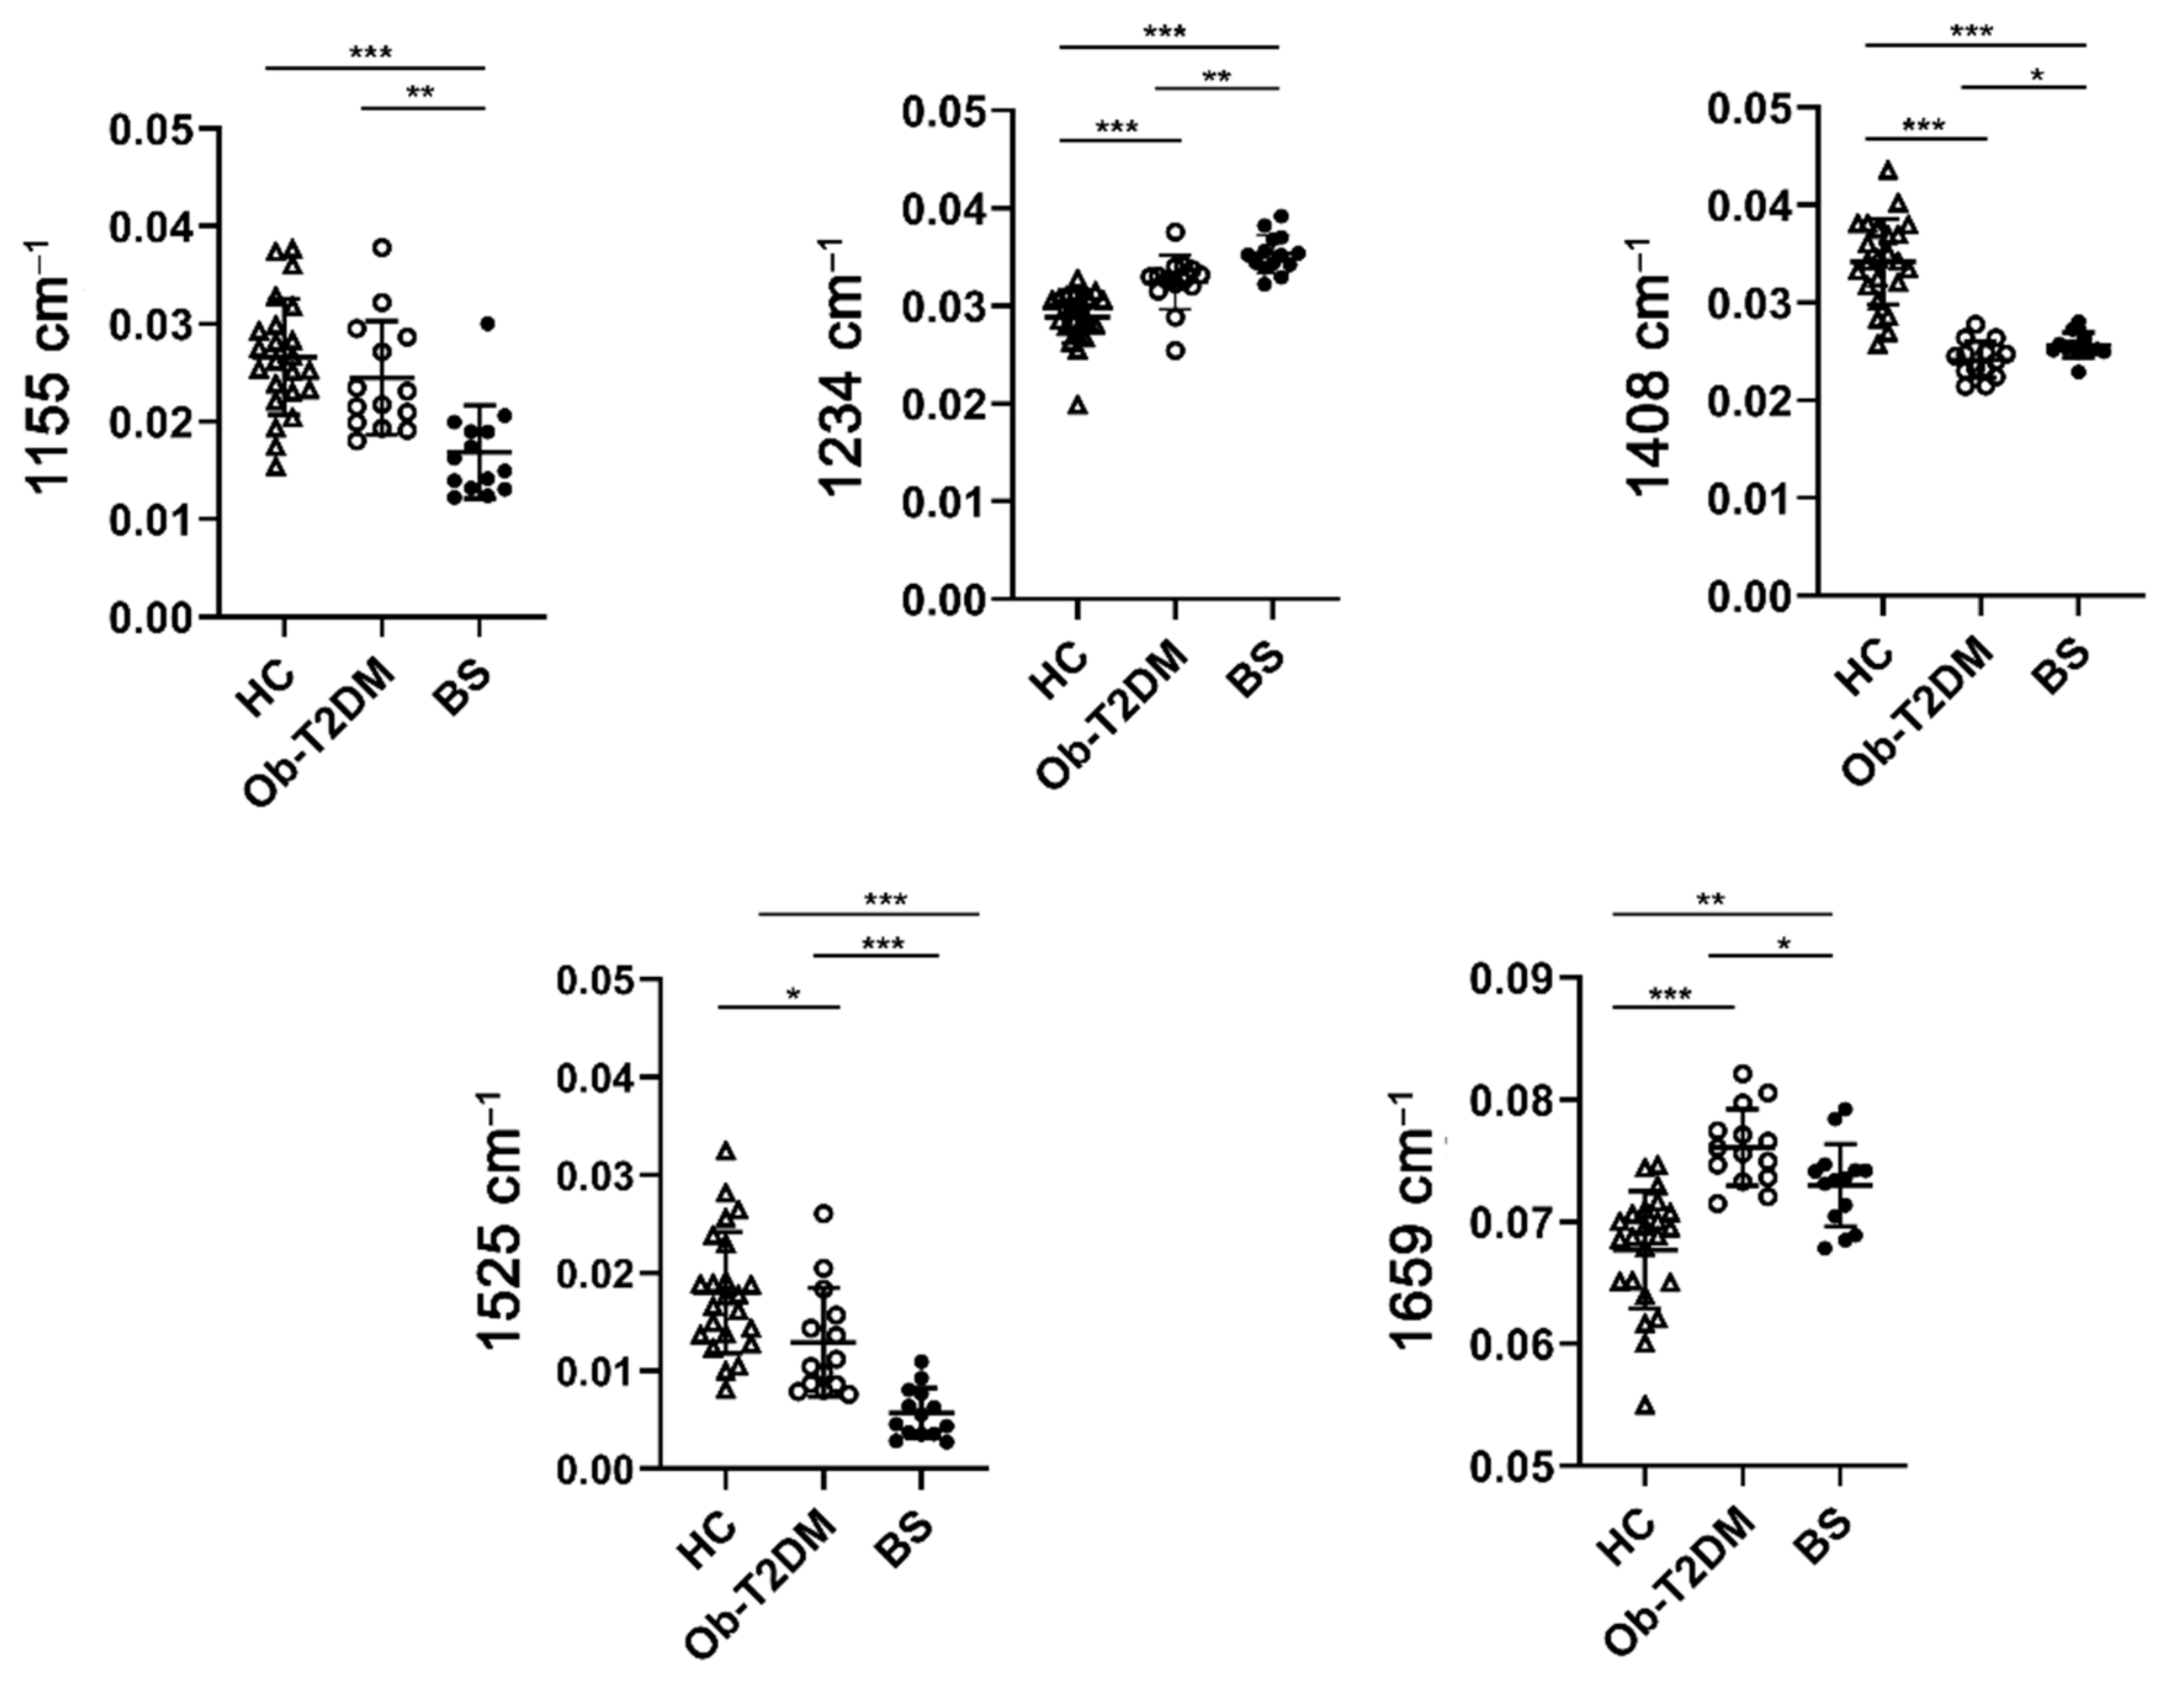
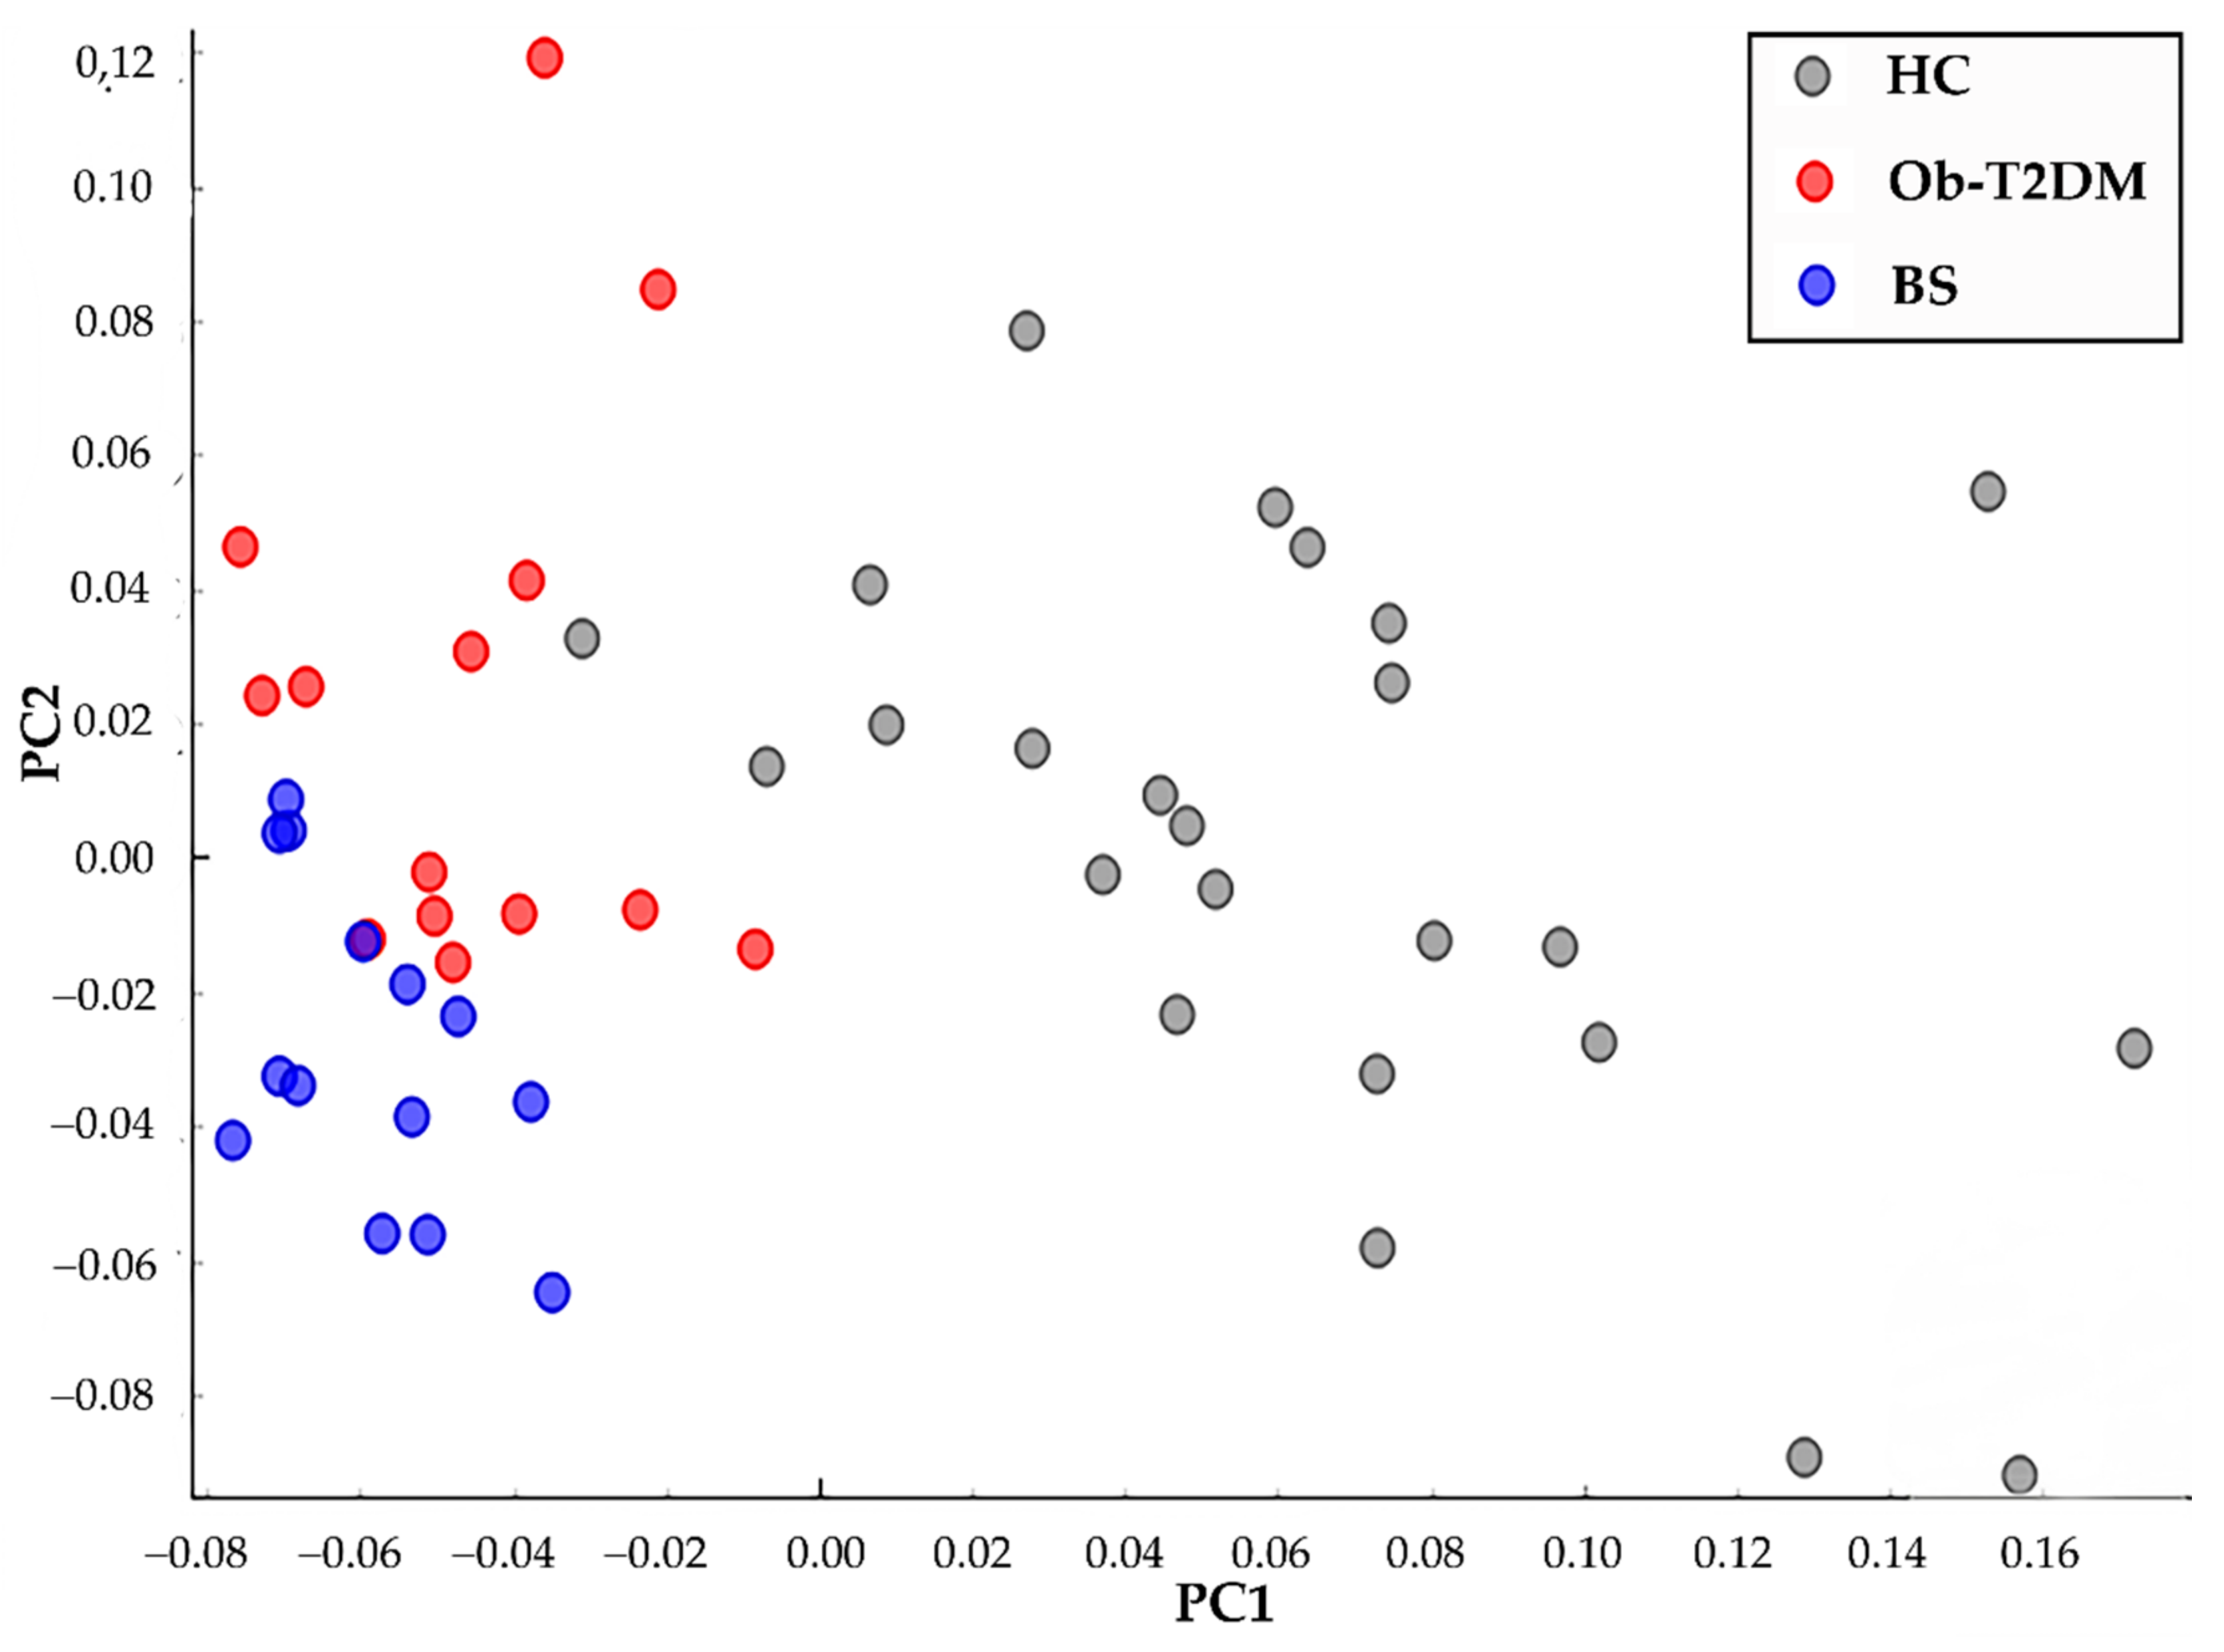
3.3. Raman Analysis of Serum of Patients

In an attempt to identify a metabolic fingerprint, Raman analysis was conducted on serum samples of Ob-T2D patients before (Ob-T2DM) and after surgery (BS). We compared these results with those obtained from a control group of healthy, average weight subjects (BMI 21.7 ± 2.2 kg/m2) matched for age and sex (HC).
The analysis of the Raman spectra allowed us to obtain a biochemical overview of the components of the biological sample and the relative amount without the need to target specific pre-defined molecules. Figure 3 shows the overlay of normalized average Raman spectra of all samples analyzed for each group. Each of the Raman peaks represents a different functional group in the sample and thus variations in their intensity reflect a difference in the relative amount in serum.
A Raman analysis, which obtained differential spectra between each group, revealed the most significant biochemical differences between HC, Ob-T2DM, and BS (Figure 4). The differential spectrum that subtracted HC signals from Ob-T2DM evidenced a decrease in 1155, 1408 and 1525 cm−1 peaks and an increase in 1234 and 1659 cm−1 peak. These peaks remained consistent when we removed HC signals from BS. However, when we attempted to subtract signals of BS samples from Ob-T2DM, differential spectra resulted in positive peaks at 1155, 1408, 1525, and 1659 cm−1, while the peak at 1234 cm−1 was negative.
To better understand the significance of these differences, we analyzed each peak individually. Figure 5 shows the statistically significant variations observed between the three groups. Statistically relevant differences were observed in the peaks corresponding to amide III [1234 cm−1], amino acids [1408 cm−1], carotenoids [1155 cm−1 and 1525 cm−1], and amide I [1659 cm−1].
Specifically, higher Amide III peaks [1234 cm−1], associated with an increase in β–folded proteins, and less intense Amide I peaks I [1659 cm−1], related to a reduction in α-helix proteins, were evident in BS group when compared with Ob-T2DM [42]. In addition, bariatric patients were characterized by less intense peaks of carotenoids [1155 cm−1 and 1525 cm−1] in comparison to HC and Ob-T2DM. These differences were predictable since micronutrient deficiency, including of carotenoids, is common after BS because this procedure causes anatomical and physiological changes to the gastrointestinal tract that may affect nutrient absorption [43,44].
Other statistically significant differences were also observed at 1408 cm−1, the peaks related to amino acids [45]. After BS, amino acid peaks increased when compared with Ob-T2DM patients, despite remaining statistically lower than HC. The metabolic–biochemical overview obtained by RS appeared to prove that a Raman profile of BS group did not overlap with the Raman signature obtained from HC despite clinical anamnestic and biochemical data suggesting an improvement in the parameter analyzed.
To confirm the altered metabolic profile of the patients after BS, as observed in the statistical analysis of each peak, spectra of all groups were pooled and further analyzed using principal component analysis (PCA). PCA is a statistical method that reduces the number variables necessary to determine similarities/differences among groups. In our dataset, the first two PCs described 67% of the variability data available as Supplementary Data.
By plotting the score of PC1 and PC2, it was possible to identify three well-localized zones (as shown in Figure 6): one containing the grey dots corresponding to the spectra of the HC patients, another containing the red dots corresponding to the spectra of the Ob-T2DM subjects, and a final one containing the blue dots corresponding to the spectra of patients after BS. However, the results of PCA analysis clearly prove that the metabolic/biochemical Raman fingerprint of BS does not overlap with those of HC. On the contrary, their PC1 scores are not different from those of Ob-T2DM. Furthermore, PC2 scores of the HC do not differ from BS or Ob-T2DM. This suggests that the Raman spectra of BS patients are different from those of HC, which, in turn, suggests a persistent alteration in the biochemical profile in these patients.

4. Discussion

Bariatric surgery (BS) is an effective method for achieving sustained weight loss and improvement in comorbidities, and as such it is an essential tool for the management of obese T2DM patients. In this study, we examined the effects of BS on changes in the body composition and the systemic metabolism of Ob-T2DM patients from multiple points of view. Specifically, we studied the anthropometric measurements in addition to glycemic and lipid profiles, as commonly used in clinical practice. We also measured adipokines, ghrelin, and FGF-19 levels, and studied the metabolic profile of patients using Raman spectroscopy.
Anthropometric measurements, glycemic control, and lipid profile were taken during the baseline evaluation and follow-up visits. The reduction in anthropometric measurements after surgical treatment, in addition to improved glycemic control and lipid profile, highlighted the benefits of BS.
Consequently, the measure of serum adipokines, ghrelin, and FGF-19 levels after bariatric procedures confirmed that patients after BS show considerable improvements and can obtain values similar to those reported in the literature [37,38,39,40,41]. However, RS data highlighted an altered metabolic profile even after BS.
As reported in previous studies, the RS fingerprint of serum samples from T2DM subjects is clearly different from those of HC [26,27]. T2DMs have lower levels of carotenoids (peaks at 1157 and 1523 cm−1) and amino acids (1408 cm−1). In addition, they show an altered profile in the secondary structure of proteins. After surgical treatment, the Raman fingerprint remains very similar to the one observed in the samples collected before the surgery, with the notable exception of the two peaks relative to carotenoids, whose intensity is even more reduced. The low level of carotenoids observed by RS is in accordance with previous work highlighting how BS induces malabsorption of vitamins and micronutrients [44,46,47].
The fact that the metabolic fingerprint observed by RS in the BS subjects did not overlap with the Raman profile obtained from HC, despite improvements in the major clinical parameters, suggests that BS does not fully restore the metabolic profile of patients in the immediate follow-up after surgery.
Our study has several limitations that need to be acknowledged. The first is that it includes only a small number of subjects, so our results will need to be confirmed by larger prospective studies that include more subjects. Moreover, a group containing non-obese T2DM subjects should also be recruited in any prospective study. Another important limitation of our study concerns the relatively short duration of the follow-up period, which did not allow us to verify the continuing benefits of surgery on the glyco-metabolic profile of patients. Therefore, a follow-up at 18 and 24 months should also be included in a larger prospective study to further examine the metabolic profile of patients after surgery.

5. Conclusions

In conclusion, our results show that BS analysis of serum may be an effective tool for identifying specific metabolic changes in Ob-T2DM patients’ profiles. Despite the major clinical parameters and serum adipokines, ghrelin, and FGF-19 data suggesting an improvement in the parameters analyzed after BS, RS data highlighted an altered metabolic profile even after BS. Overall, these results support the need for a study with a longer follow-up period to assess the capacity of RS for monitoring the benefit of BS on the metabolic profile of patients.

Supplementary Materials

The following are available online at https://www.mdpi.com/article/10.3390/app112210710/s1, Figure S1: PCA analysis: proportion of variance explained by 2 PCs.

Author Contributions

F.C., C.M. and S.M. conceived and designed the study; A.R. and L.C. selected and recruited subjects; A.B., M.S. and L.S. analyzed hormonal profiles; A.B. and C.M. acquired Raman spectra; A.B., C.M. and S.M. analyzed the data; A.B., C.M. and S.M. wrote the manuscript; M.S., L.S., A.R., L.C. and F.C. revised the paper; S.M. and C.M. supervised the study. All authors have read and agreed to the published version of the manuscript.

Funding

This research received no external funding.

Institutional Review Board Statement

The study was conducted according to the guidelines of the Declaration of Helsinki, and approved by the ethical committee of “L. Sacco” University Hospital and of ICS Maugeri IRCCS.

Informed Consent Statement

Informed consent has been obtained from patients involved in this study, according to ethical guidelines of “L. Sacco” University Hospital and ICS Maugeri IRCCS.

Data Availability Statement

Data available in a publicly accessible repository of University of Milan https://doi.org/10.13130/RD_UNIMI/KENMGV, after publication.

Acknowledgments

The authors acknowledge Foschi D. for helpful discussion and University of Milan for A.B. PhD fellowship. Figure 1 and Graphical abstract have been created with BioRender.com (accessed on 12 October 2021).

Conflicts of Interest

The authors declare no conflict of interest.

References

  1. Leitner, D.R.; Frühbeck, G.; Yumuk, V.; Schindler, K.; Micic, D.; Woodward, E.; Toplak, H. Obesity and Type 2 Diabetes: Two Diseases with a Need for Combined Treatment Strategies—EASO Can Lead the Way. Obes. Facts 2017, 10, 483–492. [Google Scholar] [CrossRef]
  2. Shaw, J.E.; Sicree, R.A.; Zimmet, P.Z. Global Estimates of the Prevalence of Diabetes for 2010 and 2030. Diabetes Res. Clin. Pract. 2010, 87, 4–14. [Google Scholar] [CrossRef] [PubMed]
  3. Hudspeth, B. The Burden of Cardiovascular Disease in Patients with Diabetes. Am. J. Manag. Care 2018, 24, S268–S272. [Google Scholar] [PubMed]
  4. Wu, G.; Cai, B.; Yu, F.; Fang, Z.; Fu, X.; Zhou, H.; Zhang, W.; Tian, Z. Meta-Analysis of Bariatric Surgery versus Non-Surgical Treatment for Type 2 Diabetes Mellitus. Oncotarget 2016, 7, 87511–87522. [Google Scholar] [CrossRef] [Green Version]
  5. Schauer, P.R.; Kashyap, S.R.; Wolski, K.; Brethauer, S.A.; Kirwan, J.P.; Pothier, C.E.; Thomas, S.; Abood, B.; Nissen, S.E.; Bhatt, D.L. Bariatric Surgery versus Intensive Medical Therapy in Obese Patients with Diabetes. N. Engl. J. Med. 2012, 366, 1567–1576. [Google Scholar] [CrossRef] [PubMed]
  6. Meyvis, K.; De Block, C.; Van Gaal, L.F. Can Bariatric Surgery Be Considered Standard Therapy to Treat Type 2 Diabetes? Eur. Endocrinol. 2010, 9, 86. [Google Scholar] [CrossRef] [PubMed] [Green Version]
  7. Gloy, V.L.; Briel, M.; Bhatt, D.L.; Kashyap, S.R.; Schauer, P.R.; Mingrone, G.; Bucher, H.C.; Nordmann, A.J. Bariatric Surgery versus Non-Surgical Treatment for Obesity: A Systematic Review and Meta-Analysis of Randomised Controlled Trials. BMJ 2013, 347, f5934. [Google Scholar] [CrossRef] [Green Version]
  8. Szoka, B.; Chudziak, D.; Batóg, P.; Macioch, T.; Niewada, M.; Belarbi, S.; Wcisło, J. Bariatric Surgery Versus Non-Surgical Treatment of Morbid Obesity: A Systematic Review. Value Health 2016, 19, A575–A576. [Google Scholar] [CrossRef]
  9. Mingrone, G.; Panunzi, S.; De Gaetano, A.; Guidone, C.; Iaconelli, A.; Nanni, G.; Castagneto, M.; Bornstein, S.; Rubino, F. Bariatric–Metabolic Surgery versus Conventional Medical Treatment in Obese Patients with Type 2 Diabetes: 5 Year Follow-up of an Open-Label, Single-Centre, Randomised Controlled Trial. Lancet 2015, 386, 964–973. [Google Scholar] [CrossRef]
  10. Papamargaritis, D.; le Roux, C.W. Do Gut Hormones Contribute to Weight Loss and Glycaemic Outcomes after Bariatric Surgery? Nutrients 2021, 13, 762. [Google Scholar] [CrossRef]
  11. Scopinaro, N.; Adami, G.F.; Bruzzi, P.; Cordera, R. Prediction of Diabetes Remission at Long Term Following Biliopancreatic Diversion. Obes. Surg. 2017, 27, 1705–1708. [Google Scholar] [CrossRef] [PubMed]
  12. Ionut, V.; Burch, M.; Youdim, A.; Bergman, R.N. Gastrointestinal Hormones and Bariatric Surgery-Induced Weight Loss: Gut Hormones and Bariatric Surgery. Obesity 2013, 21, 1093–1103. [Google Scholar] [CrossRef] [PubMed] [Green Version]
  13. Hutch, C.R.; Sandoval, D. The Role of GLP-1 in the Metabolic Success of Bariatric Surgery. Endocrinology 2017, 158, 4139–4151. [Google Scholar] [CrossRef] [PubMed] [Green Version]
  14. Park, J.Y. Prediction of Type 2 Diabetes Remission after Bariatric or Metabolic Surgery. J. Obes. Metab. Syndr. 2018, 27, 213–222. [Google Scholar] [CrossRef] [PubMed] [Green Version]
  15. Blackstone, R.; Bunt, J.C.; Cortés, M.C.; Sugerman, H.J. Type 2 Diabetes after Gastric Bypass: Remission in Five Models Using HbA1c, Fasting Blood Glucose, and Medication Status. Surg. Obes. Relat. Dis. 2012, 8, 548–555. [Google Scholar] [CrossRef] [PubMed]
  16. Belligoli, A.; Bettini, S.; Segato, G.; Busetto, L. Predicting Responses to Bariatric and Metabolic Surgery. Curr. Obes. Rep. 2020, 9, 373–379. [Google Scholar] [CrossRef]
  17. Shah, A.; Laferrère, B. Diabetes after Bariatric Surgery. Can. J. Diabetes 2017, 41, 401–406. [Google Scholar] [CrossRef] [Green Version]
  18. Arterburn, D.E.; Bogart, A.; Sherwood, N.E.; Sidney, S.; Coleman, K.J.; Haneuse, S.; O’Connor, P.J.; Theis, M.K.; Campos, G.M.; McCulloch, D.; et al. A Multisite Study of Long-Term Remission and Relapse of Type 2 Diabetes Mellitus Following Gastric Bypass. Obes. Surg. 2013, 23, 93–102. [Google Scholar] [CrossRef] [Green Version]
  19. Adams, T.D.; Davidson, L.E.; Litwin, S.E.; Kim, J.; Kolotkin, R.L.; Nanjee, M.N.; Gutierrez, J.M.; Frogley, S.J.; Ibele, A.R.; Brinton, E.A.; et al. Weight and Metabolic Outcomes 12 Years after Gastric Bypass. N. Engl. J. Med. 2017, 377, 1143–1155. [Google Scholar] [CrossRef]
  20. Brethauer, S.A.; Aminian, A.; Romero-Talamás, H.; Batayyah, E.; Mackey, J.; Kennedy, L.; Kashyap, S.R.; Kirwan, J.P.; Rogula, T.; Kroh, M.; et al. Can Diabetes Be Surgically Cured? Long-Term Metabolic Effects of Bariatric Surgery in Obese Patients with Type 2 Diabetes Mellitus. Ann. Surg. 2013, 258, 628–637. [Google Scholar] [CrossRef] [Green Version]
  21. Elshaer, A.M.; Almerie, M.Q.; Pellen, M.; Jain, P. Relapse of Diabetes After Roux-En-Y Gastric Bypass for Patients With Obesity: 12 Years Follow-up Study. Obes. Surg. 2020, 30, 4834–4839. [Google Scholar] [CrossRef] [PubMed]
  22. Torquati, A.; Lutfi, R.; Abumrad, N.; Richards, W. Is Roux-En-Gastric Bypass Surgery the Most Effective Treatment for Type 2 Diabetes Mellitus in Morbidly Obese Patients? J. Gastrointest. Surg. 2005, 9, 1112–1118. [Google Scholar] [CrossRef] [PubMed]
  23. Morasso, C.F.; Sproviero, D.; Mimmi, M.C.; Giannini, M.; Gagliardi, S.; Vanna, R.; Diamanti, L.; Bernuzzi, S.; Piccotti, F.; Truffi, M.; et al. Raman Spectroscopy Reveals Biochemical Differences in Plasma Derived Extracellular Vesicles from Sporadic Amyotrophic Lateral Sclerosis Patients. Nanomed. Nanotechnol. Biol. Med. 2020, 29, 102249. [Google Scholar] [CrossRef] [PubMed]
  24. Vanna, R.; Ronchi, P.; Lenferink, A.T.M.; Tresoldi, C.; Morasso, C.; Mehn, D.; Bedoni, M.; Picciolini, S.; Terstappen, L.W.M.M.; Ciceri, F.; et al. Label-Free Imaging and Identification of Typical Cells of Acute Myeloid Leukaemia and Myelodysplastic Syndrome by Raman Microspectroscopy. Analyst 2015, 140, 1054–1064. [Google Scholar] [CrossRef] [PubMed]
  25. Donjuán-Loredo, G.; Espinosa-Tanguma, R.; Ramírez-Elías, M.G. Raman Spectroscopy in the Diagnosis of Metabolic Syndrome. Appl. Spectrosc. Rev. 2021, 1–21. [Google Scholar] [CrossRef]
  26. González-Solís, J.L.; Villafan-Bernal, J.R.; Martínez-Zérega, B.E.; Sánchez-Enríquez, S. Type 2 Diabetes Detection Based on Serum Sample Raman Spectroscopy. Lasers Med. Sci. 2018, 33, 1791–1797. [Google Scholar] [CrossRef]
  27. Silveira, L.; De Cássia, R.; Borges, F.; Navarro, R.S.; Giana, H.E.; Zângaro, R.A.; Tadeu, M.; Pacheco, T.; Fernandes, A.B. Quantifying Glucose and Lipid Components in Human Serum by Raman Spectroscopy and Multivariate Statistics. Lasers Med. Sci. 2017, 32, 787–795. [Google Scholar] [CrossRef]
  28. Guevara, E.; Torres-Galván, J.C.; Ramírez-Elías, M.G.; Luevano-Contreras, C.; González, F.J. Use of Raman Spectroscopy to Screen Diabetes Mellitus with Machine Learning Tools. Biomed. Opt. Express 2018, 9, 4998. [Google Scholar] [CrossRef]
  29. Ricciardi, A.; Piuri, G.; Porta, M.D.; Mazzucchelli, S.; Bonizzi, A.; Truffi, M.; Sevieri, M.; Allevi, R.; Corsi, F.; Cazzola, R.; et al. Raman Spectroscopy Characterization of the Major Classes of Plasma Lipoproteins. Vib. Spectrosc. 2020, 109, 103073. [Google Scholar] [CrossRef]
  30. American Diabetes Association 2. Classification and Diagnosis of Diabetes: Standards of Medical Care in Diabetes—2021. Diabetes Care 2021, 44, S15–S33. [Google Scholar] [CrossRef]
  31. Tsilingiris, D.; Koliaki, C.; Kokkinos, A. Remission of Type 2 Diabetes Mellitus after Bariatric Surgery: Fact or Fiction? Int. J. Environ. Res. Public Health 2019, 16, 3171. [Google Scholar] [CrossRef] [PubMed] [Green Version]
  32. Captieux, M.; Prigge, R.; Wild, S.; Guthrie, B. Defining Remission of Type 2 Diabetes in Research Studies: A Systematic Scoping Review. PLoS Med. 2020, 17, e1003396. [Google Scholar] [CrossRef] [PubMed]
  33. Foschi, D.A.; Rizzi, A.; Tubazio, I.; Conti, L.; Vago, T.; Bevilacqua, M.; Magni, A.; Del Puppo, M. Duodenal Diverted Sleeve Gastrectomy with Ileal Interposition Does Not Cause Biliary Salt Malabsorption. Surg. Obes. Relat. Dis. 2015, 11, 372–376. [Google Scholar] [CrossRef]
  34. Morasso, C.; Truffi, M.; Vanna, R.; Albasini, S.; Mazzucchelli, S.; Colombo, F.; Sorrentino, L.; Sampietro, G.; Ardizzone, S.; Corsi, F. Raman Analysis Reveals Biochemical Differences in Plasma of Crohn’s Disease Patients. J. Crohn’s Colitis 2020, 14, 1572–1580. [Google Scholar] [CrossRef] [PubMed]
  35. Demšar, J.; Curk, T.; Erjavec, A.; Gorup, C.; Hocevar, T.; Milutinovic, M.; Možina, M.; Polajnar, M.; Toplak, M.; Staric, A.; et al. Orange: Data Mining Toolbox in Python. J. Mach. Learn. Res. 2013, 14, 2349–2353. [Google Scholar]
  36. Toplak, M.; Read, S.T.; Sandt, C.; Borondics, F. Quasar: Easy Machine Learning for Biospectroscopy. Cells 2021, 10, 2300. [Google Scholar] [CrossRef]
  37. Hansen, D.; Dendale, P.; Beelen, M.; Jonkers, R.A.M.; Mullens, A.; Corluy, L.; Meeusen, R.; van Loon, L.J.C. Plasma Adipokine and Inflammatory Marker Concentrations Are Altered in Obese, as Opposed to Non-Obese, Type 2 Diabetes Patients. Eur. J. Appl. Physiol. 2010, 109, 397–404. [Google Scholar] [CrossRef] [Green Version]
  38. Gómez-Ambrosi, J.; Gallego-Escuredo, J.M.; Catalán, V.; Rodríguez, A.; Domingo, P.; Moncada, R.; Valentí, V.; Salvador, J.; Giralt, M.; Villarroya, F.; et al. FGF19 and FGF21 Serum Concentrations in Human Obesity and Type 2 Diabetes Behave Differently after Diet- or Surgically-Induced Weight Loss. Clin. Nutr. 2017, 36, 861–868. [Google Scholar] [CrossRef]
  39. Lin, E. The Effects of Gastric Surgery on Systemic Ghrelin Levels in the Morbidly Obese. Arch. Surg. 2004, 139, 780. [Google Scholar] [CrossRef] [Green Version]
  40. Morínigo, R.; Casamitjana, R.; Moizé, V.; Lacy, A.M.; Delgado, S.; Gomis, R.; Vidal, J. Short-Term Effects of Gastric Bypass Surgery on Circulating Ghrelin Levels. Obes. Res. 2004, 12, 1108–1116. [Google Scholar] [CrossRef] [Green Version]
  41. Tymitz, K.; Engel, A.; McDonough, S.; Hendy, M.P.; Kerlakian, G. Changes in Ghrelin Levels Following Bariatric Surgery: Review of the Literature. Obes. Surg. 2011, 21, 125–130. [Google Scholar] [CrossRef]
  42. Mahadevan-Jansen, A. Raman Spectroscopy for the Detection of Cancers and Precancers. J. Biomed. Opt. 1996, 1, 31. [Google Scholar] [CrossRef]
  43. Granado-Lorencio, F.; Simal-Antón, A.; Blanco-Navarro, I.; González-Dominguez, T.; Pérez-Sacristán, B. Depletion of Serum Carotenoid and Other Fat-Soluble Vitamin Concentrations Following Obesity Surgery. Obes. Surg. 2011, 21, 1605–1611. [Google Scholar] [CrossRef]
  44. Sawaya, R.A.; Jaffe, J.; Friedenberg, L.; Friedenberg, F.K. Vitamin, Mineral, and Drug Absorption Following Bariatric Surgery. Curr. Drug Metab. 2012, 13, 1345–1355. [Google Scholar] [CrossRef] [PubMed]
  45. De Gelder, J.; De Gussem, K.; Vandenabeele, P.; Moens, L. Reference Database of Raman Spectra of Biological Molecules. J. Raman Spectrosc. 2007, 38, 1133–1147. [Google Scholar] [CrossRef]
  46. Ferraz, Á.A.B.; Carvalho, M.R.C.; Siqueira, L.T.; Santa-Cruz, F.; Campos, J.M. Micronutrient deficiencies following bariatric surgery: A comparative analysis between sleeve gastrectomy and Roux-en-Y gastric bypass. Rev. Col. Bras. Cir. 2018, 45, e2016. [Google Scholar] [CrossRef]
  47. Verger, E.O.; Aron-Wisnewsky, J.; Dao, M.C.; Kayser, B.D.; Oppert, J.-M.; Bouillot, J.-L.; Torcivia, A.; Clément, K. Micronutrient and Protein Deficiencies After Gastric Bypass and Sleeve Gastrectomy: A 1-Year Follow-Up. Obes. Surg. 2016, 26, 785–796. [Google Scholar] [CrossRef] [Green Version]
Figure 1. Duodenal diverted sleeve gastrectomy with ileal interposition. Created with BioRender.com (accessed on 12 October 2021). Reprinted with permission from Elsevier [33].
Applsci 11 10710 g001
Figure 2. Adiponectin, leptin, ghrelin, and FGFG-19 level in obese type 2 diabetes mellitus [Ob-T2DM; n = 14] patients before and after bariatric surgery [BS; n = 14]. Biomarkers levels were measured in the serum of patients and were compared between groups. p-values were calculated using the Mann–Whitney test. * p < 0.05; ** p < 0.005.
Applsci 11 10710 g002
Figure 3. Average normalized Raman spectra of all serum samples. Grey spectra corresponded to the average of 23 spectra in the HC patients, while the red and blue signals represent the normalized average of 14 spectra collected from Ob-T2DM subjects before and after BS, respectively.
Applsci 11 10710 g003
Figure 4. The differential spectrum of all groups; obese type 2 diabetes patients [Ob-T2DM; n = 14], bariatric surgery [BS; n = 14], and health control [HC; n = 23]. Dotted lines represent the peaks associated with different intensities between the groups.
Applsci 11 10710 g004
Figure 5. Graphs showing the different intensities of selected peaks. Each point represents an individual subject analyzed. Obese type 2 diabetes patients [Ob-T2DM; n = 14] are shown as white dots; bariatric surgery patients [BS; n = 14] are shown as black dots, and health control patients [HC; n = 23] are shown as white triangles. * p < 0.05; ** p < 0.005; *** p < 0.0005.
Applsci 11 10710 g005
Figure 6. PCA analysis of Raman spectra. Grey dots correspond to the 23 spectra of the health control patients [HC; n = 23], whereas the red and blue correspond to the 14 spectra of the obese type 2 diabetes mellitus patients [Ob-T2DM; n = 14] before and after bariatric surgery [BS; n = 14], respectively.
Applsci 11 10710 g006
Table 1. Obese type 2 diabetes mellitus patients [Ob-T2D; n = 14] vs. patients after bariatric surgery [BS]. Data are presented as mean ± SD. Shows statistical significance, ** p < 0.005; *** p < 0.0005.
ParametersOb-T2DMBS
Patients14 (5 M; 9 F)14 (5 M; 9 F)
Age, years48.5 ± 12.448.5 ± 12.4
Weight, kg112.4 ± 21.783.9 ± 13.9 ***
BMI, kg/m241.4 ± 6.230.2 ± 5.3 ***
Waist circumference, cm125.2 ± 15.1103.9 ± 15 **
Hips circumference, cm128.4 ± 15.9104.6 ± 13.4 ***
Insulin, mU/mL14.1 ± 84.9 ± 5.8 ***
Glycemia, mg/dL158.5 ± 41.782.2 ± 10 ***
Glycemia 120′, mg/dL223.9 ± 62.5137.8 ± 41.2 ***
HAb1c %7.7 ± 1.25.3 ± 0.4 ***
Total cholesterol, mg/dL211.8 ± 20.3142.8 ± 26 ***
HDL-C, mg/dL42.6 ±7.252.3 ± 4.8 ***
Triglycerides, mg/dL178.1 ± 58.6117.1 ± 31 **
Publisher’s Note: MDPI stays neutral with regard to jurisdictional claims in published maps and institutional affiliations.

