Article

Metabolomics of Pseudomonas aeruginosa Treated by Atmospheric-Pressure Cold Plasma

1
State Key Laboratory of Electrical Insulation and Power Equipment, Centre for Plasma Biomedicine, School of Electrical Engineering, Xi’an Jiaotong University, Xi’an 710049, China
2
School of Life Science and Technology, Xi’an Jiaotong University, Xi’an 710049, China
3
Department of Cardiovascular Medicine, First Affiliated Hospital of the Medical School, Xi’an Jiaotong University, Xi’an 710049, China
*
Author to whom correspondence should be addressed.
Dehui Xu and Xinying Zhang contributed equally to this work.
Appl. Sci. 2021, 11(22), 10527; https://doi.org/10.3390/app112210527
Submission received: 26 September 2021 / Revised: 29 October 2021 / Accepted: 30 October 2021 / Published: 9 November 2021

Abstract

:
With increasing drug resistance of Pseudomonas aeruginosa, a new sterilization method is needed. Plasma has been shown to be an effective method of sterilization, but no researchers have studied the effect of plasma on bacterial metabolism. In this paper, we studied the emission spectrum, liquid phase active particles, and other physical and chemical properties of a portable plasma device. Pseudomonas aeruginosa were then treated with activated water generated by surface plasma discharge. Using gas chromatography time-of-flight mass spectrometry (GC-TOF-MS) and Kyoto Encyclopedia of Genes and Genomes (KEGG) analysis, we obtained the differential metabolite pathways. The results showed that, after plasma activated water treatment, the carbohydrate metabolism of the bacteria was inhibited and the metabolic processes of protein and amino acid decomposition were enhanced. Therefore, water activated by atmospheric-pressure cold plasma can significantly change bacterial metabolites, thus promoting bacterial death.

1. Introduction

Pseudomonas aeruginosa, is widely distributed in nature and is one of the most common bacteria in soil. According to the World Health Organization, Pseudomonas aeruginosa ranks second [1,2,3] among all bacterial infections. However, due to the high infection rate of Pseudomonas aeruginosa, it has a high level of drug resistance, and so a new sterilization method is needed [4]. Atmospheric-pressure low-temperature plasma is a new technology where the temperature is similar to room temperature, so that plasma can be directly used in the treatment of organisms. Atmospheric-pressure cold plasma has been developed for biomedical applications, such as skin disease treatment, cancer treatment, beauty treatments for skin, dentistry, disinfection and sterilization applications [5,6,7,8,9,10,11]. Low-temperature plasma has the advantages of a low sterilization temperature, fast sterilization, no by-products and relatively comprehensive sterilization [9,12,13]. At the same time, the cost of plasma sterilization is much lower than that of traditional sterilization [14]. Boudam et al. found that both ultraviolet light and oxidation-active substances in plasma can inactivate spores [15]. Moisan et al. found that the main role of plasma in sterilization is the role of ultraviolet light [16].
Liu et al. studied the changes of cyanobacteria, Clostridium and other bacteria in raw pond water treated with plasma [17]. Zhang et al. studied an atmospheric micro-plasma jet device and found that it could inactivate Pseudomonas sp HB1 in water, and studied the effect of various active particles on sterilization [18]. Shen et al. found that active substances are the main cause of plasma sterilization [19]. Sharma et al. studied a dielectric barrier discharge (DBD) plasma discharge device and found that the active substance produced by DBD can inhibit the growth of pathogens such as bacteria [20]. Chengliu et al. studied a coaxial plasma using helium gas as the working gas, and evaluated its sterilization effect by using Escherichia coli. They found that the plasma had a significant bactericidal effect [21]. Shintani et al. found that the primary cause of nitrogen plasma sterilization was the active particle ONOO [22], and Tonmitr et al. investigated the effect of different working gases on bactericidal efficacy [23]. Nguyen et al. reported a plasma-based nanomaterial that promotes apoptosis of cancer cells [24]. Attri et al. found that plasma-treated lysozyme can significantly induce apoptosis of cancer cells [25]. Semmler et al. found that plasma treatment can cause autophagy and apoptosis of cancer cells, thus inhibiting the spread of cancer [26]. Freund’s study found that plasma activated normal saline induce colon cancer cell deaths by stimulating the immune response [27]. Bacterial metabolism is an important activity in life, so studying the effect of plasma on bacterial metabolism is of great significance [28,29,30].
The influence of bacterial metabolism after plasma treatment has seldom been reported, and so in this study we used a portable plasma discharge device of activated water for treating Pseudomonas aeruginosa. We then detected the metabolites to study the changes in bacterial metabolites and signaling pathways.

2. Materials and Methods

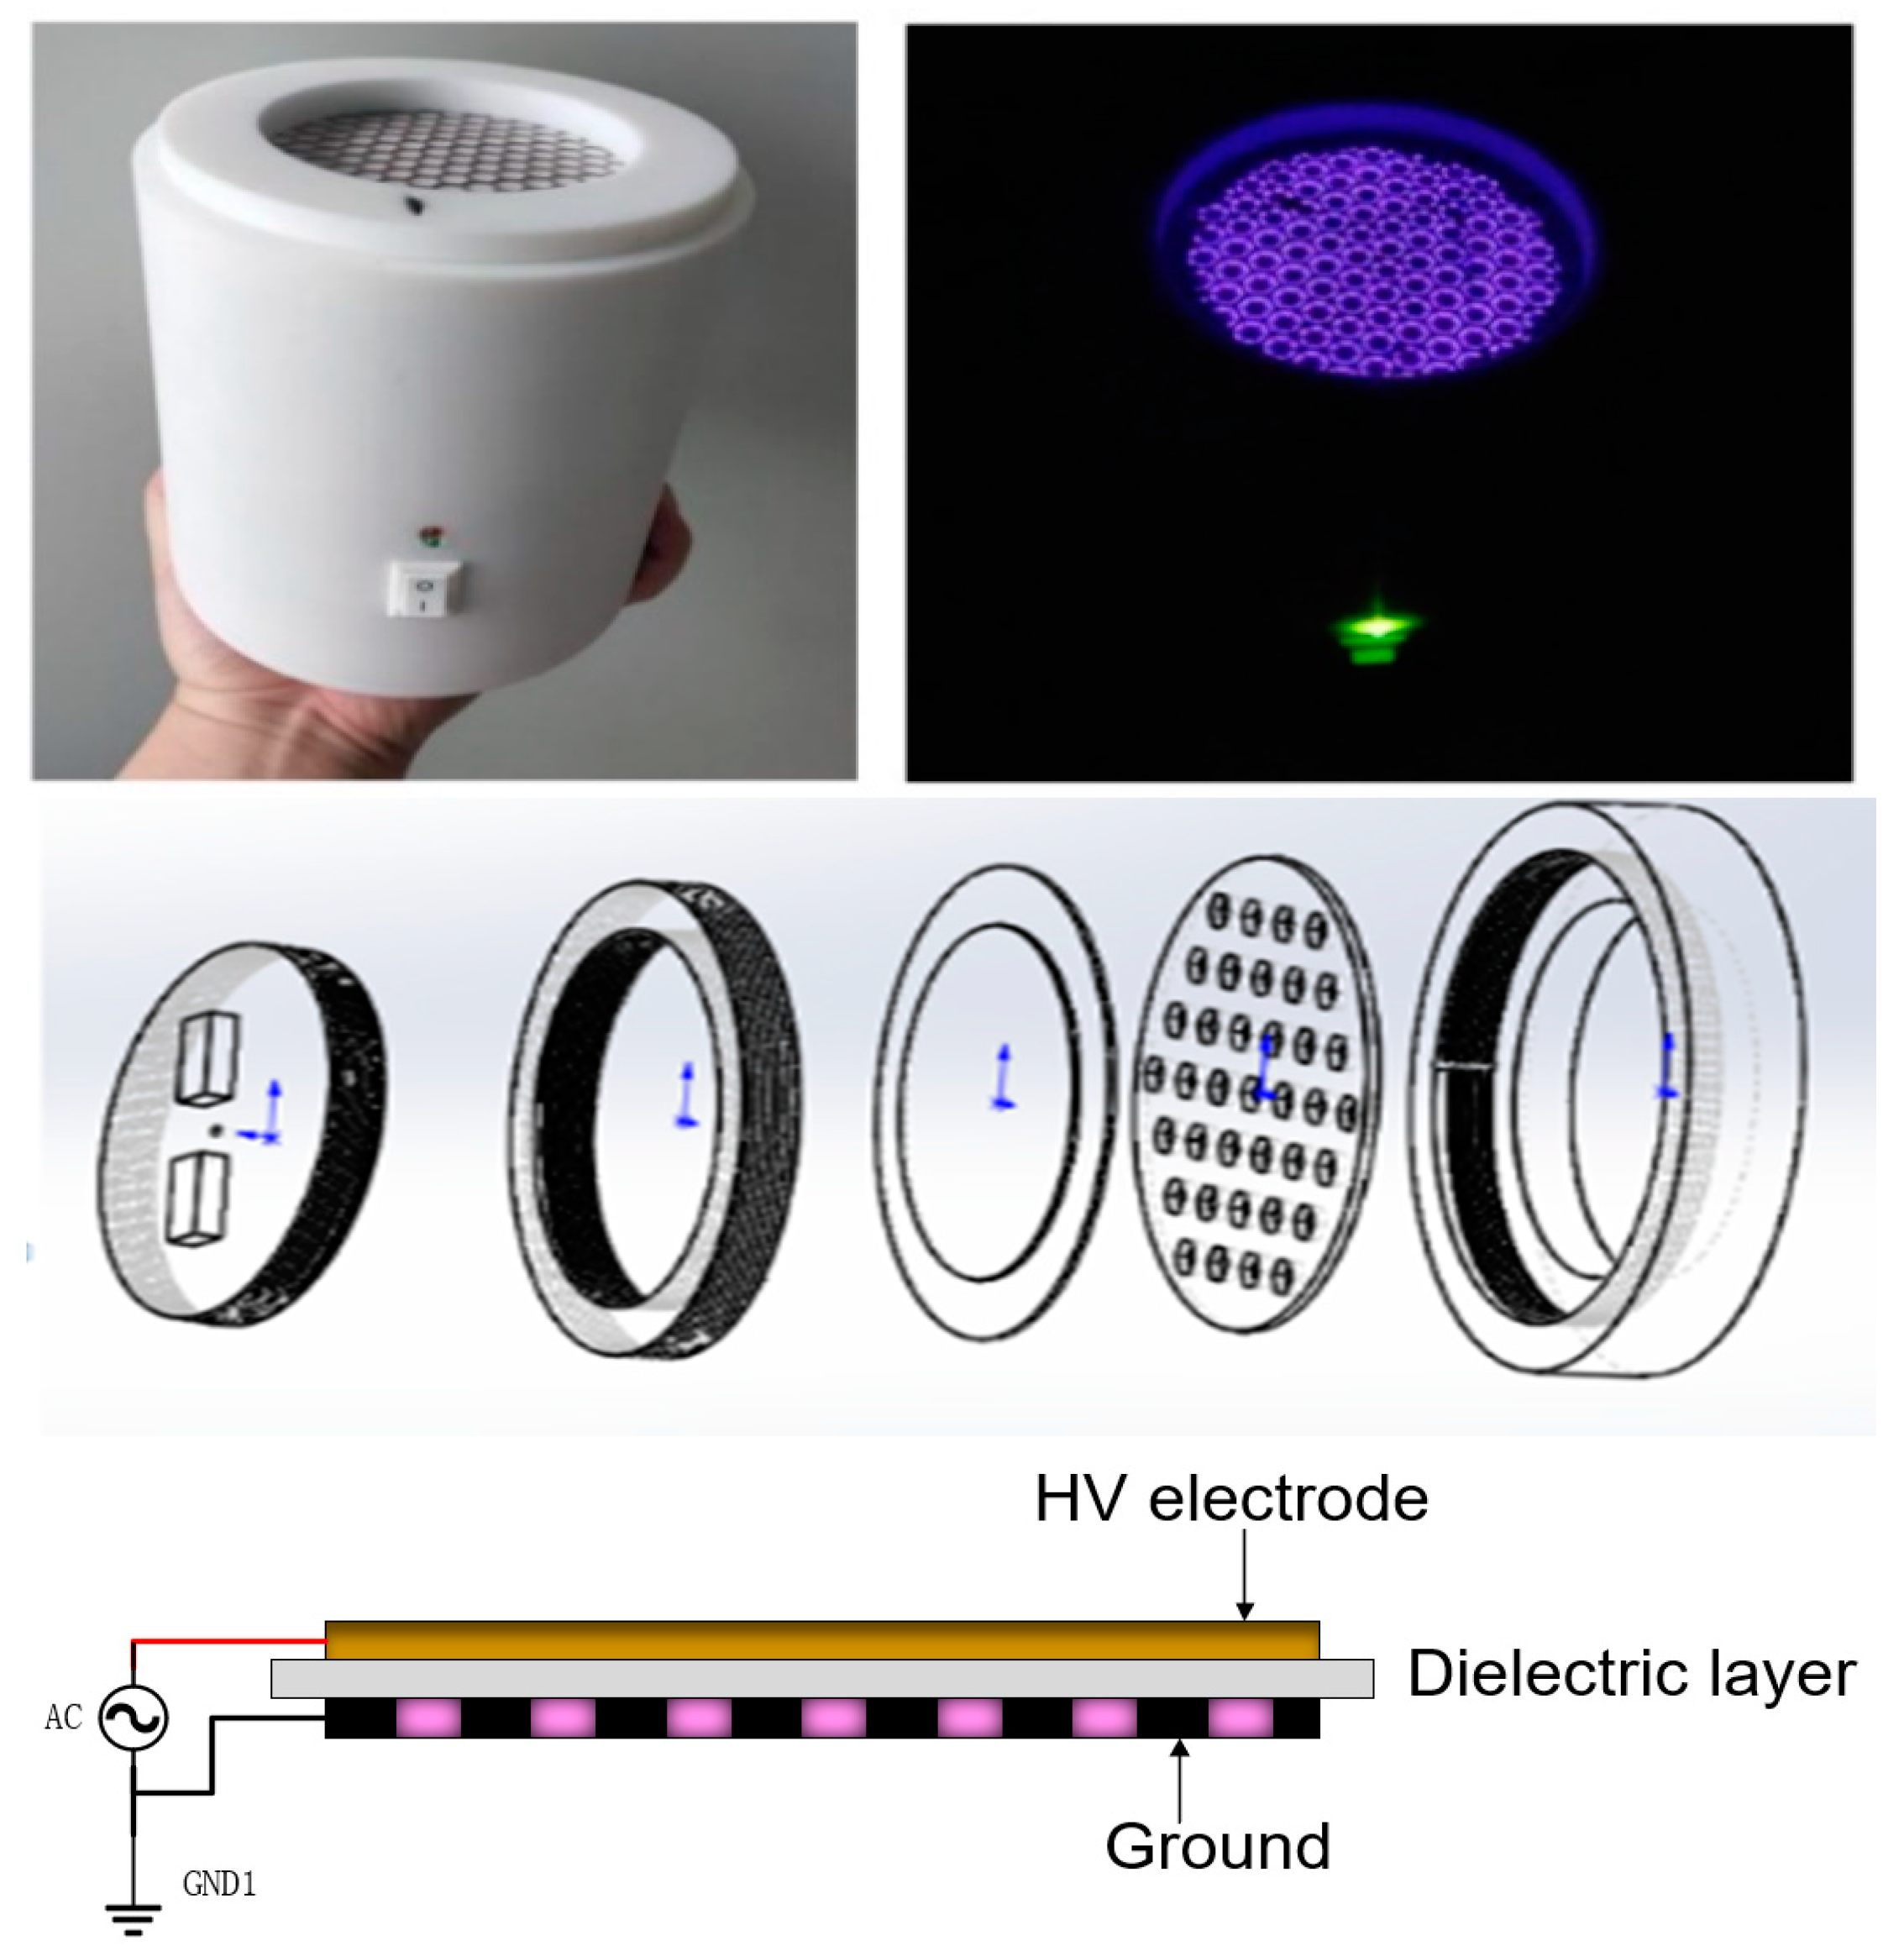
2.1. Plasma Generation and Detection

In this study, we used a portable surface discharge device to generate plasma. The device is driven by a 12 V DC battery with an inverter to AC 220 V voltage. It is connected to a high-voltage module for boosting, has a high-voltage electrode (stainless steel) and ground electrode (stainless steel), and uses a PTFE dielectric plate to achieve battery-driven plasma along the surface discharge. Figure 1 shows the physical and structural drawings of the device.
The discharge voltage of the device is 6 kV and the frequency is 15 kHz. It has an oscilloscope (DPO3052; Tektronix, Beaverton, OR, USA), voltage probe (P6015A; Tektronix), and current probe (P6139A; Tektronix). Figure 2 shows the current and voltage waveform of the device. Emission spectra (OES, ANDOR, Belfast, UK) were captured by an ANDOR SR-750I grating monochromator (grating slot 1200 lines · MM−1). The concentration of the active particles in the liquid phase was measured using a chemical fluorescence probe kit (Biyuntian company, Shanghai, China) and a 96-well plate.

2.2. Culture and Detection of Bacteria

2.2.1. Bacterial Culture Conditions

Pseudomonas aeruginosa was used in this study. The bacteria were grown in LB Broth produced by Meilun, and were cultured on a 180 r/min shaker at 37 °C before being sterilized in an autoclave (121 °C, 20 min).

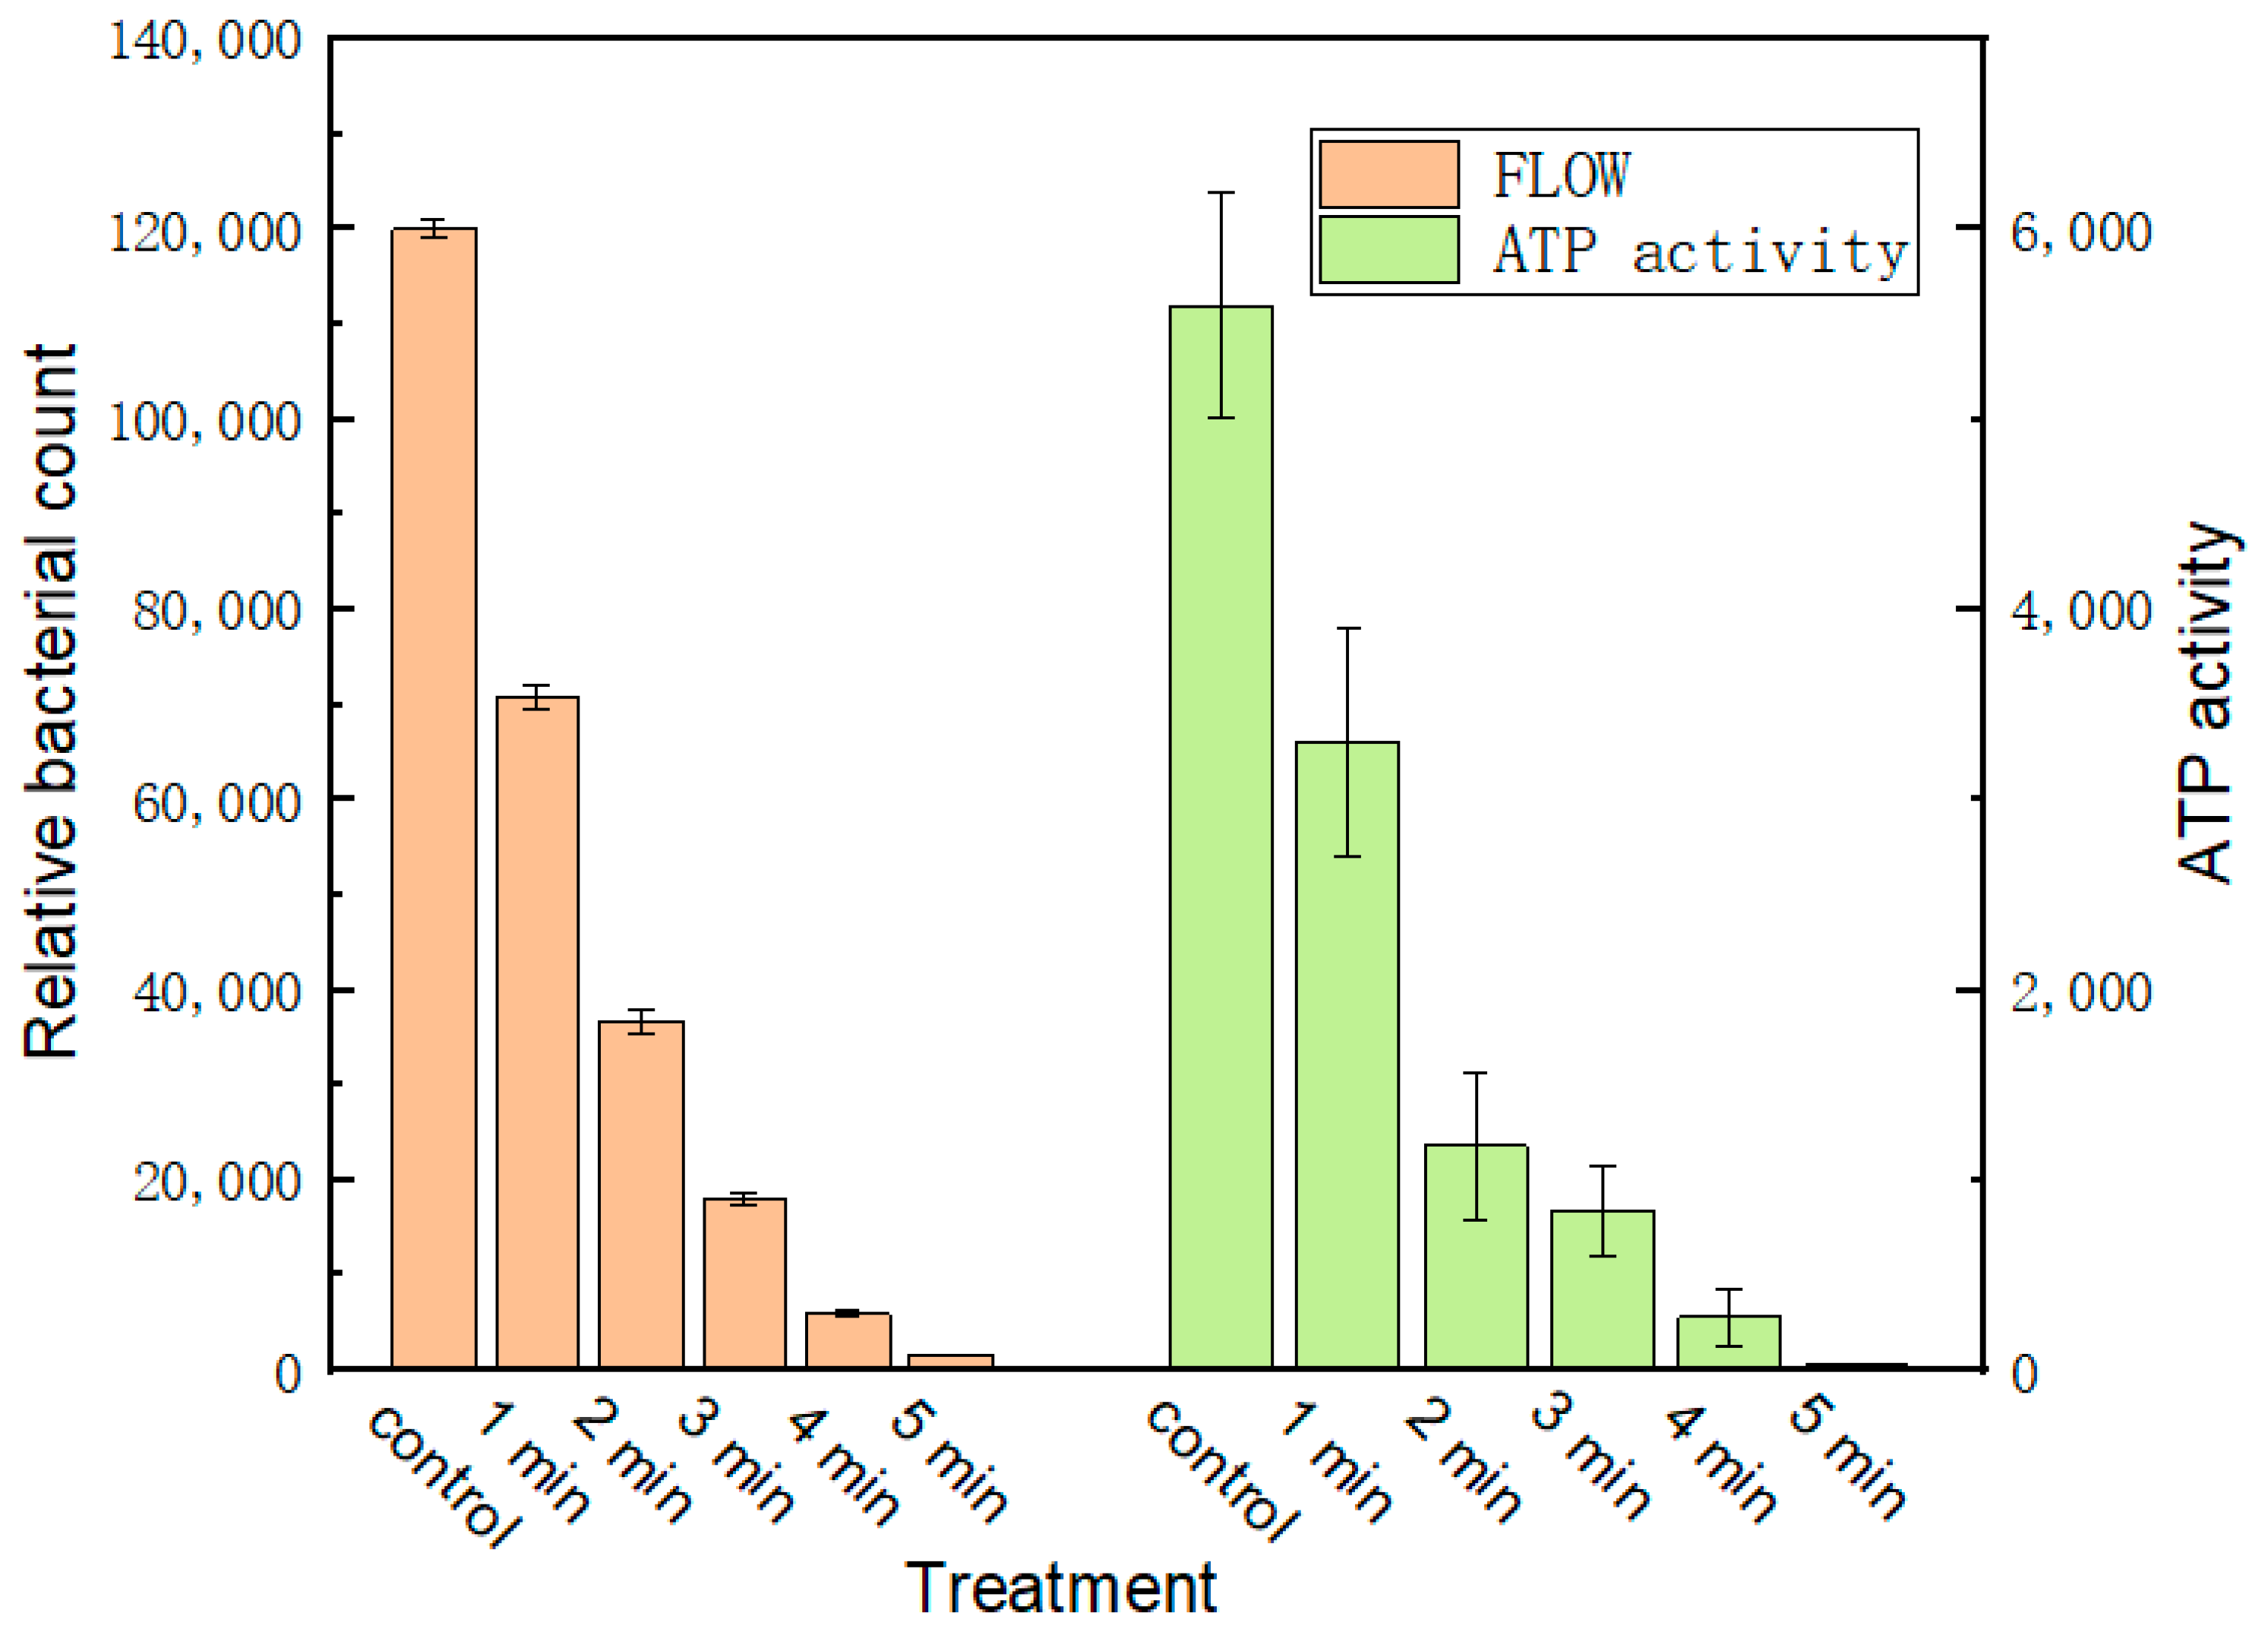
2.2.2. Activity Testing of Bacteria

Under aerobic conditions, luciferase can catalyze the oxidation reaction between luciferin and adenosine triphosphate (ATP) to form oxyluciferin and emit fluorescence. The Biolum handheld ATP fluorescence detector was developed based on the above principle. By detecting the intensity of the fluorescence signal, the content of bacteria in the target to be tested can be determined. By comparing with the control group, the sterilization efficiency of the device can be obtained. Before the experiment, the Quickswab was removed from the refrigerator and left for 20 min to return to room temperature. Samples were taken from the control group and the treatment group, and the reagent was injected into the reaction tube and had full contact with the swab. After the complete reaction, the swab was put into the ATP detector to detect the ATP content of bacteria [31,32].
Flow cytometry [33] involves one-by-one detection of a single row of cells or microbial particles. Its advantages include high-throughput, multiparameter, and multicolor fluorescence analysis detection, identification of microbial characteristics, and more accurate counting. By detecting the content of bacteria in each group of samples and comparing this with the control group, the sterilization efficiency of the device can be determined.
Therefore, in this paper, we used the above two methods to detect the activity and number of bacteria.

2.2.3. Sample Preparation

In order to detect the changes in bacterial metabolites of Pseudomonas aeruginosa treated by plasma, two groups of samples were taken: control group (C group) and Pseudomonas aeruginosa treated with plasma activated water for 1 min (1T group). The biology of each group was repeated 5 times, and a total of 10 groups of samples were obtained.
The manufacturers of all reagents used below are listed in Table 1.
All samples were transferred into a 2 mL tube, and 1000 μL prechilled extraction mixture (methanol/chloroform (v:v) = 3:1) and 5 μL internal standard (2-Chloro-L-phenylalanine, 1 mg/mL stock) were added. Samples were vortexed for 30 s and homogenized with a ball mill for 4 min at 35 Hz, followed by ultrasonication for 5 min in ice water. After centrifugation at 4 °C for 15 min at 10,000 rpm, 800 μL supernatant was transferred to a fresh tube.
To prepare the pooled biological quality control (PBQC) sample, 150 μL of each sample was taken out and combined together.
After sample evaporation in a vacuum concentrator, 20 μL of methoxyamine hydrochloride (20 mg/mL in pyridine) was added and then incubated at 80 °C for 30 min, then derivatized by 30 μL of BSTFA reagent (1% TMCS, v/v) at 70 °C for 1.5 h. Gradually cooling samples to room temperature, 5 μL of Fatty Acid Methyl Ester (FAMEs) in chloroform was added to the QC sample.
All samples were then analyzed by gas chromatography time-of-flight mass spectrometry (GC-TOF-MS).

2.2.4. GC-TOF-MS Mass Spectrometry

GC-TOF-MS analysis [34,35] was performed using an Agilent 7890 gas chromatograph coupled with a time-of-flight mass spectrometer (30 m × 250 μm × 0.25 μm, J&W Scientific, Folsom, CA, USA). The system utilized a DB-5MS capillary column. A 1 μL aliquot of the sample was injected in splitless mode. Helium was used as the carrier gas, the front inlet purge flow was 3 mL min−1, and the gas flow rate through the column was 1 mL min−1. The initial temperature was kept at 50 °C for 1 min, then raised to 310 °C at a rate of 10 °C min−1, and then kept for 8 min at 310 °C. The injection, transfer line, and ion source temperatures were 280, 280 and 250 °C, respectively. The energy was −70 eV in electron impact mode. The mass spectrometry data were acquired in full-scan mode with a m/z range of 50–500 at a rate of 12.5 spectra per second after a solvent delay of 6.33 min.

2.3. Data Analysis and Processing Methods

2.3.1. Orthogonal Partial Least Squares Discriminant Analysis (OPLS-DA)

OPLS-DA was used to analyze the results. We filtered out the orthogonal variables in metabolites that were not related to classification variables, and analyzed the non-orthogonal variables and orthogonal variables respectively, so as to obtain more reliable information about the correlation between the difference between groups of metabolites and the experimental group. In the process of data analysis and calculation, the software SIMCA (V15.0.2, Sartorius Stedim Data Analytics AB, Umea, Sweden) was adopted.

2.3.2. Univariate Statistical Analysis (UVA)

Compared with multivariate statistical analysis, UVA focuses more on the independent changes in metabolite levels, which is more helpful to us for analyzing and obtaining differential metabolites. In this part, we used originPro (2021B SR29.8.5.212 Learning Version) software.

3. Results

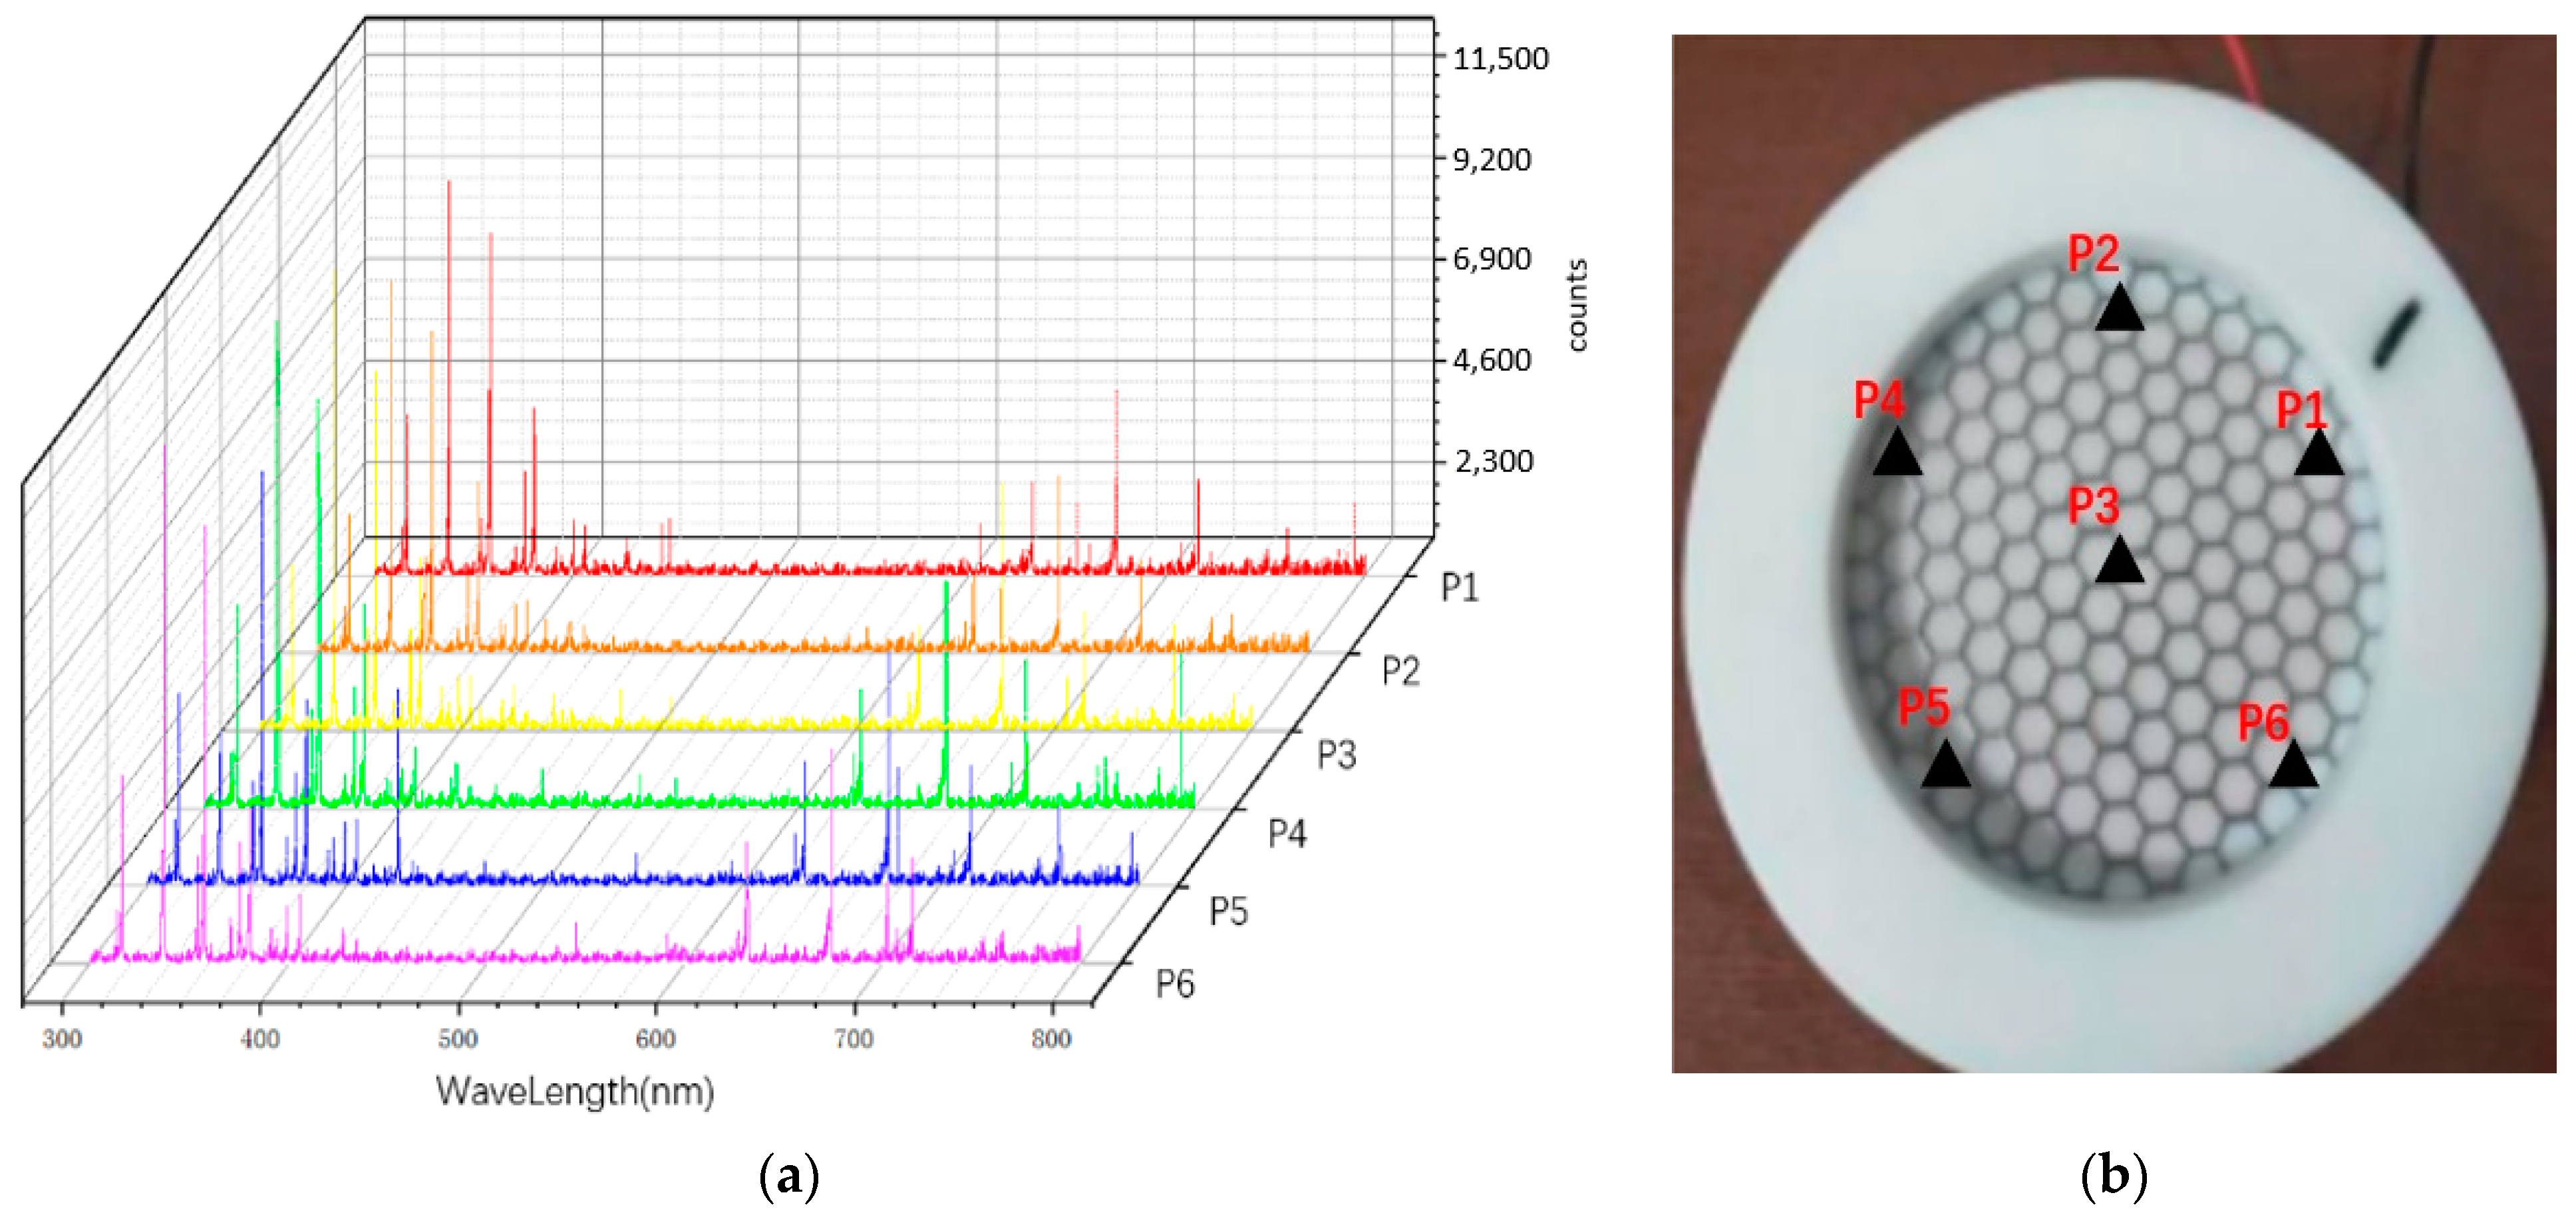
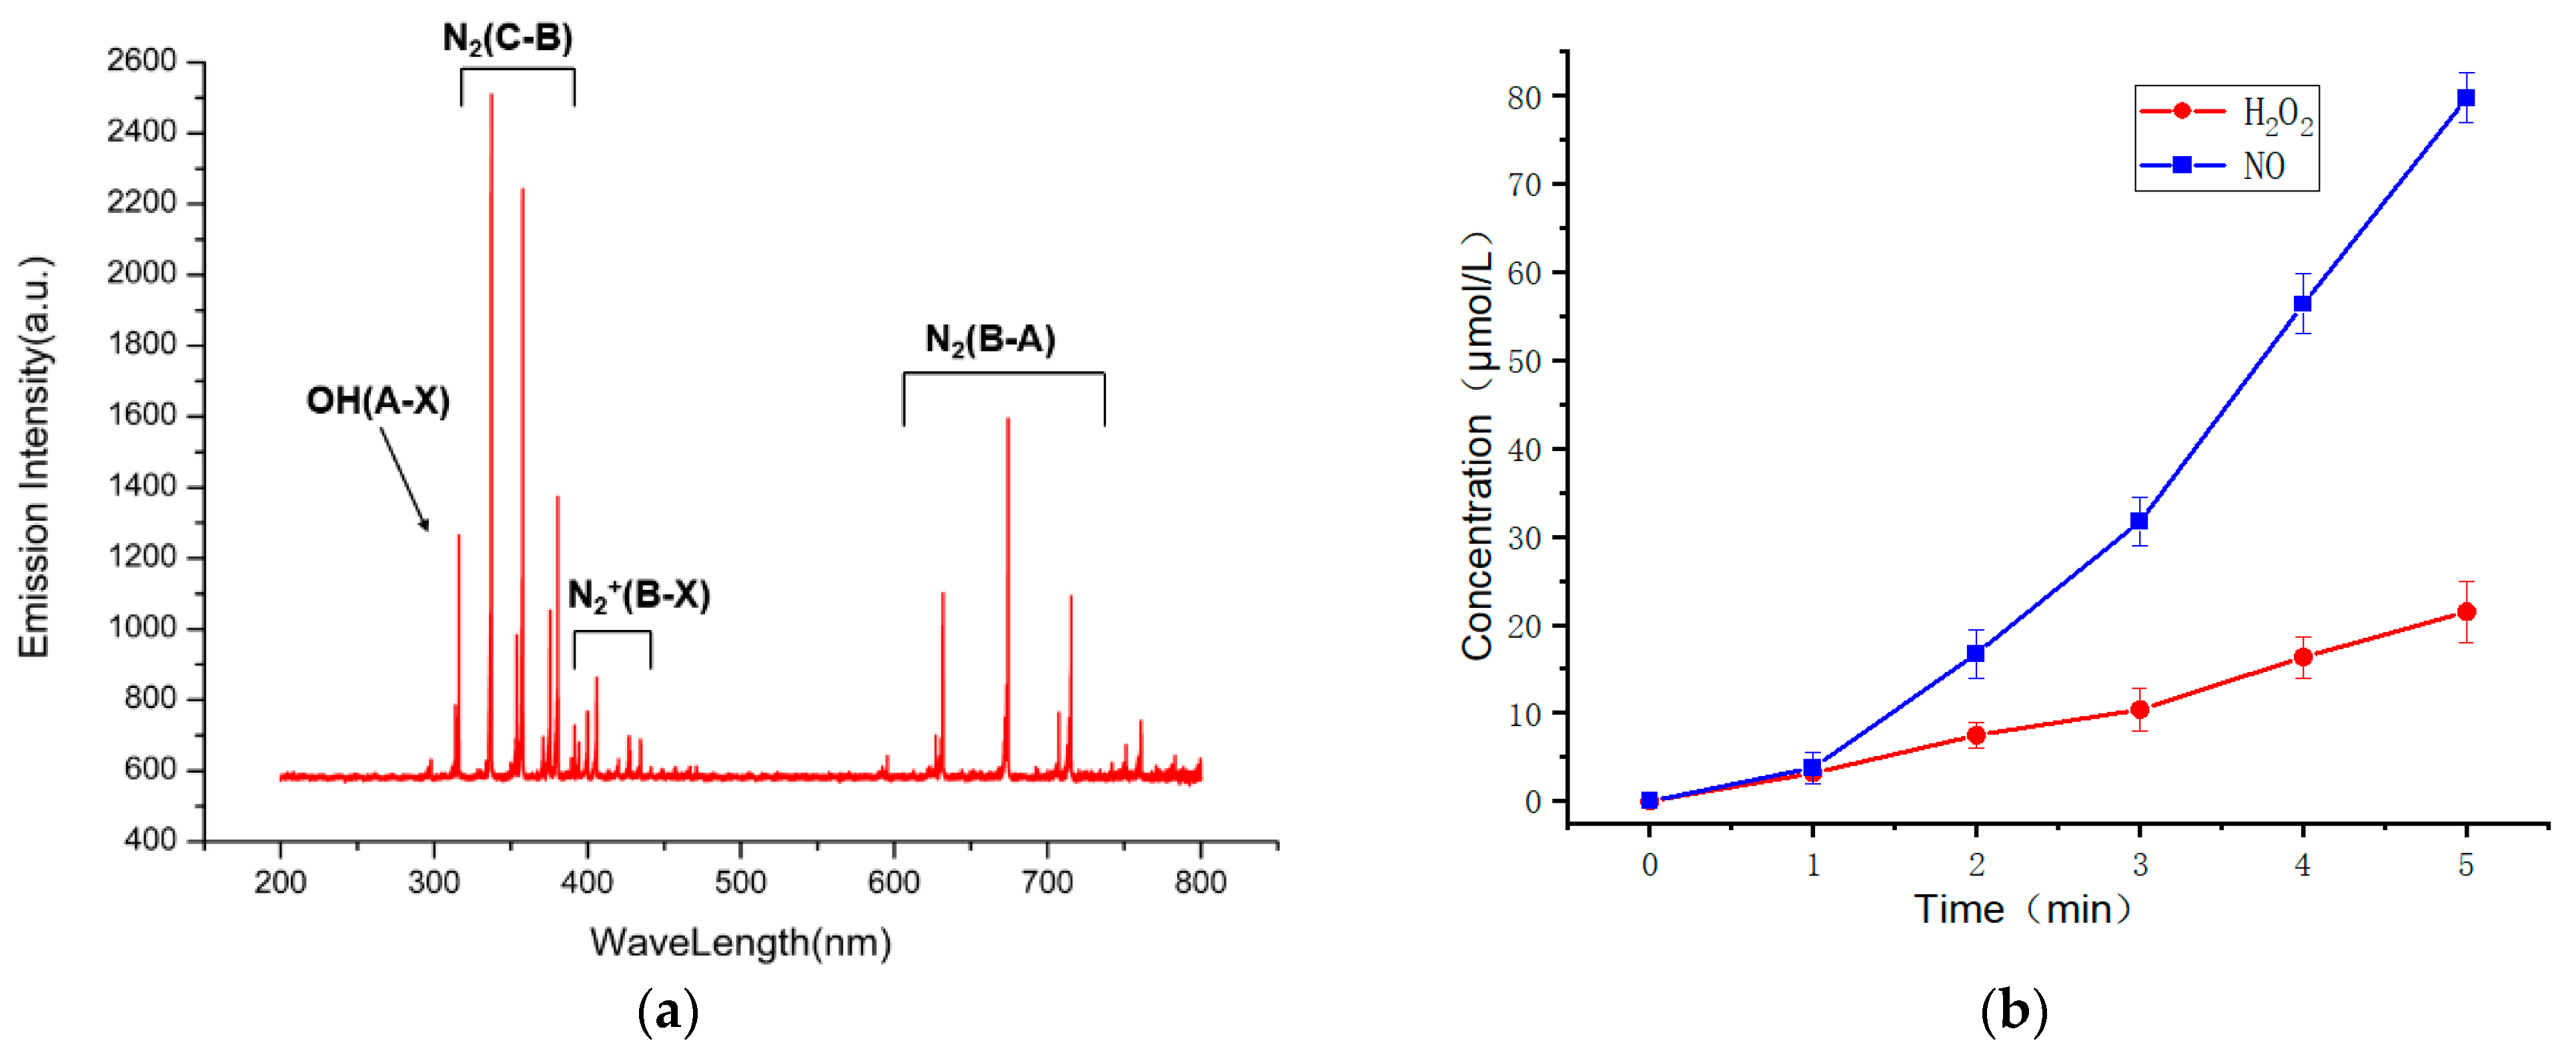
3.1. Testing the Discharge Performance of the Device

The discharge characteristics of the device were studied by measuring the discharge uniformity, spectrum, physical and chemical properties of activated water and the concentration of active particles. Figure 3 is the uniformity test result of the discharge of the device. It can be seen from the figure that the emission spectra of the six randomly selected points are basically the same, so it can be considered that the discharge of the device is relatively uniform. Figure 4a shows the emission spectrum of the device, where N2(B-A) represents the first positive band system of nitrogen. N2(C-B) represents the second positive band system of nitrogen. N2+(B-X) represents the first negative band of nitrogen positive ions, indicating that a large number of nitrogen-containing active particles (RNS) can be produced when the equipment discharges [36,37]. Figure 4b shows the concentrations of active particles of nitric oxide and hydrogen peroxide in the activated water treated by the device at different times. It can be seen that with a longer discharge time, the content of active particles in the water also increases. Figure 5 shows the sterilization effect of the device, indicating that the plasma produced by the device has a strong sterilization effect.

3.2. Detection and Analysis of Bacterial Metabolites

3.2.1. Data Analysis

  • Data Pre-Analysis
The completeness and accuracy of the data are of great importance to biology. A single peak was first filtered to remove noise. Deviation values were filtered based on the interquartile range, followed by normalization of the data using the internal standard (IS) [38]. The internal standard used in this experiment was 5 μL 2-chloro-l-phenylalanine (1 mg/mL). After pretreatment of the metabolite data, 272 peaks were obtained (the processed data table is shown under the Mean in the Supplementary File S2).
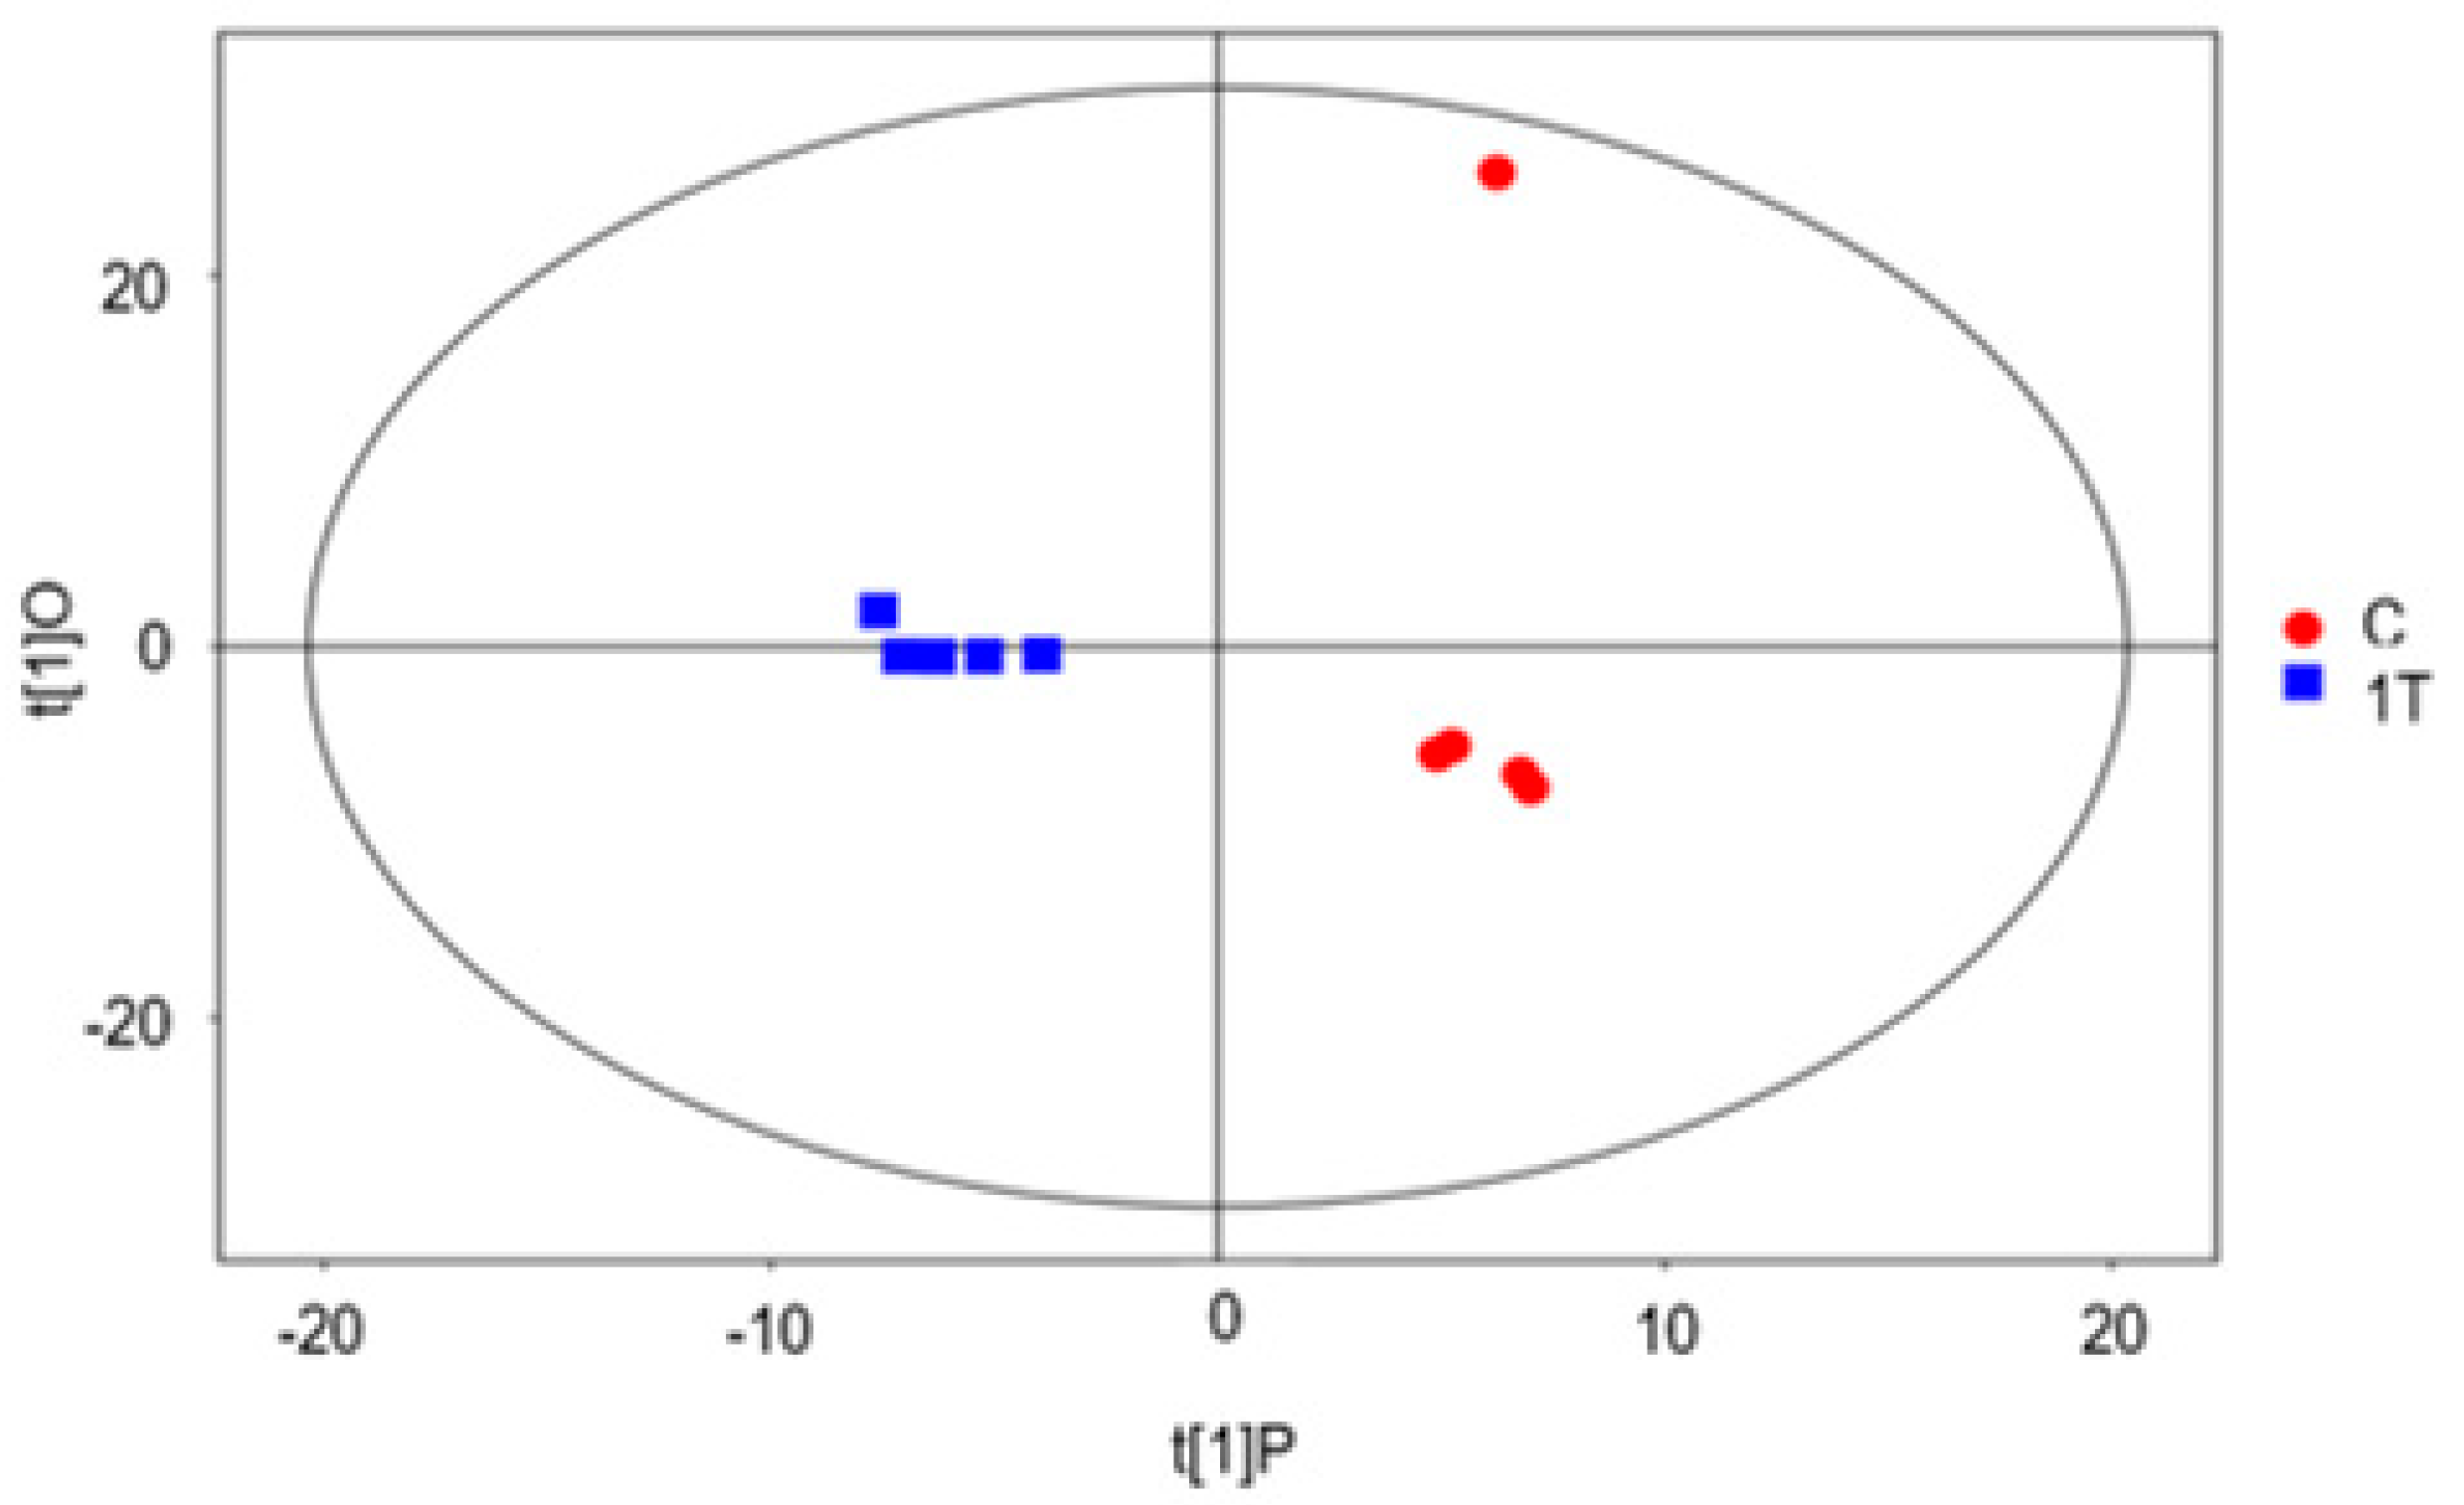
  • OPLS-DA was used for the unsupervised evaluation of metabolite characteristics
Through OPLS-DA analysis, we screened out orthogonal variables unrelated to classification variables in bacterial metabolites, and analyzed the differences between non-orthogonal variables and orthogonal variables, so as to obtain more reliable bacterial metabolites. Firstly, the first principal component was analyzed by the OPLS-DA model. The validity of the model was verified by R2Y (the interpretability of the model to the classification variable Y) and Q2 (the predictability of the model) obtained by sevenfold cross-validation. Parameters of the OPLS-DA model are shown in Table 2.
Figure 6 shows that the two groups of samples are remarkably differentiated, with the samples essentially within the 95% confidence interval (Hoteling’s T-squared ellipse). The abscissa represents the differences between the two groups of samples, and the ordinate represents the differences within the groups of samples. The displacement test randomly changes the displacement order and times of the classification variable Y (n = 200) to avoid overfitting the test model, so as to establish the corresponding OPLS-DA model to obtain the R2Y and Q2 values of the random model, which plays an important role in the evaluation of the importance of the model. The closer the R2Y and Q2 values are to one, the better the model will be. In general, R2Y and Q2 values higher than 0.5 are better, while a higher R2Y and Q2 is acceptable. This shows that the original model has good robustness and there is no over-fitting phenomenon. Therefore, plasma treatment of Pseudomonas aeruginosa has a great impact on metabolomics.
  • UVA
According to the obtained metabolite data (mean form in Supplementary File), we selected the card value of differential metabolites when the p-value of the Student’s t-test was less than 0.05, and the projection importance of the first principal component variable of the OPLS-DA model was greater than 1, as shown in Table 3. Fold change is the multiple relationship between the two experimental data groups (1T group data/C group data). When the fold change value is less than 1, it indicates that the metabolite is down-regulated; the smaller the fold change value is, the greater the downregulation range is.
The upregulated metabolites indicated that the metabolites accumulated and the metabolite-related pathways were inhibited, while the downregulated metabolites indicated that the metabolites were consumed more and the metabolite-related pathways were enhanced [29].

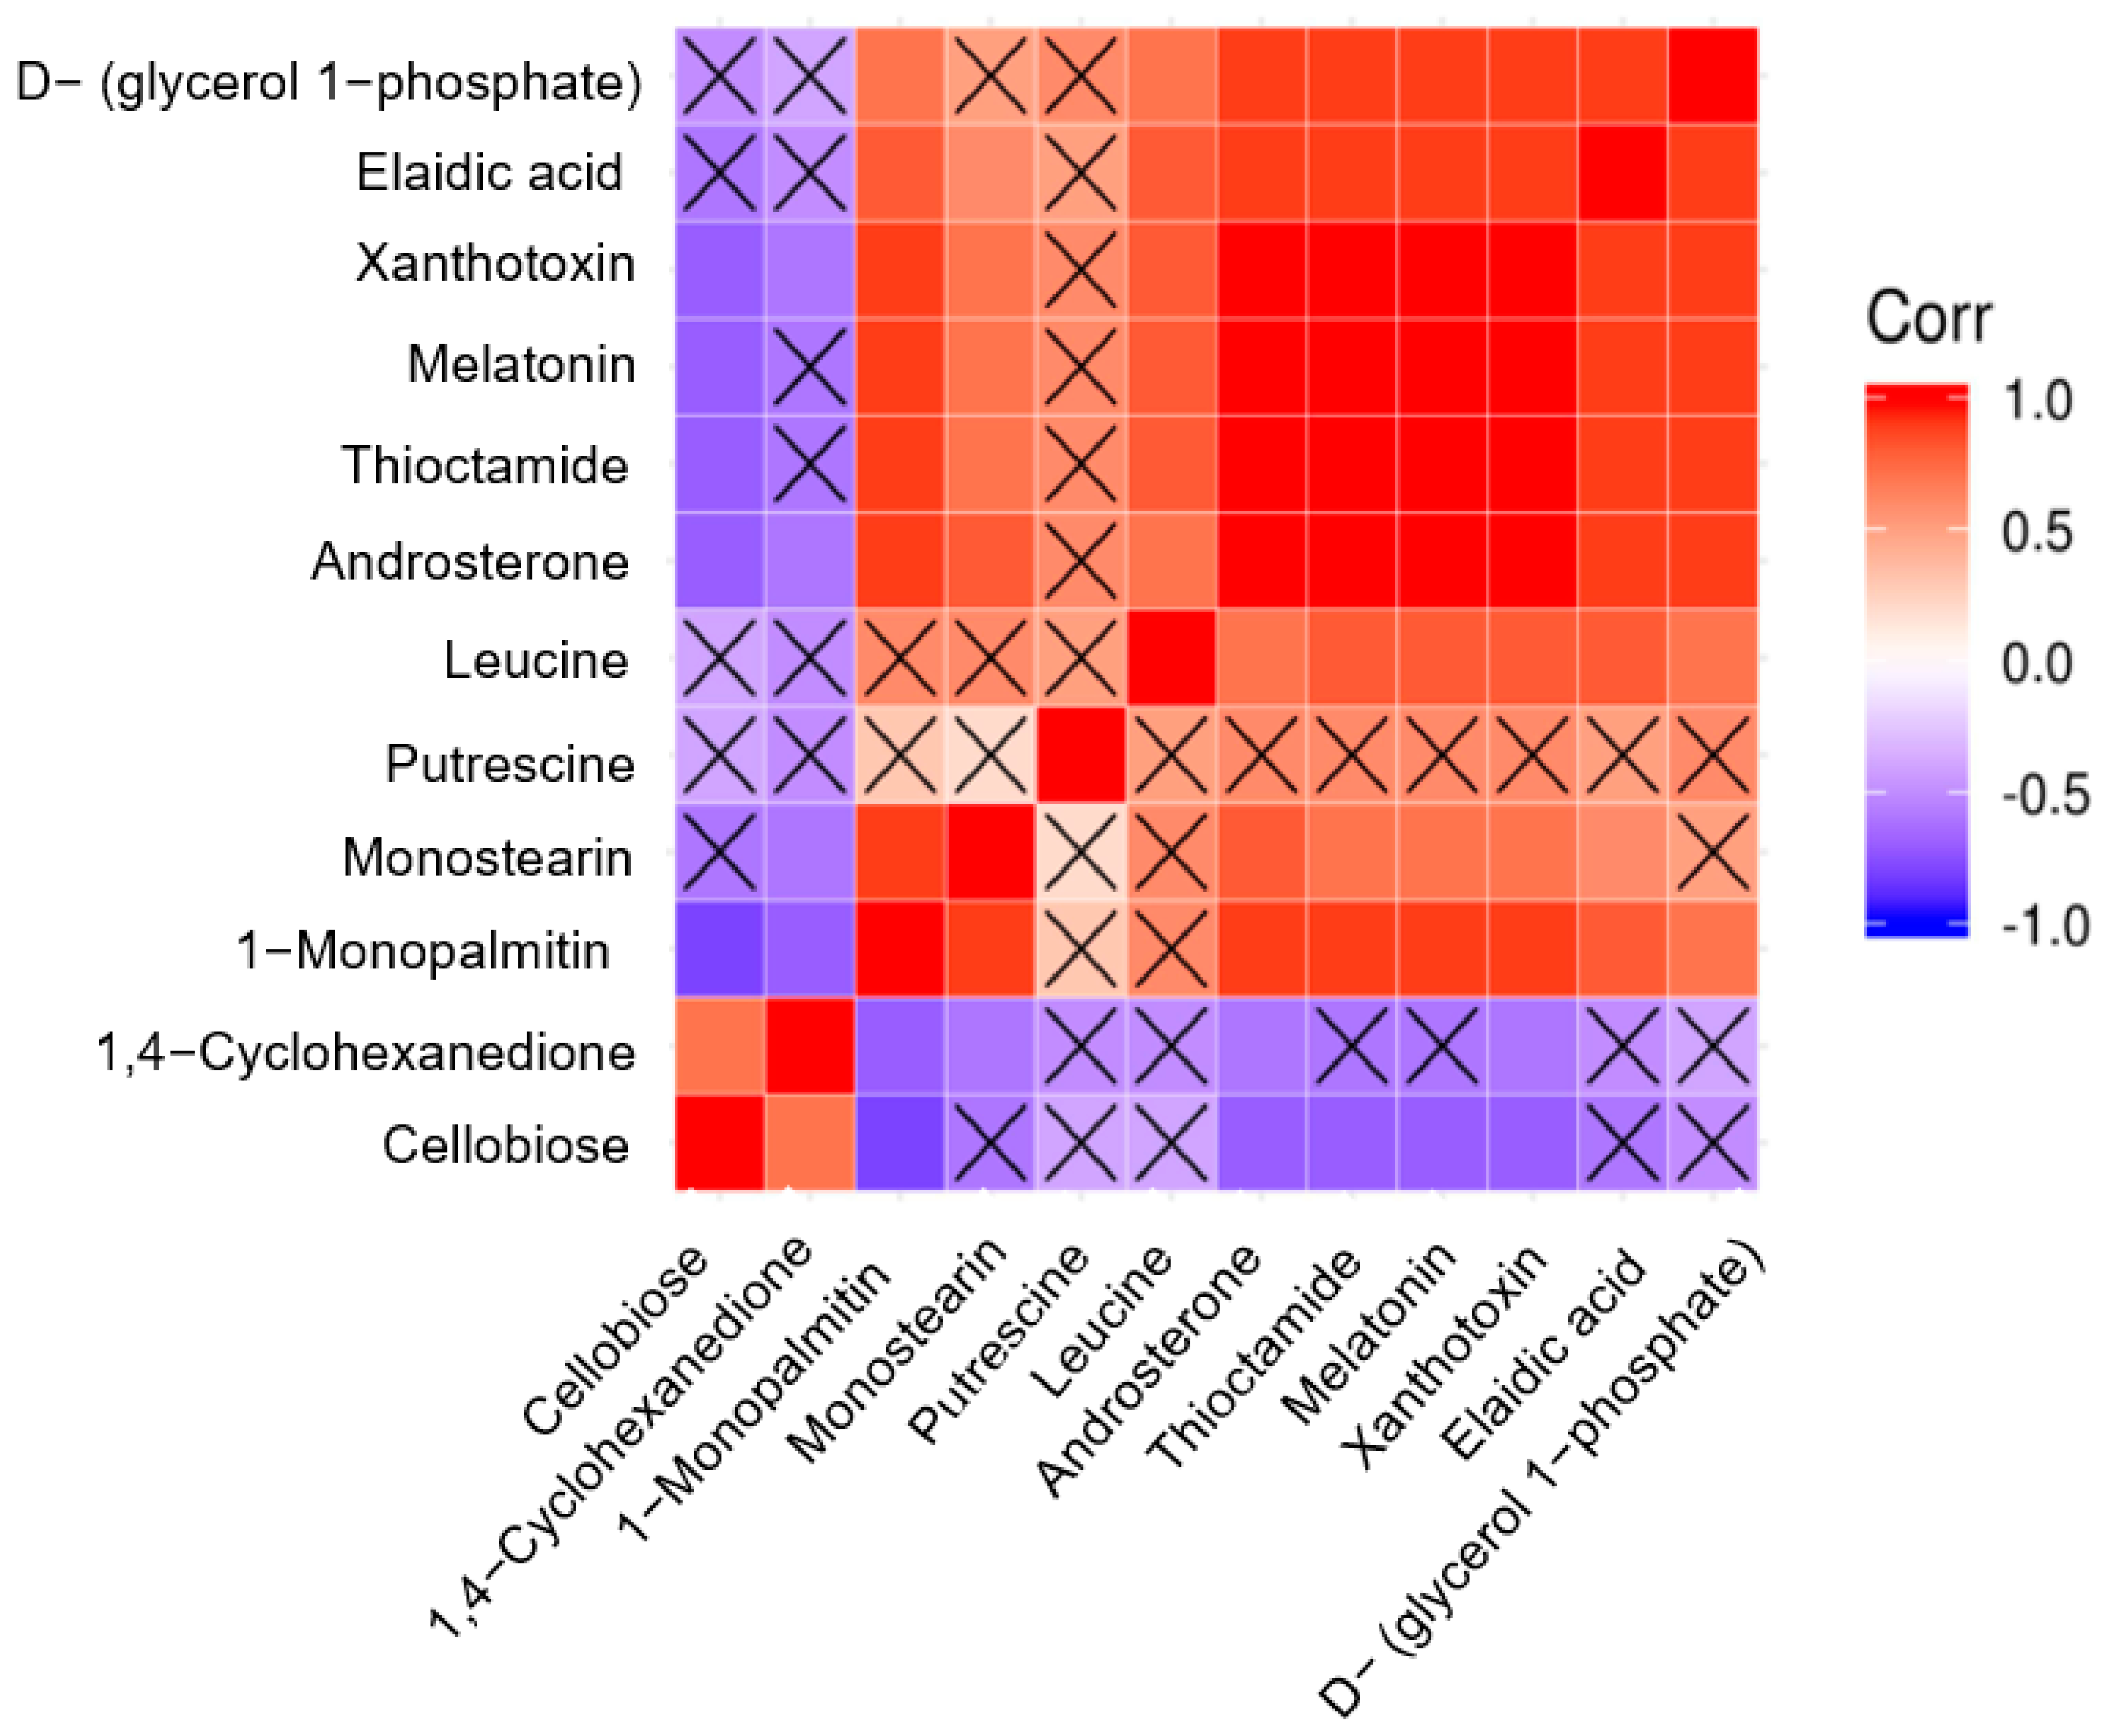
3.2.2. Analysis of Differential Metabolites

The different metabolites obtained by the above analysis are often biologically similar or complementary in results and functions, or are positively or negatively regulated by the same metabolic pathway, showing similar or opposite expression characteristics among different experimental groups. Hierarchical clustering analysis of these characteristics is helpful for us to to classify metabolites with the same characteristics and find the variation characteristics of metabolites between experimental groups.
For each group comparison, we calculated the correlation coefficient of the quantitative value of the differential metabolites using Pearson’s method, which was presented in the form of a thermal map (Figure 7). In the figure, the color blocks at different positions represent the correlation coefficient between the metabolites at corresponding positions. Red represents a positive correlation, while blue represents a negative correlation. Non-significant correlations were marked with crosses.

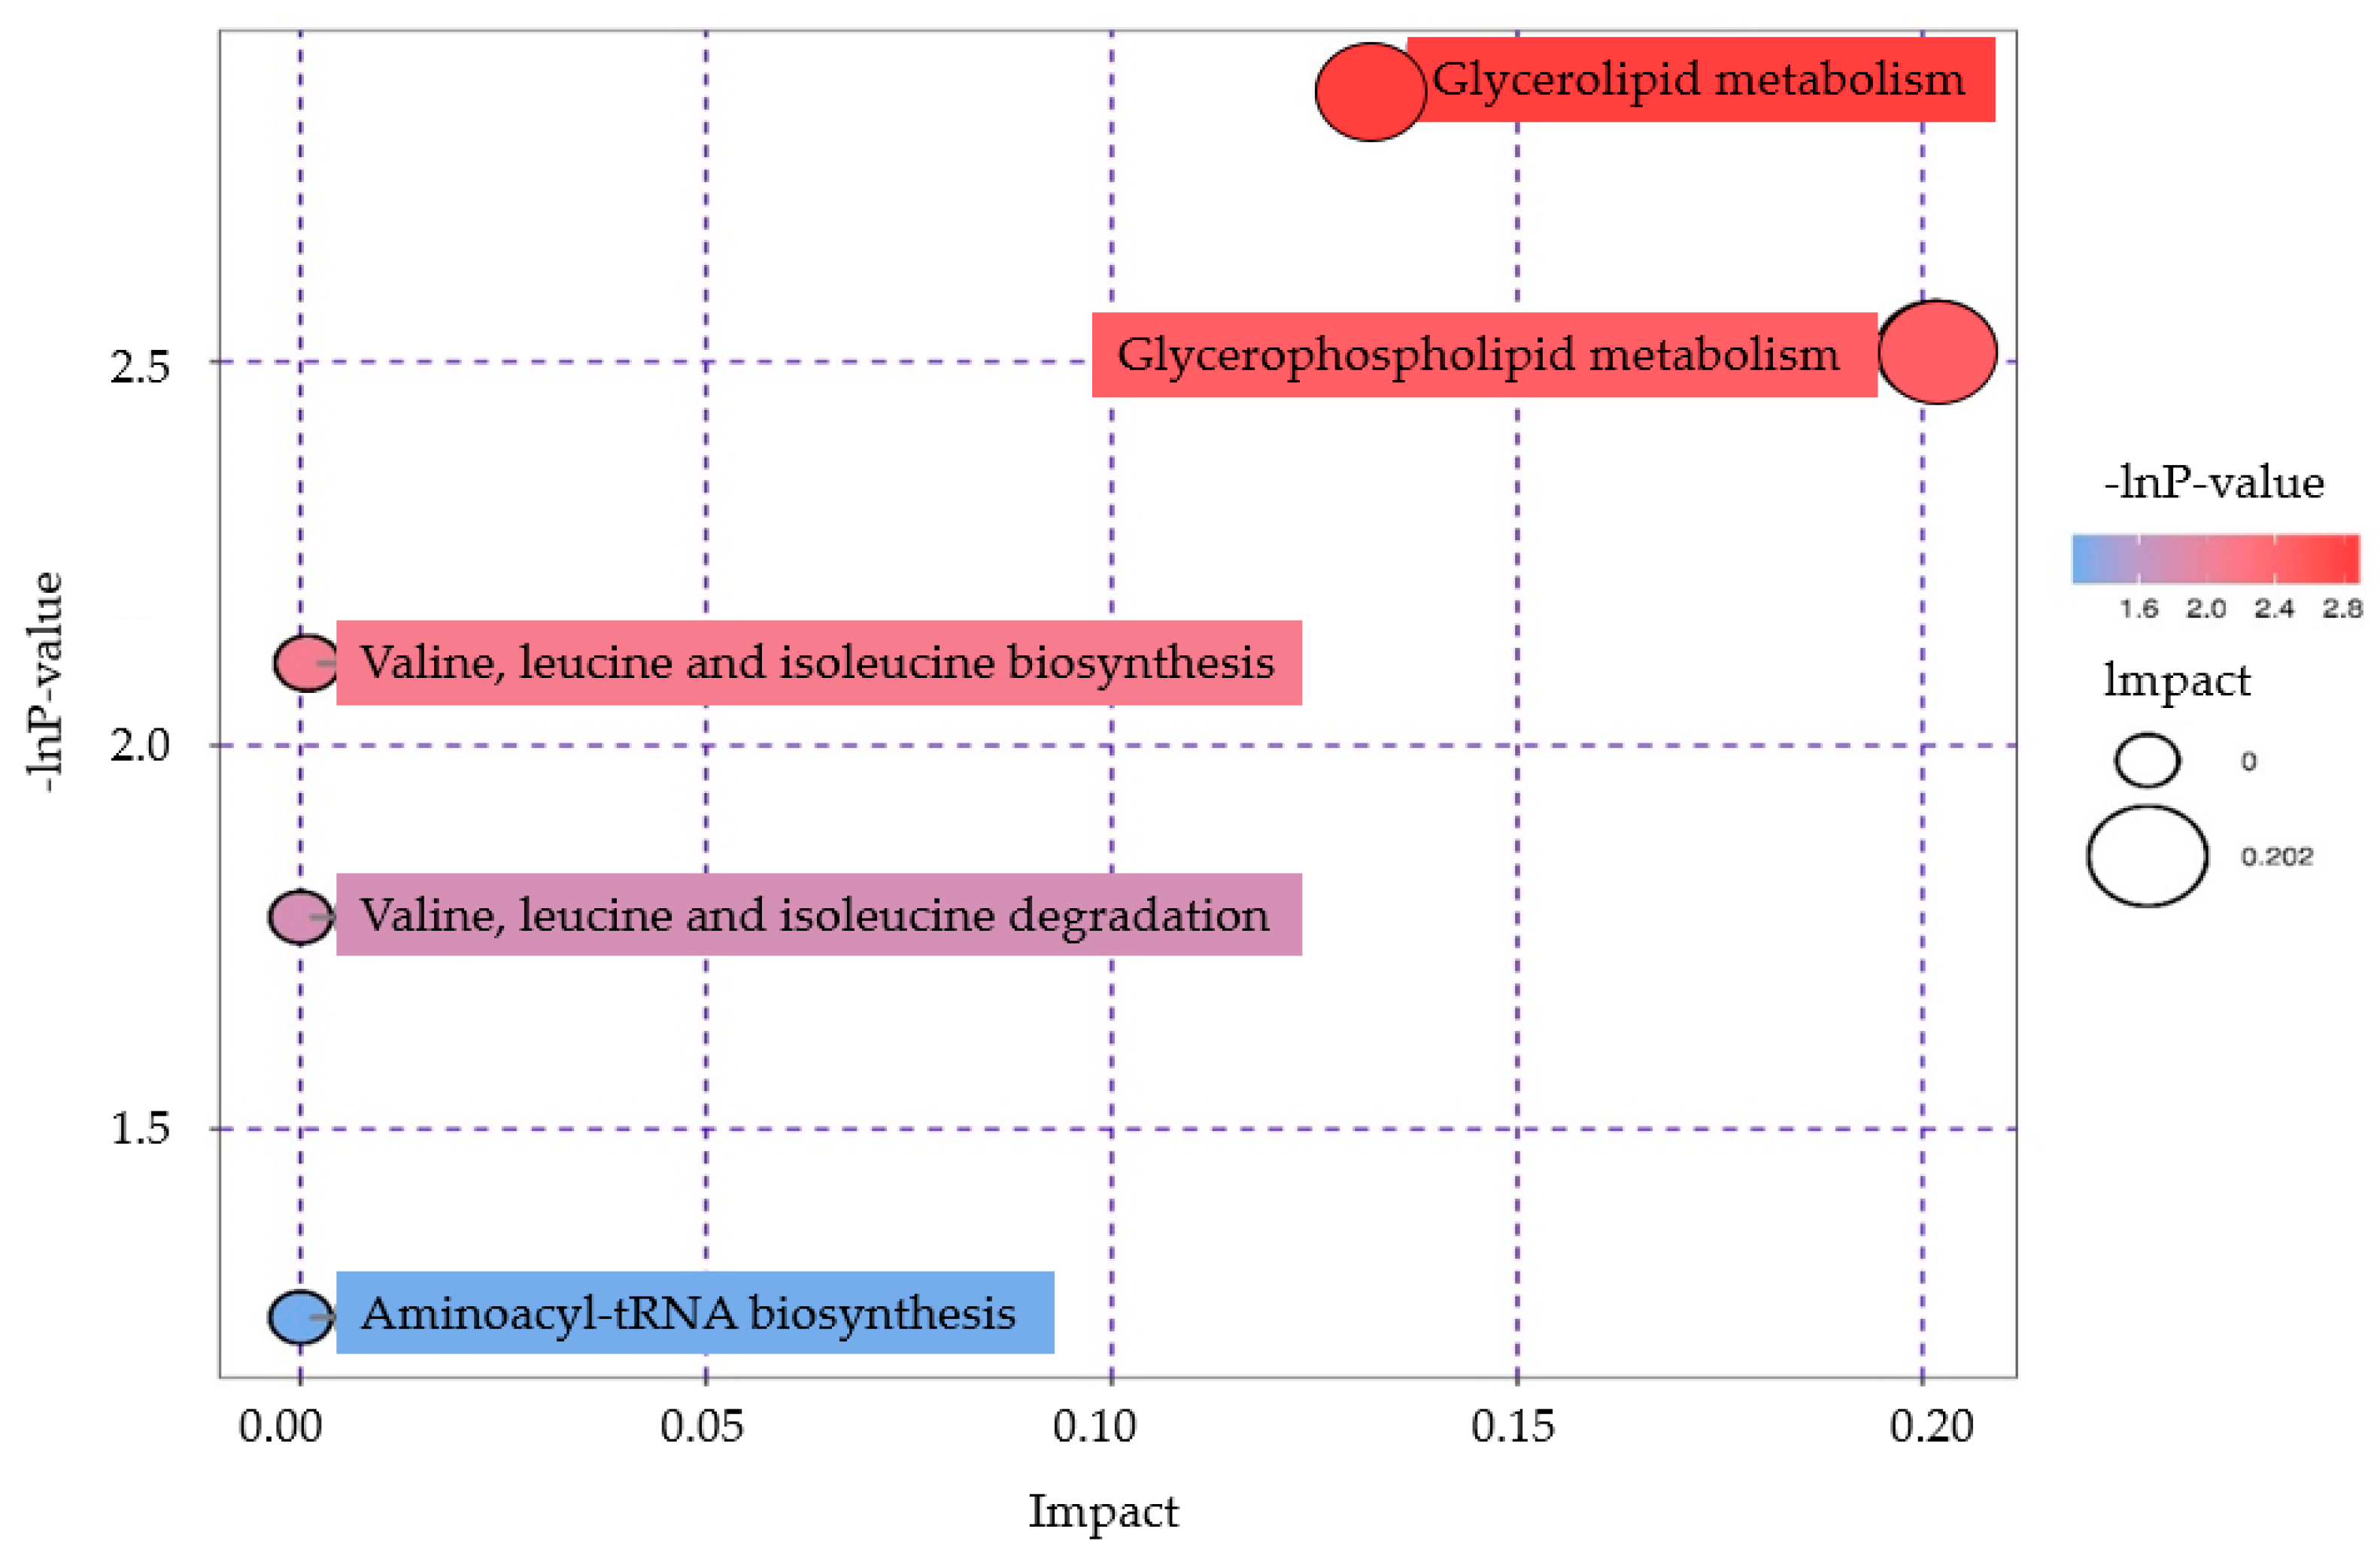
3.2.3. Pathway Analysis of Differential Metabolites

Metabolic reactions in organisms are not carried out alone, but by a variety of genes and proteins to form complex pathways and networks, and they affect and regulate each other, so that the whole metabolic process will be systematically changed. Therefore, based on the KEGG database [39,40], we searched for the metabolic pathways in which the above-mentioned differential metabolites were located. Through comprehensive analysis (including enrichment analysis and topological analysis) of the pathway where the differential metabolites are located, we can further screen the pathway and find the key pathway with the highest correlation with the differential metabolites. The results are shown in the KEGG Pathway file in the Supplementary File S2 (refer to the Supplementary File S2 for specific results) (Supplementary Materials). The differential metabolites were marked on the pathway map, with bright blue representing downregulation and bright red representing upregulation.
These metabolic pathways were then analyzed, and metabolic pathways related to the above differential metabolites were screened out. For specific analysis results, see the Pathway Analysis file in the Supplementary File S2. The results of metabolic pathway analysis are presented in a bubble map in Figure 8. Each bubble in the bubble diagram represents a metabolic pathway, and the abscissa and bubble size represent the impact factor size of this pathway in the topology analysis. The larger the bubble size is, the larger the impact factor is. The vertical coordinate and bubble color represent the p-value of the enrichment analysis (negative natural logarithm, namely -ln p-value). The darker the color is, the smaller the p-value is and the more significant the enrichment degree is.

4. Discussion

Pseudomonas aeruginosa has the second highest infection rate among all bacteria and has strong drug resistance. As a new technology, cold atmospheric plasma has attracted extensive attention in sterilization applications. Studies have proved that atmospheric-pressure low-temperature plasma can effectively sterilize.
Studies have demonstrated the bactericidal effect of atmospheric-pressure low-temperature plasma, and it is generally believed that reactive nitrogen oxides are responsible for the death of bacteria [24,25,26,27]. Meanwhile, some scholars also explored the metabolites of Pseudomonas aeruginosa [41]. However, to our knowledge there is an absence of studies which have tested the effects of plasma treatment on bacterial metabolism.
In this paper, we studied the entire metabolic process to understand the effect of plasma on bacterial metabolism. Firstly, we detected the physical and chemical properties of the portable device from the perspective of the emission spectrum and liquid phase active particles, and then detected and statistically analyzed the metabolites of the treatment group and the control group.
We demonstrated that mass metabolic profiling using GC-TOF-MS mass spectrometry revealed many significant differences between the control and plasma treated Pseudomonas aeruginosa groups. By KEGG analysis of metabolic pathways, we found that bacterial metabolites Melatonin and Thioacetamide in Pseudomonas aeruginosa were significantly increased after plasma treatment. Both metabolites belong to organ heterocyclic compounds, which are the decomposition products of protein and amino acids [42], so the metabolic pathways related to protein amino acids are promoted, while Cellobiose is significantly reduced. The metabolites belong to phenylpropanoids and polyketides, which are the decomposition products of carbohydrates in bacterial metabolism, indicating that the glucose metabolism pathway is inhibited. The metabolic pathways of Glycolipid metabolism and Glycerophospholipid metabolism showed the most obvious changes. On these two pathway maps (found in the KEGG database), the differential metabolite (Glycerol 3-phosphate) is marked in red. For details, please check Supplementary File S1. So metabolic pathways are upregulated because of an increased metabolite content. Thus, plasma treatment inhibits glucose metabolism in Pseudomonas aeruginosa and promotes the breakdown of proteins and amino acids, leading to bacterial death. While other researchers have studied the Pseudomonas aeruginosa metabolome, some scholars showed that in the process of drug killing of Pseudomonas aeruginosa, the synthesis of lipopolysaccharide and peptidoglycan was significantly reduced, and the level of lipid amino acid was increased [43]. Hussein et al. showed that the metabolic pathway of killing Pseudomonas aeruginosa included the destruction of carbohydrate metabolism, the reduction of amino sugar levels and the downregulation of the nucleotide bank [44]. Mielble et al. studied the metabolomic information of Pseudomonas aeruginosa and found changes in carbohydrate catabolism and a metabolic shift to amino acid utilization [45]. It proved that plasma sterilization and drug sterilization caused similar metabolic changes in bacteria.

5. Conclusions

In this paper, Pseudomonas aeruginosa was treated with a portable plasma device, and the main causes of bacterial death were explored through metabolomics. The study of this paper provides a new angle for scholars to study plasma sterilization—bacterial metabolism. However, as bacterial metabolism is a complex process, the study in this paper is not sufficient, and a large number of subsequent experiments are needed for further exploration.

Supplementary Materials

The following are available online at https://www.mdpi.com/article/10.3390/app112210527/s1, Supplementary File S1: KEGG pathway, Supplementary File S2: Differential metabolites and differential metabolic pathways.

Author Contributions

X.Z. and D.X. performed experiments, analyzed the data, and wrote the manuscript; Y.Y. and D.X. conceived and supervised the study, and revised this manuscript; S.W., R.F. and J.Z. participated in the experiment work. All authors have read and agreed to the published version of the manuscript.

Funding

This work was supported by the National Natural Science Foundation of China (Grant No. 51521065) and the First Class of China Postdoctoral Science Foundation (2017M610639).

Data Availability Statement

The datasets generated and analyzed during the current study are available from the corresponding author on reasonable request.

Conflicts of Interest

The authors declare no conflict of interest.

References

  1. Saleh, M.M.; Abbas, H.A.; Askoura, M.M. Repositioning secnidazole as a novel virulence factors attenuating agent in Pseudomonas aeruginosa. Microb. Pathog. 2019, 127, 31–38. [Google Scholar] [CrossRef]
  2. El-Mowafy, S.A.; El Galil, K.H.A.; El-Messery, S.M.; Shaaban, M.I. Aspirin is an efficient inhibitor of quorum sensing, virulence and toxins in Pseudomonas aeruginosa. Microb. Pathog. 2014, 74, 25–32. [Google Scholar] [CrossRef] [PubMed]
  3. Stover, C.; Pham, X.Q.; Erwin, A.L.; Mizoguchi, S.D.; Warrener, P.; Hickey, M.J.; Brinkman, F.; Hufnagle, W.O.; Kowalik, D.J.; Lagrou, M.; et al. Complete genome sequence of Pseudomonas aeruginosa PAO1, an opportunistic pathogen. Nature 2000, 406, 959–964. [Google Scholar] [CrossRef] [PubMed]
  4. Yang, L.; Chen, J.; Gao, J. Low temperature argon plasma sterilization effect on Pseudomonas aeruginosa and its mechanisms. J. Electrost. 2009, 67, 646–651. [Google Scholar] [CrossRef]
  5. Xu, D.; Ning, N.; Xu, Y.; Wang, B.; Cui, Q.; Liu, Z.; Wang, X.; Liu, D.; Chen, H.; Kong, M.G. Effect of cold atmospheric plasma treatment on the metabolites of human leukemia cells. Cancer Cell Int. 2019, 19, 135. [Google Scholar] [CrossRef]
  6. Xu, D.; Ning, N.; Xu, Y.; Xia, W.; Liu, D.; Chen, H.; Kong, M.G. Effect of He Plasma Jet Versus Surface Plasma on the Metabolites of Acute Myeloid Leukemia Cells. Front. Oncol. 2021, 11, 552480. [Google Scholar] [CrossRef]
  7. Shimizu, T. Wound treatment by low-temperature atmospheric plasmas and issues in plasma engineering for plasma medicine. Jpn. J. Appl. Phys. 2020, 59, 120501. [Google Scholar] [CrossRef]
  8. Lawton, J. Technological uses of low temperature plasmas. Phys. Technol. 1975, 6, 190–196. [Google Scholar] [CrossRef]
  9. Tonmitr, N.; Mori, T.; Takami, M.; Yonesu, A.; Hayashi, N. Time-Modulated LF-Microwave Hybrid Plasma for Surface Sterilization. IEEE Trans. Plasma Sci. 2020, 49, 154–161. [Google Scholar] [CrossRef]
  10. Zhdanov, A.E.; Pahomov, I.M.; Ulybin, A.I. Low-Temperature Plasma Sterilization: Using a Sterilizing Agent Based on Organic Acids. In Proceedings of the 2019 E-Health and Bioengineering Conference (EHB), E-Health and Bioengineering Conference, Iasi, Romania, 21–23 November 2019; pp. 1–4. [Google Scholar]
  11. Liu, K.; Yang, Z.; Liu, S. Study of the Characteristics of DC Multineedle-to-Water Plasma-Activated Water and Its Germination Inhibition Efficiency: The Effect of Discharge Mode and Gas Flow. IEEE Trans. Plasma Sci. 2020, 48, 969–979. [Google Scholar] [CrossRef]
  12. Fang, L.I.U.; Haitao, H.; Shaosong, H. Research Advance of Low-temperature Plasma Sterilization. J. Environ. Health 2007, 24, 367–369. [Google Scholar]
  13. Tseng, S.; Abramzon, N.; Jackson, J.O.; Lin, W.-J. Gas discharge plasmas are effective in inactivating Bacillus and Clostridium spores. Appl. Microbiol. Biotechnol. 2012, 93, 2563–2570. [Google Scholar] [CrossRef] [PubMed]
  14. Adler, S.; Scherrer, M.; Daschner, F. Costs of low-temperature plasma sterilization compared with other sterilization methods. J. Hosp. Infect. 1998, 40, 125–134. [Google Scholar] [CrossRef]
  15. Boudam, M.K.; Moisan, M.; Saoudi, B.; Popovici, C.; Gherardi, N.; Massines, F. Bacterial spore inactivation by atmospheric-pressure plasmas in the presence or absence of UV photons as obtained with the same gas mixture. J. Phys. D Appl. Phys. 2006, 39, 3494–3507. [Google Scholar] [CrossRef]
  16. Moisan, M.; Barbeau, J.; Crevier, M.-C.; Pelletier, J.; Philip, N.; Saoudi, B. Plasma sterilization. Methods and mechanisms. Pure Appl. Chem. 2002, 74, 349–358. [Google Scholar] [CrossRef]
  17. Liu, Z.; Xu, D.; Pang, B.; Wang, S.; Wang, S.; Gao, Y.; Peng, S.; Chen, H.; Kong, M.G. Evaluation of microbial species inactivation and purification of pond sewage by a custom-built air surface discharge plasma. Plasma Process. Polym. 2021, 18, e2100004. [Google Scholar] [CrossRef]
  18. Zhang, X.; Liu, D.; Wang, H.; Liu, L.; Wang, S.; Yang, S.-Z. Highly Effective Inactivation of Pseudomonas sp HB1 in Water by Atmospheric Pressure Microplasma Jet Array. Plasma Chem. Plasma Process. 2012, 32, 949–957. [Google Scholar] [CrossRef]
  19. Shen, J.; Zhang, H.; Xu, Z.; Zhang, Z.; Cheng, C.; Ni, G.; Lan, Y.; Meng, Y.; Xia, W.; Chu, P.K. Preferential production of reactive species and bactericidal efficacy of gas-liquid plasma discharge. Chem. Eng. J. 2019, 362, 402–412. [Google Scholar] [CrossRef]
  20. Shahzad, S.; Willcox, M.; Shahzad, A. Identification of novel in vitro antibacterial action of cloprostenol and evaluation of other non-antibiotics against multi-drug resistant A. baumannii. J. Antibiot. 2019, 73, 72–75. [Google Scholar] [CrossRef] [PubMed]
  21. Chengliu, L.; Wenzheng, L.; Mingui, S. Generation of plasma jet and its application to medical sterilization. In Proceedings of the 2009 IEEE 35th Annual Northeast Bioengineering Conference NEBEC, Cambridge, MA, USA, 3–5 April 2009. [Google Scholar]
  22. Shintani, H.; Shimizu, N.A.; Imanishi, Y.; Sakudo, A.; Uyama, T.; Hotta, E. Current Progress in Advanced Technology of Nitrogen Gas Plasma for Remote Sterilization and Clari-fication of Sterilization. In Gas Plasma Sterilization in Microbiology: Theory, Applications, Pitfalls and New Perspectives; Caister Academic Press: Norfolk, UK, 2016; pp. 25–39. [Google Scholar]
  23. Tonmitr, N.; Yonesu, A.; Hayashi, N. Effect of gas composition on surface sterilization by using LF-microwave hybrid plasma source. Jpn. J. Appl. Phys. 2019, 59, SAAB02. [Google Scholar] [CrossRef]
  24. Nguyen, L.N.; Kaushik, N.; Bhartiya, P.; Gurmessa, S.K.; Kim, H.J.; Nguye, L.Q. Plasma-synthesized mussel-inspired gold nanoparticles promote autophagy-dependent dam-age-associated molecular pattern release to potentiate immunogenic cancer cell death. J. Ind. Eng. Chem. 2021, 100, 99–111. [Google Scholar] [CrossRef]
  25. Attri, P.; Kaushik, N.K.; Kaushik, N.; Hammerschmid, D.; Privat-Maldonado, A.; De Backer, J.; Shiratani, M.; Choi, E.H.; Bogaerts, A. Plasma treatment causes structural modifications in lysozyme, and increases cytotoxicity towards cancer cells. Int. J. Biol. Macromol. 2021, 182, 1724–1736. [Google Scholar] [CrossRef] [PubMed]
  26. Semmler, M.L.; Bekeschus, S.; Schäfer, M.; Bernhardt, T.; Fischer, T.; Witzke, K.; Seebauer, C.; Rebl, H.; Grambow, E.; Vollmar, B. Molecular Mechanisms of the Efficacy of Cold Atmospheric Pressure Plasma (CAP) in Cancer Treatment. Cancers 2020, 12, 269. [Google Scholar] [CrossRef] [Green Version]
  27. Freund, E.; Liedtke, K.R.; Van Der Linde, J.; Metelmann, H.-R.; Heidecke, C.-D.; Partecke, L.-I.; Bekeschus, S. Physical plasma-treated saline promotes an immunogenic phenotype in CT26 colon cancer cells in vitro and in vivo. Sci. Rep. 2019, 9, 1–18. [Google Scholar] [CrossRef]
  28. Dewolf, W.E.; Dewolf, W.E.; Payne, D.J.; Seefeld, M.A.; Wallis, N.G.; West, J.M.; Brandt, M.; Keller, P.M.; Patel, A.H.; Reed, S.L.; et al. Treating a Bacterial Infection or Modulating Bacterial Metabolism Using an Agonist or Antagonist of FabK Polypeptide. Patent WO200231128-A1, 27 June 2019. [Google Scholar]
  29. Guo, J.; Liu, S.; Yang, Z.; Zhang, S.; Sun, B. Lignite Deashing Reverse Flotation Method Involves Grinding Lignite Coal, Obtaining Slurry, Adding Paenibacillus Polymyxa or Yeast, Processing, Adding Inhibitor, Polysaccharide and Amine Collector, Subjecting to Floatation and Foaming. Patent CN105363563-A, 2 November 2015. [Google Scholar]
  30. Vaidyanathan, R.; Rajbhandary, U.L. New Eukaryotic Cells Containing Bacterial Formylase, Useful in Identifying Inhibitors of Formylase for Preventing Bacterial Growth, Replication, Metabolism and Survival. Patent WO200155351-A, 24 January 2011. [Google Scholar]
  31. KIST Korea Institute of Science and Technology. Device for Real-Time Measurement of Bacteria by Atp Detection. U.S. Patent 10,920,266, 16 February 2021. [Google Scholar]
  32. Monica, S.; Bancalari, E.; Castellone, V.; Rijkx, J.; Wirth, S.; Jahns, A.; Bottari, B. ATP Bioluminescence for Rapid and Selective Detection of Bacteria and Yeasts in Wine. Appl. Sci. 2021, 11, 4953. [Google Scholar] [CrossRef]
  33. Alice Longobardi, G. Flow Cytometry: First Principles; John Wiley & Sons: Hoboken, NJ, USA, 2001; Volume 2. [Google Scholar]
  34. Duan, S.-G.; Hong, K.; Tang, M.; Tang, J.; Liu, L.-X.; Gao, G.-F.; Shen, Z.-J.; Zhang, X.-M.; Yi, Y. Untargeted metabolite profiling of petal blight in field-grown Rhododendron agastum using GC-TOF-MS and UHPLC-QTOF-MS/MS. Phytochemistry 2021, 184, 112655. [Google Scholar] [CrossRef] [PubMed]
  35. Raftery, D.E.; Shi, X.; Yin, X.; Zhang, X.; Walker, J.M.E.-I.-C. Methods in Molecular Biology: Methods and Protocols 99; Humana Press: New York, NY, USA, 2014. [Google Scholar]
  36. Gao, Y.; Liu, Z.; Wang, S.; Pang, B.; Xu, D.; Liu, D.; Kong, M.G. The investigation of RONS permeation in plasma-activated oil–water mixed system. Plasma Process. Polym. 2021, 18, e2100038. [Google Scholar] [CrossRef]
  37. Xu, Y.; Peng, S.; Li, B.; Wang, S.; Zhang, H.; Li, Q.; Liu, Z.; Guo, B.; Liu, D.; Xu, D. Systematic Safety Evaluation of Cold Plasma-Activated Liquid in Rabbits. Front. Phys. 2021, 9. [Google Scholar] [CrossRef]
  38. Burns, D.T.; Walker, M.J. Origins of the method of standard additions and of the use of an internal standard in quantitative instrumental chemical analyses. Anal. Bioanal. Chem. 2019, 411, 2749–2753. [Google Scholar] [CrossRef] [Green Version]
  39. Horinaka, A.; Kim, Y.-H.; Kimura, A.; Iwamoto, E.; Masaki, T.; Ichijo, T.; Sato, S. Changes in the predicted function of the rumen bacterial community of Japanese Black beef cattle during the fattening stages according to Kyoto Encyclopedia of Genes and Genomes (KEGG) analyses. J. Veter-Med. Sci. 2021, 83, 21–0121. [Google Scholar] [CrossRef]
  40. Kihara, D.E.; Kanehisa, M.; Walker, J.M.S.E. Methods in Molecular Biology 135; Humana Press: New York, NY, USA, 2017. [Google Scholar]
  41. Lybbert, A.; Williams, J.; Raghuvanshi, R.; Jones, A.; Quinn, R. Mining Public Mass Spectrometry Data to Characterize the Diversity and Ubiquity of P. aeruginosa Specialized Metabolites. Metabolites 2020, 10, 445. [Google Scholar] [CrossRef]
  42. Kyoto Encyclopedia of Genes and Genomes. Available online: https://www.kegg.jp/.2021 (accessed on 1 October 2021).
  43. Shi, Y.; Pan, C.; Cen, S.; Fu, L.; Cao, X.; Wang, H.; Wang, K.; Wu, B. Comparative metabolomics reveals defence-related modification of citrinin by Penicillium citrinum within a synthetic Penicillium -Pseudomonas community. Environ. Microbiol. 2019, 21, 496–510. [Google Scholar] [CrossRef] [PubMed] [Green Version]
  44. Hussein, M.; Han, M.-L.; Zhu, Y.; Zhou, Q.; Lin, Y.-W.; Hancock, R.E.W.; Hoyer, D.; Creek, D.J.; Li, J.; Velkov, T. Metabolomics Study of the Synergistic Killing of Polymyxin B in Combination with Amikacin against Polymyxin-Susceptible and -Resistant Pseudomonas aeruginosa. Antimicrob. Agents Chemother. 2019, 64, e01587-19. [Google Scholar] [CrossRef] [PubMed]
  45. Mielko, K.A.; Jabłoński, S.J.; Wojtowicz, W.; Milczewska, J.; Sands, D.; Łukaszewicz, M.; Młynarz, P. Possible metabolic switch between environmental and pathogenic Pseudomonas aeruginosa strains: 1H NMR based metabolomics study. J. Pharm. Biomed. Anal. 2020, 188, 113369. [Google Scholar] [CrossRef] [PubMed]
Figure 1. Portable plasma equipment setup.
Applsci 11 10527 g001
Figure 2. Voltage and current waveform of the device.
Applsci 11 10527 g002
Figure 3. Portable detection of surface discharge uniformity: (a) emission spectra of six randomly selected points; (b) distribution of the six points.
Applsci 11 10527 g003
Figure 4. (a) Spectrogram of portable surface discharge; (b) Detection of liquid phase active particles in portable plasma activated water.
Applsci 11 10527 g004
Figure 5. Activity test of Pseudomonas aeruginosa treated by plasma activated water.
Applsci 11 10527 g005
Figure 6. Dispersion points diagram of the OPLS−DA model of group 1T versus Group C.
Applsci 11 10527 g006
Figure 7. Thermal diagram of correlation analysis between group 1T and Group C.
Applsci 11 10527 g007
Figure 8. Pathway analysis diagram of group 1T versus group C.
Applsci 11 10527 g008
Table 1. List of laboratory reagents.
The Name of the ReagentCASPurityManufacturer
Methanol67-56-1HPLCCNW Technologies
Chloroform67-66-3HPLCAdamas
Pyridine110-86-1HPLCAdamas
Methoxyamine hydrochloride593-56-6ARTCI
2-Chloro-l-phenylalanine103616-89-3≥98%Shanghai Hengbai Biotechnology
BSTFA (with 1% TMCS, v/v)----REGIS Technologies
FAMEs----Dr. Ehrenstorfer
Table 2. OPLS-DA model parameter table. The model parameters are the comparison between the treatment group and the control group. A is the number of principal components of the model, N is the number of observations of the model (here, it is the number of samples), R2X represents the model’s interpretation of X variable, R2Y represents the model’s interpretation of Y variable, and Q2 represents the predictability of the model.
TypeANR2X (cum)R2Y (cum)Q2 (cum)Title
OPLS-DA1 + 1 + 0100.5840.9680.6671T VS C
Table 3. Differential metabolites: 1T and C were the relative quantitative values of the substance in the treatment group and control group, respectively. The VIP is to compare this group of substances with the OPLS-DA model obtained by predicting significance of variables. The p-value is obtained by the t-test for the substance in the group comparison. p < 0.05.
Name of MetaboliteKyoto Encyclopedia of Genes and Genomes (KEGG) ID1TCVIPpFold ChangeVariation
Trend
Monostearin-----0.010780.007801.870200.009421.38200up
1-Monopalmitin-----0.017560.011712.322570.000191.50025up
MelatoninC015980.607620.131052.432750.000044.63664up
ThioctamideC005790.701700.151222.427280.000054.64036up
XanthotoxinC018640.036460.009052.427730.000014.03036up
AndrosteroneC005230.033480.007342.424920.000014.56092up
PutrescineC001340.045060.027011.684540.048901.66810up
LeucineC001230.076120.030491.327560.026362.49651up
Elaidic acidC017120.008150.003482.335370.001132.34486up
d-(glycerol 1-phosphate)C000930.004590.002682.061440.006541.71301up
1,4-CyclohexanedioneC080630.006040.007671.831490.023270.78668down
CellobioseC064220.001530.003301.138190.004470.46277down
Publisher’s Note: MDPI stays neutral with regard to jurisdictional claims in published maps and institutional affiliations.

