Article

Identification of Close Modes on Frequency in Rotating Systems

by
Rafael A. Figueroa-Díaz
1,*,
Pedro Cruz-Alcantar
2 and
Antonio de J. Balvantín-García
3
1
Electronic and Electrical Engineering Department, Sonora Institute of Technology, Obregón, Ciudad Obregón 85000, Mexico
2
Department of Mechanical Engineering, The Autonomous University of San Luis Potosí, San Luis Potosí 78700, Mexico
3
Department of Mechanical Engineering, University of Guanajuato, Guanajuato 36000, Mexico
*
Author to whom correspondence should be addressed.
Appl. Sci. 2021, 11(21), 9963; https://doi.org/10.3390/app11219963
Submission received: 25 August 2021 / Revised: 28 September 2021 / Accepted: 4 October 2021 / Published: 25 October 2021

Abstract

:
In the area of modal balancing, it is essential to identify the vibration modes to be balanced in order to obtain the different modal parameters that will allow knowing the correction weight and its position in the balance planes. However, in some cases, a single mode is apparently observed in the polar response diagrams used for this process, which actually contains at least two modes and which, when added vectorially, shows only one apparent mode. In these cases, in addition to the intrinsic errors when using a modal parameter extraction tool, there will be errors in determining the correction weight for the modes, as well as for the placement angle. In this work, an identification methodology is presented which, through the use of coordinate transformation and a modal parameter extraction tool, allows identifying characteristic patterns of close modes in frequency and which, when applied in the study of a system in the field, offers robustness and applicability.

1. Introduction

Modal balancing is a technique used in the field of turbomachinery balancing which allows balancing a specific mode without affecting the other modes present [1]. From a practical point of view, this is very convenient because in theory, a rotor could be balanced in a single run, as presented in [2]. However, although the theory has been in place for decades, its systematic application in the field is not so simple. Some current limitations are related mainly to the need to know the modal shapes of the rotor in resonance, instrumentation problems, non-linearity of the system, errors during the modal parameter extraction process, the presence of close modes in frequency, and the non-consideration of the main stiffness directions [3]. In the first three problems mentioned, there have been significant advances in using the finite element tool and the continuous improvement and development of vibration sensors and data acquisition and processing boards. Likewise, there are modal parameter extraction methodologies, such as those presented by Ewin in [4], designed for structures and which can be adapted for rotating systems through circle adjustment, such as the AMODAL software owned by the National Institute for Electricity and Clean Energy. However, these methodologies are focused on extracting the modal parameters in one mode for separate frequencies. Different investigations into structures to identify close modes and their extraction of some modal parameters have been carried out: Sun et al., in [5], present a method in frequency which uses the stepped reassignment of the Wavelet transform to allow identification of the natural frequency and damping ratio of a three-degree-of-freedom structure, using a 5% difference between natural frequencies to define close modes in frequency. Likewise, in the frequency domain, a different approach is presented by Mottershead in [6] by means of dummy modifications in Bode diagrams in amplitude using a fictitious mass at specific measurement points and comparing the measured diagram with those obtained using the proposed graphical technique. Malekjafarian et al., in [7], used the method in time by using the Ibrahim Time Domain (ITD) technique to study close modes on a plate; by applying the finite element technique, the dynamic response of the structure is obtained to identify the natural frequency of the first five vibration modes with close frequencies. In [8], Feng and Zhou present a method in time to identify close modes in structures using the Vector Backward Auto-Regressive (VBAR) technique, determining the modal parameters of natural frequency and mode damping. In [9], XiaoXing and Jun present the measurement of the degree of correlation between modal shapes in structures to detect close modes. Along the same line of research, Brinker and Lopez, in [10], present an investigation to identify close modes in structures through high sensitivity to small changes in the system, considering two modal forms through the theory of the local correspondence principle. In [11], Kim and Chen combine Wavelet Packet Decomposition algorithms and Complex Envelope Displacement Analysis for the identification of close modes in structures, applying their methodology in a two-degree-of-freedom model. On the other hand, Sui and Brownjohn, in [12], present the mathematical bases to identify close modes in structures using Bayesian operational model to determine the covariance matrix and propose the uncertainty identification term. The authors propose beginning development of what they call the uncertainty laws for the identification of the problem posed. Gutierrez et al., in [13], present a method that allows estimating the modal parameters of two close modes through the use of FRFs in a quasi-axisymmetric structure. The results presented were validated through an experimental study and finite element simulation. One use of the simulation is to determine the location of close frequencies. Recently, Siu-Kui et al. [14] proposed a new technique for analytically identifying close modes in structures. However, the effect of close modes on the balancing process has been little studied. Bently and Musznska mention this issue in rotors in [15], commenting that this presents “numerous difficulties” when analyzing the lateral vibration phenomenon in rotors.
Although there is currently little information about its effect when using either the influence coefficient or the modal balancing technique due to the modal balancing operating principle, the negative effect would be greater, as it would be necessary to use the modal parameters in resonance from the different modes present in the response diagrams generated (natural frequency, damping ratio, vibration amplitude, and phase angle). During a research stay in the Turbomachinery Management Department at the National Institute for Electricity and Clean Energy (INEEL), one researcher in charge of balancing rotors in the field suggested the presence of close modes as a cause of the high balancing time in very specific equipment. However, the lack of instrumentation to ensure their existence in these problematic rotors, as well as of modal extraction tools that would allow separating the close modes present in the response diagram used for balancing, has prevented quantification during the balancing process. As the number of rotors displaying this behavior was few in comparison to the balancing services they performed (and which were balanced with a considerable increase in runs and time), the economic investment required to solve the problem was not profitable for the company.
Therefore, a tool is proposed in this work to identify the presence of close modes in rotating systems. Likewise, the close mode problem in one-degree-of-freedom rotating systems is graphically represented. Finally, a partial result is presented of the study carried out on the vibration signals obtained from two field turbogenerators (units with the same technical characteristics) configured to identify the natural frequencies of the different equipment, with the presence of close modes being found during this process.

2. Close modes in Frequency

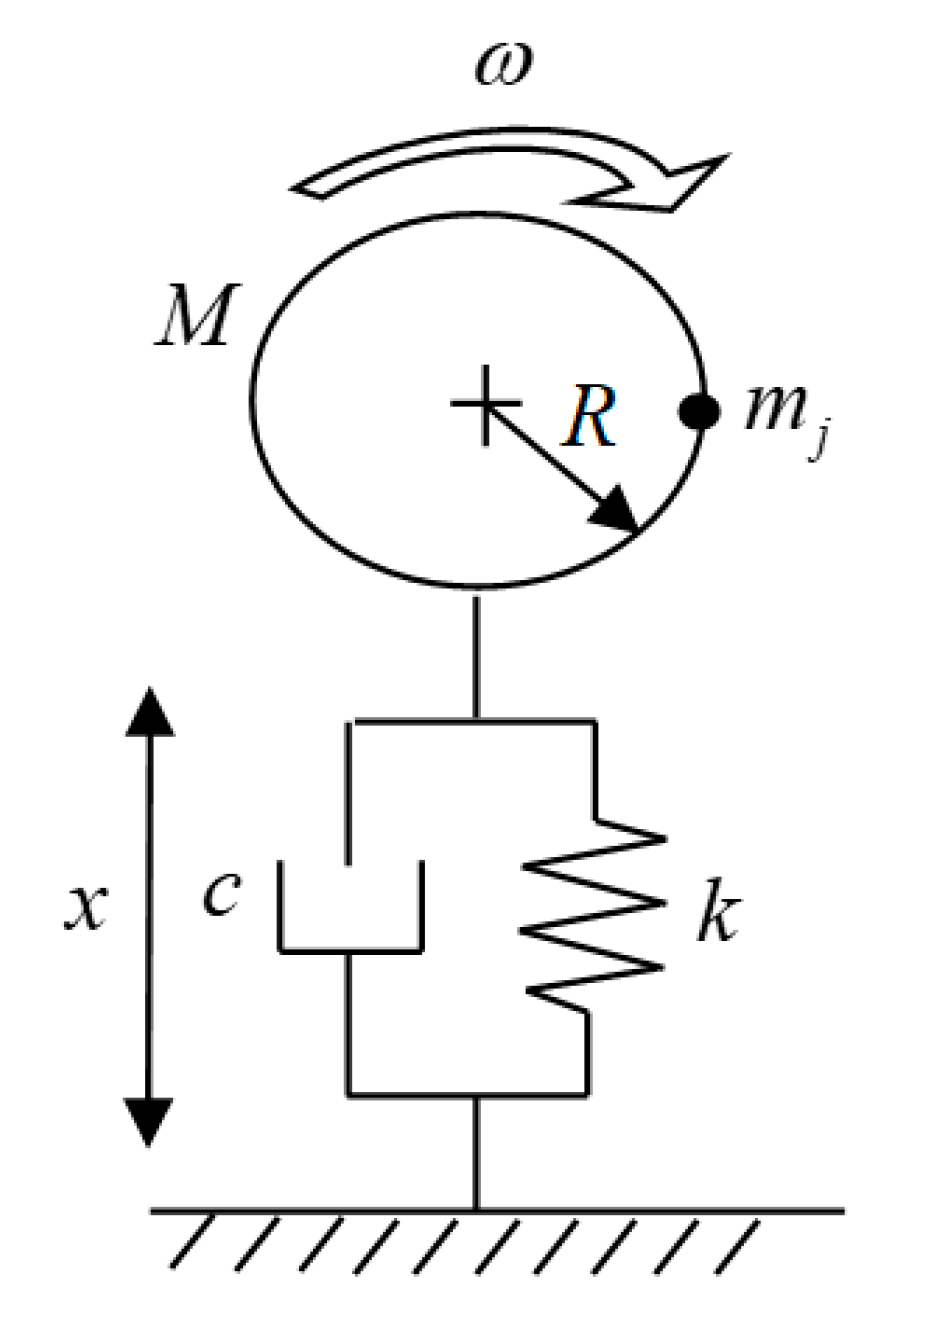
2.1. Mathemathical Model

In the present study, the system is considered as shown in the following Figure 1:
Where M represents the total mass of the system, m j the imbalance mass, c the viscous damping coefficient, and k the stiffness. Consider that the imbalance force is given by the following relationship:
F d e s   α   ω 2
Therefore, the force equation is f ( t )   =   m j   R   ω 2   e i ω t , where R represents the radius of placement of the imbalance mass.
Applying Newton’s second law to the diagram shown in Figure 1 and considering the behavior of the system in a steady state returns the following equation:
M   x ¨   +   c   x ˙   +   k   x   =   f ( t ) ,
Considering a solution of the form x   =   X   e i   ω   t     ϕ , the system response is given by the following equations:
X   =   m j   R   ω 2 ( k     M ω 2 ) 2   +   ( c ω ) 2 ,
while the phase angle is given by
ϕ   =   t g 1 ( c ω k     M ω 2 ) ,
Using Equations (3) and (4) allows generating polar response diagrams from a decoupled vibration mode. However, the coupled dynamic response of a rotating system can be generated from these equations, as presented in [3].
Likewise, the methodology for two-degree-of-freedom coupled rotating systems is presented in matrix form in [4,16].
For the present research work, modal analysis will be used to generate the dynamic response of a decoupled system rotor to graphically represent the definition of close modes and modes separated in frequency. To do this, the expressions presented in [17] are used, given as
X i r e a l ω   =   R j   m j   r   =   1 t ψ r j   ψ r i   Ω r 2   ( 1     Ω r 2 )   M M r   ( ( 1     Ω r 2 ) 2   +   ( 2   ζ r   Ω r ) 2 )   ,
X i i m a g ω   =   R j   m j   r   = 1 t ψ r j   ψ r i   2   ζ r   Ω r 3 M M r   ( ( 1     Ω r 2 ) 2   +   ( 2   ζ r   Ω r ) 2 )   ,
where X i r e a l ω , X i i m a g ω represent the real and imaginary components of vibration observed by a sensor at position i given an angular velocity ω , ψ r j is the modal form factor of mode r observed by a sensor at position j , M M r is the modal mass of mode r , ζ r is the viscous damping factor of mode r , and Ω r is the frequency ratio of mode r .
Equations (5) and (6) allow generating decoupled vibration modes horizontally and vertically to generate the “mode pairs” shown in [15]. Likewise, the methodology proposed in [17] is used to generate the coupling for the generation of polar diagrams from more than two coupled modes.
Considering two vibration modes, the numerical parameters presented in the table below will be used.
The polar diagram of the corresponding mode pair observed by the sensor at position 1 in the 0 and 90° directions generated with Equations (5) and (6) returns the Figure 2.
Figure 2a,b presented the decoupled modes in x and y direction using the parameter shown in Table 1.

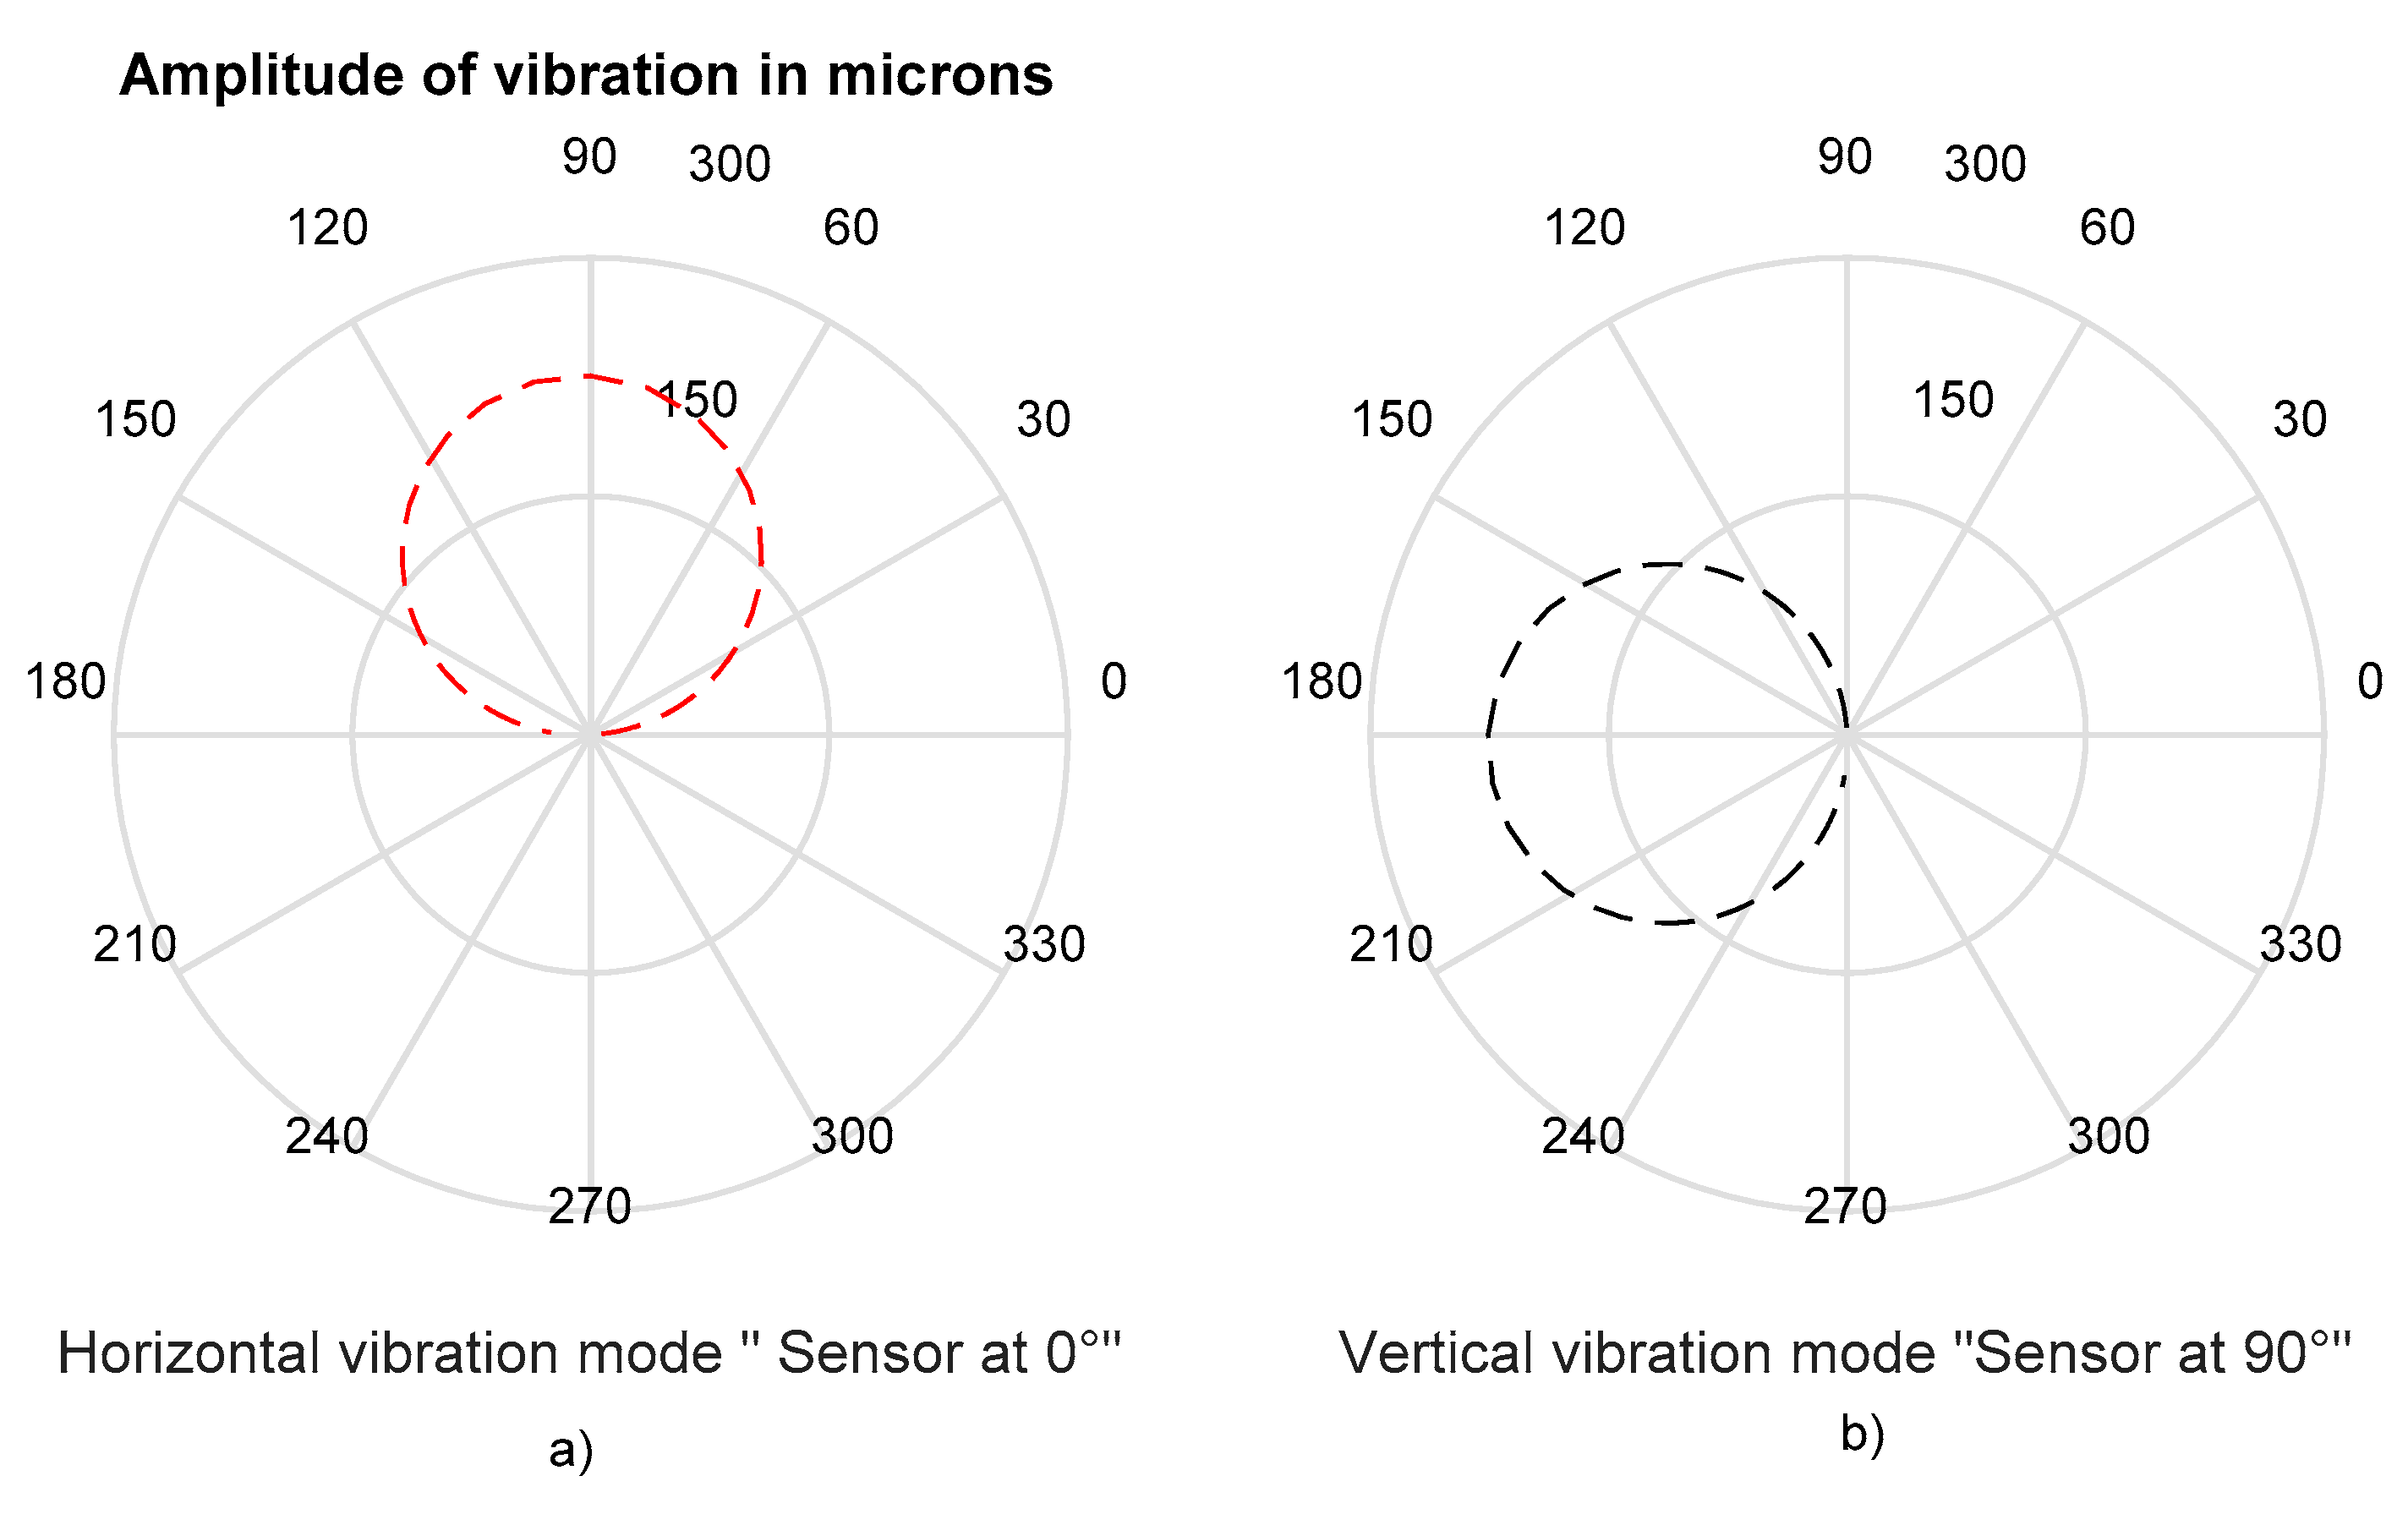
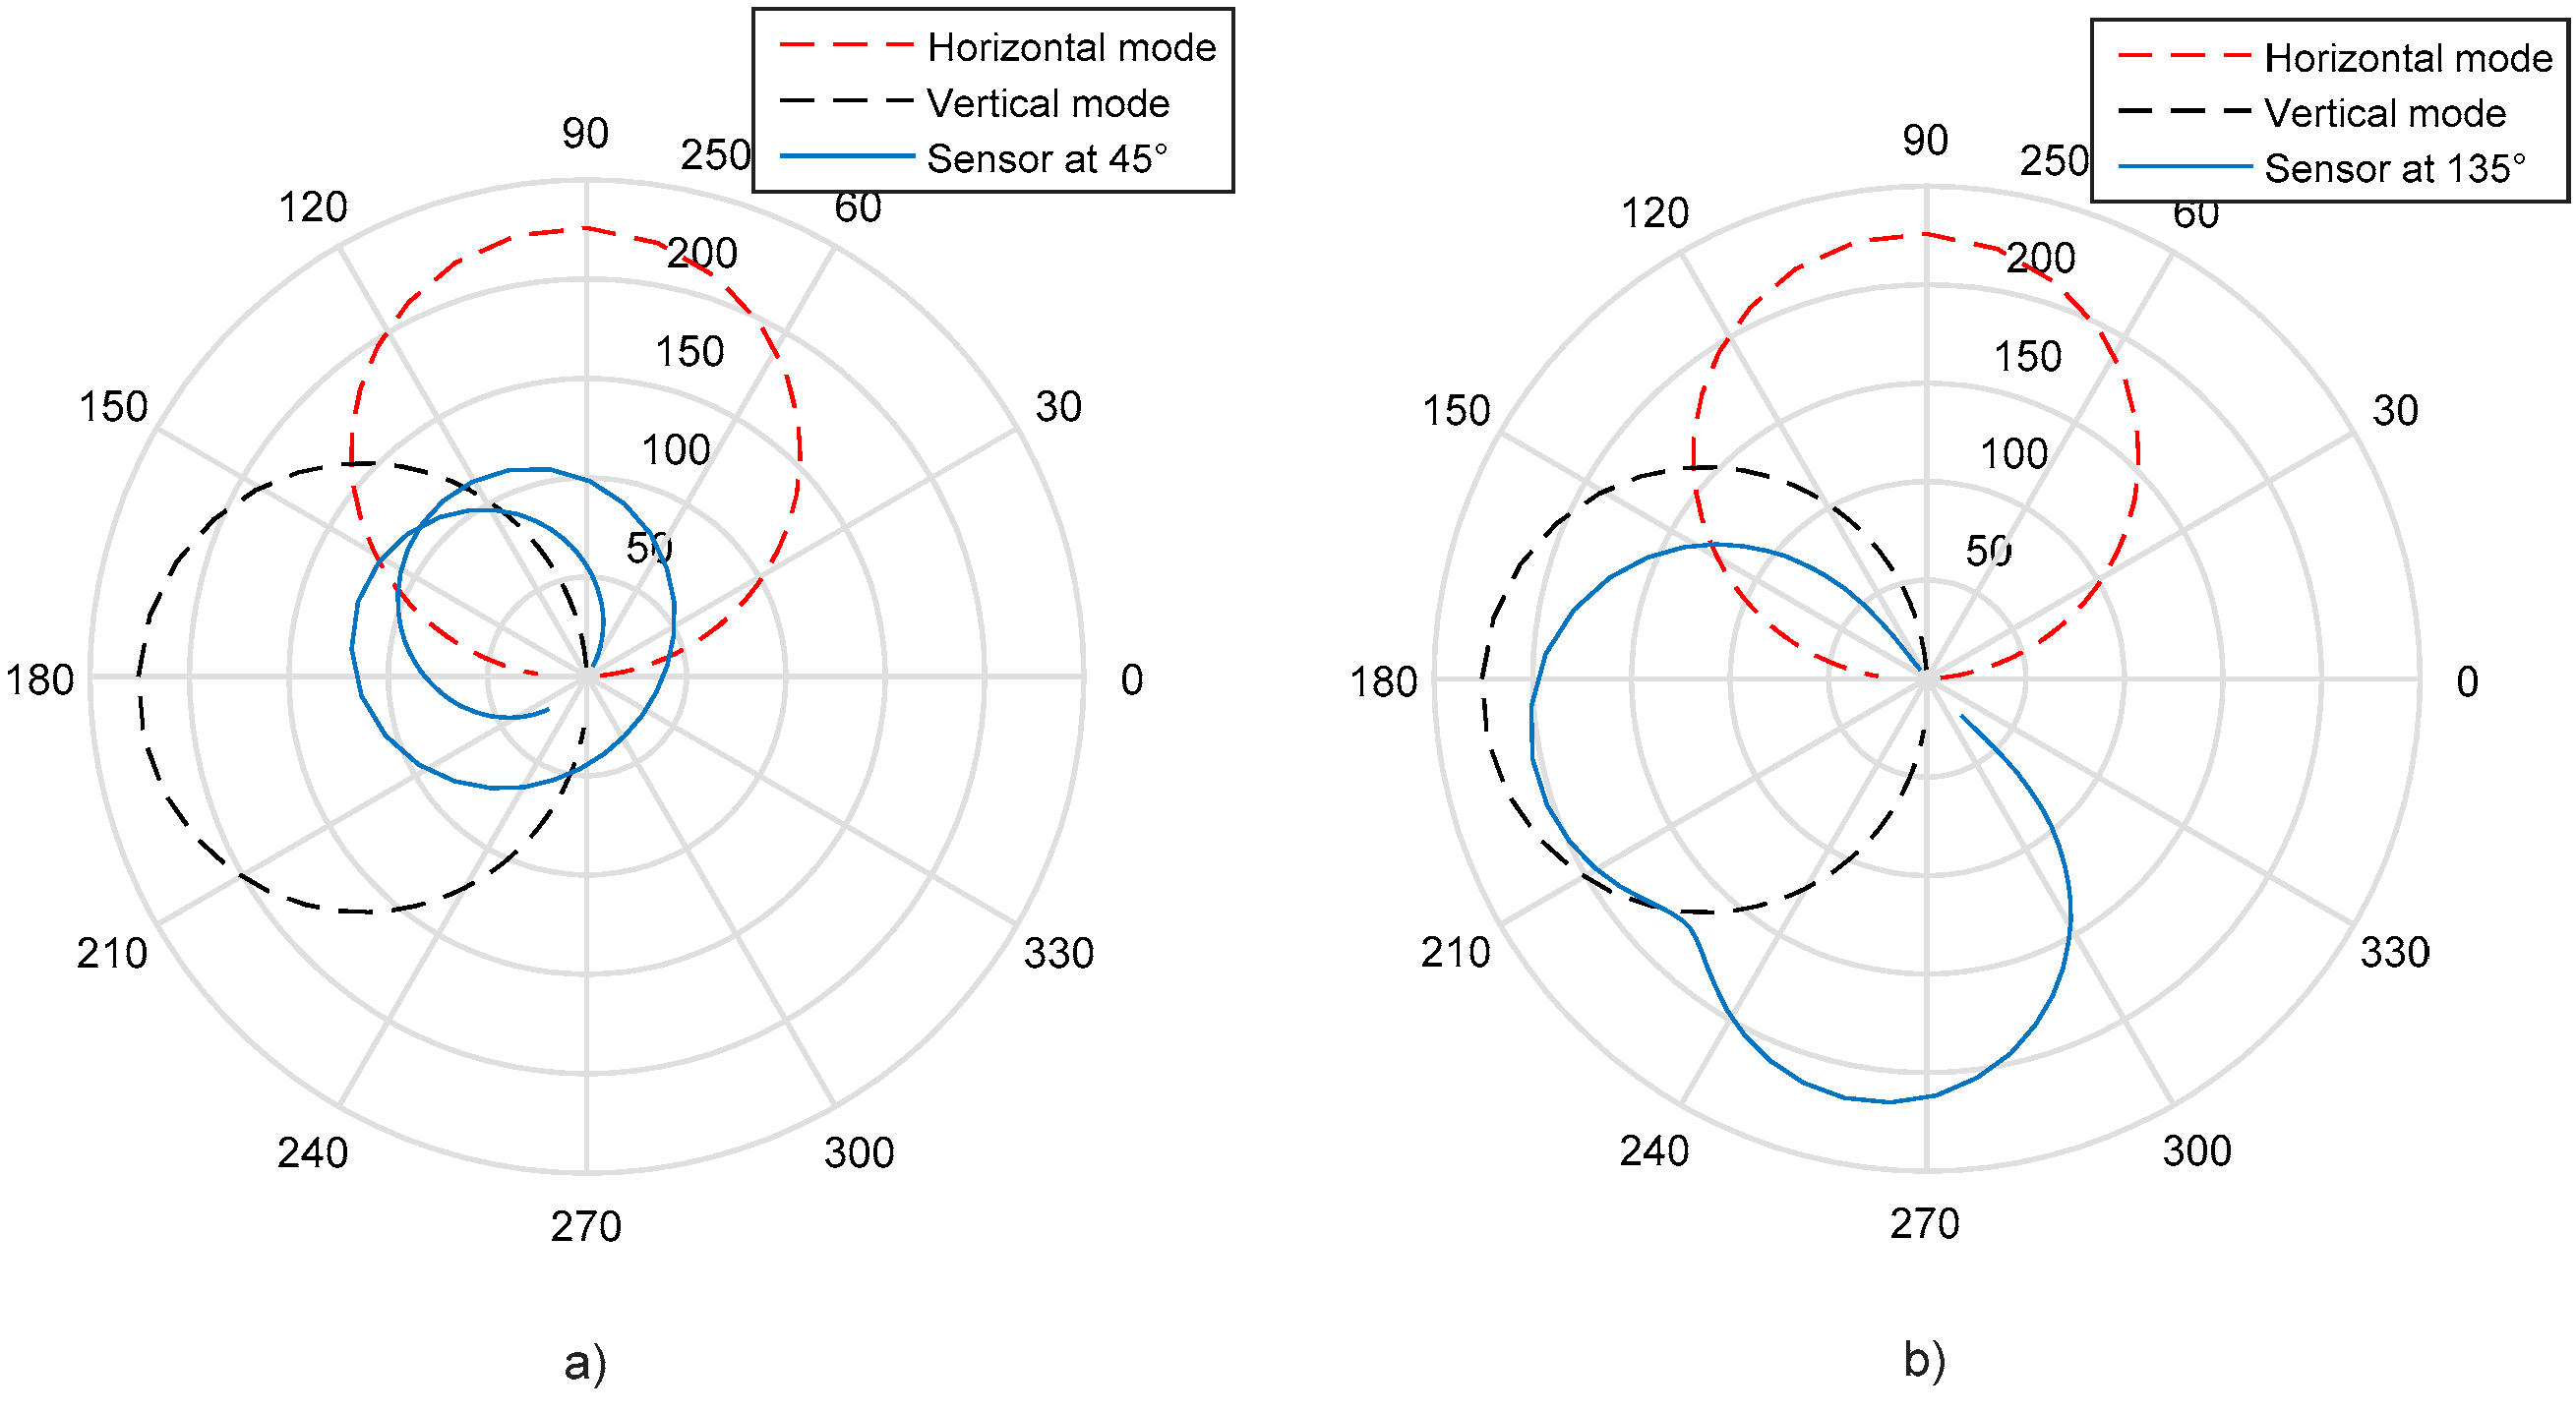
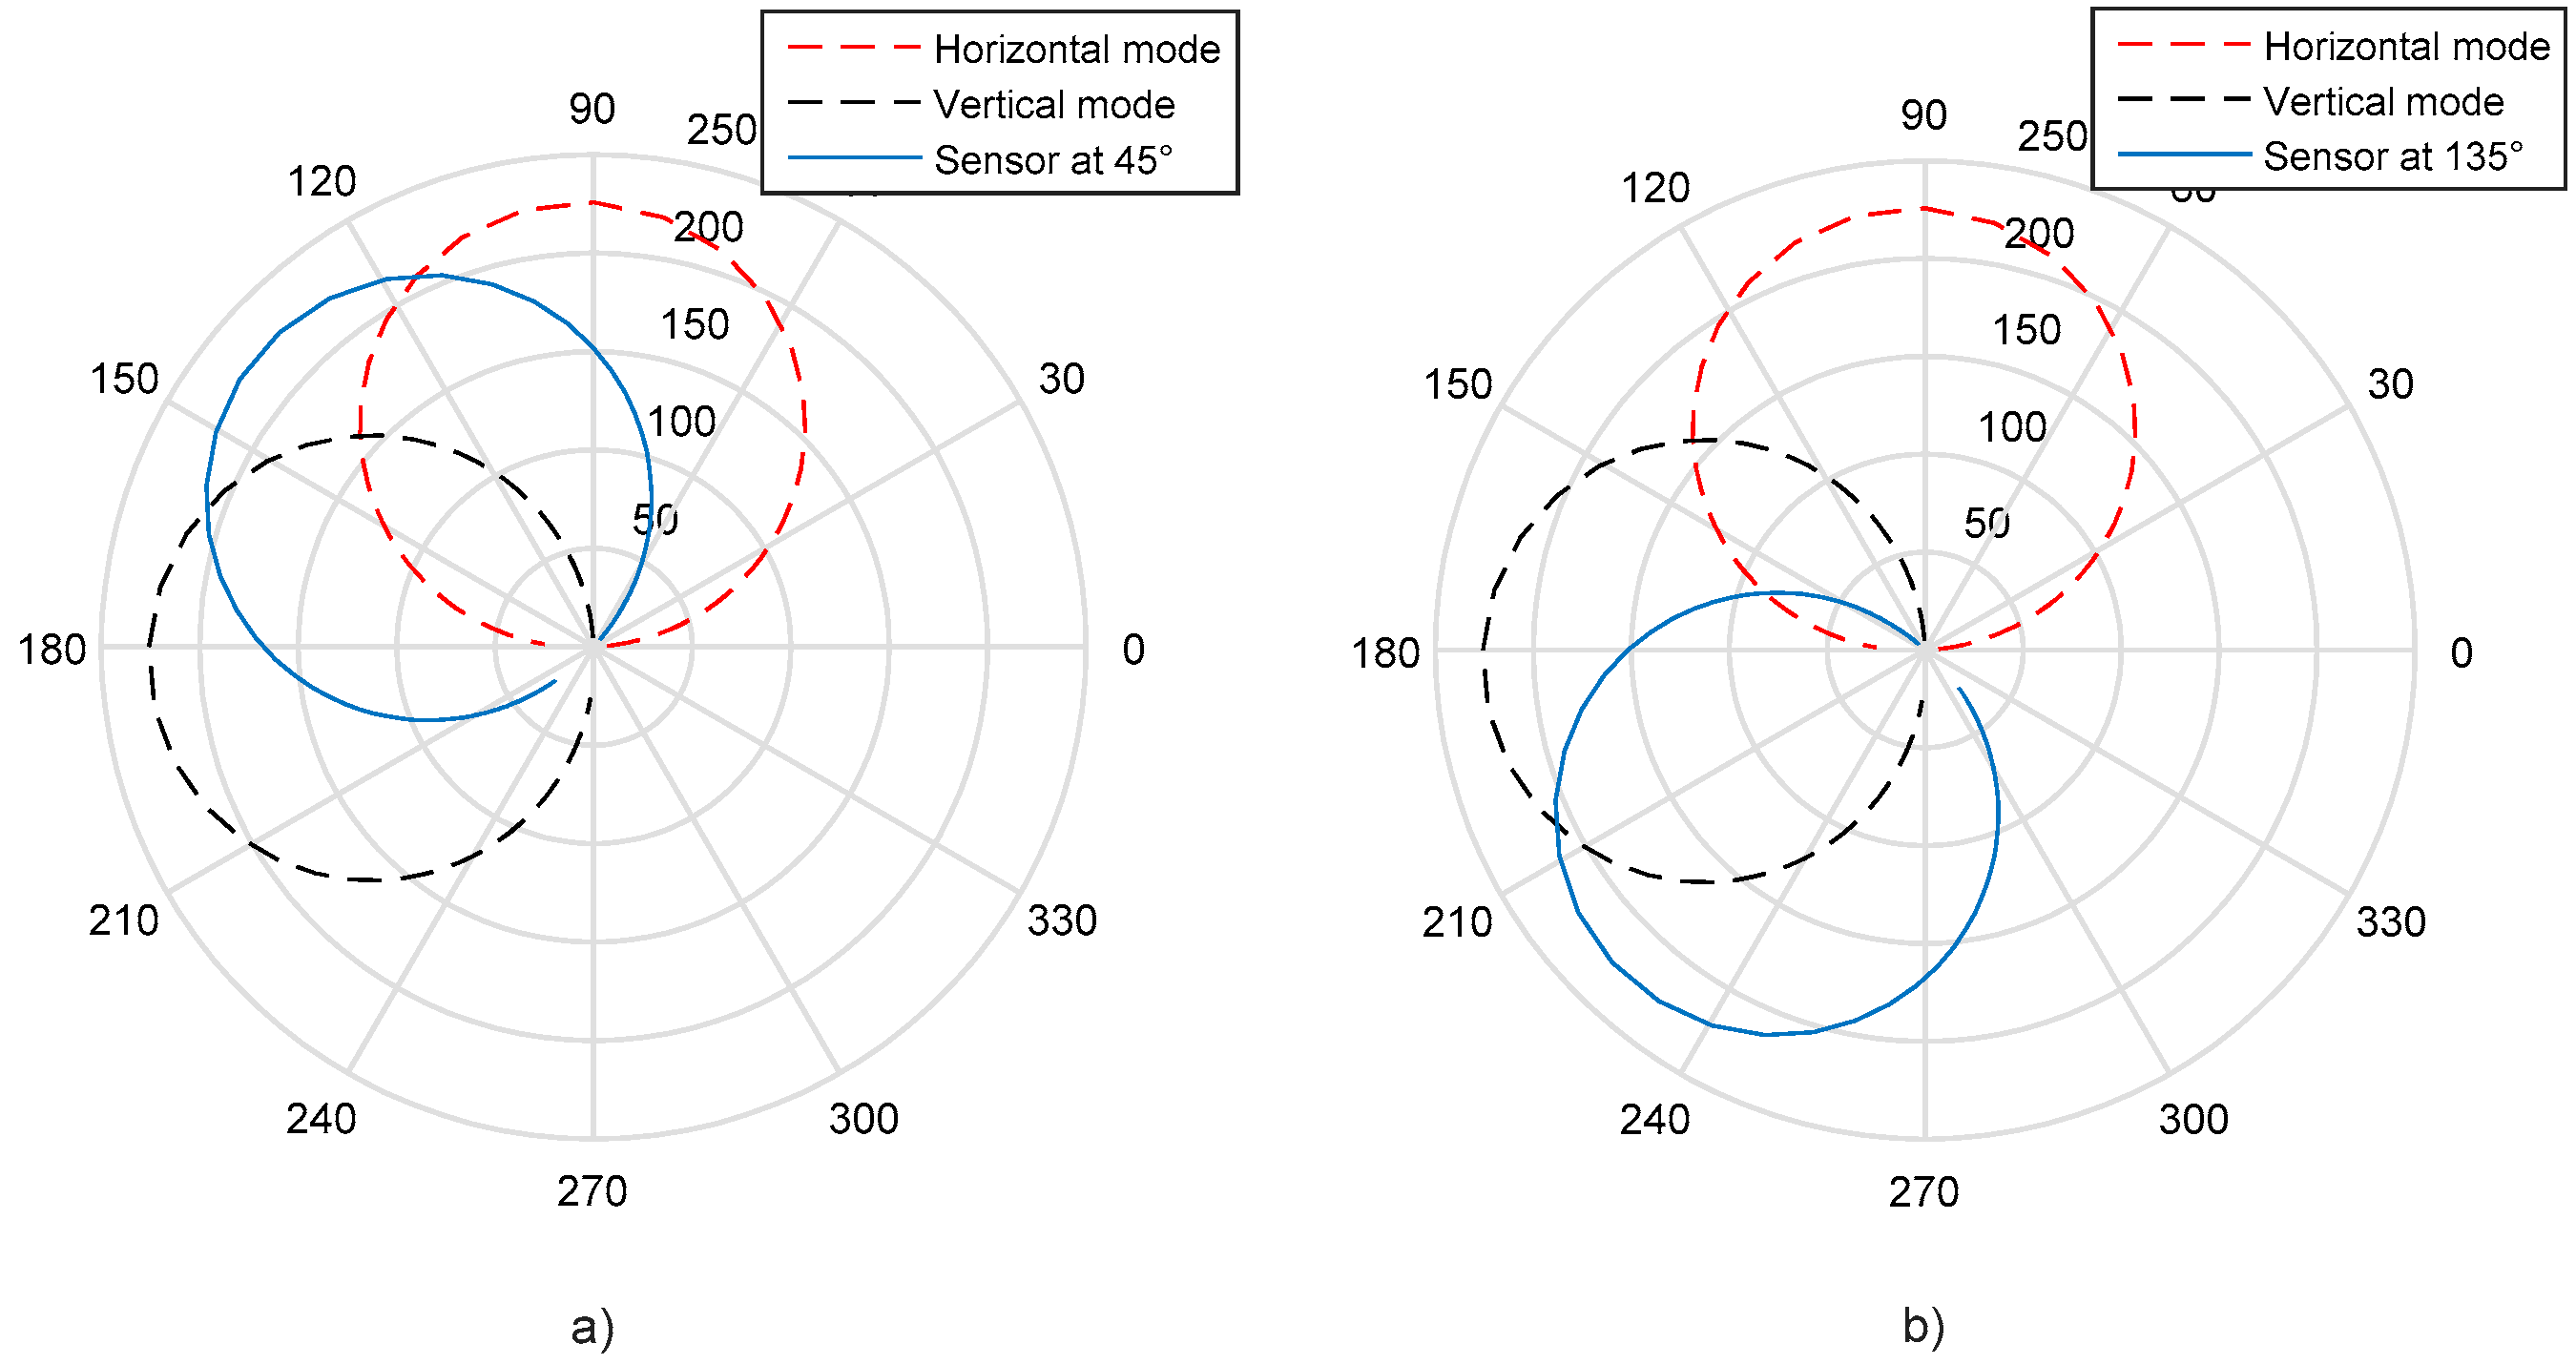
2.2. Signals Coupling Using Imaginary Sensor

The method presented in [3,18] is used to perform the coupling of the two vibration modes shown in Figure 2 through the following equation:
q   =   x s i n ( β   α )   +   x s i n ( α     θ ) s i n ( β     θ ) ,
where
x   =   X c   cos ( ω t )   +   X s   s i n ( ω t ) , x   =   X c   cos ( ω t )   +   X s   s i n ( ω t )
and where α represents the angular position of an imaginary sensor exhibiting the coupling of horizontal and vertical modes; q is the amplitude of vibration of the imaginary sensor given a desired position α ; θ is the angle between the horizontal axis and the direction x , which for the particular case of θ   =   0 ° ; and β is the angle between the horizontal axis and the direction x , which for the particular case of β   =   90 ° .
This can be seen in a simplified image of a bearing, as presented in Figure 3.
In Figure 3, S x is the horizontally placed sensor that detects the rotor’s dynamic response. In the initial case study, S x detected the rotor response generated using Equations (5) and (6), as presented in Figure 2, with the sensor at 0°, while S y is the vertically placed sensor, whose behavior is shown in Figure 2 with the sensor at 90°. Finally, q detects the dynamic response that a sensor would observe physically; however, Equation (7) is a numerical treatment from the coordinate transformation for obtaining the same result.
It is common practice for the vibration sensors installed in the rotating systems in the field to be at 45° and 135°, thus obtaining the coupling of two separate modes, as presented in Figure 4.
The vibration mode pair separated in frequency is clearly visible in Figure 4a. Likewise, for the sensor located at 135°, the presence of two vibration modes is clearly identified, as shown in Figure 4b.
In field balancing processes, it is common to find separate modes, as presented in [16,19,20,21,22], by using Bode diagrams.
For rotating systems, a close mode in frequency can be defined when there is a combination of at least two modes in the polar response diagrams whose natural frequency relationships—ratio to damping, vibration amplitude ratio, and phase angle—are such that only one vibration mode is apparently generated in the overall system response. The problem of close modes is commonly present in structures, leading to intense research to identify these modes, with the aim of monitoring the structure state or identifying problems, as presented in [6,7,8]. However, in these particular systems, the damping ratios are relatively low, ranging from 0.002 to 0.004, as shown in [7]. This complicates the modal parameter identification problem, unlike in rotating systems, where the damping ratios are higher, and the phase angles of each mode can be in any position from 0 to 360°.
However, during the present investigation, no documented cases were found of the balancing process being affected by the presence of close modes in frequency. This may be due primarily to the execution of offline balancing, which makes use of balancing benches that allow restricting the rotor’s movement, thus ensuring that separate modes are obtained. A second possibility may be the small number of rotors that present this problem and that during the field balancing process the objective of reducing vibration levels to the allowed ranges is met by increasing the time and the number of runs. This second theory was presented by INEEL Turbomachinery staff dedicated to performing balancing services in Mexico. However, the high amount time consumed, as well as the need to increase rotor starts and stops to bring it to the desired vibration levels, generates dynamic efforts that reduce the life of the equipment.
These particular cases in rotating systems in the field, in which the polar response diagrams show only one apparent vibration mode, occur when the stiffness values between horizontal and vertical modes tend to be the same. To reproduce this problem, it is assumed from Table 1 that ω n   x   =   ω n   y   =   150.79   rad / s , which generates the following polar response diagrams as is presented in Figure 5:
Figure 5a,b represent the coupled mode with a red dotted line observed by a sensor at 0°, while the black dotted line is observed by a sensor at 90°, and the sensor placed at 45° and 135°, represented in blue, appears to display a single vibration mode. Figure 4 graphically represents the close mode problem in rotors. A methodology for the identification of close modes in structures was presented recently in [14]. The study presented does not consider the effect of the phase angle to perform the identification.
It should be noted that for both the horizontal and vertical mode of Figure 2, Figure 4 and Figure 5, neither does the maximum vibration amplitude in displacement at resonance occur exactly with a delay of 90° of the phase angle, nor is there a perfect circle for the vibration mode. This is an intrinsic behavior of a rotating system when the excitation force is due to imbalance.
In [3], a numerical proposal is presented which ensures agreement between the maximum vibration amplitude and the 90° phase shift of the system response with respect to the excitation force. This technique is used in this article for the analysis presented below.

2.3. Identification of Close Modes in Frequency

For the process of identifying close modes in frequency in rotating systems, the extreme case is proposed, in which the two natural frequencies of the horizontal and vertical mode are equal, as presented in Figure 5. Equation (7) will be applied to generate a 10° scan in different angular positions of the imaginary sensor “ q ” in the range of 0 to 180°, taking the horizontal and vertical vibration modes generated with Equations (5) and (6), respectively. This will generate 19 numerical signals for this particular case, which are denominated synthetic signals in this article.
In order to generalize the methodology for identifying close modes in frequency in rotating systems, “m” synthetic signals will be generated by applying the imaginary sensor equation.
Next, the modal parameters (natural frequency, phase angle, damping ratio, and vibration amplitude in displacement) will be extracted from each of the “m” synthetic signals using the adjustment method presented in [3], by adjusting circles and programming the AMODAL software. An example of the modal parameter extraction for the synthetic signal given at the angular position α   =   20 ° is presented in the Figure 6:
Subsequently, each of the modal parameters is plotted in relation to the variation of the imaginary sensor obtaining the data for each synthetic signal as shown in Figure 6, generating the graphs ω n   v s   α , ϕ Ω   =   1   v s   α , ζ   v s   α , X Ω   =   1   v s   α as shown in the Figure 7.
The Figure 7a–d, allows identification of the close modes problem, where at least two vibration modes are present, is the ϕ Ω   =   1   vs .   α , showing an apparent improvement of the phase angle with respect to each change of the sensor’s angular position.
The previous case is an ideal case; however, a second case study considers a 1.38% separation between the frequency of the horizontal and vertical mode. For this, most parameters shown in Table 1 are considered, now taking into account that ω n   x   =   150.79   rad / s and ω n   y   =   148.70   rad / s . Applying the same steps proposed for the previous case, the following patterns are presented in Figure 8.
For this particular case study, Figure 8c ϕ Ω   =   1   vs .   α again allows identifying the problem of close modes in rotating systems when there is a 1.38% frequency variation. Additionally, a periodic variation in the frequency is presented in Figure 8a ω n   vs .   α , where the maximum and minimum of this variation is close to the natural frequency of each mode.
Finally, the proposed methodology was applied in a field turbogenerator using displacement vibration sensors with a sensitivity of 100 mV g , where from the analysis carried out in each of the eight bearings, bearing number 2 presented patterns of interest for the present investigation in one of the identified modes. Therefore, the polar diagram measured by the rotor instrumentation placed at 45° and 135° is used, as shown in the following Figure 9.
In the previous figure, the red spot at the point is observed at the beginning of the vibration measurement and the equipment’s considerable run-out. The analysis was carried out with the objective of knowing the reason for the excessive vibration in the foundation even with vibration levels within safe limits, according to the ISO 1940 standard. The turbogenerator was found to be working near its second natural frequency, as presented in [18], where separate modes are identified.
Likewise, the above presented procedure was applied to the signals in Figure 8, finding the characteristic pattern corresponding to the presence of close modes in frequency, shown in the following Figure 10:
In Figure 10a–d, the presence of close modes is identified by the pattern shown in Figure 10c α   vs .   ϕ Ω   = 1 by showing an angular variation of the phase angle. This application of the proposed method to a system whose vibration amplitude has a high run-out, as well as being within a safe operating range according to the ISO1940 standard, demonstrates the robustness of the proposed methodology for rotating systems [19,20,21,22,23].

3. Conclusions

The balancing process consists of determining the mass to be placed on the rotor to allow reducing high vibration levels. Commonly used strategies are the modal balancing and influence coefficient methods. These balancing processes are commonly applied offline, mounting the rotor on instrumented balancing benches, where, by significantly reducing horizontal stiffness, the natural frequencies of the rotor in that lateral direction drop, requiring lower rotational speeds (compared to the nominal working speed) for the balancing process and ensuring that the vibration modes are separated. However, the vibration levels obtained on the balancing bench are not necessarily preserved when the rotor is mounted on its bearings and structure due to differences in stiffness. In cases where the vibration level is not in the desired range, the on-site balancing process can continue. It is in these particular situations that it would be possible to present close modes in frequency in the vibration mode pair from the different natural rotor frequencies, where the (polar or Bode) response diagrams used to calculate the modal parameters apparently show only one mode.
The effect of close modes on frequency during the modal balancing or influence coefficient process has been little studied in turbomachinery. In the area of structure, it is a niche that continues to develop because it is a common problem during the dynamic analysis of buildings or bridges, as it is essential to know the modal parameters of natural frequency, damping, and vibration amplitude for each mode. However, during the modal balancing of rotating systems, it is critical to also know the phase angle of the vibration modes, which will allow finding the location of the correction weights. However, because the phase angle of a vibration mode generated by an imbalance force can be in any position from 0 to 360°, identification of close modes is no trivial matter. Therefore, it is important to first develop strategies that allow identifying the presence of close modes in a rotor’s response diagram to later develop tools that allow extracting the modal parameters present. A proposed solution for identifying close modes in rotating systems was proposed in the present research work, where numerical signals (equivalent to the angular movement of a sensor) are generated in different angular positions from two vibration signals placed in a bearing, which presents a variation of the phase angle with respect to sensor movement when obtaining the modal parameters of each signal in the presence of close modes in frequency. The proposed methodology was applied to ideal signals considering two close vibration modes separated by Δ ω   =   0   % and Δ ω   =   1.38   % . Likewise, it was applied to a field turbogenerator’s vibration signals, which showed additional acquisition problems, high runout, and a vibration level within the range permitted by the ISO 1940 standard, identifying the presence of close modes in one of the modes.

Author Contributions

Conceptualization R.A.F.-D.; methodology R.A.F.-D. and P.C.-A.; validation A.d.J.B.-G.; formal analysis R.A.F.-D.; resources P.C.-A.; data curation A.d.J.B.-G.; writing-original draft and preparation R.A.F.-D. and A.d.J.B.-G.; writing-review and editing P.C.-A. and R.A.F.-D.; visualization A.d.J.B.-G.; supervision A.d.J.B.-G.; funding adquisition R.A.F.-D. All authors have read and agreed to the published version of the manuscript.

Funding

This work was supported by the Tecnological Institute in Sonora by the project PROFAPI 2021 and by the Engineering and Technology Deparment.

Institutional Review Board Statement

The study was conducted according to the guidelines of the Declaration of Helsinki, and approved by the Institutional Review Board (or Ethics Committee) of TECNOLOGICAL INSTITUTE IN SONORA. This study not involving humans or animals.

Informed Consent Statement

Informed consent was obtained from all subjects involved in the study.

Data Availability Statement

The data presented in this study are available on request from the corresponding author.

Acknowledgments

We thank Stefan Russi (Sector Technology, METAS) for valuable technical support and Regula Muther (Digitel, Switzerland) for providing us with the drawings of the PM impactors. We also thank Daniel Kalbermatter (Laboratory for Particles and Aerosols, METAS) for performing the EC/OC analysis.

Conflicts of Interest

The authors declare that they have no conflict of interest.

References

  1. Parkinson, A.G.; Jackson, K.L.; Bishop, R.E.D. Some Experiments on the Balancing of Small Flexible Rotors: Part II-Experiments. J. Mech. Eng. Sci. 1963, 5, 133–145. [Google Scholar] [CrossRef]
  2. Delgado, E.P.; Bannister, R.H. Balancing of an Experimental Rotor without Trial Runs. Int. J. Rotating Mach. 2002, 8, 99–108. [Google Scholar] [CrossRef] [Green Version]
  3. Figueroa Díaz, R.A. Técnicas para Extracción de los Parámetros Modales de la Respuesta de Dinámica de un Rotor Desbalan-ceado, Mediante el Giro de un Transductor Hipotético. Ph.D. Thesis, CENIDET Cuernavaca, Morelos, Mexico, 2012. [Google Scholar]
  4. Ewins, D.J. Modal Testing: Theory and Practice; Research Studies Press LTD, 2000; ISBN 0863802184. Available online: https://books.google.com.hk/books?hl=zh-CN&lr=&id=09_zDwAAQBAJ&oi=fnd&pg=PA1&dq=Modal+Testing:+Theory+and+Practice&ots=fu01qWR5Mr&sig=oGWN60WWAXXmBvTrG7qjThKlJfo&redir_esc=y&hl=zh-CN&sourceid=cndr#v=onepage&q&f=false (accessed on 4 October 2021).
  5. Sun, W.; Hou, L.; Sun, M. Close-mode identification based on wavelet scalogram reassignment. In Proceedings of the 24th Conference and Exposition on Structural Dynamics (IMAC-2006), St. Louis, MO, USA, 30 January–2 February 2006. [Google Scholar]
  6. Mottershead, J.E.; Mares, C.; James, S. Separation of close modes in axisymmetric structures. In Proceedings of the International Modal Analysis Conference: Proceedings of IMAC-XX, Los Angeles, CA, USA, 4–6 February 2002; pp. 1452–1457. [Google Scholar]
  7. Malekjafarian, A.; Brincker, R.; Ashory, M.; Khatibi, M. Identification of close spaced modes using Ibrahim Time Domain method. In Proceedings of the International Operational Modal Analysis Conference IOMAC’11, Istanbul, Turkey, 9–11 May 2011; pp. 120–126. [Google Scholar]
  8. Feng, X.; Zhou, J. Identification of Modal Parameters for Close-Mode Structures with Output-Only Data. Earth Space 2006, 1–8. [Google Scholar] [CrossRef]
  9. Liu, X.; Hu, J. Low order vibration control for structures with highly correlated close modes. Sci. China Ser. E Technol. Sci. 2011, 54, 1855–1864. [Google Scholar] [CrossRef]
  10. Brincker, R.; López-Aenlle, M. Mode shape sensitivity of two closely spaced eigenvalues. J. Sound Vib. 2015, 334, 377–387. [Google Scholar] [CrossRef]
  11. Kim, Y.S.; Chen, L.-Q. Separation of closely spaced modes by combining complex envelope displacement analysis with method of generating intrinsic mode functions through filtering algorithm based on wavelet packet decomposition. Appl. Math. Mech. 2013, 34, 801–810. [Google Scholar] [CrossRef]
  12. Au, S.-K.; Brownjohn, J. Asymptotic identification uncertainty of close modes in Bayesian operational modal analysis. Mech. Syst. Signal Process. 2019, 133. [Google Scholar] [CrossRef]
  13. Gutierrez, W.E.; Vélez, C.G.; Szwedowicz, W.D.; Bedolla, H.J.; Cortés, G.C. Identification of close vibration modes of a quasi-axisymmetric structure: Complementary study. Ing. Investig. Tecnol. 2013, 14, 207–222. [Google Scholar]
  14. Au, S.-K.; Brownjohn, J.M.; Li, B.; Raby, A. Understanding and managing identification uncertainty of close modes in operational modal analysis. Mech. Syst. Signal Process. 2021, 147, 107018. [Google Scholar] [CrossRef]
  15. Muszynska, A.; Bently, D.E. Measurement of rotor system dynamic stiffness by perturbation testing. In Proceedings of the Symposium on Instability in Rotating Machinery, Carson City, NV, USA, 10 June 1985; pp. 47–58. [Google Scholar]
  16. Alsaleh, A.; Ouakad, H. Analysis of lateral vibrations of an unbalanced Jeffcott rotor. In Proceedings of the 14th International Conference on Vibration Engineering and Technology of Machinery (VETOMAC XIV), Lisbon, Portugal, 10–13 September 2018. [Google Scholar]
  17. Díaz, R.A.F.; Sarellano, M.H.; Alcantar, P.C.; Verduzco, I.M. Dynamic response in non-perpendicular stiff main directional rotors using coordinate transformation. J. Braz. Soc. Mech. Sci. Eng. 2015, 37, 1615–1622. [Google Scholar] [CrossRef]
  18. Díaz, R.A.F.; Romano, J.E.A.; García, A.B.; Alcantar, P.C. Methodology to improve mode identification and modal parameter extraction for rotor dynamic analysis. J. Vibroeng. 2017, 19, 2806–2821. [Google Scholar] [CrossRef] [Green Version]
  19. Deng, W.; Tong, M.; Zheng, Q.; Ren, X.; Yang, Y. Investigation on transient dynamic balancing of the power turbine rotor and its application. Adv. Mech. Eng. 2021, 13, 16878140211007325. [Google Scholar] [CrossRef]
  20. Gunter, E.J.; Barrett, L.E.; Allaire, P.E. Balancing of Multimass Flexible Rotors; Texas A&M University, Gas Turbine Laboratories: College Station, TX, USA, 1976; Available online: https://hdl.handle.net/1969.1/163821 (accessed on 4 October 2021).
  21. Vance, J.M.; Murphy, B.; Tripp, H. Critical Speeds of Turbomachinery: Computer Predictions vs. Experimental Measurements; Texas A&M University, Turbomachinery Laboratories: College Station, TX, USA, 1984; Available online: https://hdl.handle.net/1969.1/163651 (accessed on 4 October 2021).
  22. Maxwell, A.S.; Sanderson, A.F.P. Site Balancing of a Large Flexible Rotor Containing Unbalance Eccentricity and Permanent Residual Bow; Texas A&M University, Gas Turbine Laboratories: College Station, TX, USA, 1976; Available online: https://hdl.handle.net/1969.1/163824 (accessed on 4 October 2021).
  23. Figueroa Díaz, R.A.; Aguirre Romano, J.E.; Cruz Alcantar, P.; Murillo Verduzco, I.; Sarellano, M.H. Application of coordinate transformation for detection of vibration modes: A comparative study in 2 turbogenerators. J. Vibroeng. 2015, 17, 2108–2120. [Google Scholar]
Figure 1. Simplified model of a 1-DOF system with a force due to imbalance.
Applsci 11 09963 g001
Figure 2. Decoupled vibration modes using 1-DOF Systems by (a) horizontal and (b) vertical directions.
Applsci 11 09963 g002
Figure 3. Simplified diagram of a bearing with mounted sensors.
Applsci 11 09963 g003
Figure 4. Coupling of 2 DOF vibration modes for a sensor position at (a) 45° and (b) 135°.
Applsci 11 09963 g004
Figure 5. Polar diagram with close modes at (a) 45° and (b) 135° ( μ m ) .
Applsci 11 09963 g005
Figure 6. Adjusted modal parameters when an imaginary sensor has an angular position of 20°.
Applsci 11 09963 g006
Figure 7. Characteristic patterns of close modes in frequency considering Δ ω   =   0 % for (a) natural frequency, (b) damping ratio, (c) phase angle and (d) vibration amplitude at resonance.
Applsci 11 09963 g007
Figure 8. Characteristic patterns of close modes in frequency considering Δ ω   =   1.38 % for (a) natural frequency, (b) damping ratio, (c) phase angle and (d) vibration amplitude at resonance.
Applsci 11 09963 g008
Figure 9. Polar diagram at (a) 45° and (b) 135° in bearing 2 of turbogenerator field ( μ m ) .
Applsci 11 09963 g009
Figure 10. Identification of close modes in bearing 2 in field turbogenerator for (a) natural frequency, (b) damping ratio, (c) phase angle and (d) vibration amplitude at resonance.
Applsci 11 09963 g010
Table 1. Parameters for modeling the first vibration mode pair.
ParameterQuantity
Modal mass of the first mode ( M   M r )55,337.11 (kg)
Horizontal mode natural circular frequency ( ω n   x )159.79 (rad/s)
Horizontal mode damping ratio ( ζ r   x )0.05
Vertical mode natural circular frequency ( ω n   y )129.85 (rad/s)
Vertical mode damping ratio ( ζ r   y )0.05
Imbalance mass ( m j )2 to 0° (kg)
Imbalance mass placement radius ( R ) 0.45 (m)
Angular velocity ( ω ) 0–188.49 (rad/s)
Publisher’s Note: MDPI stays neutral with regard to jurisdictional claims in published maps and institutional affiliations.

