1. Introduction
Dry soil mixing (DSM) is a kind of ground improvement method, in which binder is delivered to the ground and mixed with soil. The DSM process employs mechanical mixing energy with a specifically-designed tool—stirring and blending the soil to distribute the binder as uniformly as possible. The chemical reactions between soil and binder improve the strength, permeability, dynamic stiffness, and deformation properties of the soil [
1,
2,
3]. The origin of the DSM method dates back to an original patent filed in 1967, but the field application really developed in the 1970s. In the 1960s, concurrent studies were conducted in Sweden, Japan, and Finland to investigate laboratory performance to offer direction for field applications [
1,
4,
5]. From the mid-1980s to the late 1990s, there was a large uptake in the use of dry soil mixing, specifically in Europe, North America, and Japan [
6,
7,
8]. DSM was introduced into China in 1983, and it was first used for soft soil foundation treatment for railway tracks. After that, DSM was widely used for soft soil foundation improvement in China. So far, DSM has been used worldwide in railway engineering, highway building, municipal engineering, port and wharf projects, riverbank projects, and industrial and civil buildings [
4,
5,
7,
9,
10,
11,
12].
Since DSM was first applied, it has been critical to ensure its engineering quality. Druss [
13] summarized the guidelines for the design and installation of DSM columns. Liu et al. [
14] and Zhang et al. [
3] combined the DSM method with prefabricated vertical drains to enhance DSM column quality in deeper soft clay. Gunther [
15] developed a modified dry mixing method that injected water into the soil during the installation process. By adjusting the water content of the soil, columns of significant strength can be produced, resulting in more homogeneous columns of high quality. The geological conditions were the key to controlling the quality of the DSM columns. Cases of field applications of dry soil mixing in different soils are shown in
Table 1.
Evaluation of soil mixing in the field and in the laboratory has been done before by many researchers [
16,
17,
18,
19,
20,
21,
22,
23,
24,
25]. A quality assessment typically includes post construction instrumentation and monitoring, in situ tests, and laboratory tests on field core samples. Liu et al. [
26] used a standard penetration test to evaluate and control the quality of DSM columns. Puppala [
27] presented the results of an international survey conducted for the quality assessment of deep mixed columns. Concerning the number of columns to be tested for QA evaluations, the survey showed that the majority of the respondents recommended the use of 1 out of every 100 columns for quality assessments. Spross [
28] proposed a reliability-based analytical design of DSM columns. Terashi [
5] highlighted that the visual inspection of a core sample was very much important. Ngo et al. [
29] used artificial intelligence to predict the strength of soil-cement.
However, the structural behavior and quality of the DSM columns are difficult to predict, due to the existence of considerable uncertainties during the DSM process and the variability in geological conditions. This paper proposes an effective quality assessment method for comprehensive evaluation of the DSM columns. The quality assessment method is introduced first; then the statistical analysis, laboratory test results, and field test results are presented. The quality assessment results of the DSM columns in different soft soil areas and the distribution of quality level are also discussed.
2. Ground Conditions and DSM Construction Method
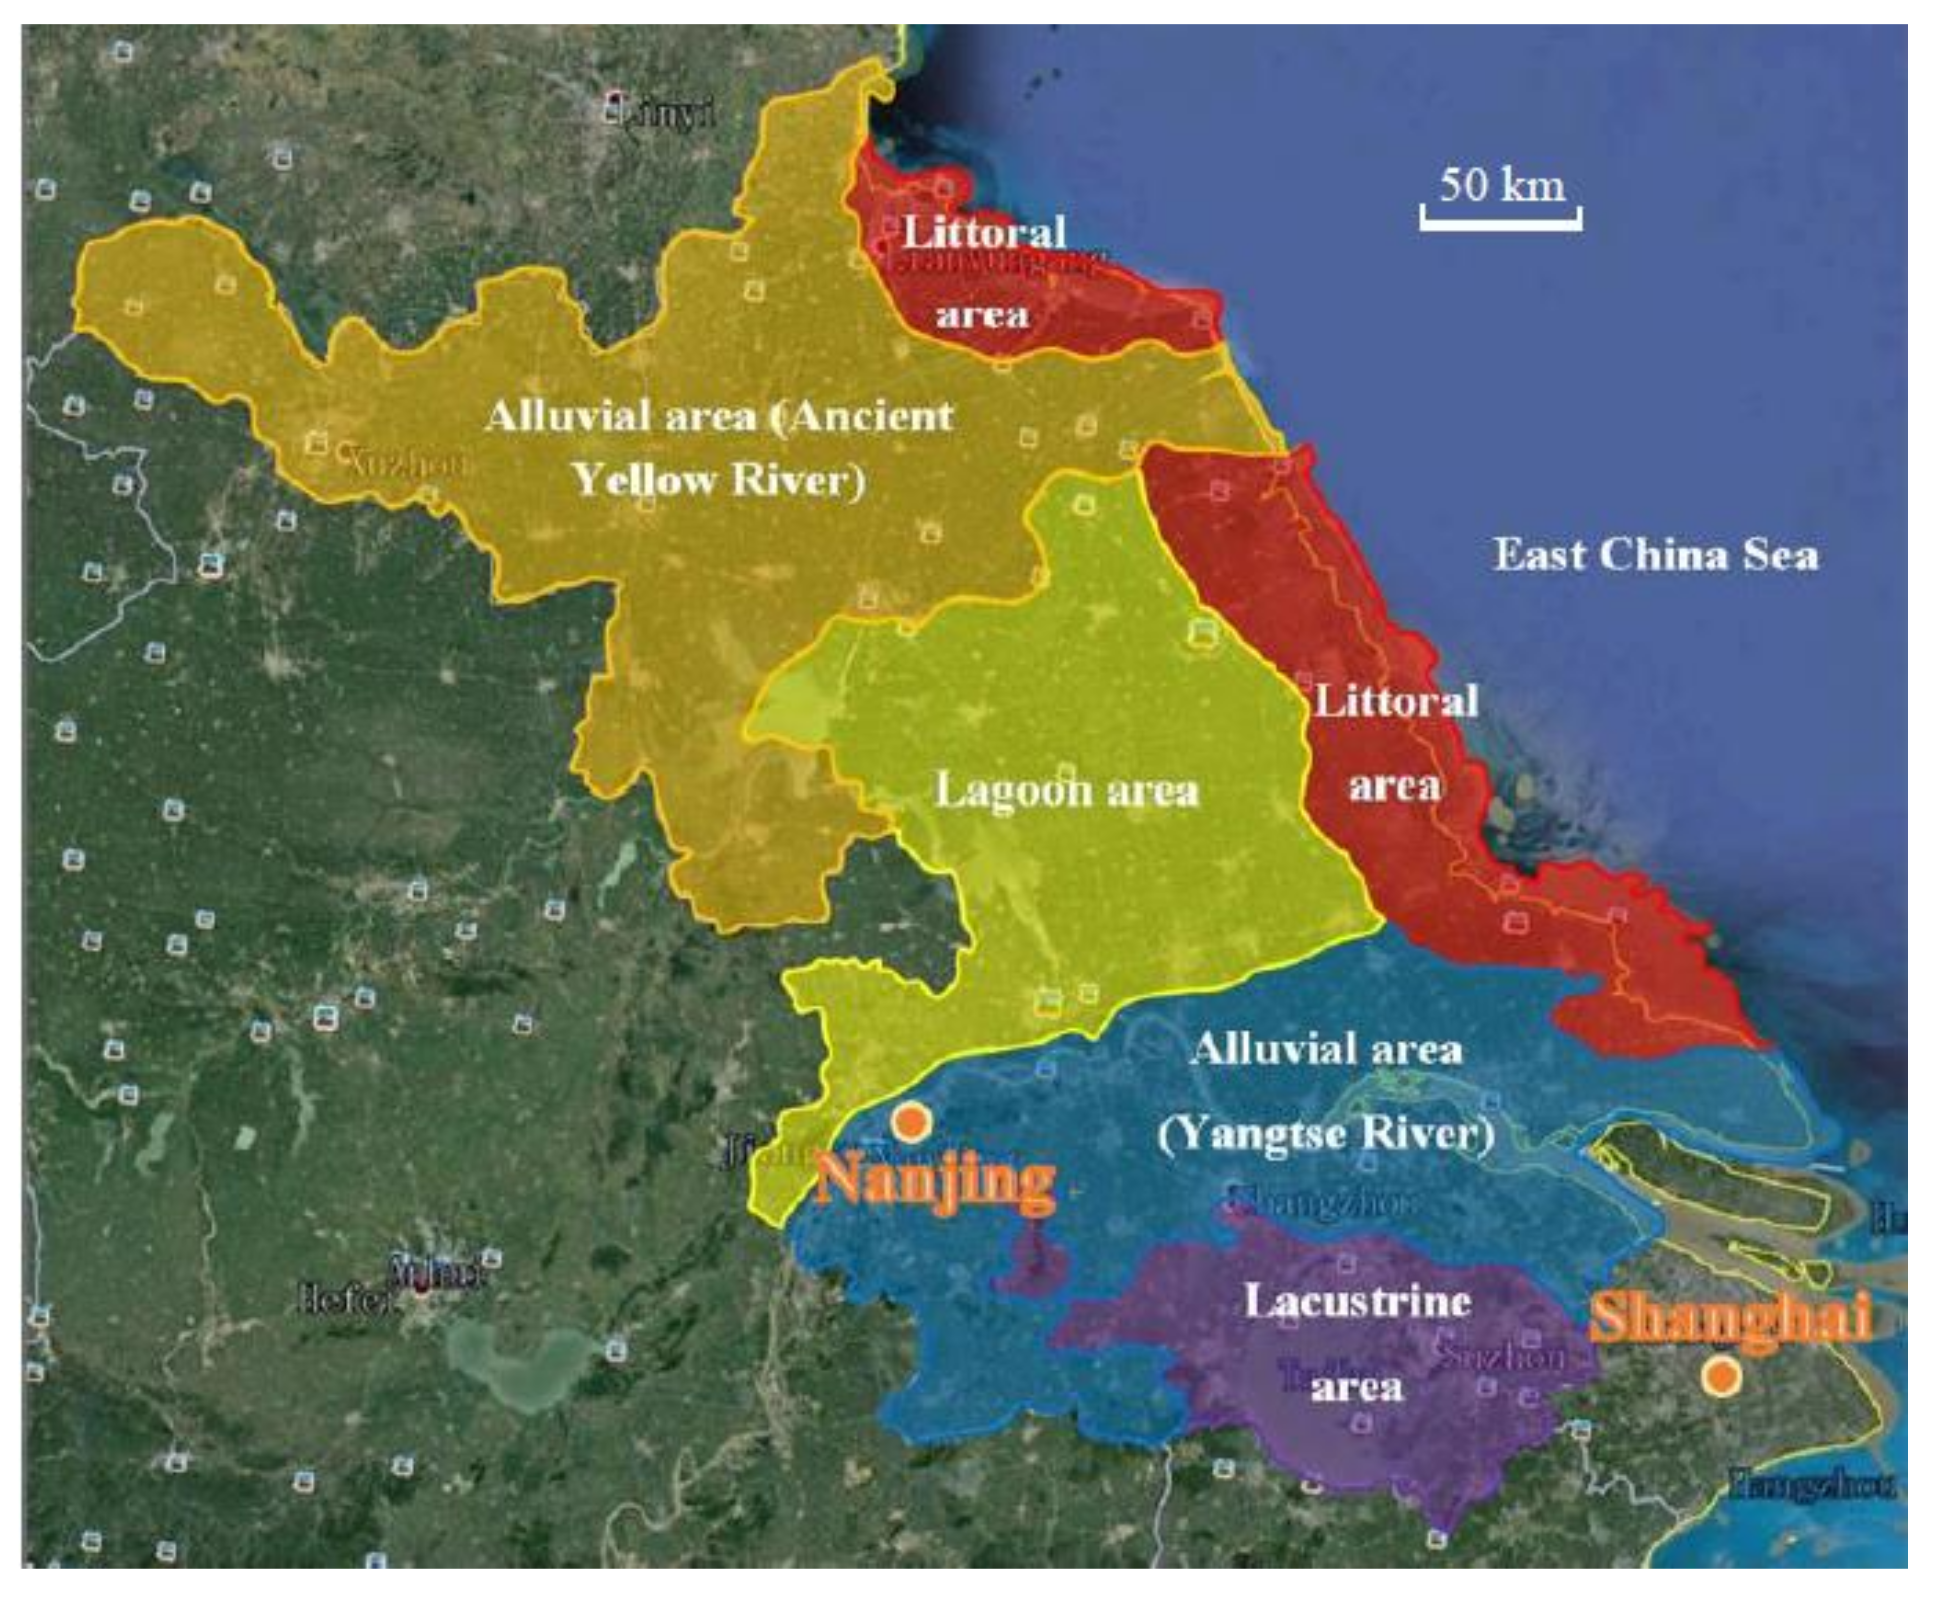
The data in this paper are from the test results of improving highway foundations with DSM in a soft soil area of Jiangsu Province, China. According to the origins of the deposited soft soil and its regional spatial distribution, the soft soil area in the present study was divided into five categories (see
Figure 1). Engineering properties of the soft soil are shown in
Table 2.
The soil-cement columns in the data source area were installed via. DSM method, the binder was dry cement powder, and the same construction equipment was used in all soft soil areas. The 28-day design strength of the soil-cement columns of the study area was 0.5 MPa. The cement content was determined by design strength and the engineering properties of the on-site soil.
3. Quality Assessments Method
The proposed quality assessment method herein includes four assessment indexes: the hardness description, a standard penetration test, unconfined compressive strength, and soil-cement column quality designation. The test method for each assessment index is as follows.
3.1. Hardness Description (HD)
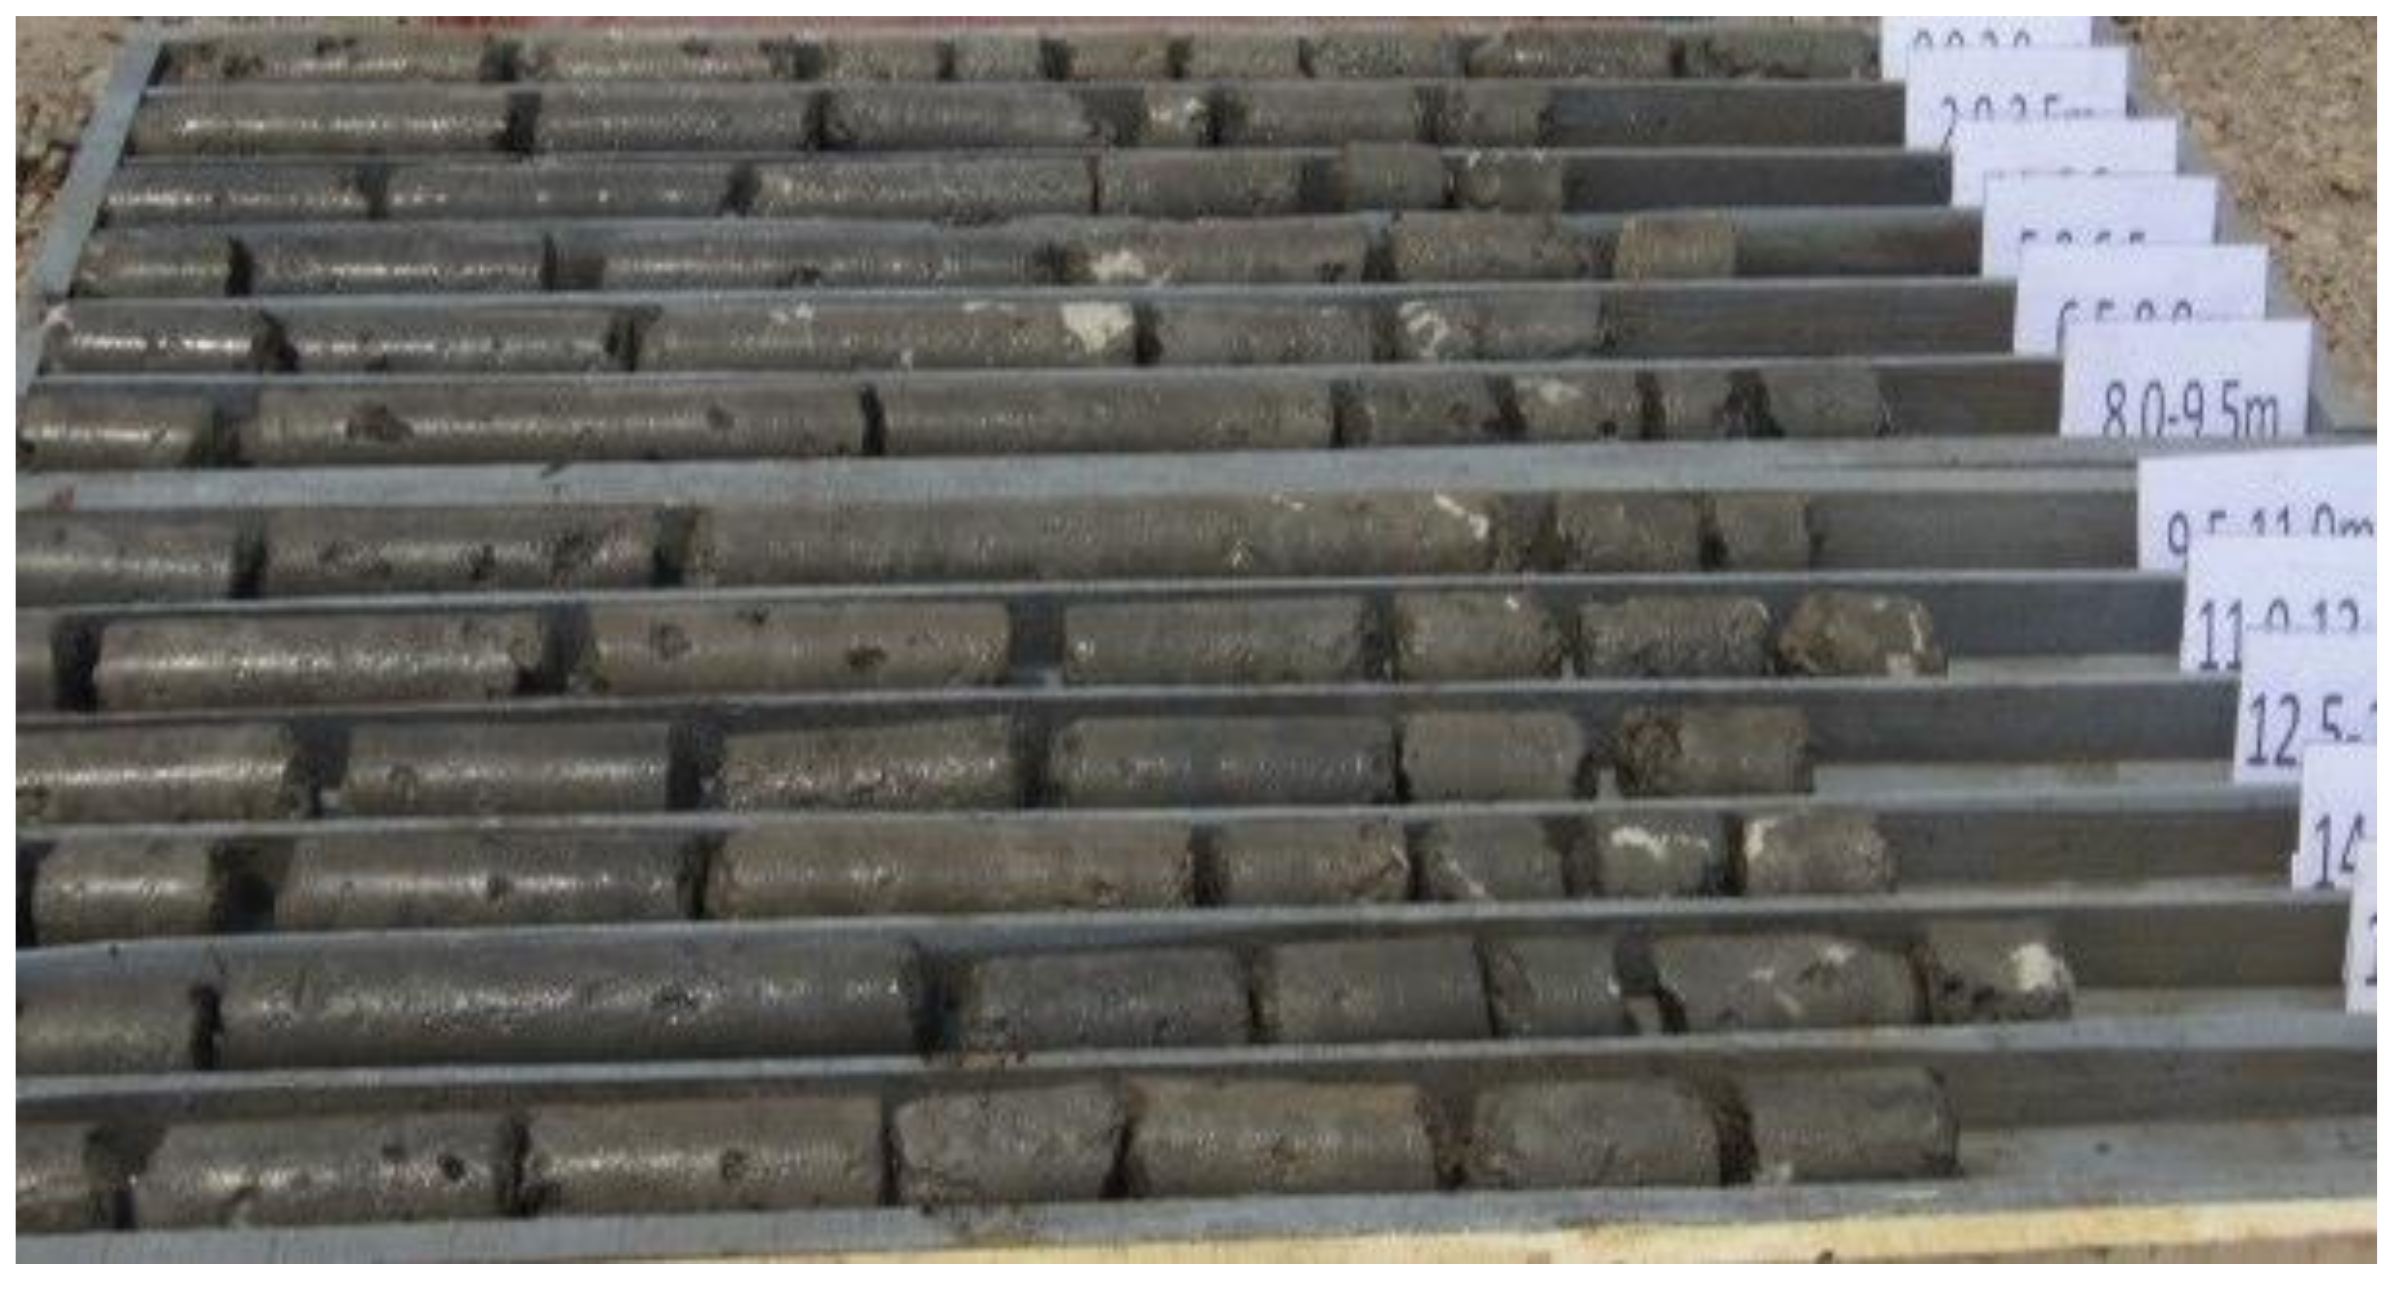
The tested column was drilled and sampled by a 108 mm drill. The soil-cement core was placed neatly (see
Figure 2) after drilling and its hardness was described immediately. The hardness description of on-site soil-cement core is shown in
Table 3.
3.2. Standard Penetration Test (SPT)
The SPT was carried out on soil-cement columns 28 days of age. The SPT was divided into two stages: (1) Pre-penetration stage: We penetrated the drill rod 15 cm into the soil and recorded the blow count. If the blow count reached 30 and the penetration depth of the rod did not reach 15 cm, we recorded the actual penetration depth. (2) Test stage: We recorded the blow count of 30 cm rod penetration. If the blow count was 30 and the penetration depth of rod did not reach 30 cm, we recorded the actual penetration depth. In this case, the equivalent blow count was calculated by Equation (1) [
32]:
where
N is blow count; Δ
S is actual penetration depth.
However, owing to frictional losses, the actual blow count of SPT should be corrected by the correction coefficient of rod length as in Equation (2) [
32]:
where
N′ is the corrected blow count and
is the correction coefficient of rod length, which is shown in
Table 4.
When the age of the tested column exceeds 28 days, the blow count of SPT at 28 days was calculated by the following equation.
where
is the blow count at 28 days;
is the age of the soil-cement column. When the age is greater than 58 days,
a = 58.
3.3. Unconfined Compressive Strength (UCS)
At least three core samples of unconfined compression test were taken from each tested column, and the core samples were drilled from the upper, middle, and lower parts of each column. The unconfined compressive strength of the 28-day-old soil-cement was calculated using the following equation [
32].
where
R is UCS (MPa);
P (N) is the failure load of the specimen;
A (mm
2) is the cross-sectional area of the specimen.
The UCS was modified for specimens of different sizes with the following equation [
32].
where
R’ is the modified UCS;
β is correction coefficient of specimen size shown in
Table 5.
When the age of the tested column exceeded 28 days, the UCS at 28 days was calculated using the following equation.
where
is UCS at 28 days;
is the age of the soil-cement column. When the age is greater than 78 days,
a = 78.
3.4. Soil-Cement Column Quality Designation (SCQD)
SCQD was used to evaluate the integrity of the soil-cement column.
where SCQD is the modified soil-cement core drilling rate;
is the length of the core segment greater than or equal to 7 cm;
is drilling length.
3.5. The Quality Assessment Method for DSM Columns
The DSM column was divided into upper and lower parts at a depth of 5 m. The scoring rules of each index are shown in
Table 6. The score was calculated by interpolation when the index value was between two values in
Table 4. The indexes scored by rules of the upper part when the length of the soil-cement column was less than 5 m.
The evaluation method takes the SPT result as the main indicator. The SPT, UCS, HD, and SCQD account for 70%, 15%, 10%, and 5% of the total score, respectively. The total scores are calculated as follows.
When without the test results of UCS, the total scores are calculated as follows.
where
is the total score of the whole soil-cement column;
and
are the total scores of upper and lower parts of the soil-cement column, respectively.
is the score of HD;
is the score of SPT;
is the score of UCS;
is the score of SCQD.
The quality of DSM columns was divided into four grades according to the comprehensive scores: great (90 ≤ ≤ 100), good (80 ≤ < 90), general (67.5 ≤ < 80), and unqualified ( < 67.5). Additionally, the assessment result was unqualified when < 75, or < 60.
4. Results of Quality Assessments
4.1. Results of SPT
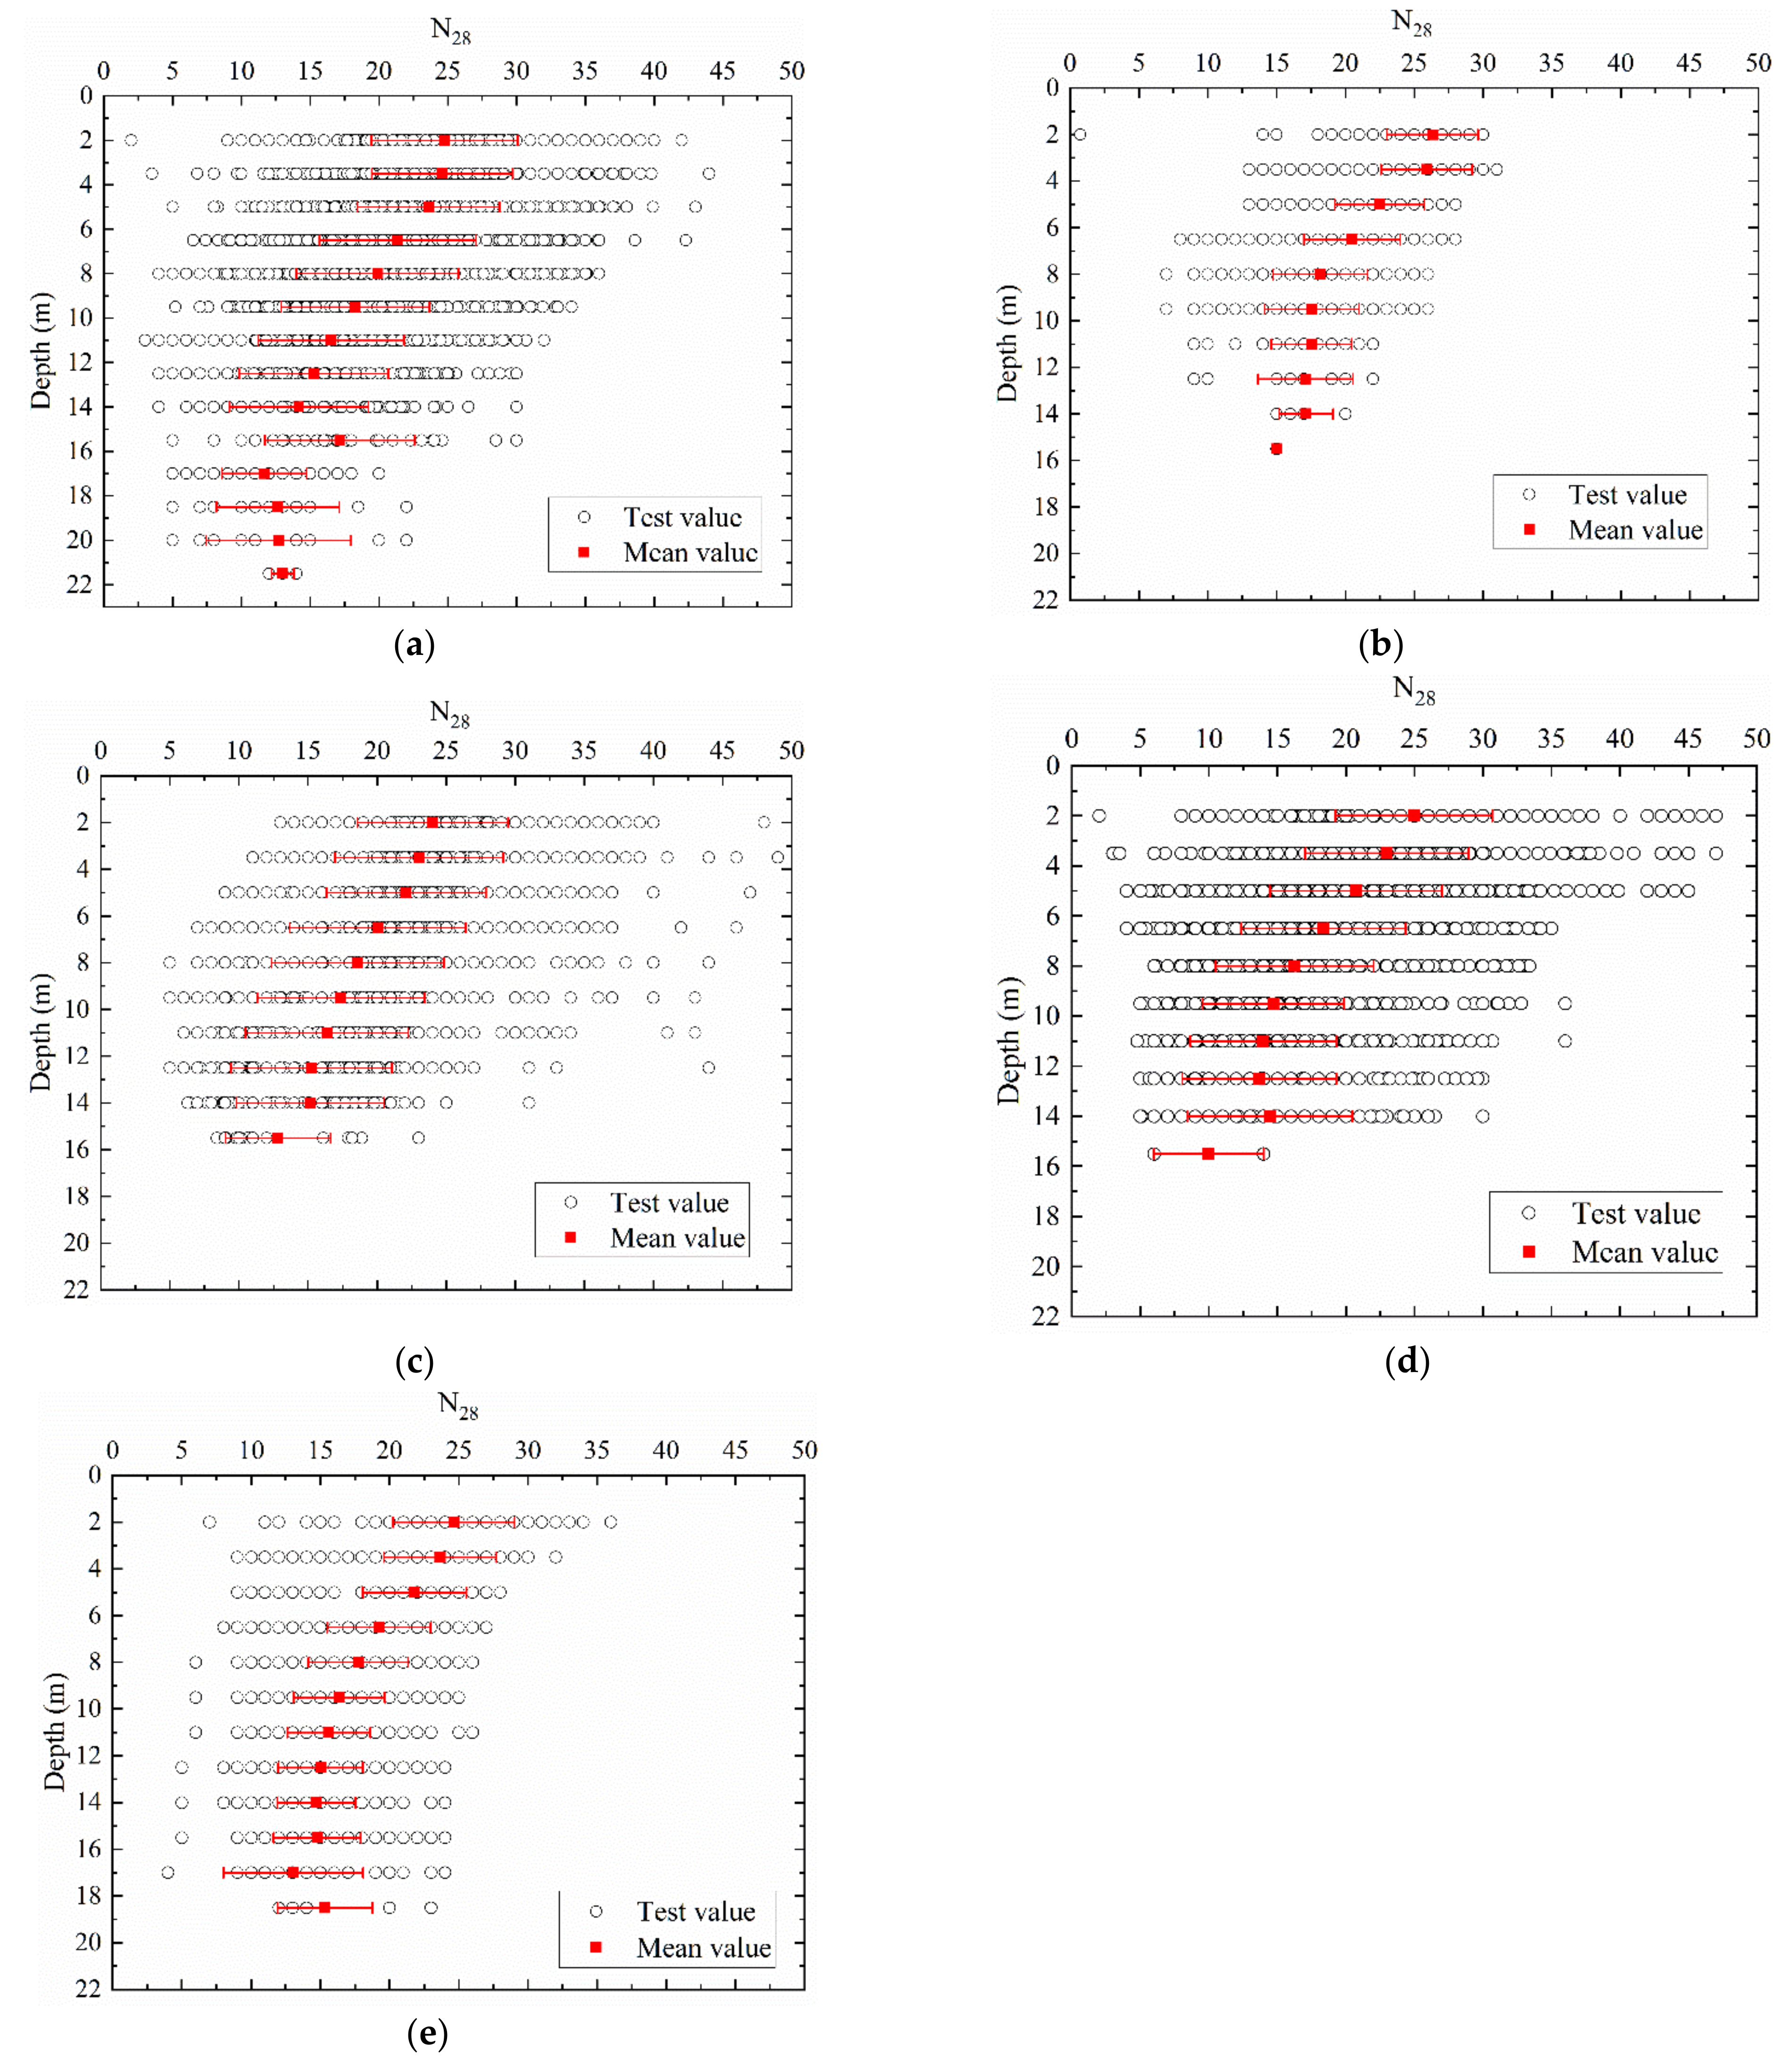
The SPT results of DSM columns are shown in
Figure 3. Prior to SPT, the DSM columns were allowed to cure on site for at least 28 days. The black hollow dots represent the statistical data of test results. The solid red square dots and red bars represent the mean values and standard deviations of statistical data. The SPT blow counts of DSM columns were widely scattered, particularly in shallow ground, which indicates that the quality of DSM columns varied greatly. The SPT blow counts in the littoral soft soil area, alluvial soft soil (Ancient Yellow River) area, and alluvial soft soil (Yangtze River) area were mainly within 5–40. Those in the lagoon soft soil area and lacustrine soft soil area were mainly within the 13–30 range.
Although the statistical magnitude of DSM columns in each soft soil area was different, the variations in mean blow count with depth in each soft soil area were similar. In general, the mean blow count of DSM columns above 11 m decreased as depth increased, and the mean blow count above 11 m was greater than 15 blows. However, in the depth range of 11–22 m, the mean blow count of DSM columns changed little, and fluctuated around 15 blows. The maximum blow count of DSM columns occurred near the surface of the ground, and was generally less than 25 blows. The standard deviation of the SPT blow count of DSM columns decreased slightly as depth increased. The standard deviation indicated that the SPT blow counts in the lagoon soft soil area were more concentrated than in other areas, and the SPT blow counts in the littoral soft soil area, alluvial soft soil (Ancient Yellow River) area, and alluvial soft soil (Yangtze River) area were more spread out: the less the depth, the more spread out the SPT blow count.
4.2. Results of UCS
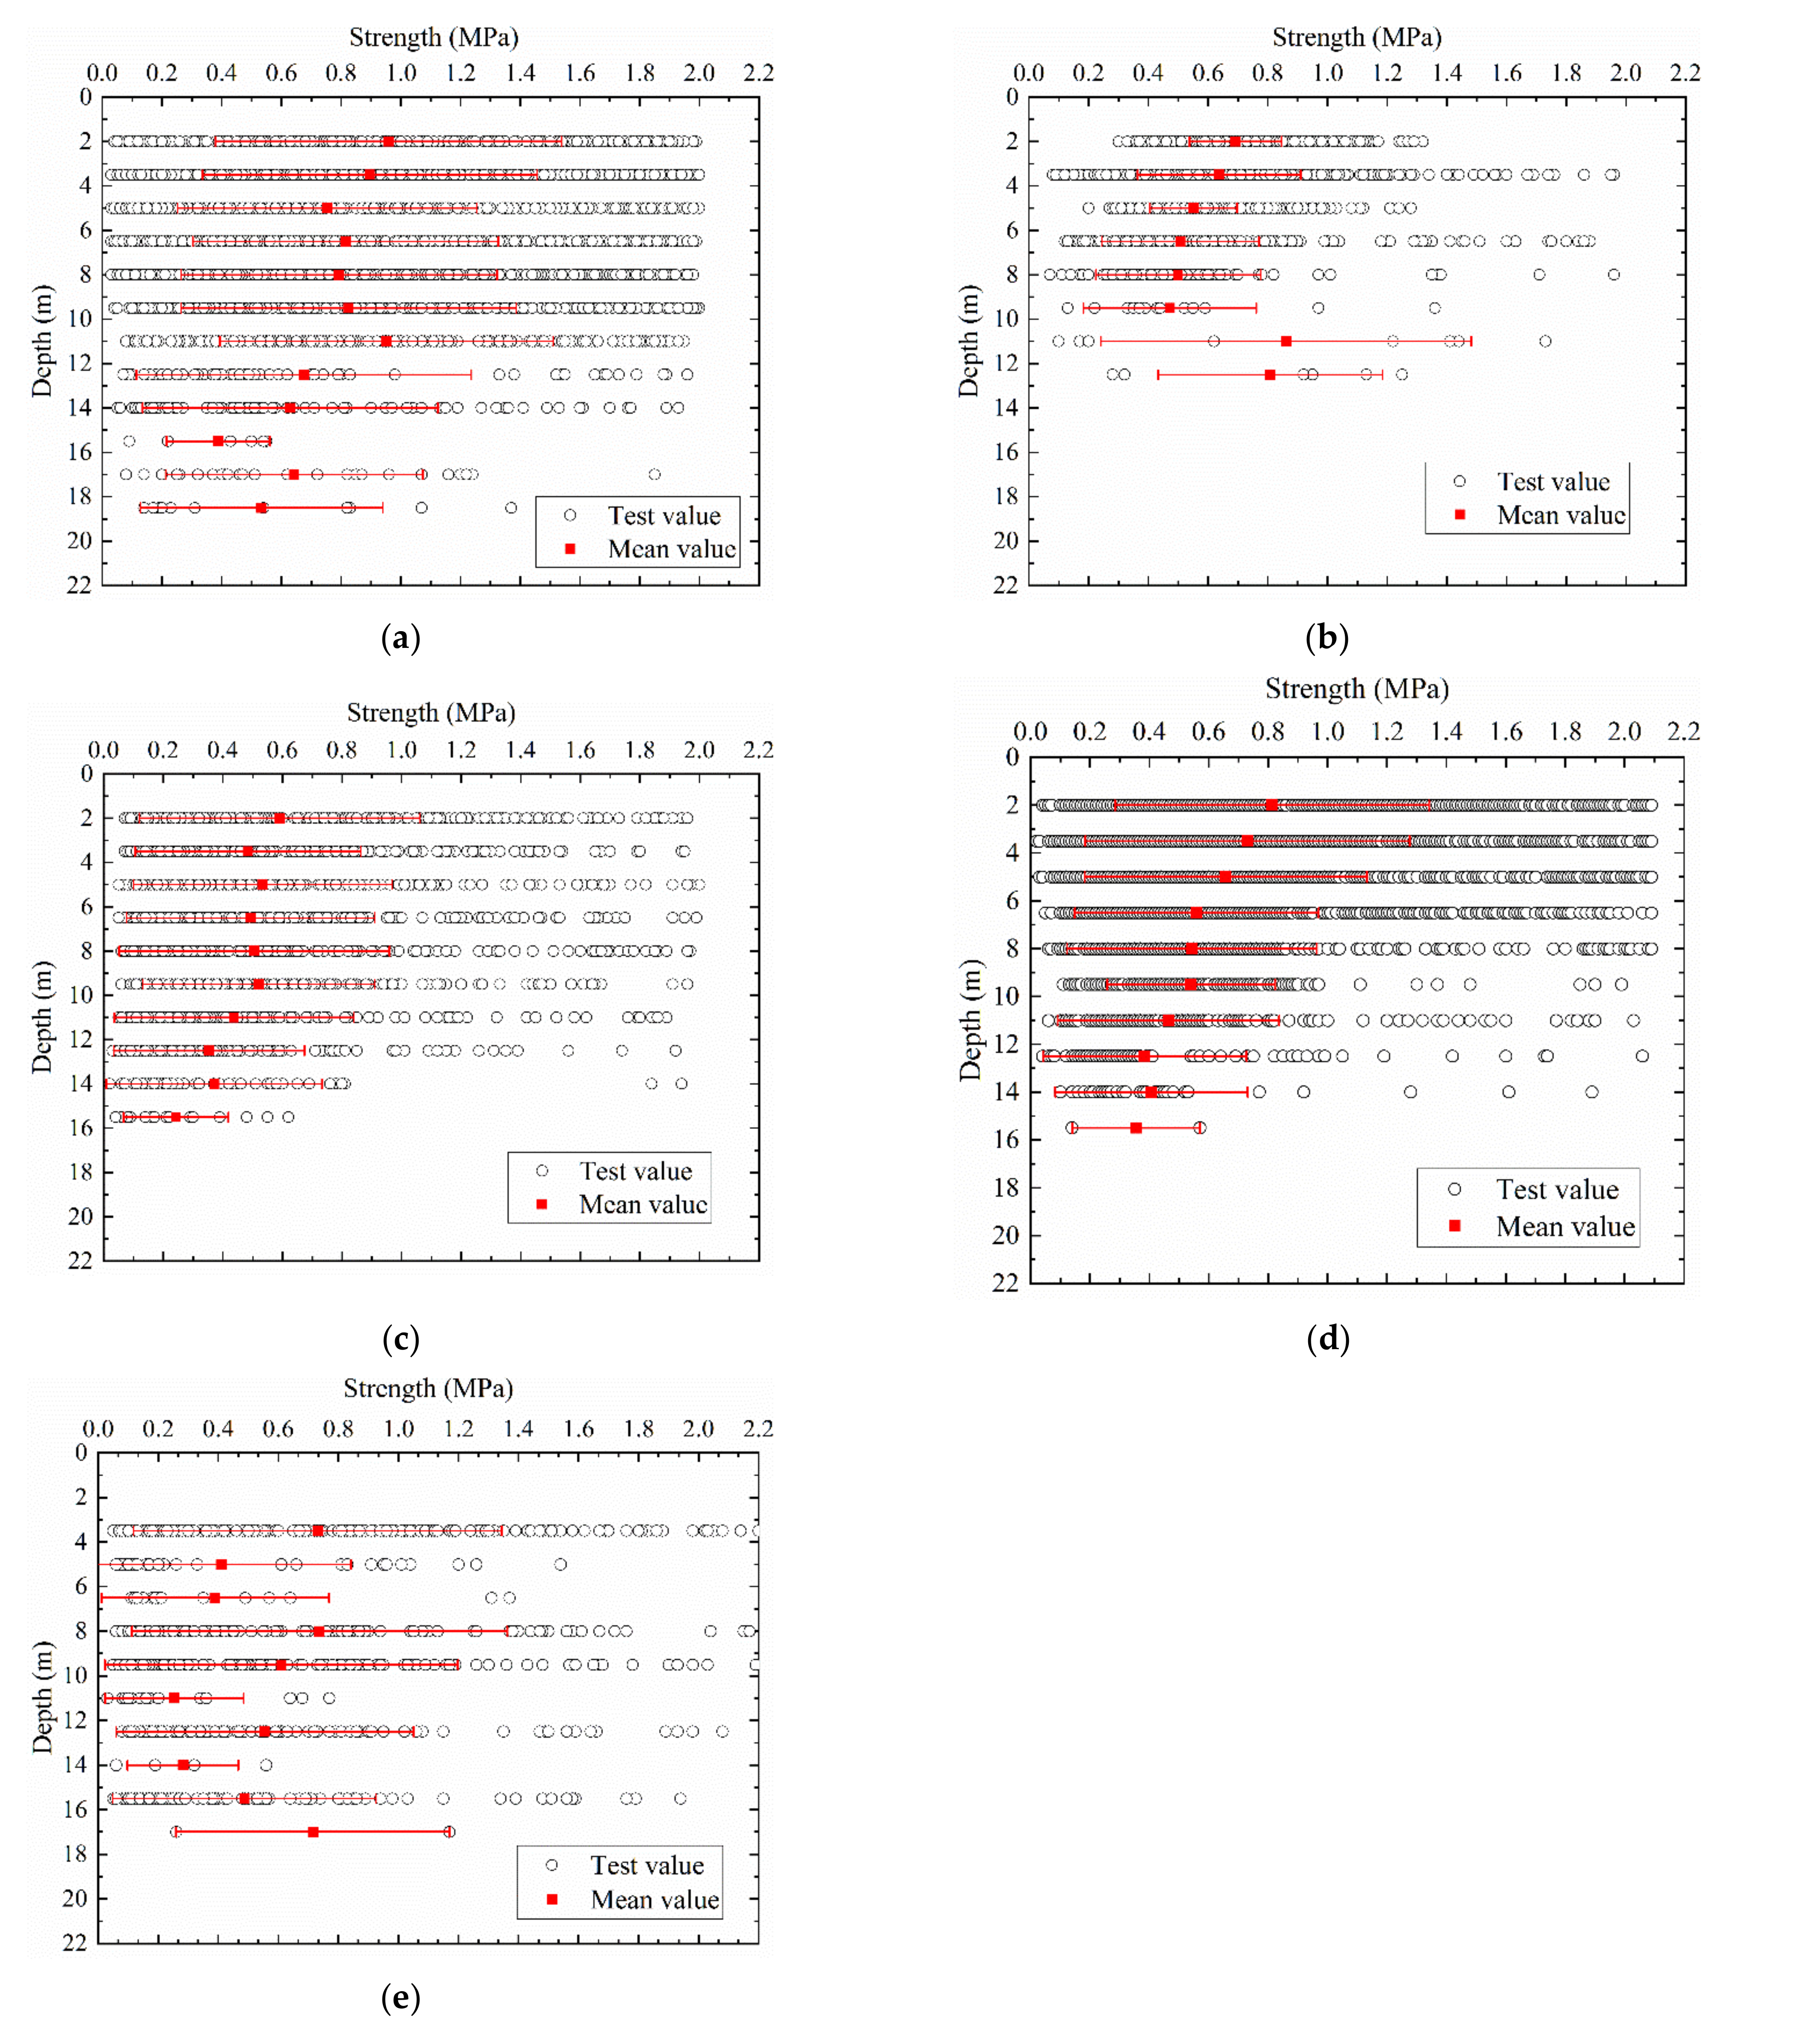
The relationship between the strength (representing the UCS herein) of DSM columns and depth is shown in
Figure 4. All tested columns were allowed to cure on site for a minimum of 28 days prior to drilling sampling for
UCS test. As can be seen in
Figure 4, significant variability was observed in the strength of DSM columns. The strengths of the littoral soft soil area, alluvial soft soil (Ancient Yellow River) area, alluvial soft soil (Yangtze River) area, and lacustrine soft soil area were mainly distributed in the 0–2.0 MPa range. That of the lagoon soft soil area was mainly distributed in the 0–1.4 MPa range. In general, except for the lacustrine soft soil area, the mean strength of DSM columns decreased as the depth increased. The mean strength of DSM columns in the alluvial soft soil (Ancient Yellow River) area was less than 0.6 MPa, which was less than that in other areas. For the littoral soft soil area, the mean strength of DSM columns was greater than those of other areas, and the maximum mean strength was about 1.0 MPa. The mean strength of DSM columns in the lacustrine soft soil area changed irregularly with depth, which may have been due to the small statistical magnitude. The strength of DSM columns indicated that the quality of DSM columns decreased as depth increased. In general, the standard deviation of strength decreased slightly as depth increased: the lower the depth, the more spread out the strength. The standard deviations of strength in the lagoon soft soil area and the lacustrine soft soil area were irregular.
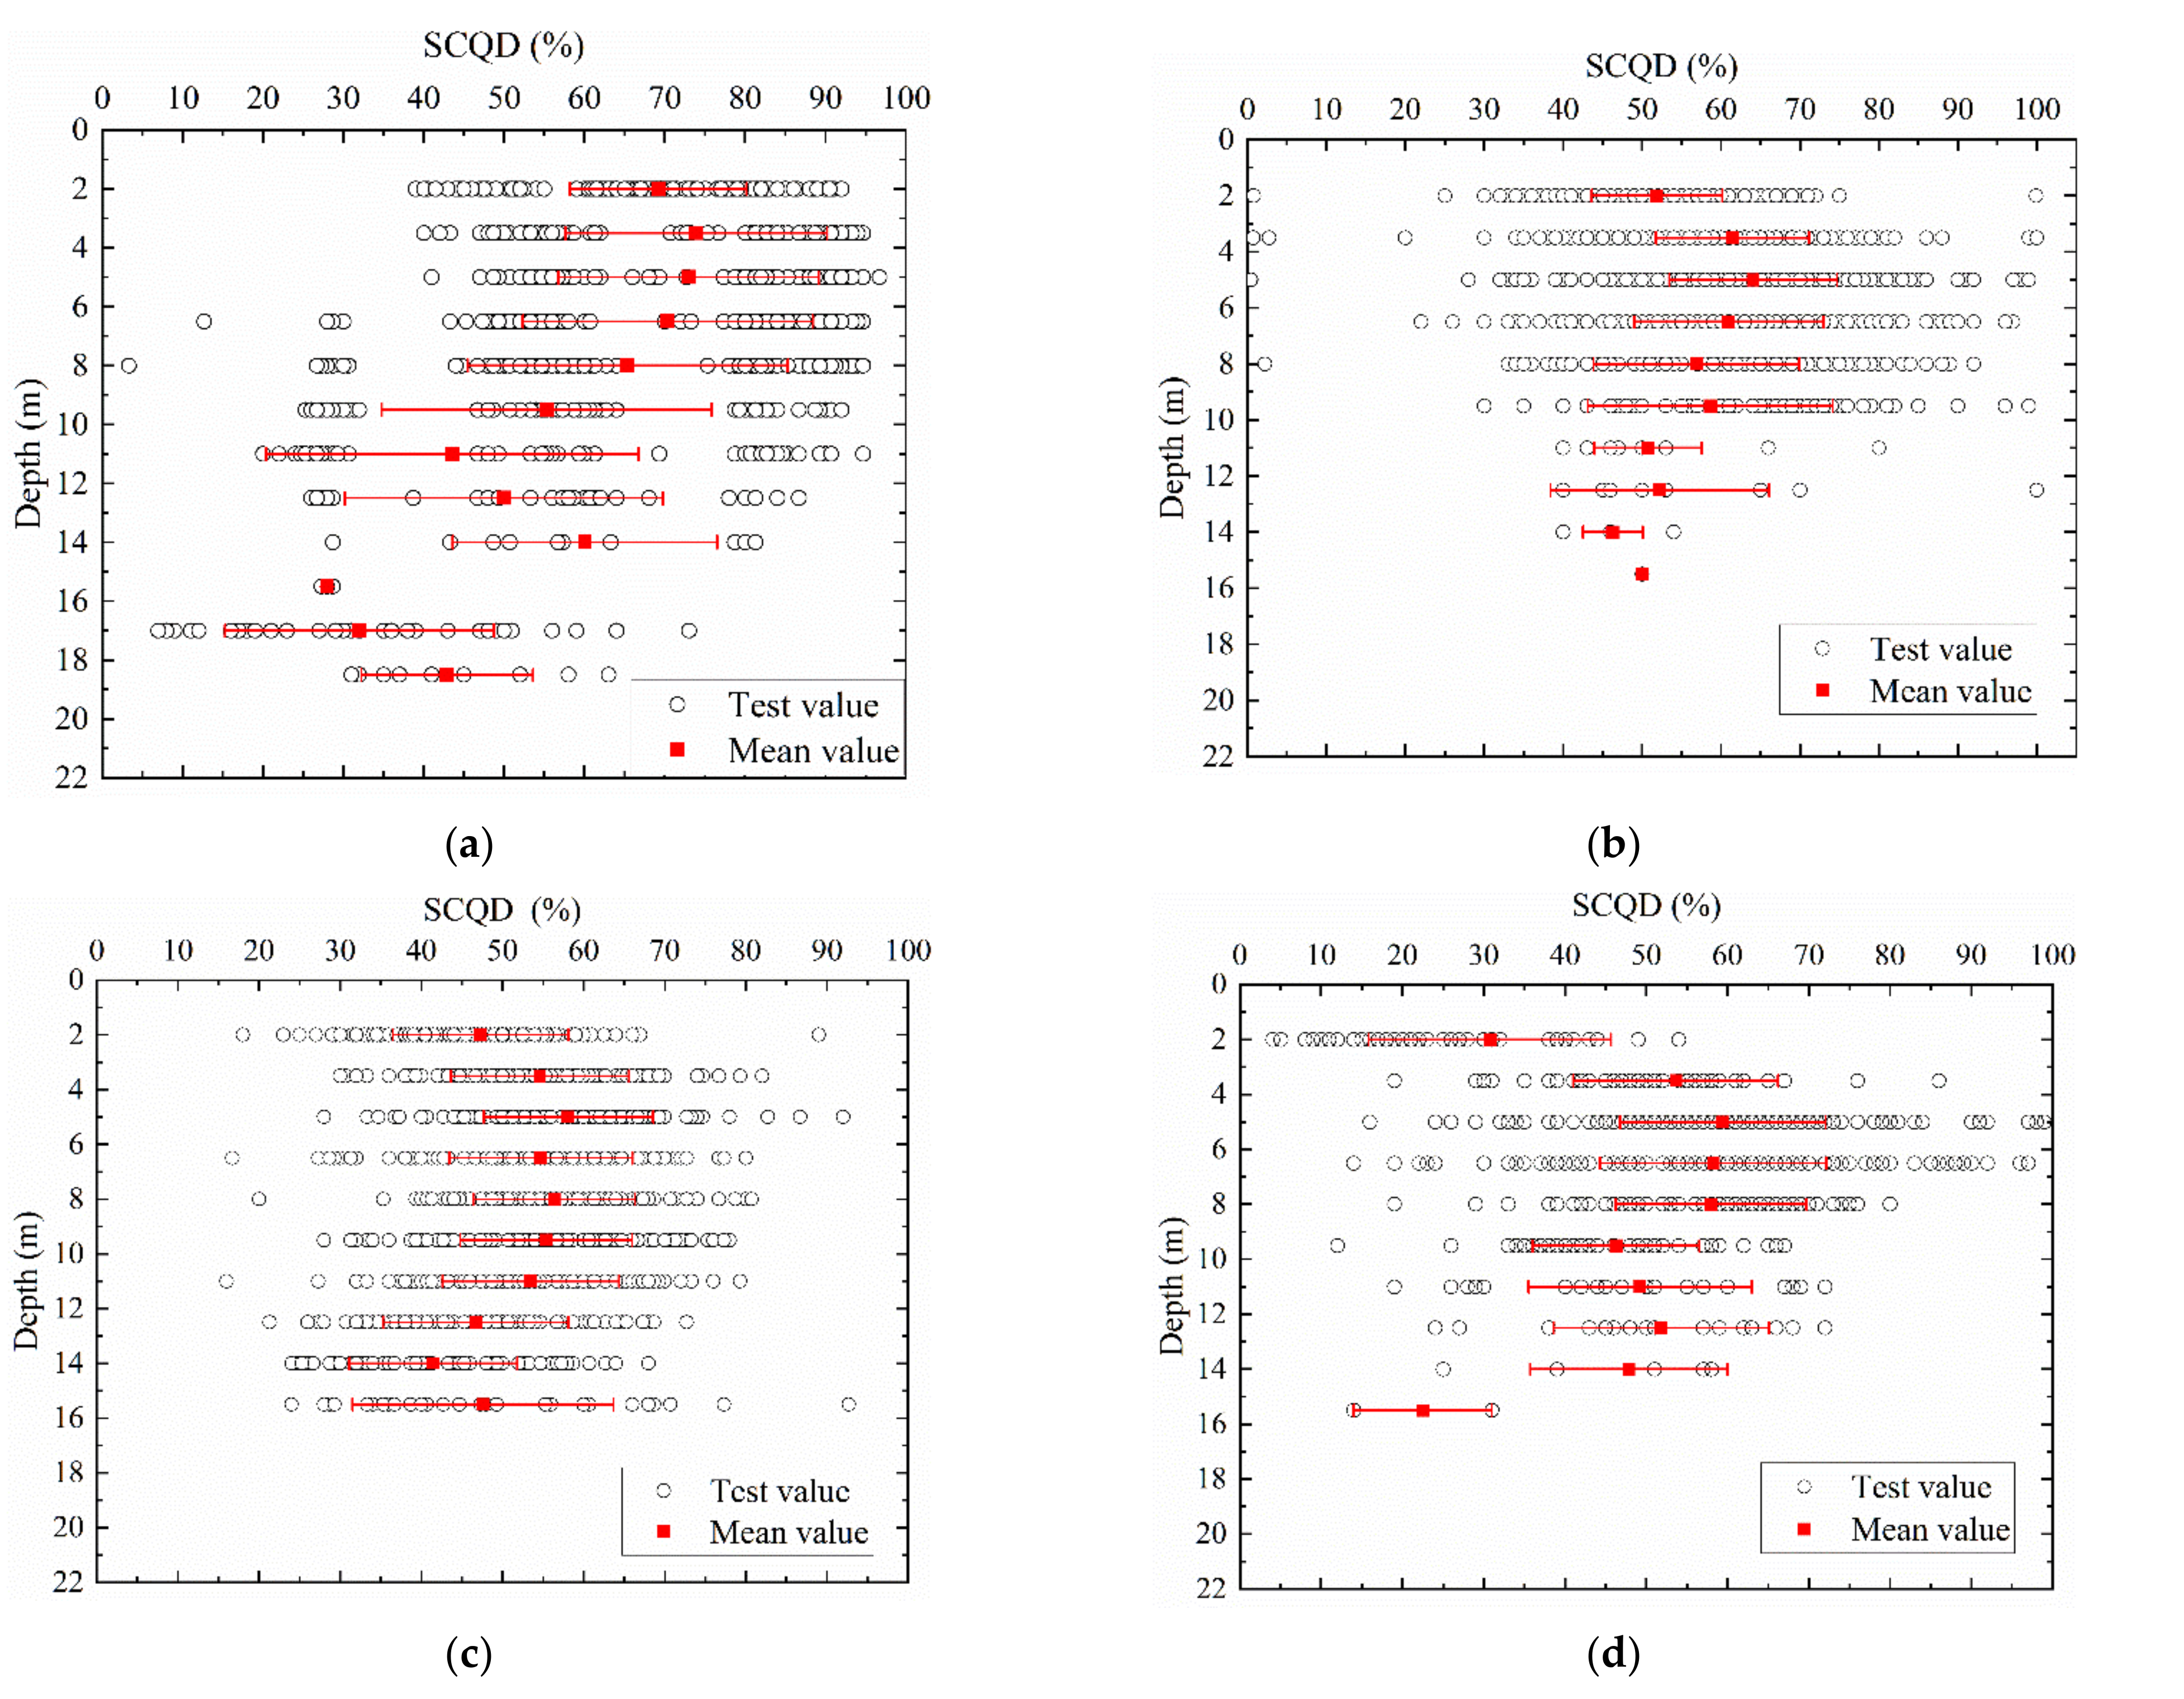
4.3. Results of SCQD
Figure 5 shows the SCQD of DSM columns varied with the depth in different soft soil areas. Unfortunately, SCQD data of lacustrine soft soil were lacking. It can be seen that the SCQD was distributed between 30 and 90, and it was scattered irregularly. Meanwhile, as depth increased, the mean value of the SCQD first increased and then decreased. The maximum mean value occurred at a depth of about 5 m, and the maximum mean value in the littoral soft soil area was 75, which was greater than those in other areas. The mean value fluctuated in a small range when the depth was greater than 11 m. For all soft soil areas, most SCQD averages of the DSM columns were less than 60. The standard deviations of SCQD in the alluvial soft soil (Ancient Yellow River) area and alluvial soft soil (Yangtze River) area changed little as depth increased, but the standard deviation of SCQD in the littoral soft soil area and lagoon soft soil area first increased and then decreased. The SCQD in the littoral soft soil area and alluvial soft soil (Yangtze River) area were more spread out than in other areas.
The test results show that the blow counts of SPT, UCS, and SCQD of the DSM column decreased as depth increased. During DSM installation, the deeper the mixing, the greater the injection pressure required for injecting the binder, and the more difficult it is to stir the binder and soil uniformly, and the mixed slurry will rise to the ground’s surface. As a result, as depth increased, the quality of DSM columns decreased.
4.4. Quality Assessment Results
According to the quality assessment method in
Section 3.5, the assessment results are presented in this section.
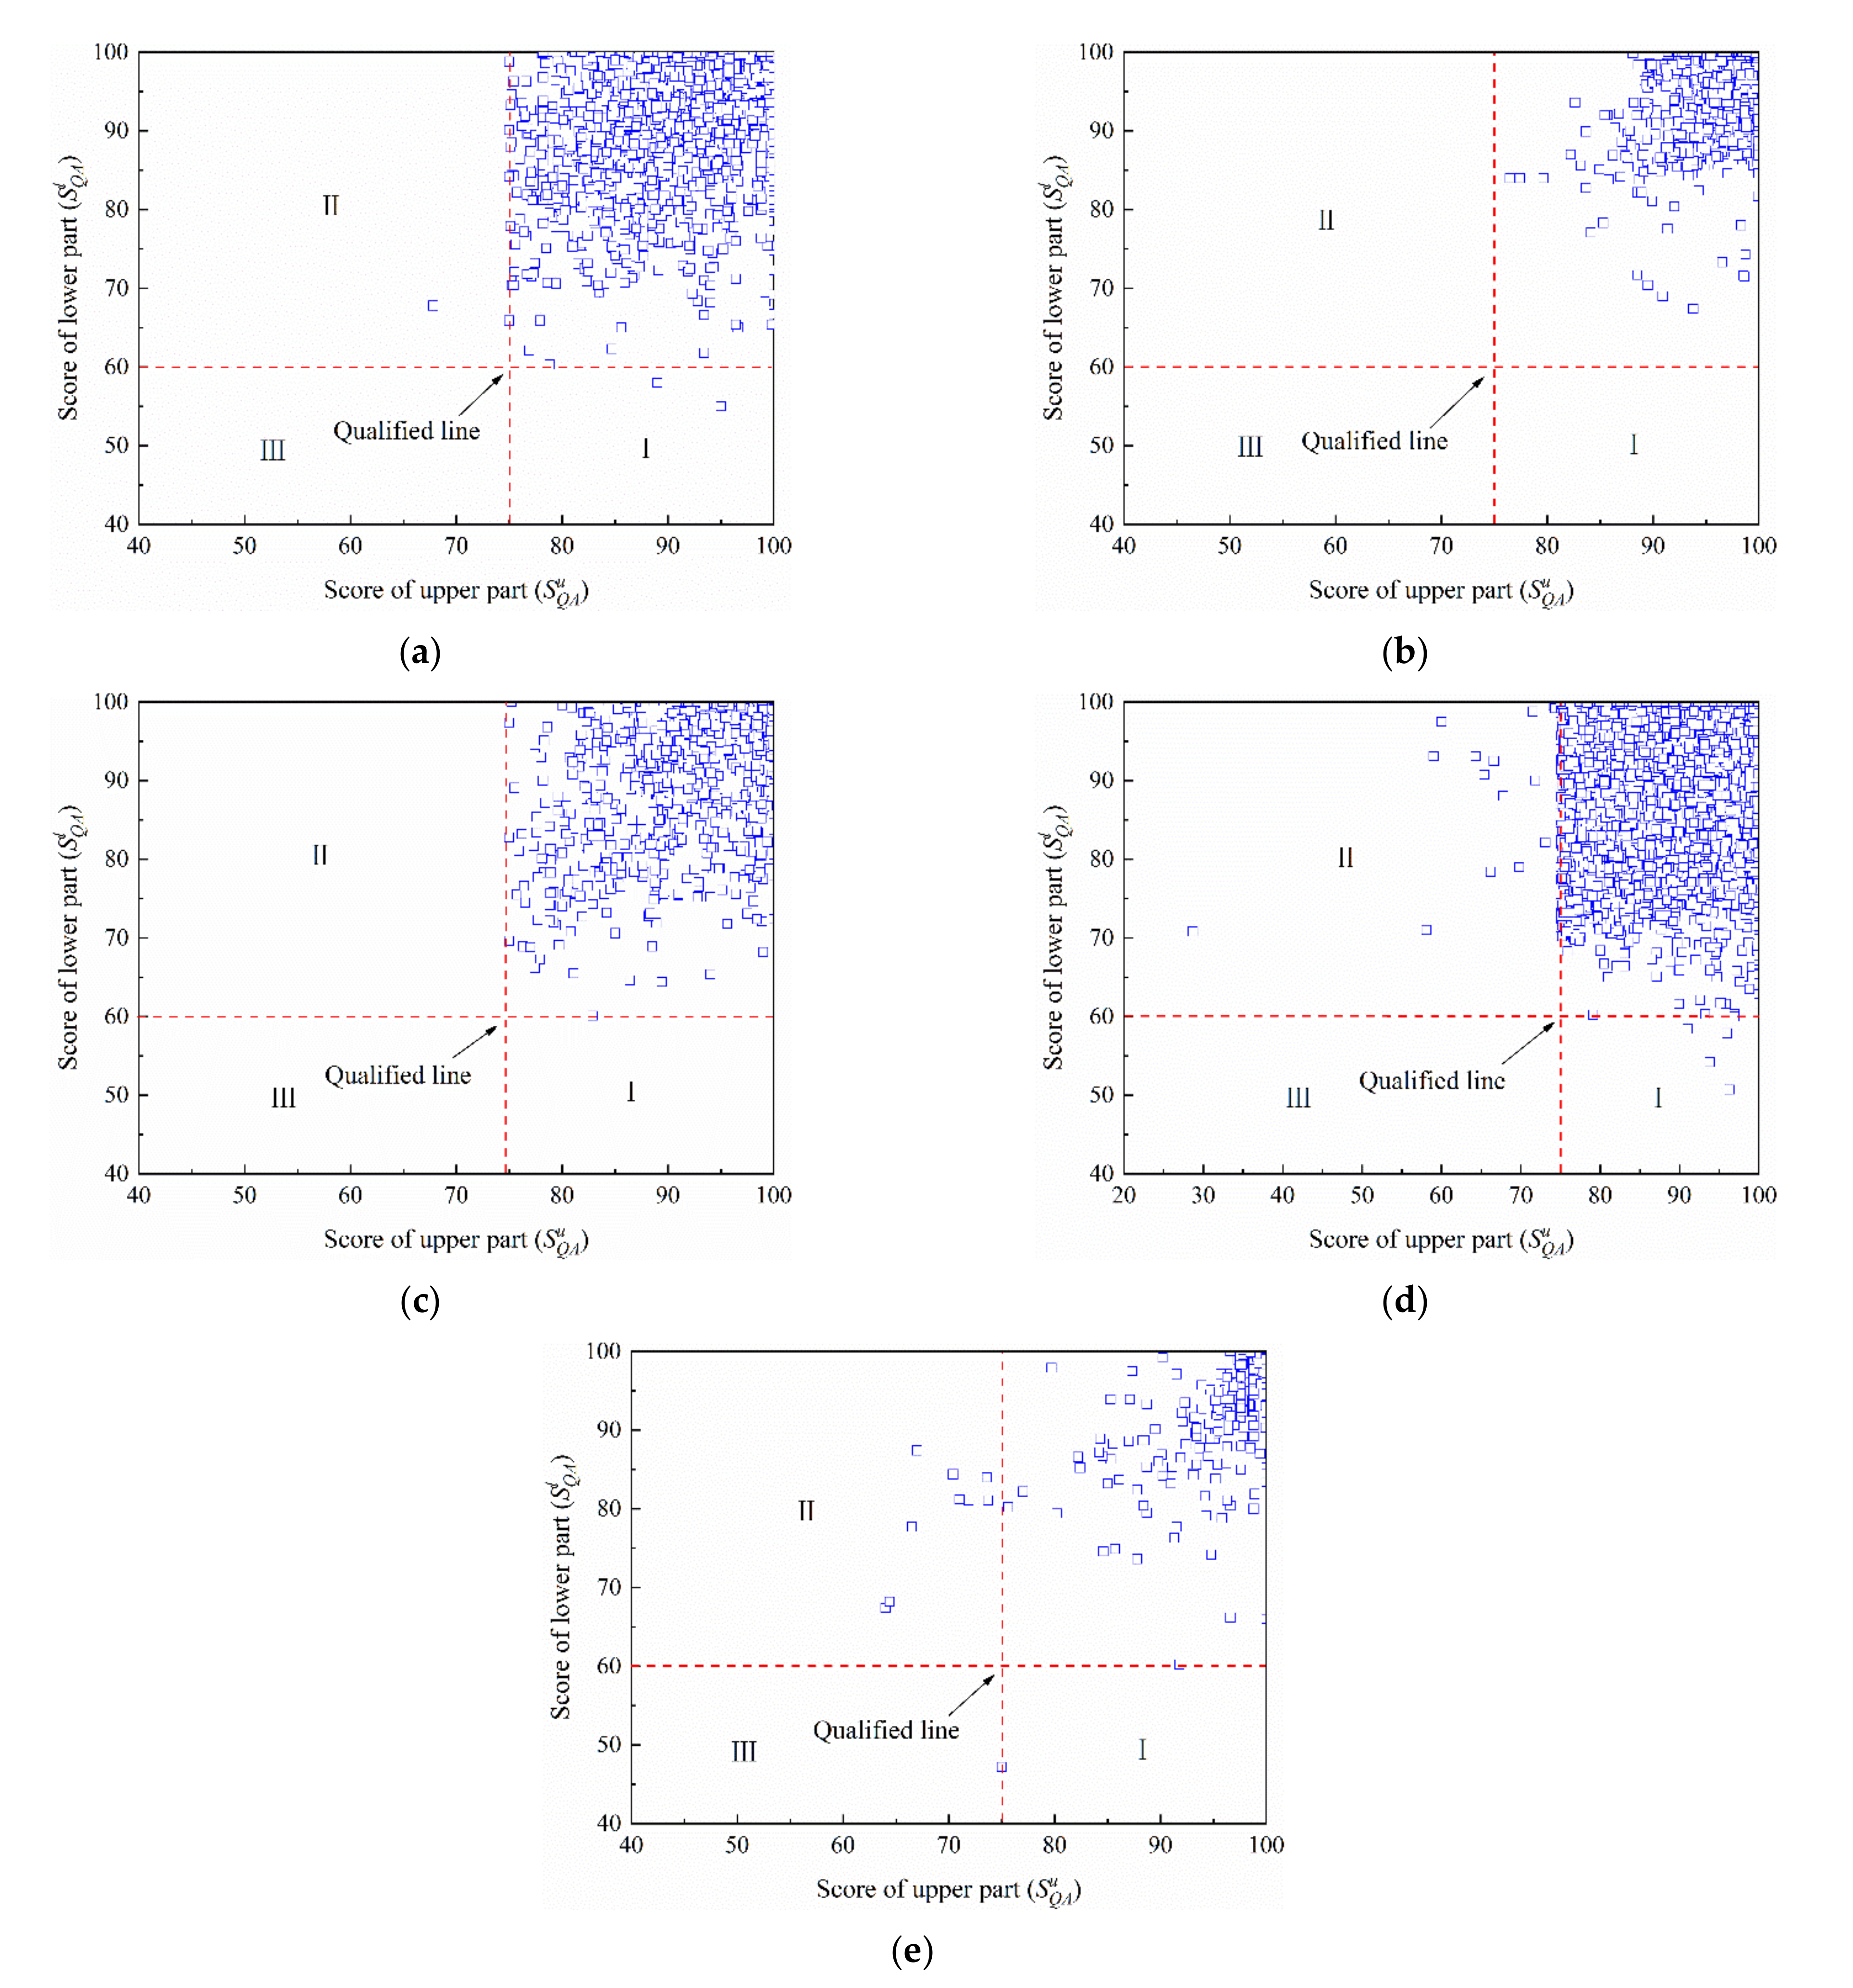
Figure 6 shows the quality scores of the DSM columns in the different soft soil areas, including the upper and lower parts of the columns. The statistical magnitudes (numbers of the DSM columns) of the littoral soft soil area, lagoon soft soil area, alluvial soft soil (Ancient Yellow River) area, alluvial soft soil (Yangtze River) area, and lacustrine soft soil area were 2173, 869, 1212, 4075, and 298, respectively. In
Figure 6, zone I represents that the quality of the upper parts of the DSM columns were qualified, but the quality of the lower parts of the DSM columns were unqualified. Zone II represents that the quality of the lower parts of the DSM columns were qualified, but the quality of the upper parts of the DSM columns were unqualified. Zone III represents the quality of the whole DSM column was unqualified.
It can be seen that there were three unqualified DSM columns in the littoral soft soil area; two columns were unqualified from the lower part and one column was unqualified from the upper part. In the lagoon soft soil area and the alluvial soft soil (Ancient Yellow River) area, all DSM columns were qualified. There were 17 unqualified DSM columns in the alluvial soft soil (Yangtze River) area, and nine unqualified DSM columns in lacustrine soft soil area. The quality assessment results showed that the number of unqualified columns in the upper part was larger than the number in the lower part.
According to the quality assessment method in
Section 3.5, the quality levels of the DSM columns were divided into great, good, general, and unqualified. The proportions of the levels of quality in the different soft soil areas are shown in
Table 7. The data show that the proportion of great quality columns was the largest, and the proportion of unqualified columns was minimal. From great to unqualified, the proportions decreased. The proportion of DSM columns with great quality in the lagoon soft soil area was greater than in other areas. The proportion of unqualified columns in the lacustrine soft soil area was the largest.
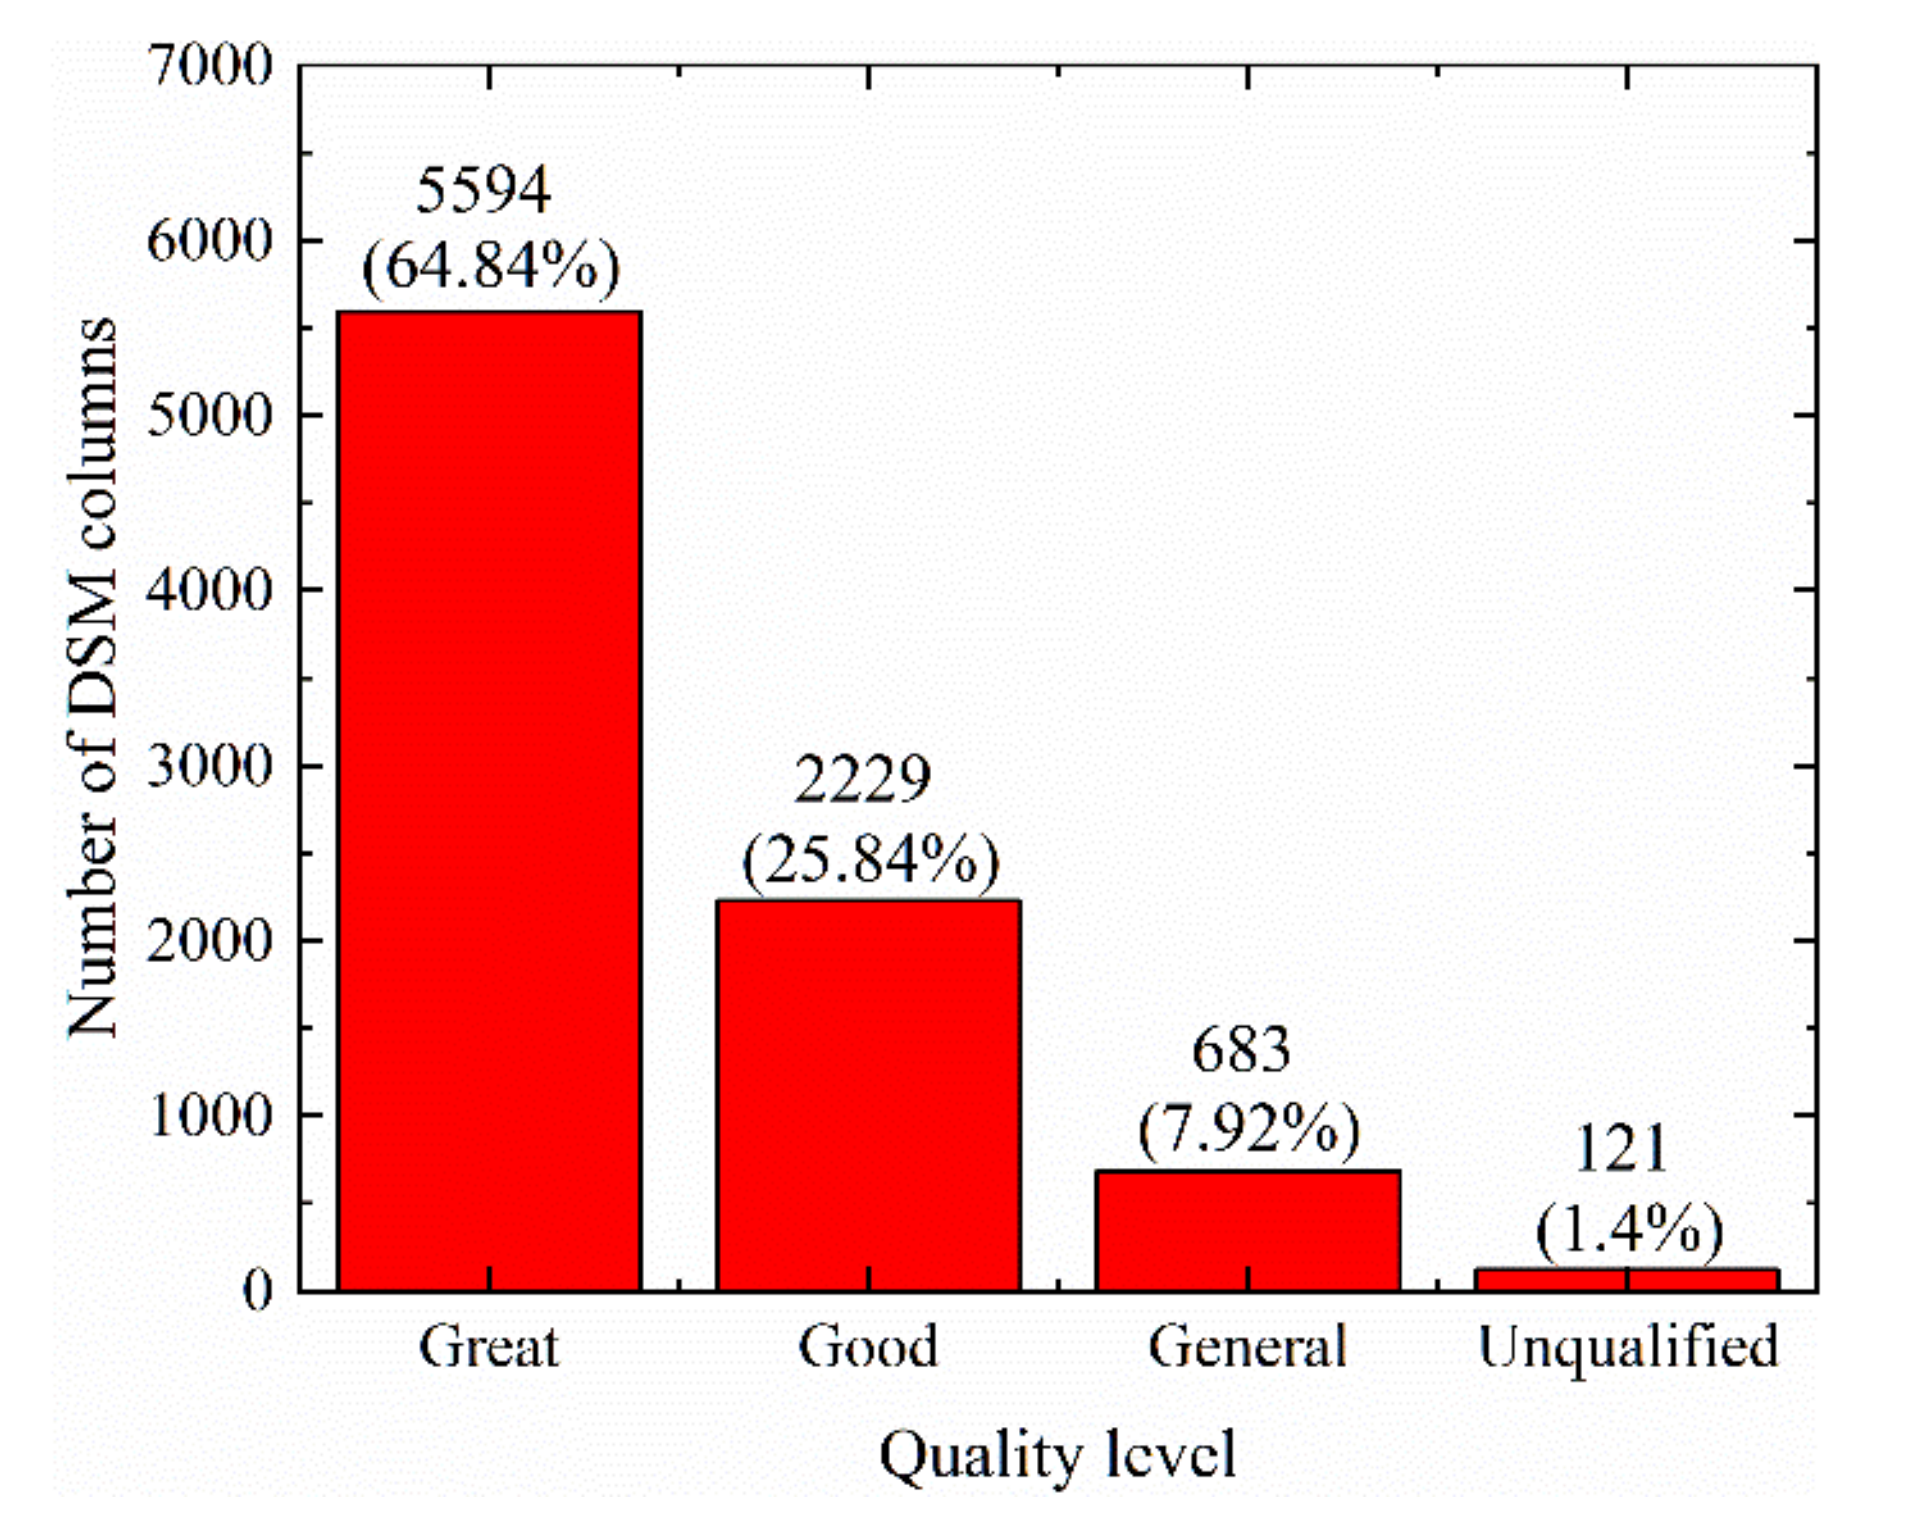
The quality assessment result from 8627 DSM columns is shown in
Figure 7. The proportions of four quality levels varied widely. The proportion of great quality was 64.84%, which indicated that most DSM columns were of high quality. The proportion of unqualified DSM columns was 1.4%. The proportions of great quality, good quality, general quality, and unqualified soil decreased in that order.
5. Discussions
There are many factors impacting the quality of DSM columns, such as the engineering properties of the on-site soil [
1], the type of binder [
8,
24], the mixing process, and the mixing energy [
1,
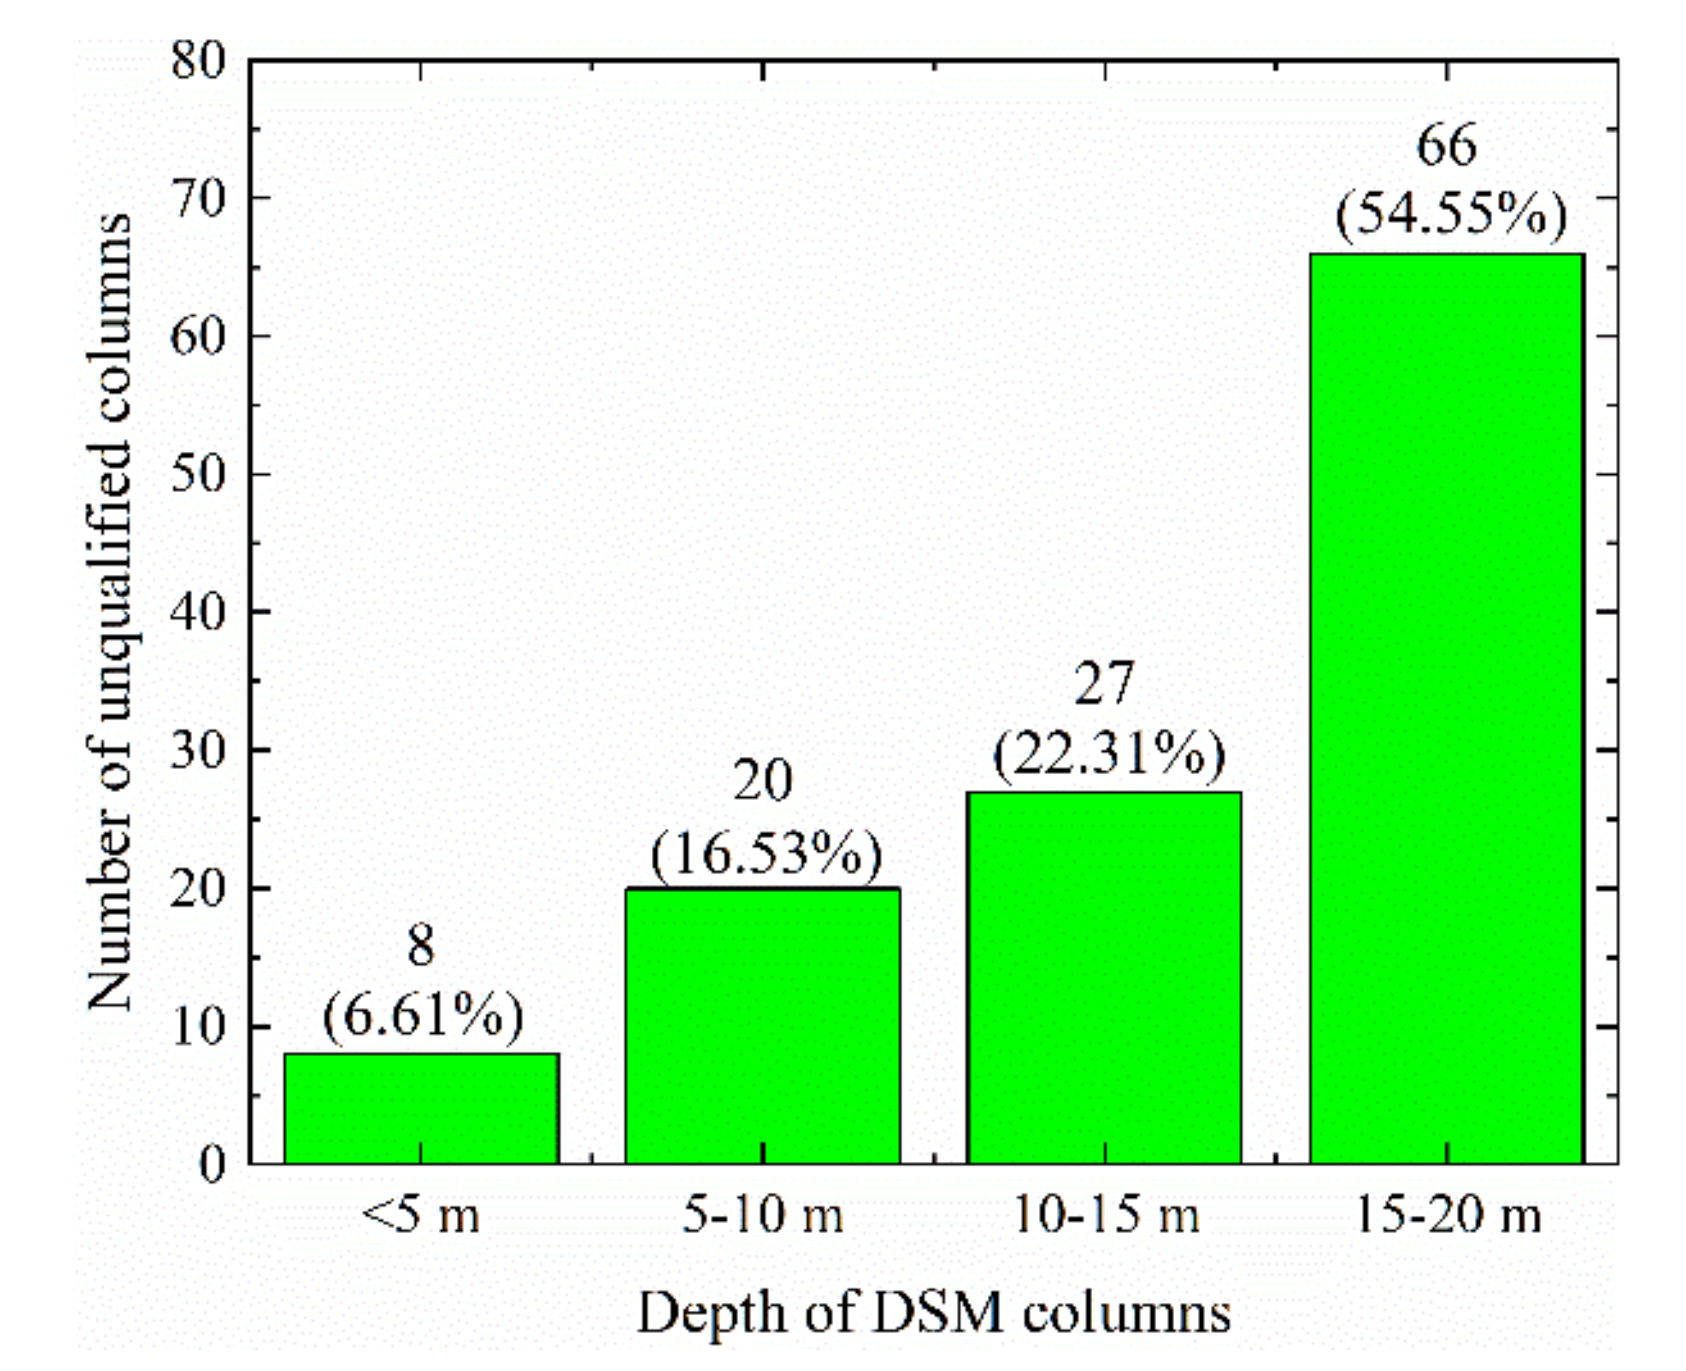
10]. Unqualified columns are related to these factors. The deficiency of this paper is that these factors were not taken into account. The previous discussion showed that the greater the depth, the lower the SPT, UCS, and SCQD of the DSM column. Furthermore,
Figure 8 shows the distribution of 121 unqualified piles (see
Figure 7) among the different depths. It can be seen that the greater the depth of DSM, the more unqualified columns. The greater the depth of DSM, the more difficult it is to control the quality of the DSM piles.


