
Does the Intraluminal Thrombus Provoke the Rupture of the Abdominal Aortic Aneurysm Wall?

Abstract
1. Introduction
2. Materials and Methods
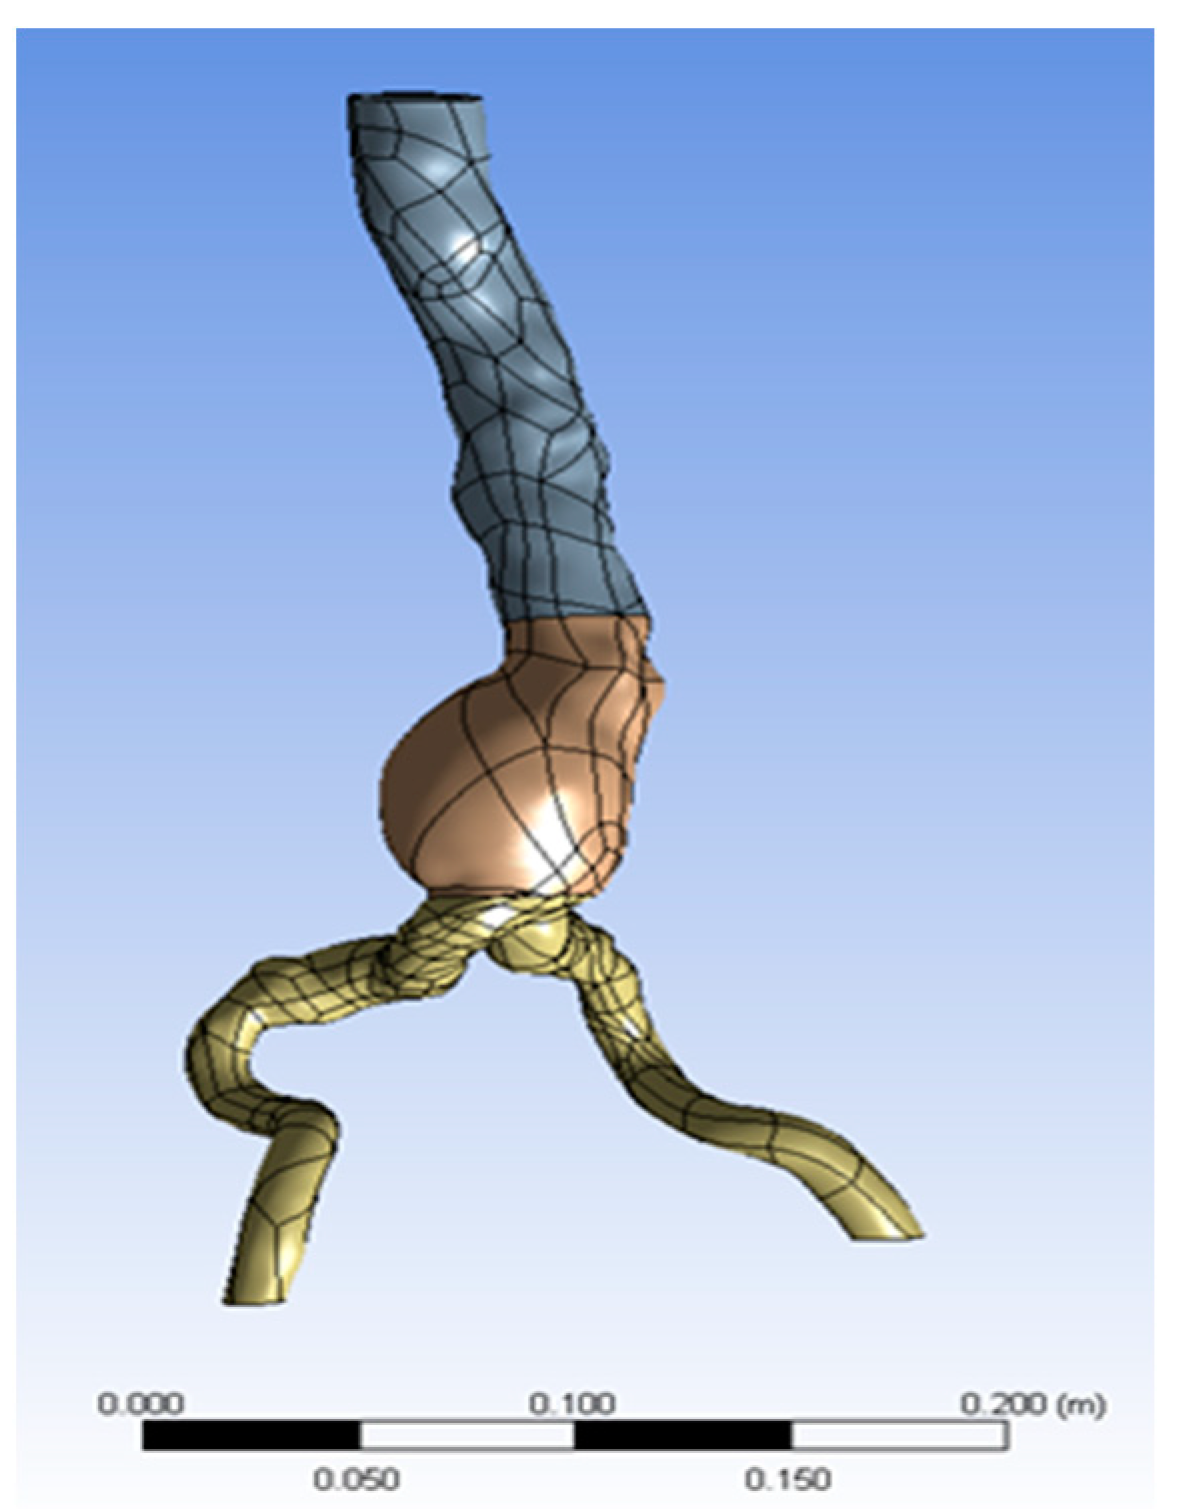
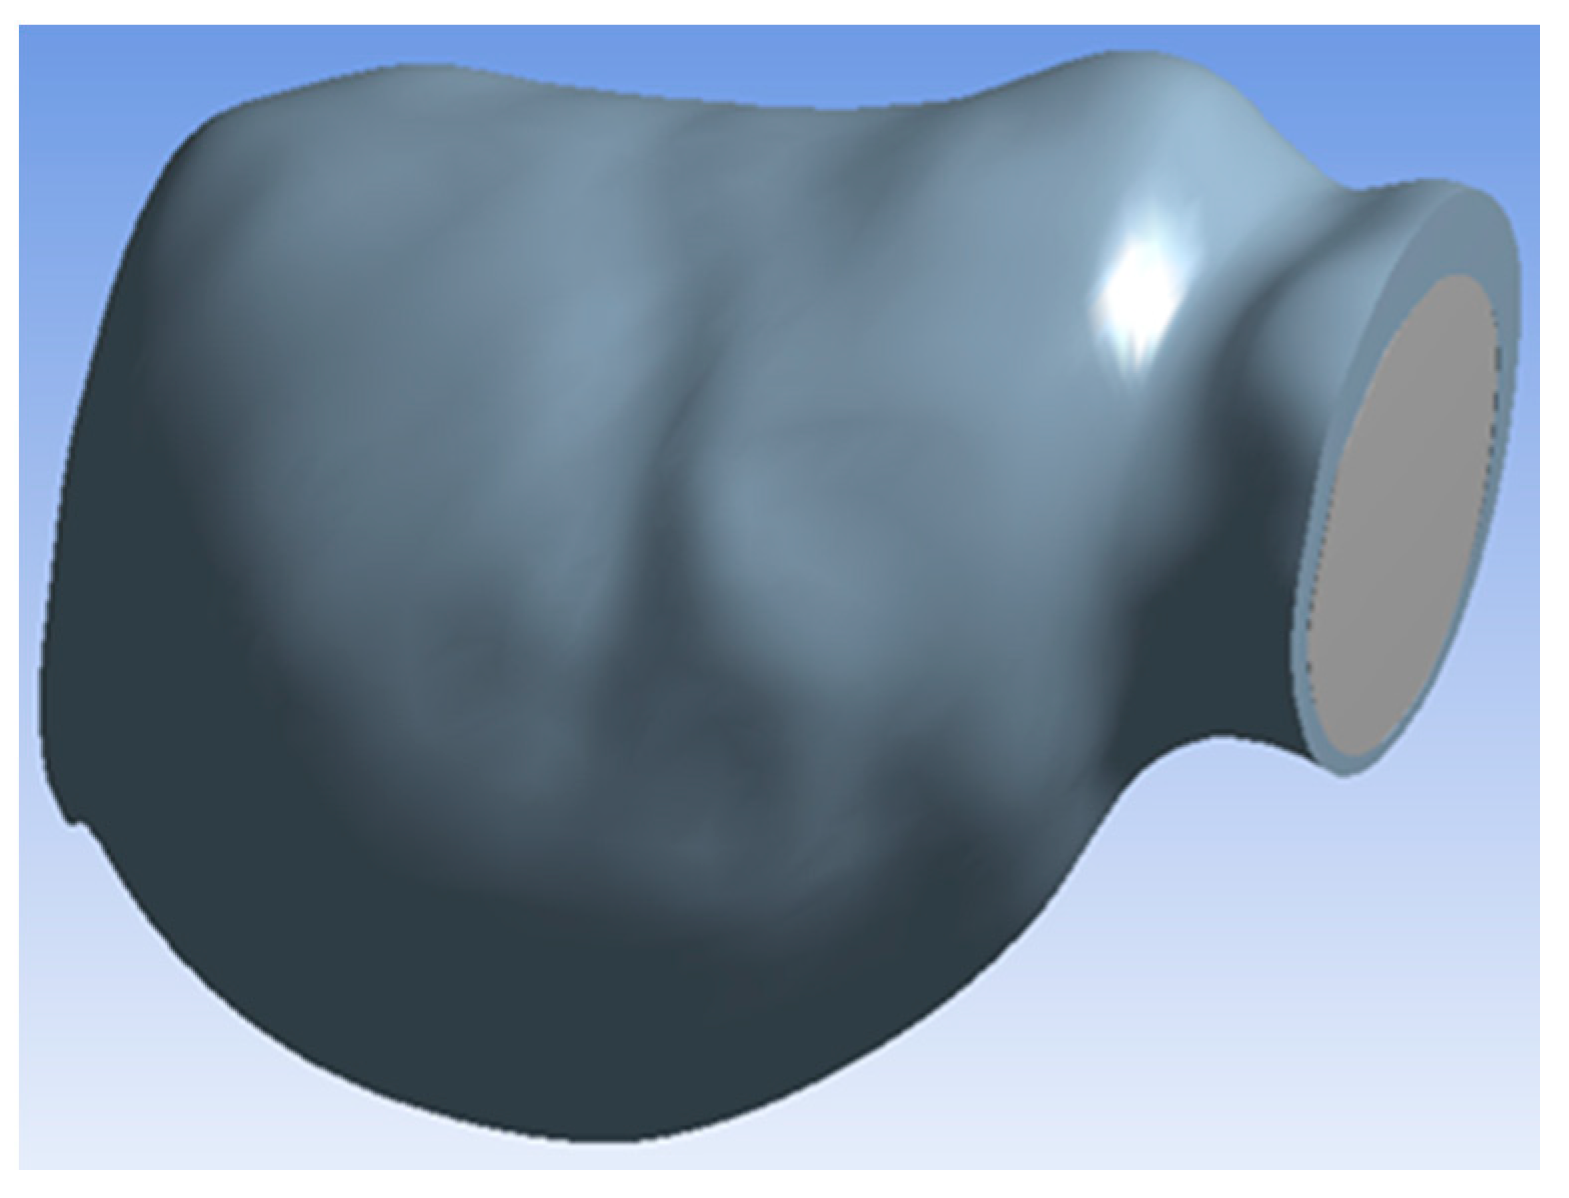
2.1. Geometry
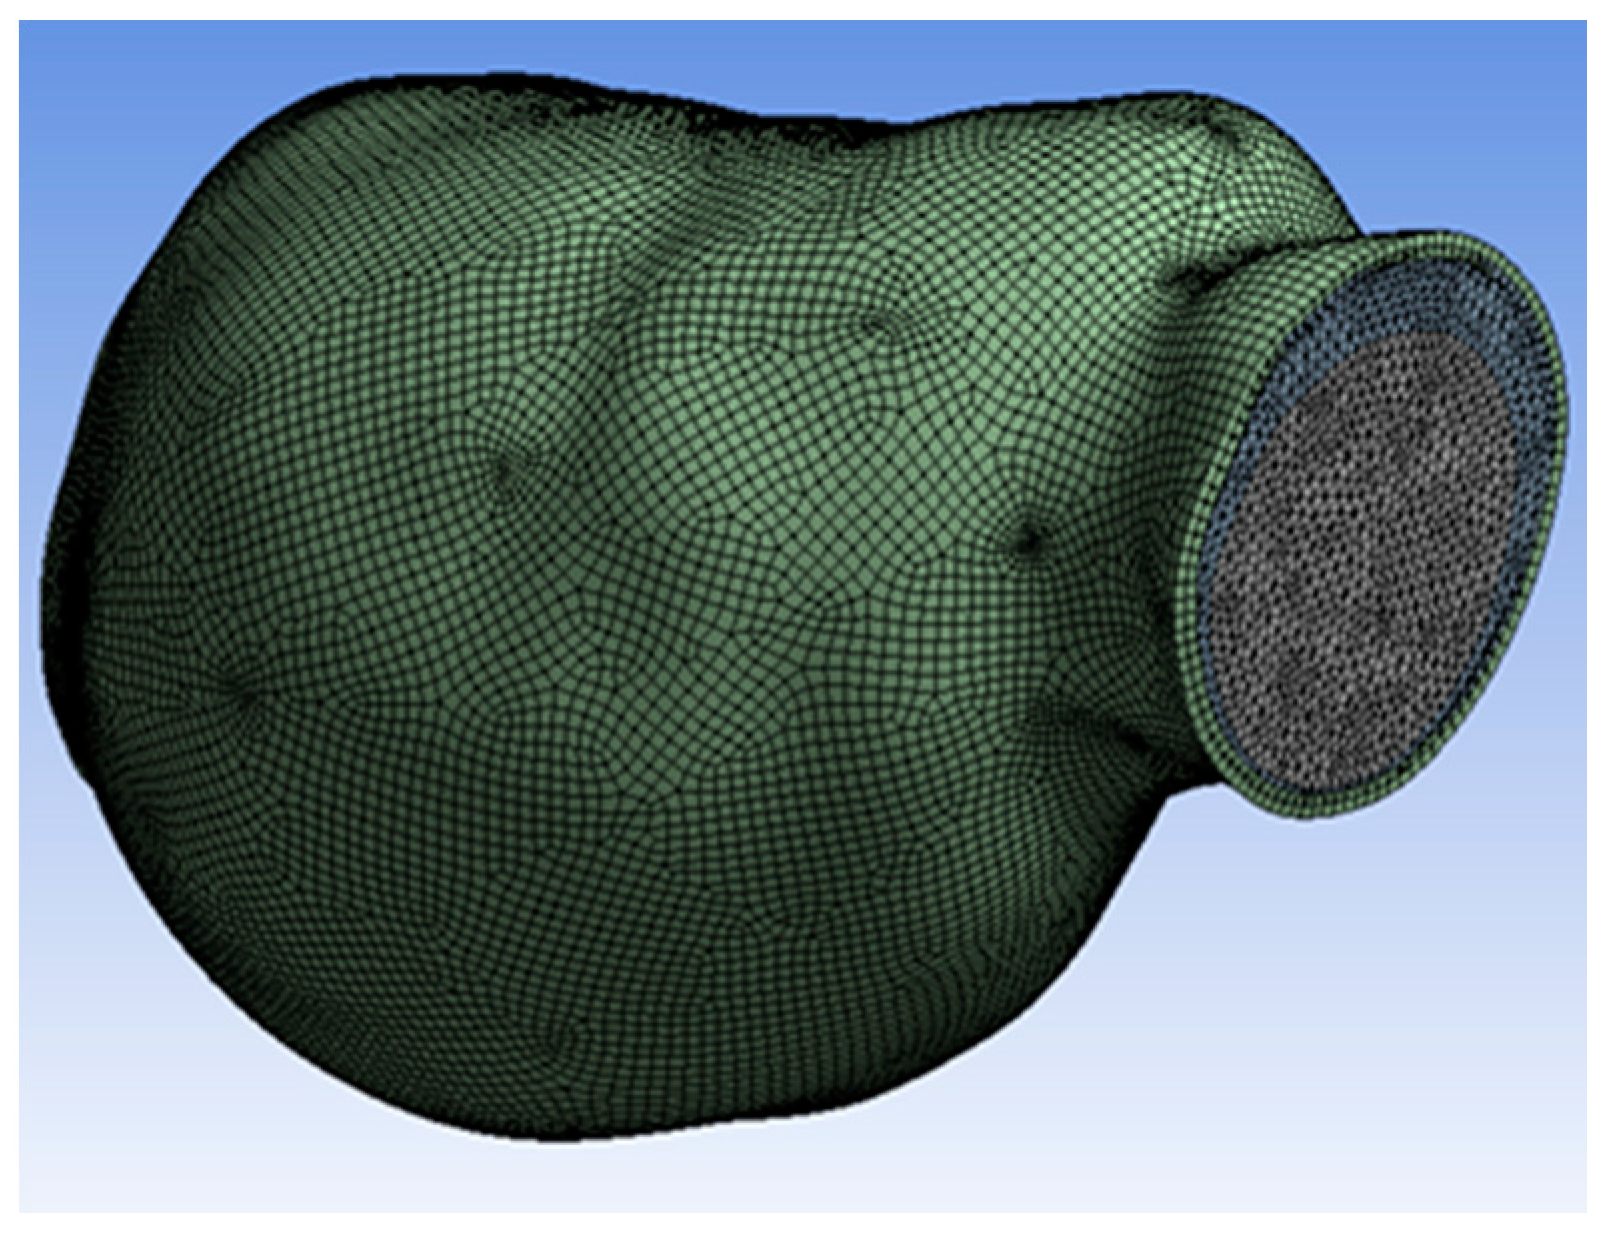
2.2. Mesh Generation
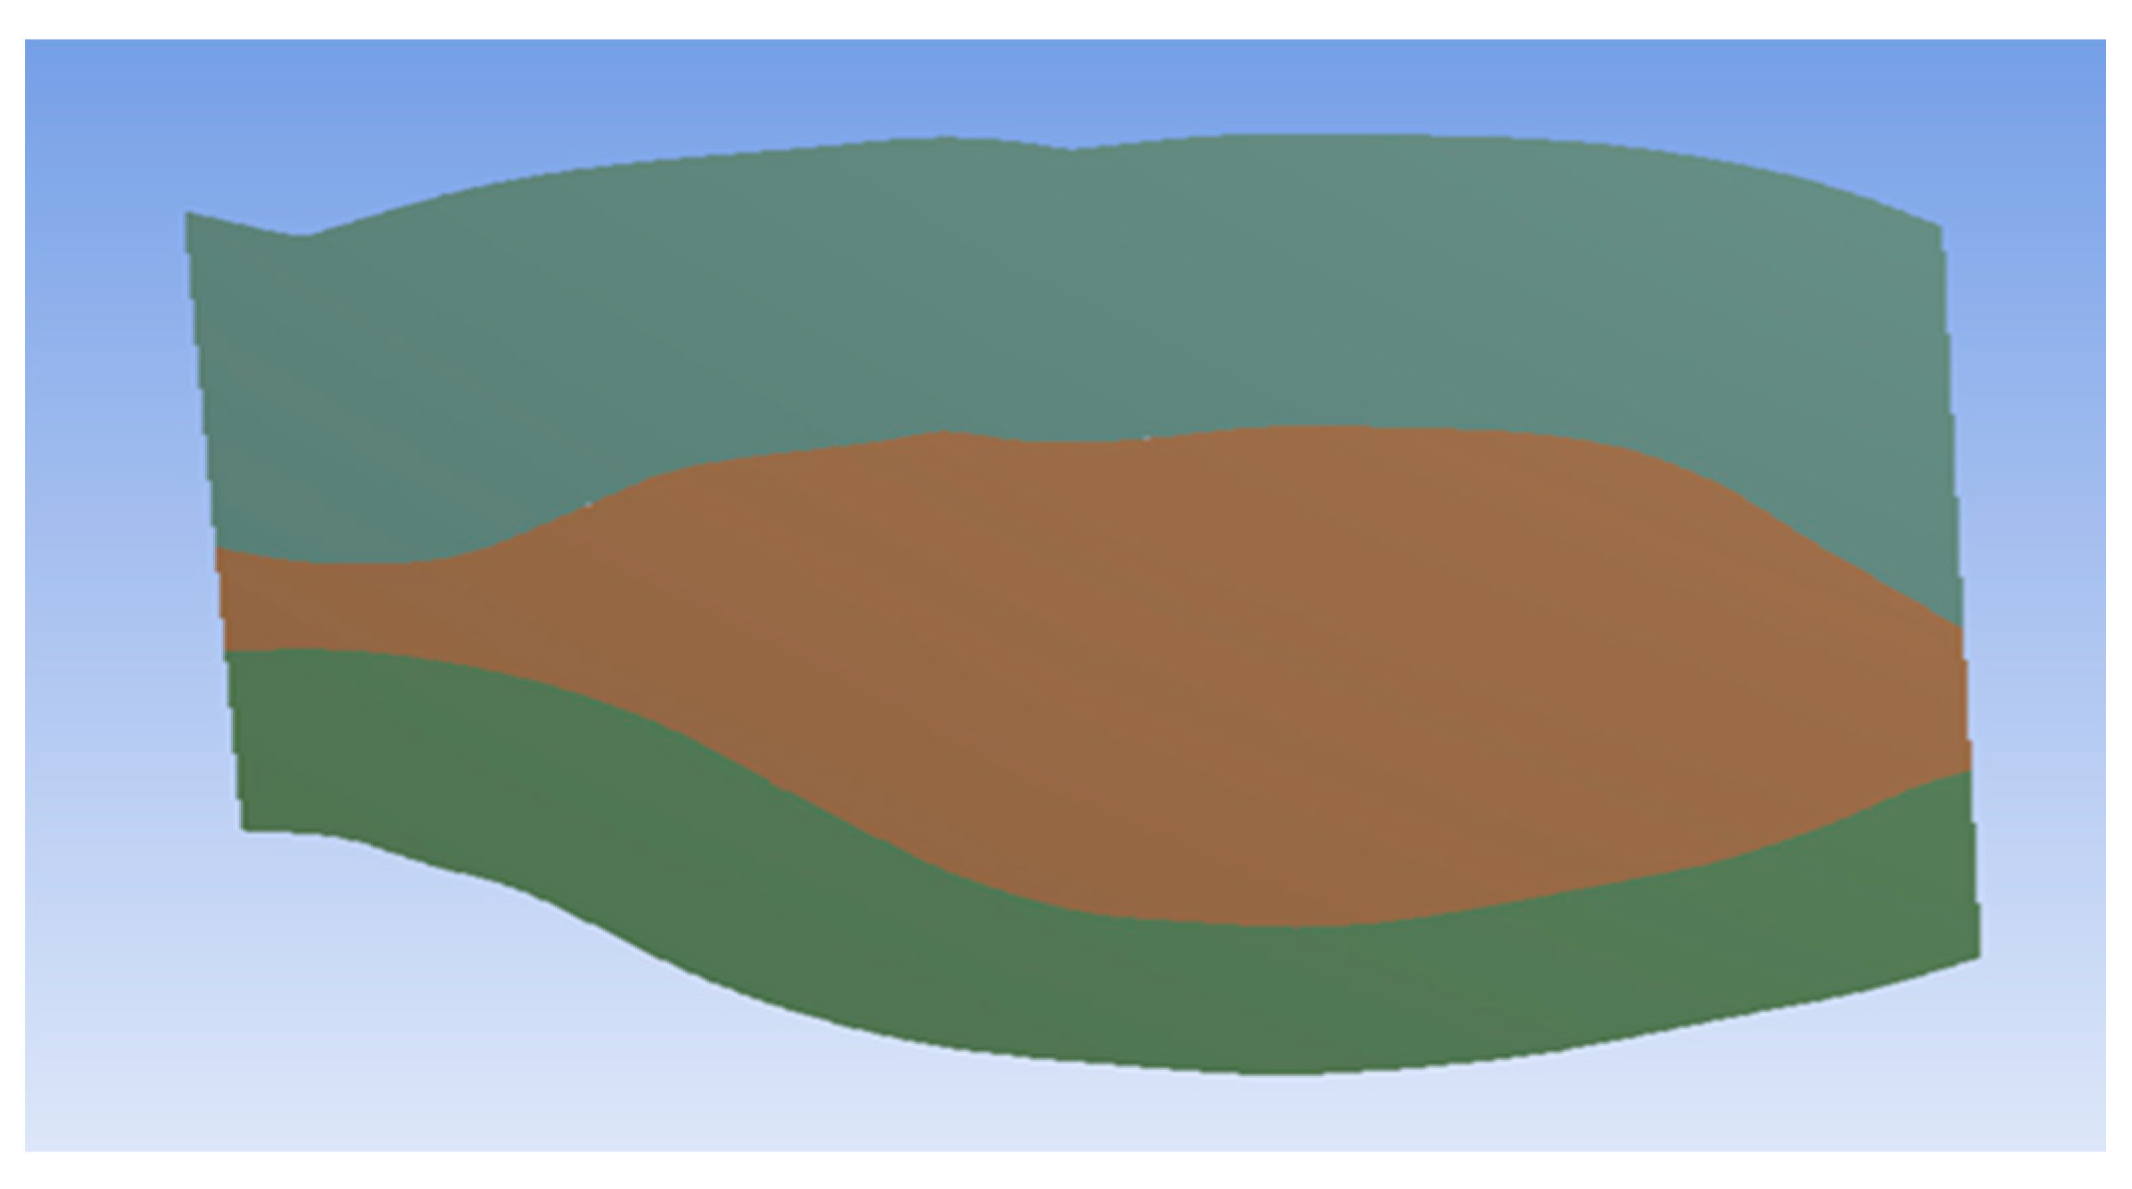
2.3. Material Properties
2.4. Intraluminal Thrombus Porosity
2.5. Blood and Oxygen Flow
- to give a specific volume fraction for each material, as oxygen volume is lower than blood volume;
- to separately or in combination analyze the effect of both materials.
2.6. Boundary Conditions
2.7. Initialization and Calculation
3. Results
3.1. Porosity
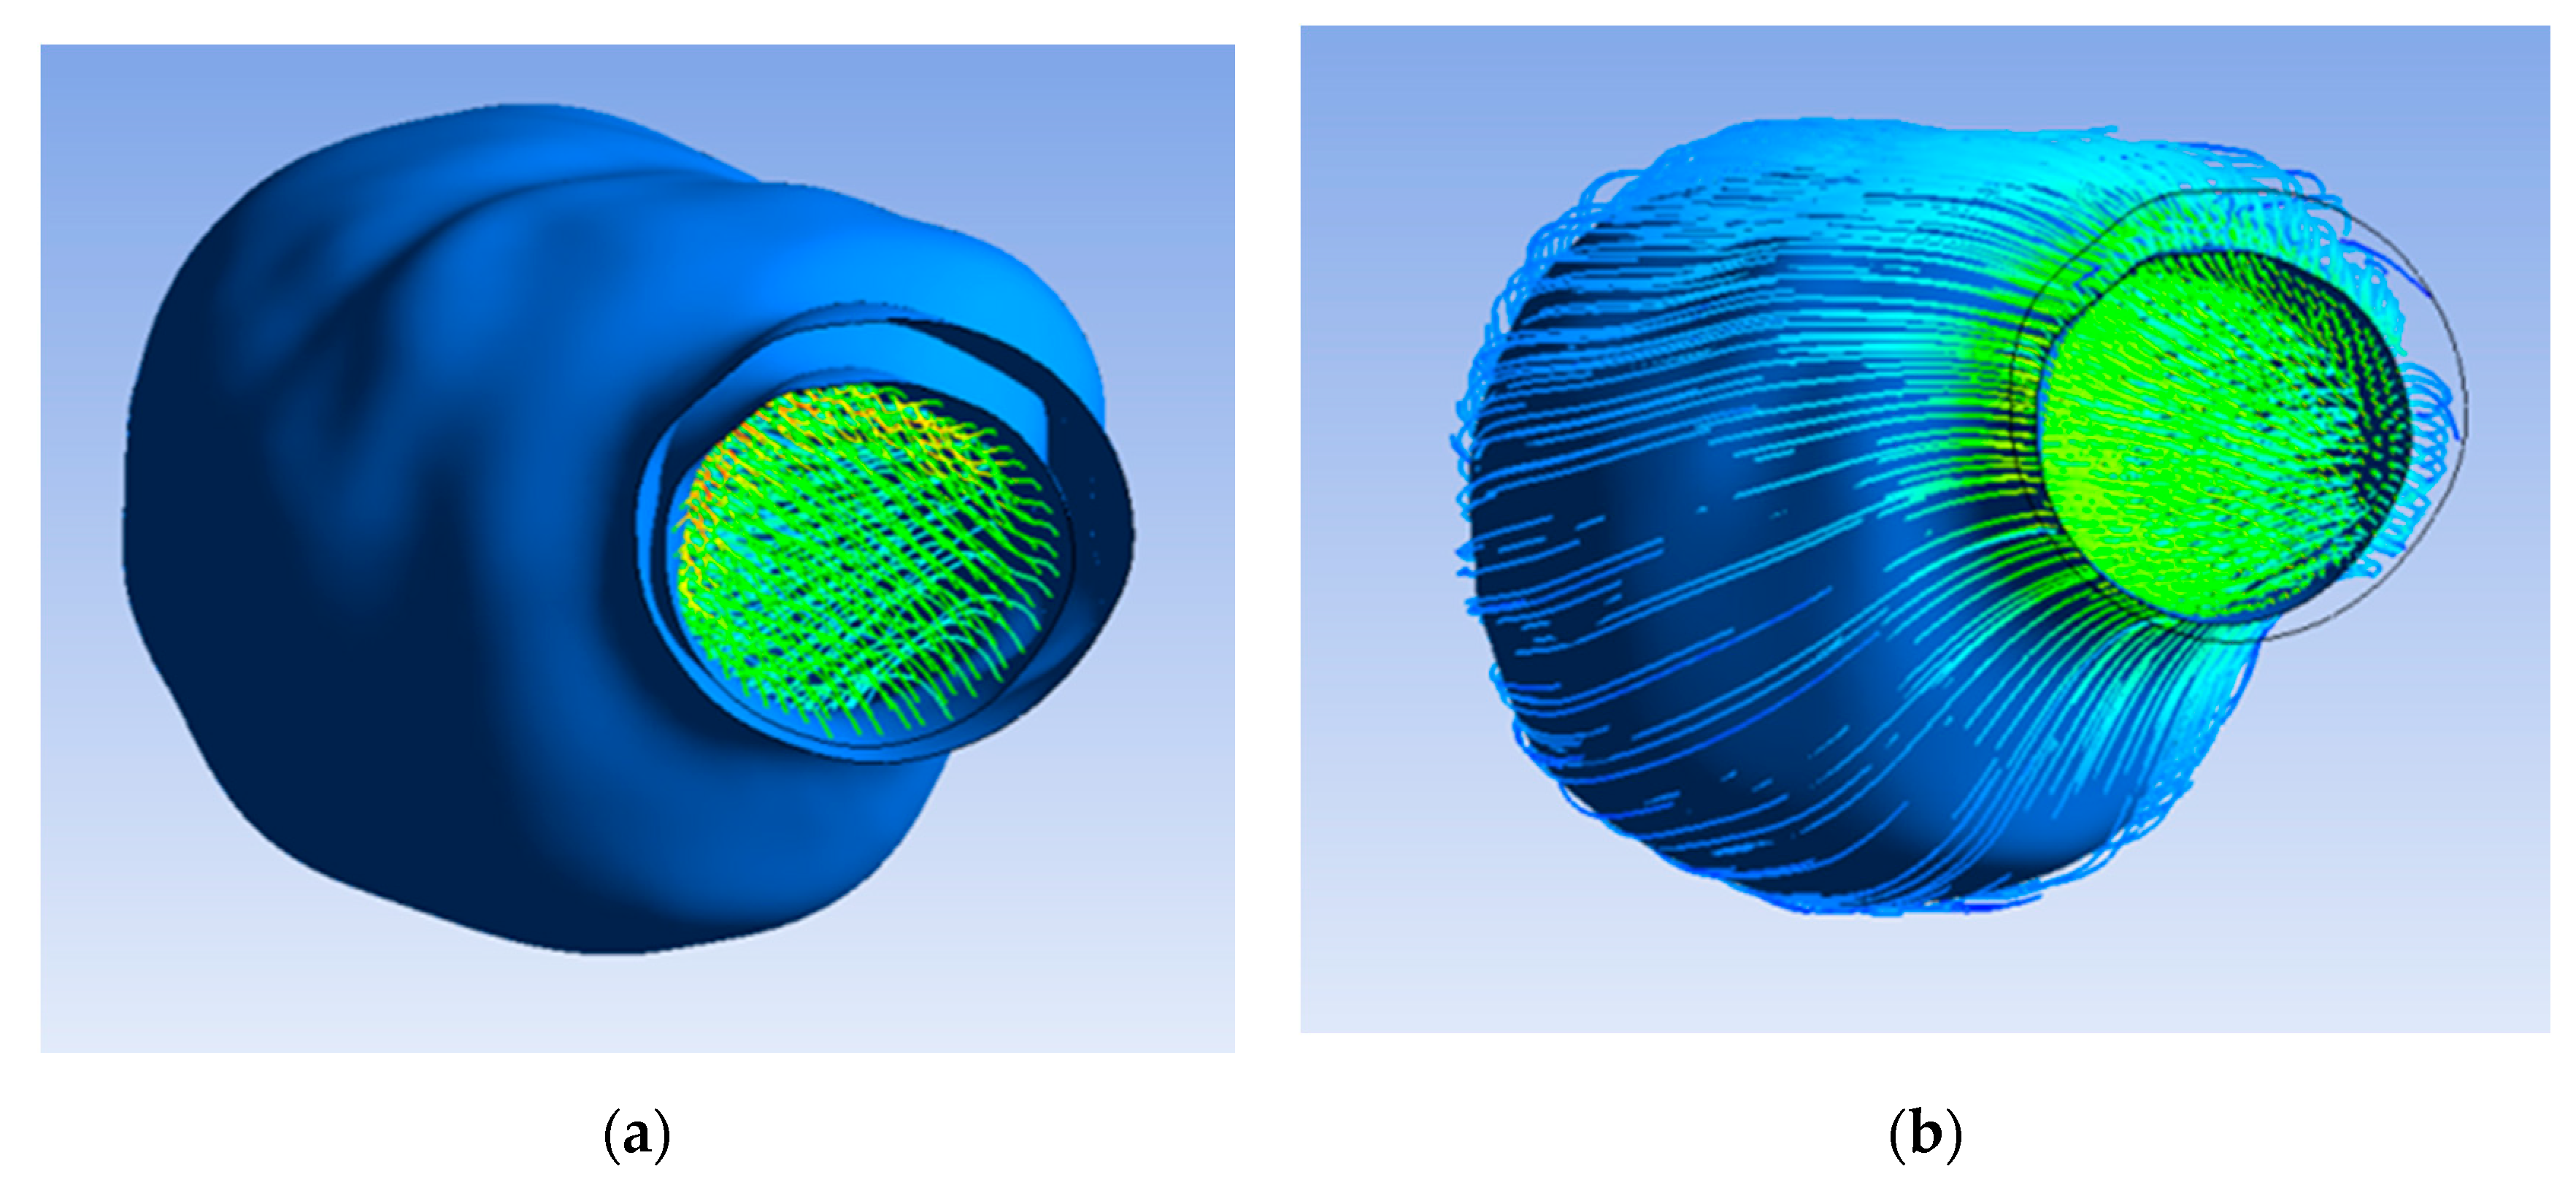
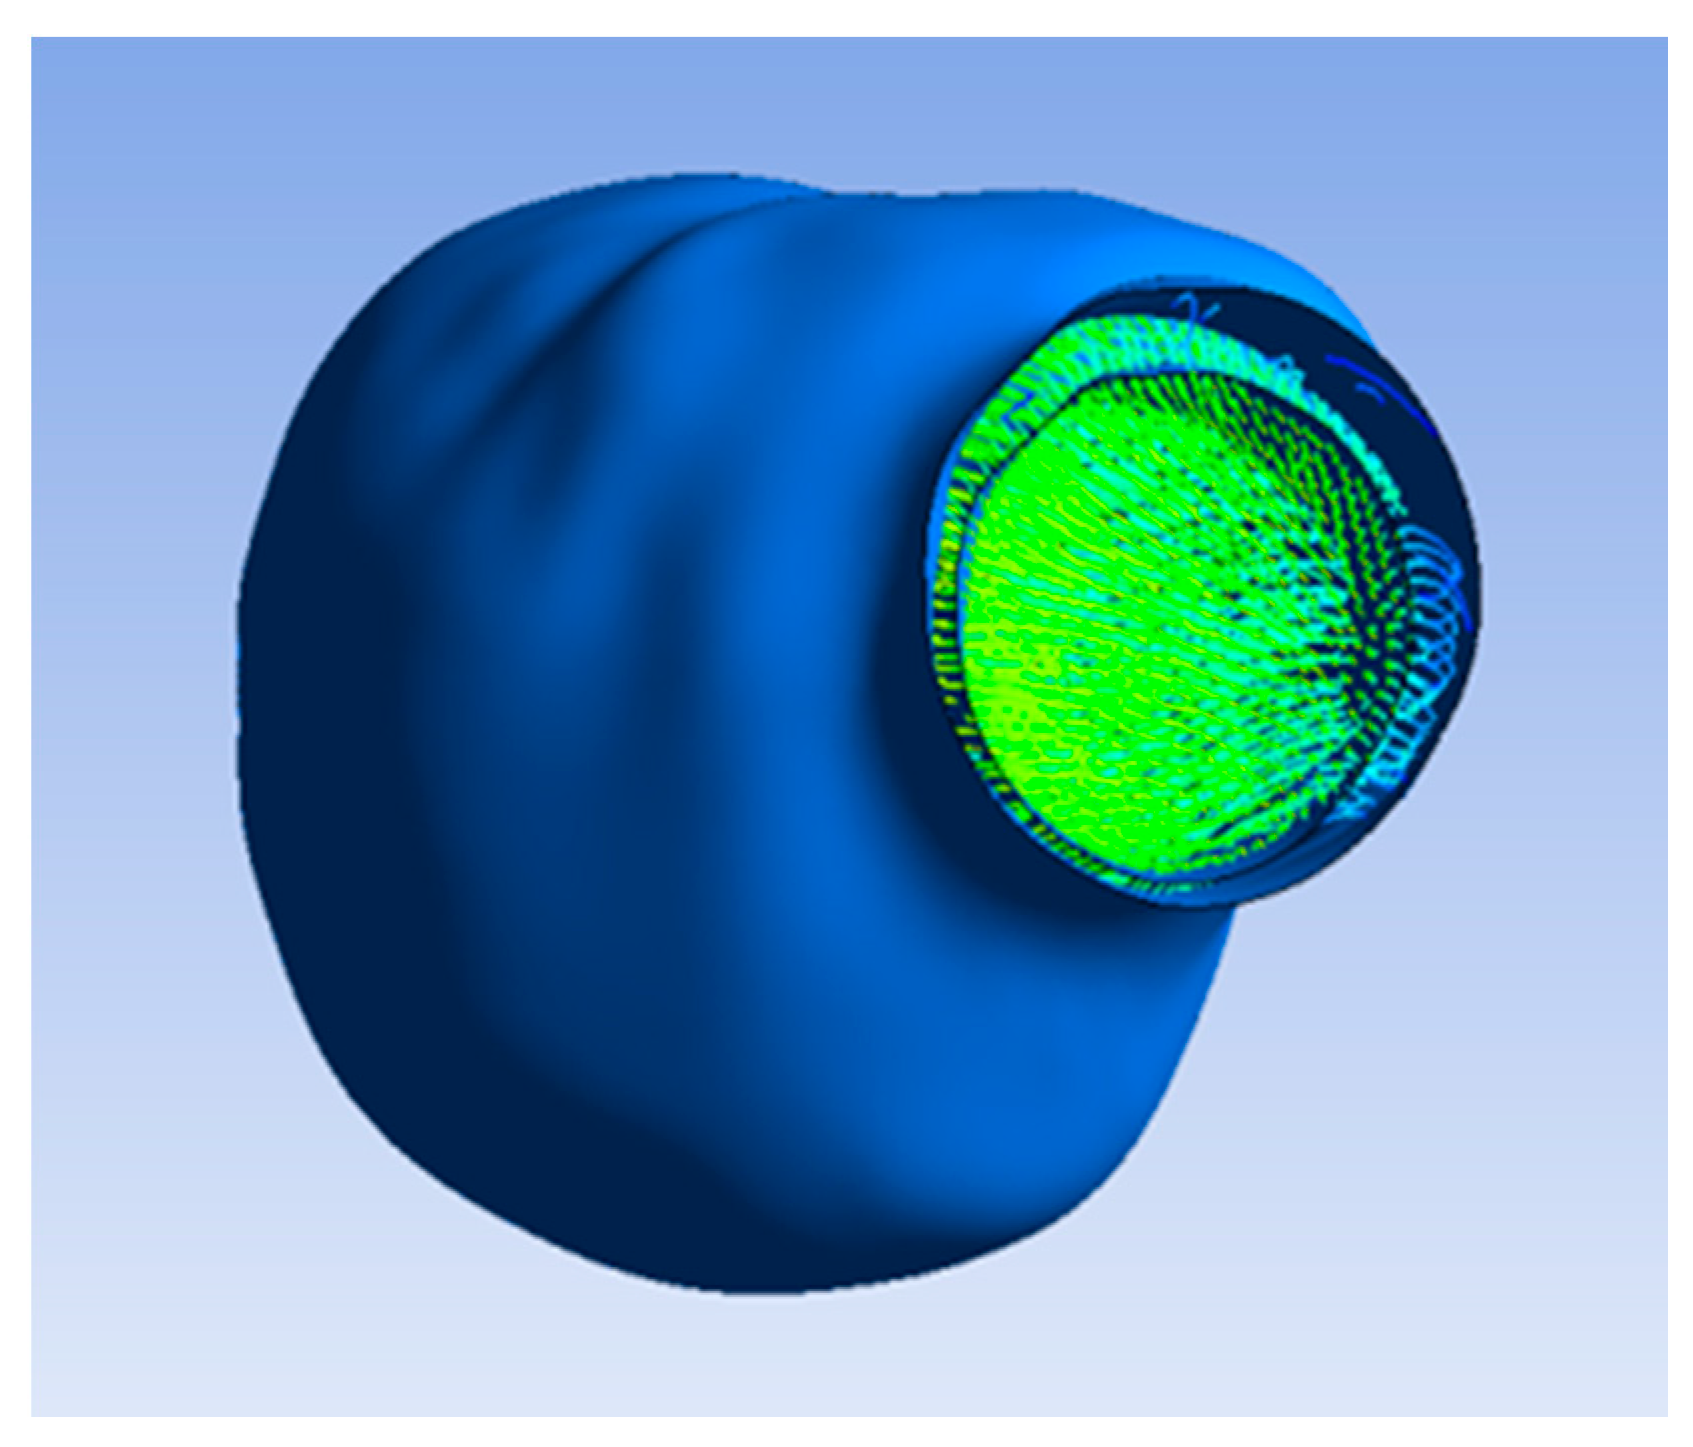
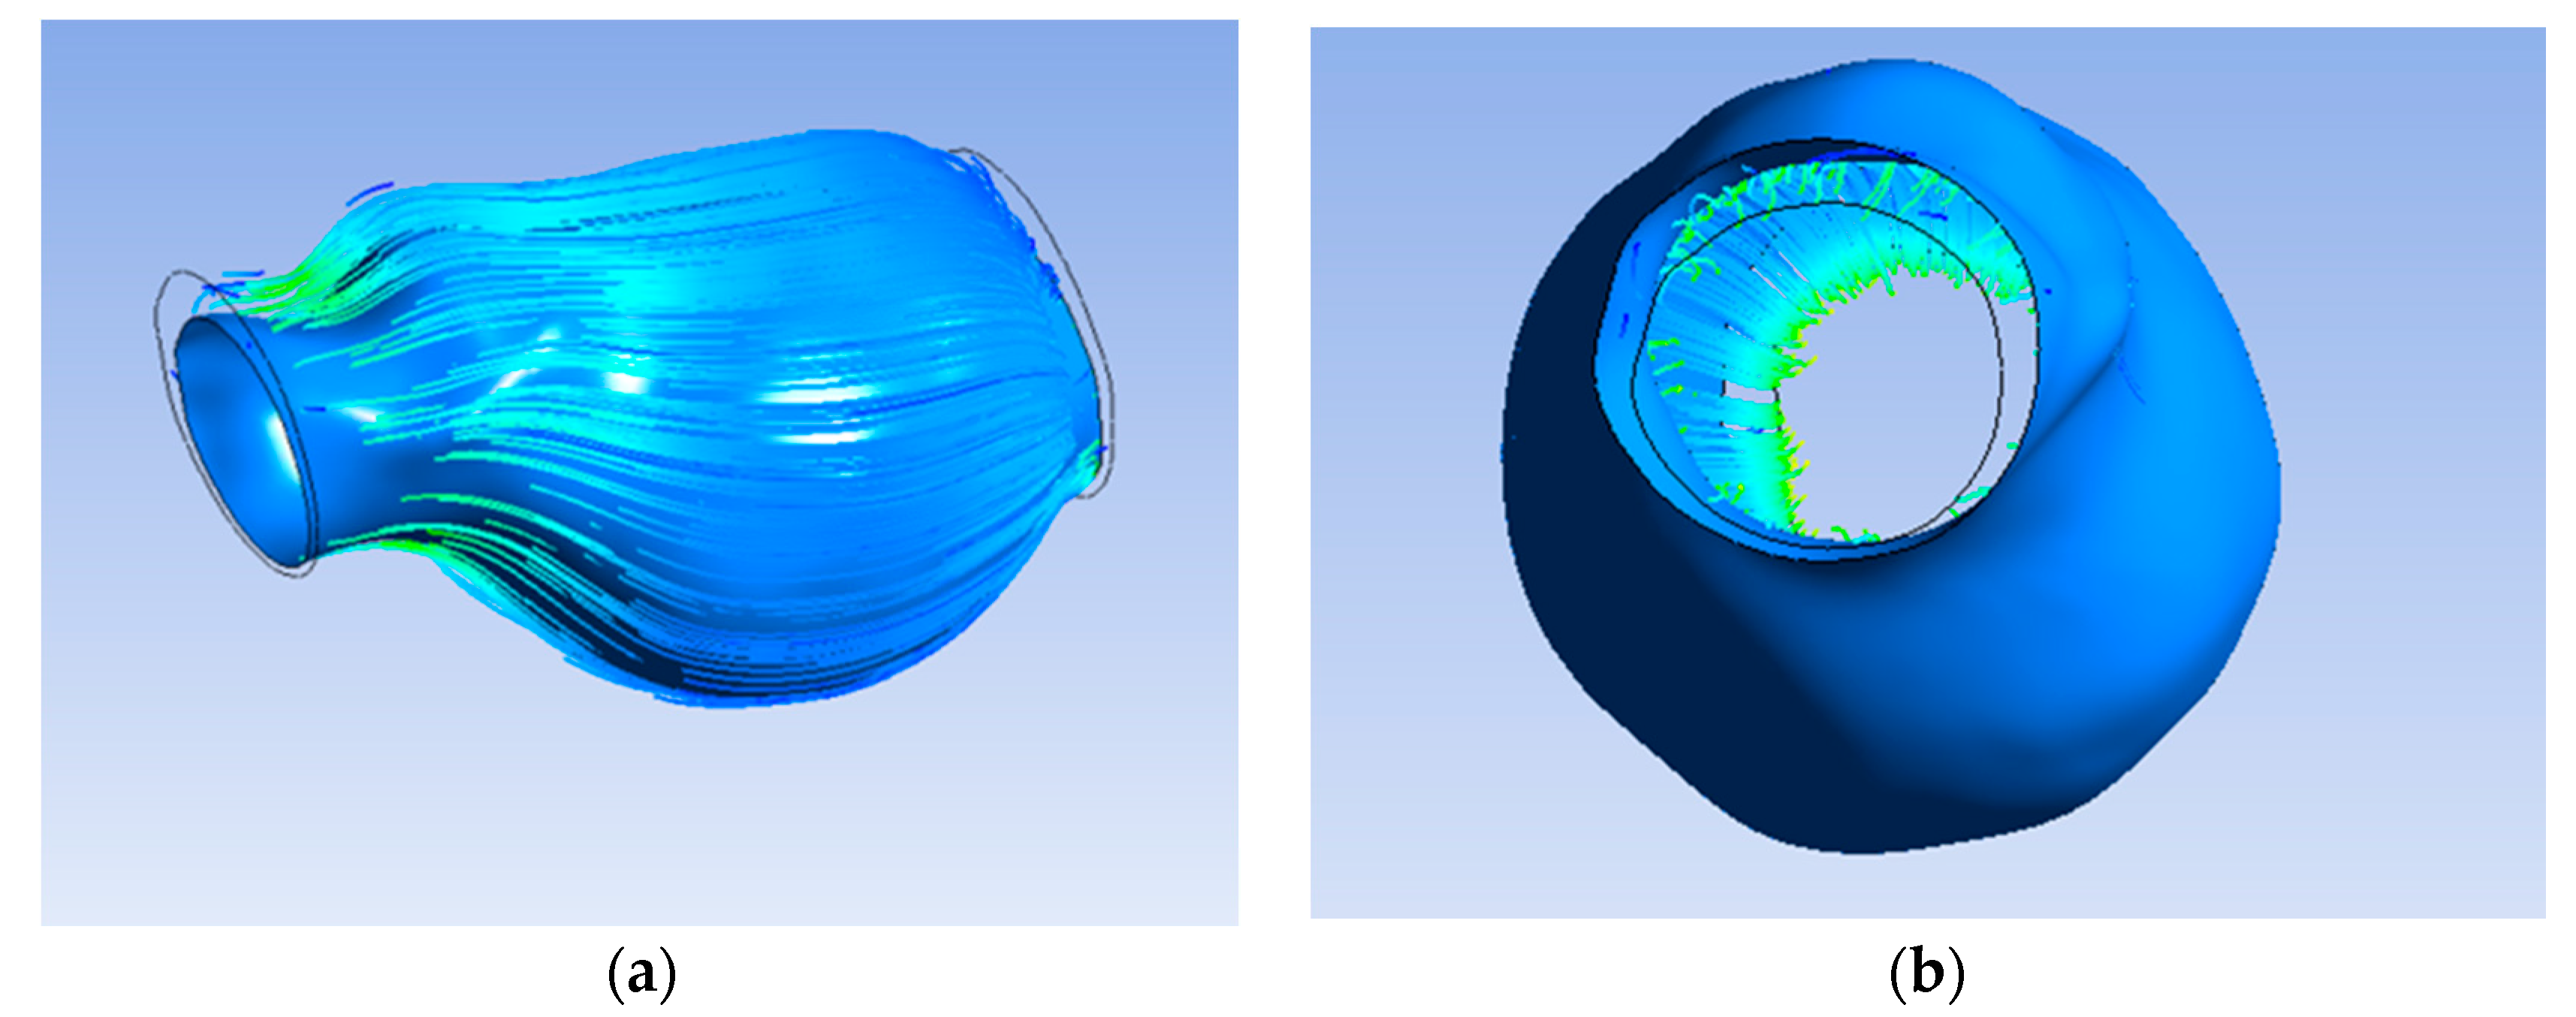
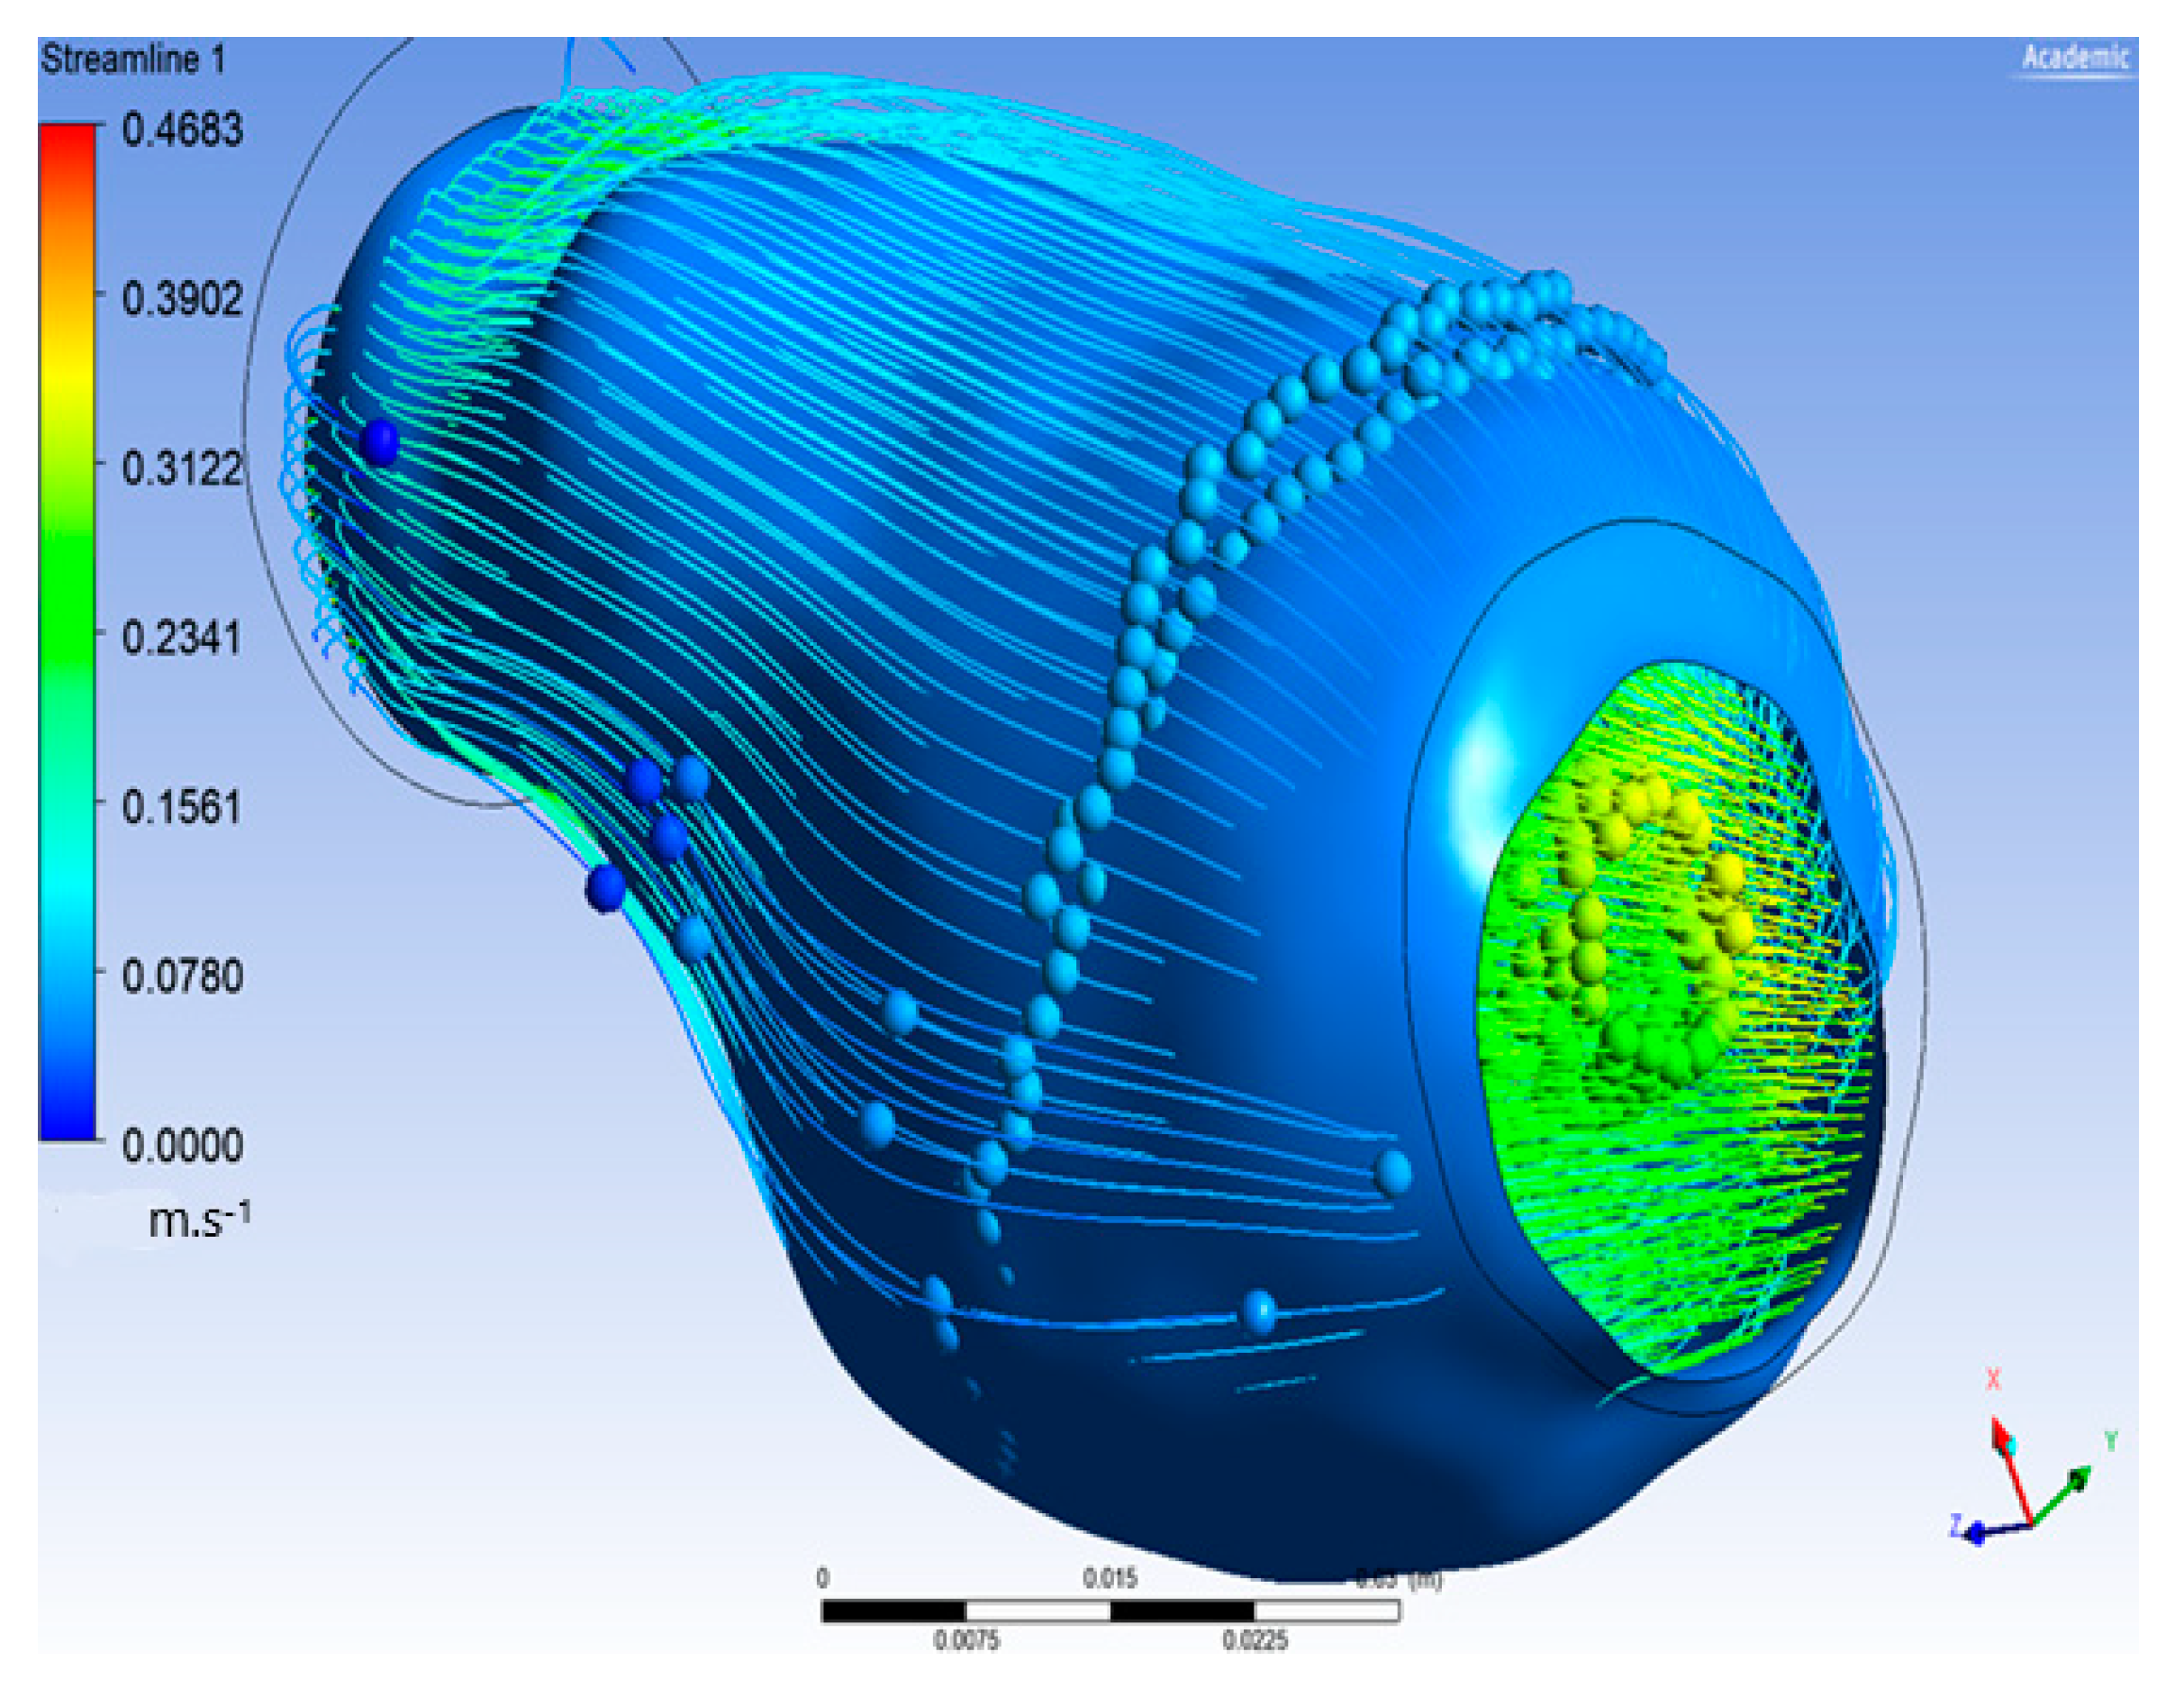
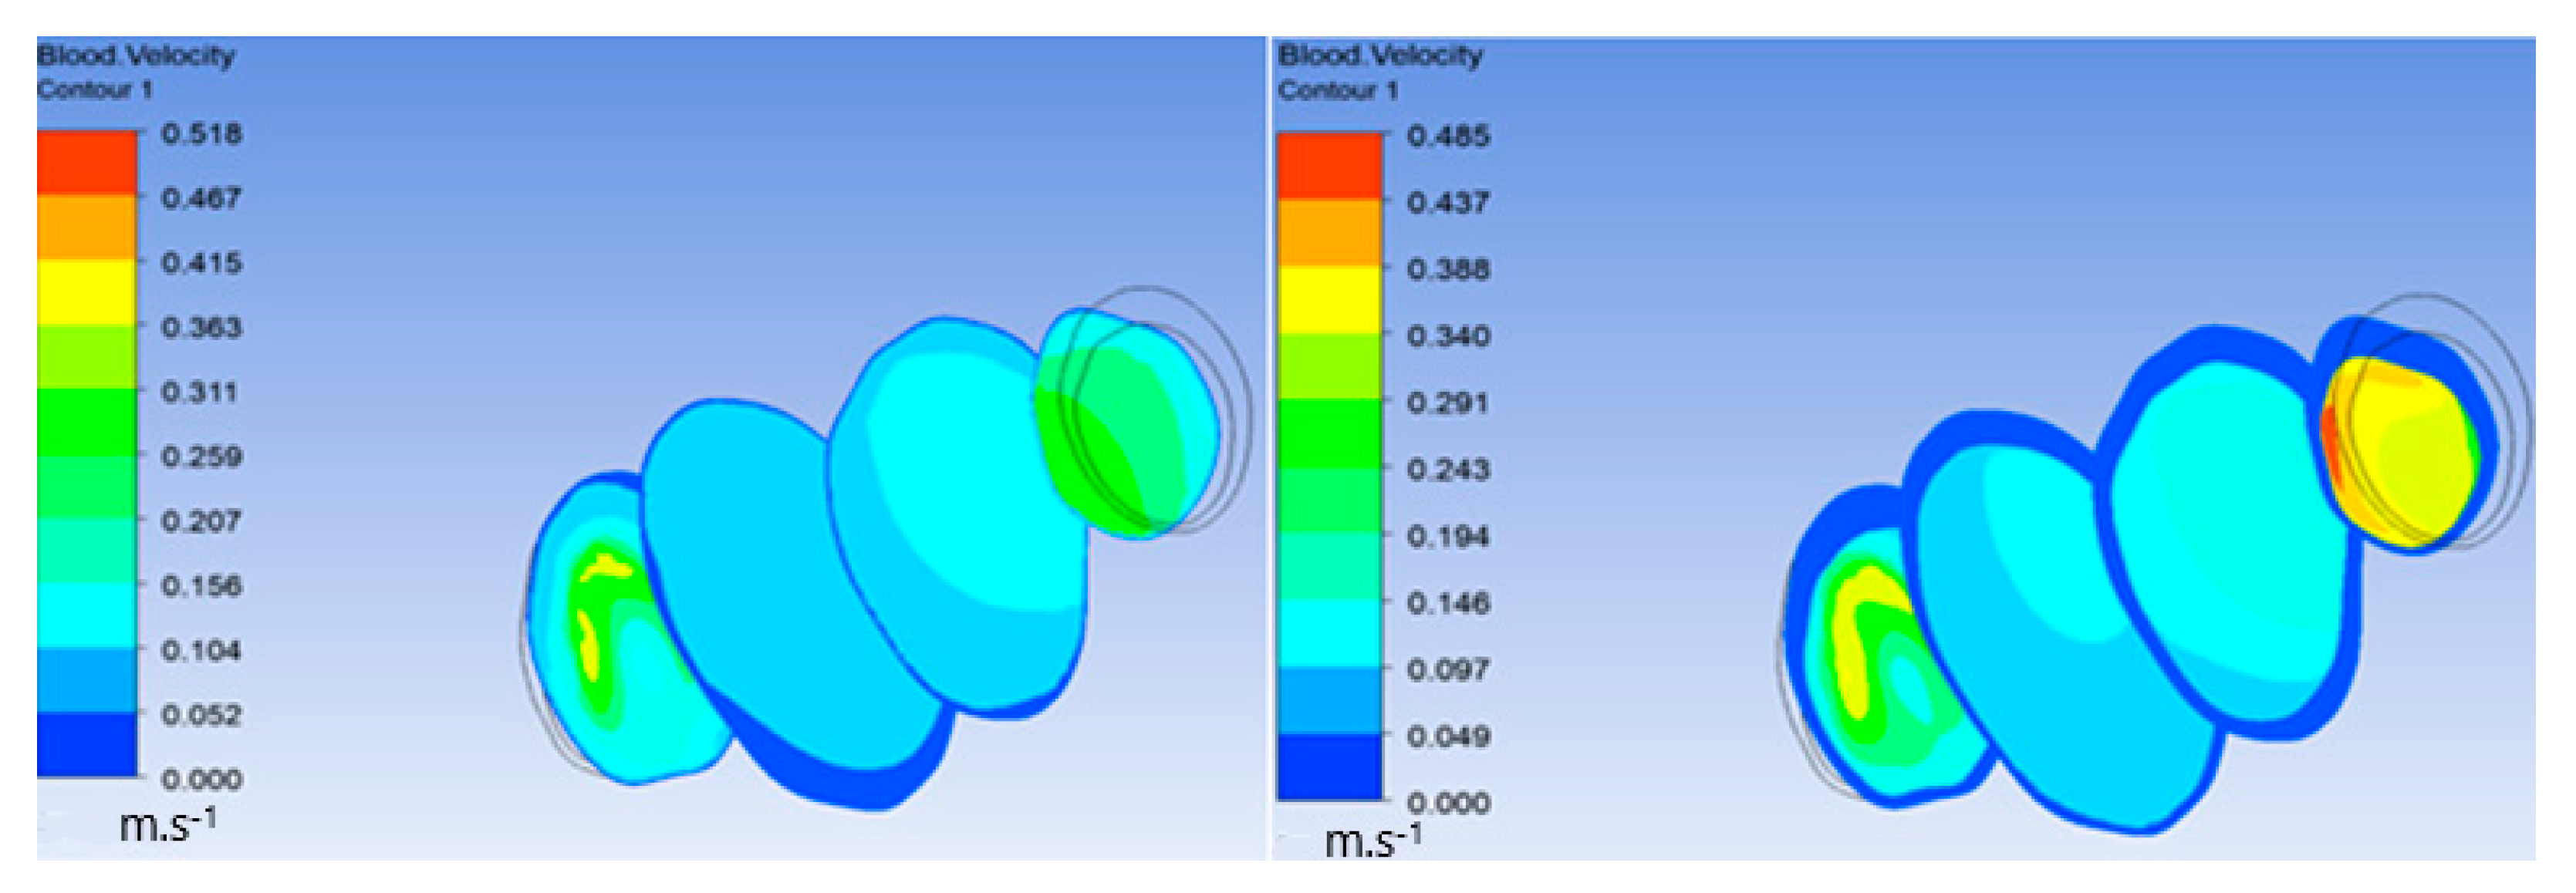
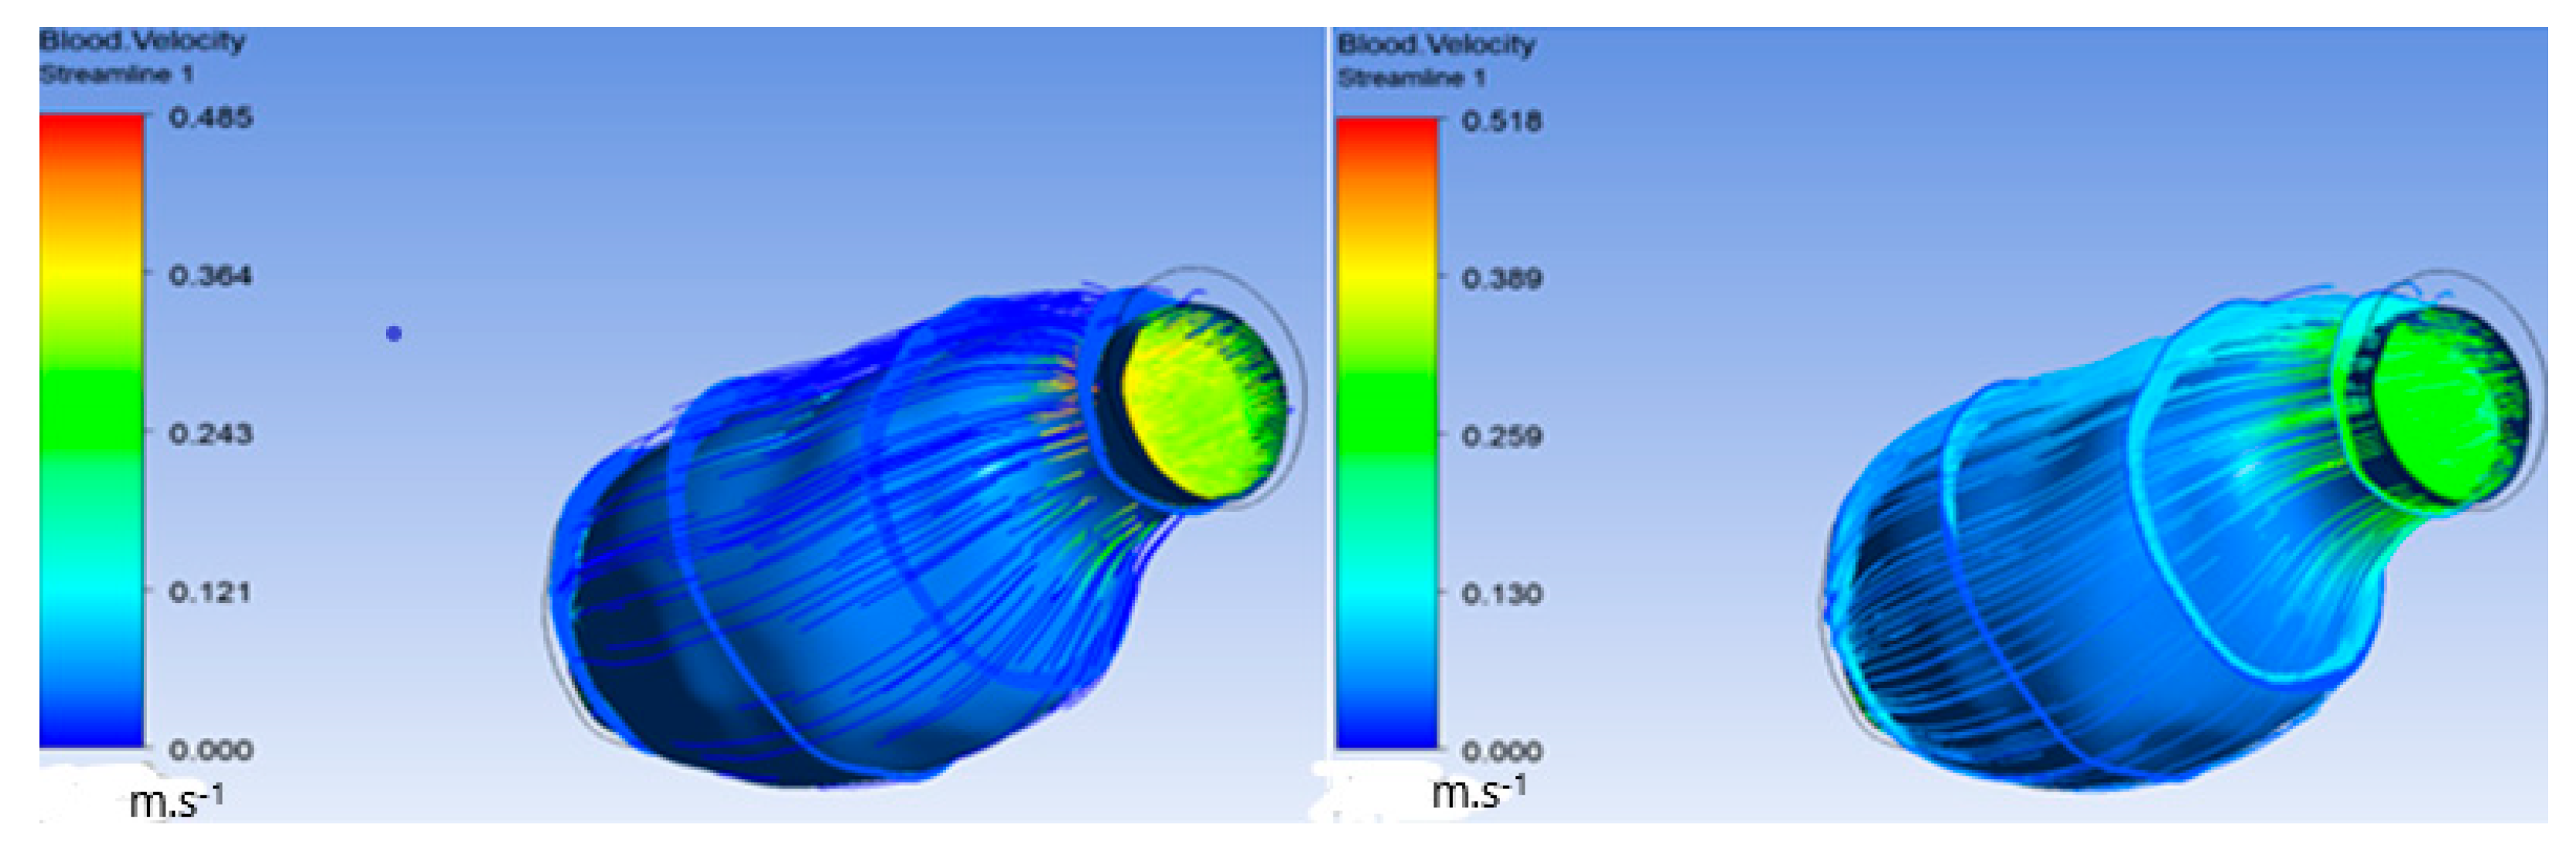
3.2. Velocity
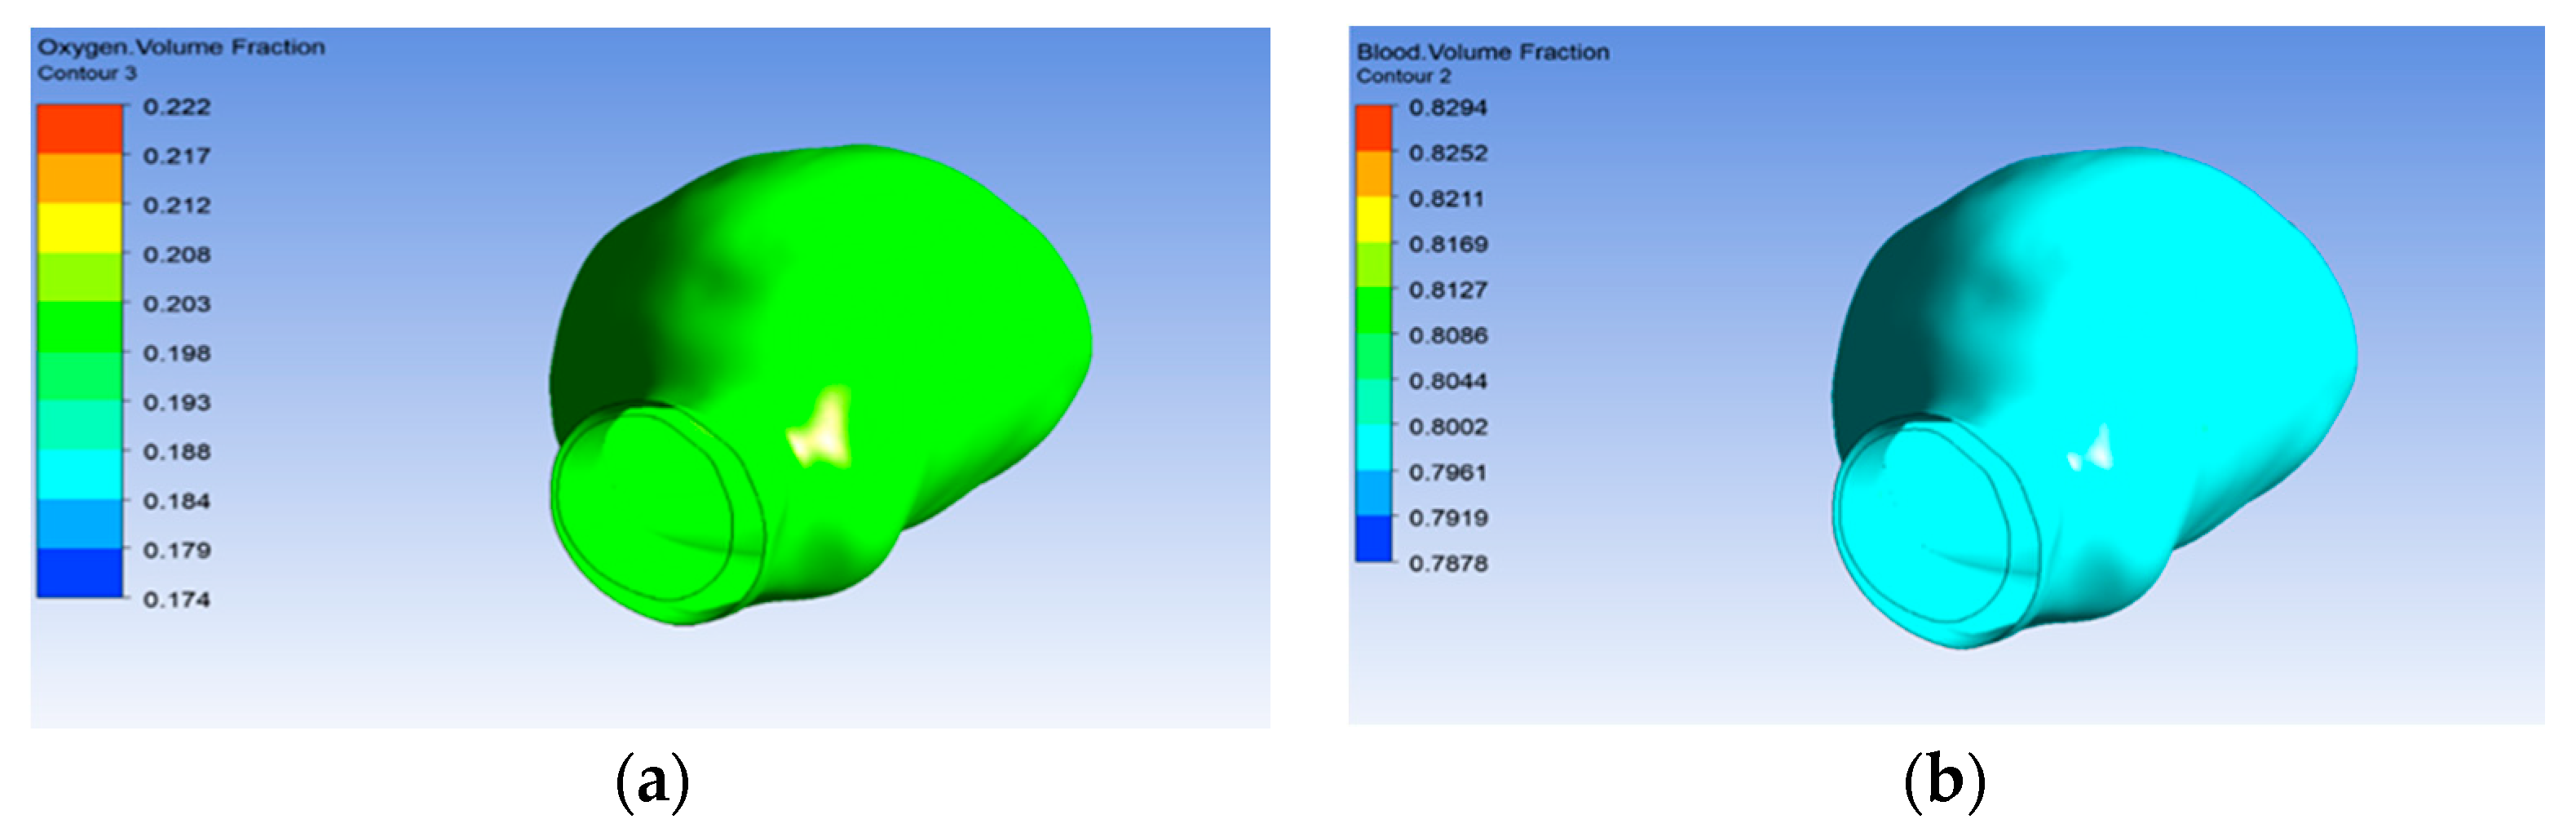
3.3. Oxygen Volume Reaching the Aneurysm Wall
3.4. Wall Shear Stress (WSS) and Pressure
4. Discussion
5. Conclusions
Author Contributions
Funding
Institutional Review Board Statement
Informed Consent Statement
Acknowledgments
Conflicts of Interest
References
- Kumar, D.; Vinoth, R.; Adhikari, R.; Shankar, V. Non-Newtonian and Newtonian blood flow in human aorta: A transient Analysis. Biomed. Res. 2017, 28, 3194–3203. [Google Scholar]
- White, H.J.; Bordes, S.; Borger, J. Anatomy, Abdomen and Pelvis, Aorta; StatPearls Publishing: Treasure Island, FL, USA, 2021. [Google Scholar]
- Yearwood, T.; Chandran, K. Physiological pulsatile flow experiments in a model of the human aortic arch. J. Biomech. 1982, 15, 683–704. [Google Scholar] [CrossRef]
- Kousera, C.A.; Wood, N.B.; Seed, W.A.; Torii, R.; O’Regan, D.; Xu, X.Y. A Numerical Study of Aortic Flow Stability and Comparison With In Vivo Flow Measurements. J. Biomech. Eng. 2013, 135, 011003 (9 pages). [Google Scholar] [CrossRef]
- Yao, L.-S.; Berger, S.A. Entry flow in a curved pipe. J. Fluid Mech. 1975, 67, 177–196. [Google Scholar] [CrossRef]
- Dean, W. Fluid motion in a curved pipe. Proc. R. Soc. Lond. Ser. A 1928, 121, 402. [Google Scholar]
- Dwyer, H.A.; Cheer, A.Y.; Rutaganira, T.; Shacheraghi, N. Calculation of Unsteady Flows in Curved Pipes. J. Fluids Eng. 2001, 123, 869–877. [Google Scholar] [CrossRef]
- Chandran, K.; Yearwood, T.; Wieting, D. An experimental study of pulsatile flow in a curved tube. J. Biomech. 1979, 12, 793–805. [Google Scholar] [CrossRef]
- Chandran, K.; Yearwood, T. Experimental study of physiological pulsatile flow in a curved tube. J. Fluid Mech. 1981, 111, 59–85. [Google Scholar] [CrossRef]
- Morris, P.D.; Narracott, A.; von Tengg-Kobligk, H.; Soto, D.A.S.; Hsiao, S.; Lungu, A.; Evans, P.; Bressloff, N.W.; Lawford, P.V.; Hose, D.R.; et al. Computational fluid dynamics modelling in cardiovascular medicine. Heart 2016, 102, 18–28. [Google Scholar] [CrossRef] [PubMed]
- Li, Z.-Y.; U-King-Im, J.; Tang, T.Y.; Soh, E.; See, T.C.; Gillard, J.H. Impact of calcification and intraluminal thrombus on the computed wall stresses of abdominal aortic aneurysm. J. Vasc. Surg. 2008, 47, 928–935. [Google Scholar] [CrossRef]
- Lederle, F.A.; Wilson, S.E.; Johnson, G.R.; Littooy, F.N.; Acher, C.; Messina, L.M.; Reinke, D.B.; Ballard, D.J. Design of the abdominal aortic Aneurysm Detection and Management Study. J. Vasc. Surg. 1994, 20, 296–303. [Google Scholar] [CrossRef]
- Brown, P.M.; Pattenden, R.; Vernooy, C.; Zelt, D.T.; Gutelius, J.R. Selective management of abdominal aortic aneurysms in a prospective measurement program. J. Vasc. Surg. 1996, 23, 213–222. [Google Scholar] [CrossRef]
- Wang, D.H.; Makaroun, M.S.; Webster, M.W.; Vorp, D. Effect of intraluminal thrombus on wall stress in patient-specific models of abdominal aortic aneurysm. J. Vasc. Surg. 2002, 36, 598–604. [Google Scholar] [CrossRef]
- Vorp, D.A.; Geest, J.P.V. Biomechanical Determinants of Abdominal Aortic Aneurysm Rupture. Arter. Thromb. Vasc. Biol. 2005, 25, 1558–1566. [Google Scholar] [CrossRef]
- Vorp, D.A.; Lee, P.C.; Wang, D.H.; Makaroun, M.S.; Nemoto, E.M.; Ogawa, S.; Webster, M.W. Association of intraluminal thrombus in abdominal aortic aneurysm with local hypoxia and wall weakening. J. Vasc. Surg. 2001, 34, 291–299. [Google Scholar] [CrossRef]
- Harter, L.P.; Gross, B.H.; Callen, P.W.; Barth, R.A. Ultrasonic evaluation of abdominal aortic thrombus. J. Ultrasound Med. 1982, 1, 315–318. [Google Scholar] [CrossRef]
- Wolf, Y.G.; Thomas, W.S.; Brennan, F.J.; Goff, W.G.; Sise, M.J.; Bernstein, E.F. Computed tomography scanning findings associated with rapid expansion of abdominal aortic aneurysms. J. Vasc. Surg. 1994, 20, 529–538. [Google Scholar] [CrossRef][Green Version]
- Inzoli, F.; Boschetti, F.; Zappa, M.; Longo, T.; Fumero, R. Biomechanical factors in abdominal aortic aneurysm rupture. Eur. J. Vasc. Surg. 1993, 7, 667–674. [Google Scholar] [CrossRef]
- Mower, W.R.; Quiñones, W.J.; Gambhir, S.S. Effect of intraluminal thrombus on abdominal aortic aneurysm wall stress. J. Vasc. Surg. 1997, 26, 602–608. [Google Scholar] [CrossRef]
- Di Martino, E.; Mantero, S.; Inzoli, F.; Melissano, G.; Astore, D.; Chiesa, R.; Fumero, R. Biomechanics of abdominal aortic aneurysm in the presence of endoluminal thrombus: Experimental characterisation and structural static computational analysis. Eur. J. Vasc. Endovasc. Surg. 1998, 15, 290–299. [Google Scholar] [CrossRef]
- Dobrin, P.B. Pathophysiology and Pathogenesis of Aortic Aneurysms: Current Concepts. Surg. Clin. N. Am. 1989, 69, 687–703. [Google Scholar] [CrossRef]
- Schurink, G.W.H.; Van Baalen, J.M.; Visser, M.J.T.; Van Bockel, J.H. Thrombus within an aortic aneurysm does not reduce pressure on the aneurysmal wall. J. Vasc. Surg. 2000, 31, 501–506. [Google Scholar] [CrossRef]
- Satta, J.; Läärä, E.; Juvonen, T. Intraluminal thrombus predicts rupture of an abdominal aortic aneurysm. J. Vasc. Surg. 1996, 23, 737–739. [Google Scholar] [CrossRef]
- Laustsen, J.; Paaske, W.P.; Oyre, S.; Pedersen, E.M. Dynamic quantification, visualisation and animation of blood velocities and flows in infrarenal aortic aneurysms in vivo by three-dimensional MR phase velocity encoding. Eur. J. Vasc. Endovasc. Surg. 1995, 9, 383–388. [Google Scholar] [CrossRef][Green Version]
- Faggioli, G.L.; Stella, A.; Gargiulo, M.; Tarantini, S.; D’Addato, M.; Ricotta, J.J. Morphology of small aneurysms: Definition and impact on risk of rupture. Am. J. Surg. 1994, 168, 131–135. [Google Scholar] [CrossRef]
- Vorp, D.A.; Wang, D.H.J.; Raghavan, M.L.; Webster, M.W. Effect of shape of intraluminal thrombus on wall stress in abdominal aortic aneurysm. Biomedical Engineering Society. Ann. Biomed. Eng. 1998, 26, 68. [Google Scholar]
- Adolph, R.; Vorp, D.; Steed, D.L.; Webster, M.W.; Kameneva, M.V.; Watkins, S. Cellular content and permeability of intraluminal thrombus in abdominal aortic aneurysm. J. Vasc. Surg. 1997, 25, 916–926. [Google Scholar] [CrossRef]
- Polzer, S.; Gasser, T.C.; Markert, B.; Bursa, J.; Skacel, P. Impact of poroelasticity of intraluminal thrombus on wall stress of abdominal aortic aneurysms. Biomed. Eng. Online 2012, 11, 1–13. [Google Scholar] [CrossRef] [PubMed]
- Collins, J.-A.; Rudenski, A.; Gibson, J.; Howard, L.; O’Driscoll, R. Relating oxygen partial pressure, saturation and content: The haemoglobin–oxygen dissociation curve. Breathe 2015, 11, 194–201. [Google Scholar] [CrossRef] [PubMed]
- Dwidmuthe, P.; Mathpati, C.; Joshi, J. CFD Simulation of Blood Flow Inside the Human Artery: Aorta. In Proceedings of the 7th International and 45th National Conference on Fluid Mechanics and Fluid Power (FMFP), Mumbai, India, 10–12 December 2018. [Google Scholar]
- Perktold, K. On the paths of fluid particles in an axisymmetrical aneurysm. J. Biomech. 1987, 20, 311–317. [Google Scholar] [CrossRef]
- Finol, E.A.; Keyhani, K.; Amon, C.H. The Effect of Asymmetry in Abdominal Aortic Aneurysms Under Physiologically Realistic Pulsatile Flow Conditions. J. Biomech. Eng. 2003, 125, 207–217. [Google Scholar] [CrossRef] [PubMed]
- Gasser, T.C.; Auer, M.; Labruto, F.; Swedenborg, J.; Roy, J. Biomechanical rupture risk assessment of abdominal aortic aneurysms: Model complexity versus predictability of finite element simulations. Eur. J. Vasc. Endovasc. Surg. 2010, 40, 176–185. [Google Scholar] [CrossRef]
- Bonert, M.; Leask, R.L.; Butany, J.; Ethier, C.R.; Myers, J.G.; Johnston, K.W.; Ojha, M. The relationship between wall shear stress distributions and intimal thickening in the human abdominal aorta. Biomed. Eng. Online 2003, 2, 1–14. [Google Scholar] [CrossRef]
- Kleinstreuer, C.; Li, Z. Analysis and computer program for rupture-risk prediction of abdominal aortic aneurysms. Biomed. Eng. Online 2006, 5, 1–13. [Google Scholar] [CrossRef]
- Okamoto, R.; Hatani, M.; Tsukitani, M.; Suehiro, A.; Fujino, M.; Imai, N.; Takano, S.; Watanabe, Y.; Fukuzaki, H. The effect of oxygen on the development of atherosclerosis in WHHL rabbits. Atherosclerosis 1983, 47, 47–53. [Google Scholar] [CrossRef]
- Crawford, T. Some Observations on the Pathogenesis and Natural History of Intracranial Aneurysms. J. Neurol. Neurosurg. Psychiatry 1959, 22, 259–266. [Google Scholar] [CrossRef]
- Crompton, M.R. Mechanism of Growth and Rupture in Cerebral Berry Aneurysms. BMJ 1966, 1, 1138–1142. [Google Scholar] [CrossRef]
- Couch, N.P. Hemodynamics for Surgeons. Arch. Surg. 1976, 111, 929–930. [Google Scholar] [CrossRef]
- Boyd, A.; Kuhn, D.C.; Lozowy, R.J.; Kulbisky, G.P. Low wall shear stress predominates at sites of abdominal aortic aneurysm rupture. J. Vasc. Surg. 2016, 63, 1613–1619. [Google Scholar] [CrossRef]
- Zhu, C.; Leach, J.R.; Wang, Y.; Gasper, W.; Saloner, D.; Hope, M.D. Intraluminal Thrombus Predicts Rapid Growth of Abdominal Aortic Aneurysms. Vasc. Interv. Radiol. 2020, 294, 707–713. [Google Scholar] [CrossRef]
- Boyd, A.J. Intraluminal thrombus: Innocent bystander or factor in abdominal aortic aneurysm pathogenesis? JVS Vasc. Sci. 2021, 2, 159. [Google Scholar] [CrossRef]
- Ding, Y.; Li, X.; Zhou, M.; Cai, L.; Tang, H.; Xie, T.; Shi, Z.; Fu, W. Factor Xa inhibitor rivaroxaban suppresses experimental abdominal aortic aneurysm progression via attenuating aortic inflammation. Vasc. Pharmacol. 2021, 136, 106818. [Google Scholar] [CrossRef]
- Kazi, M.; Thyberg, J.; Religa, P.; Roy, J.; Eriksson, P.; Hedin, U.; Swedenborg, J. Influence of intraluminal thrombus on structural and cellular composition of abdominal aortic aneurysm wall. J. Vasc. Surg. 2003, 38, 1283–1292. [Google Scholar] [CrossRef]
- Vorp, D.A.; Wang, D.H.J.; Webster, M.W.; Federspiel, W.J. Effect of Intraluminal Thrombus Thickness and Bulge Diameter on the Oxygen Diffusion in Abdominal Aortic Aneurysm. J. Biomech. Eng. 1998, 120, 579–583. [Google Scholar] [CrossRef]


Publisher’s Note: MDPI stays neutral with regard to jurisdictional claims in published maps and institutional affiliations. |
© 2021 by the author. Licensee MDPI, Basel, Switzerland. This article is an open access article distributed under the terms and conditions of the Creative Commons Attribution (CC BY) license (https://creativecommons.org/licenses/by/4.0/).
Share and Cite
Almijalli, M. Does the Intraluminal Thrombus Provoke the Rupture of the Abdominal Aortic Aneurysm Wall? Appl. Sci. 2021, 11, 9941. https://doi.org/10.3390/app11219941
Almijalli M. Does the Intraluminal Thrombus Provoke the Rupture of the Abdominal Aortic Aneurysm Wall? Applied Sciences. 2021; 11(21):9941. https://doi.org/10.3390/app11219941
Chicago/Turabian StyleAlmijalli, Mohammed. 2021. "Does the Intraluminal Thrombus Provoke the Rupture of the Abdominal Aortic Aneurysm Wall?" Applied Sciences 11, no. 21: 9941. https://doi.org/10.3390/app11219941
APA StyleAlmijalli, M. (2021). Does the Intraluminal Thrombus Provoke the Rupture of the Abdominal Aortic Aneurysm Wall? Applied Sciences, 11(21), 9941. https://doi.org/10.3390/app11219941