Article

Fretting Fatigue Experiment and Finite Element Analysis for Dovetail Specimen at High Temperature

1
School of Energy and Power Engineering, Beihang University, Beijing 102206, China
2
Beijing Aerospace Propulsion Institute, Beijing 100076, China
3
Aero Engine Academy of China, Beijing 101304, China
4
Beijing Key Laboratory of Aero-Engine Structure and Strength, Beijing 102206, China
5
Research Institute of Aero-Engine, Beihang University, Beijing 102206, China
*
Author to whom correspondence should be addressed.
Appl. Sci. 2021, 11(21), 9913; https://doi.org/10.3390/app11219913
Submission received: 26 September 2021 / Revised: 18 October 2021 / Accepted: 21 October 2021 / Published: 23 October 2021

Abstract

:
The dovetail attachment between the turbine blade and disk for an aero-engine operates under varying centrifugal load and vibration at elevated temperatures. The fretting fatigue is prone to occur at the contact surface of the dovetail attachment. This paper investigated the fretting fatigue behavior of the dovetail specimen at 630 °C through experiment and numerical simulation, in which the blade-like dovetail specimen is nickel-based single crystal superalloy DD10 while two fretting pads in contact with the dovetail specimen simulating the mortise of the disk are made of powder metallurgy FGH99. It is revealed from all the tests that the fracture induced by the fretting wear occurs at the upper edge area of the contact surface. The contact surface near the upper edge is more severely worn; hence, the phenomenon of partition on the worn contact surface can be observed, which is consistent with the fretting fatigue mechanism. Moreover, the calculated area of maximum contact pressure gradient through finite element method is in good agreement with the experimental position of the initial fretting fatigue cracks.

1. Introduction

Fretting fatigue is prevalent in the contact structure for an aero-engine, especially in the blade-disk connecting structure, such as the dovetail attachment [1]. Due to the vibration caused by the impact of high-temperature airflow and the varying centrifugal load, the contact surfaces of the dovetail attachment are prone to fretting fatigue [2]. Typical characteristics of fretting fatigue are fretting wear debris and pitting corrosion on the dovetail contact surfaces. Fretting wear will lead to the crack initiation and then crack propagation, which causes a severe non-containment accident of the aero-engine [3]. According to the statistics from the United States Air Force (USAF) from 1982 to 1995, 62.5% of aero-engine failures belonged to high cycle fatigue (HCF) failures, of which 1/6 were caused by the fretting fatigue [4]. Therefore, it is imperative to study the fretting fatigue in the aero-engine under increasingly harsh working conditions.
The most effective method to study the behavior of fretting fatigue is a fretting test. The American Society for Testing and Material (ASTM) committee passed the “Fretting Fatigue Test Standard Guide” [5], which summarizes the current research status in the field of fretting testing. In general, previous studies explored two popular forms of structure for fretting fatigue tests involving the typical plane-type [6,7,8,9,10] shown in Figure 1a,b, and the dovetail-type [11,12,13,14] shown in Figure 1c,d.
The earliest typical plane-type fretting fatigue test used bridge-type fretting pads [10] and these remained popular until the 1990s as shown in Figure 1a. Then, the more convenient block-type pads [8] replaced the bridge-type pads, which can simulate different contact forms such as spherical contact and cylindrical surface contact shown in Figure 1b. The fretting load condition on the contact surface is established by the reciprocating axial load σ applied on the plane specimen, the constant normal pressure P and tangential force Q. These critical parameters of fretting fatigue test can be readily measured and controlled. Therefore, a great deal of experimental research combined with numerical analysis into fretting fatigue behavior has focused on this type of test device [15,16,17,18], which is helpful to study the mechanical property of fretting fatigue.
Although the typical plane-type arrangement can well explain the fretting fatigue mechanism, it cannot fully reflect the mechanical characteristics and micro-slip state of the real dovetail attachment structure in an aero-engine. Hence, the dovetail-type joint structure of the fretting fatigue test was gradually employed to simulate the fretting condition by applying alternating tensile force FC on the dovetail-type specimen as shown in Figure 1c,d. The resulting micro-slip between the contact surfaces of the experimental specimen can well reproduce the micro-motion state of the real dovetail attachment structure in the aero-engine [19,20]. The contact structure for the dovetail-type specimen can be divided into two different forms in the fretting fatigue experiments, one is direct contact [20,21] as shown in Figure 1c, and the other is through the fretting pads [19,22] as shown in Figure 1d. The later form has obvious advantages; firstly, the worn fretting pads can be quickly replaced; secondly, the material and shape of fretting pads can be easily changed. Based on this form, the paper completed the fretting fatigue test using the actual blade and disk materials in the areo-engine at high temperature.
During the fretting fatigue test, fretting wear will inevitably occur on the contact surface [23]. Fretting wear is affected by many factors [24], among which temperature is an important one for the dovetail attachment in the areo-engine. High temperature will cause an oxide layer on the contact surface, which will participate in the process of fretting wear [25]. Both the depth of fretting wear and the initial crack position will be affected by the oxide layer. Therefore, the presence of the oxide layer will lead to different degrees of wear at different areas, and there will be a theoretical partition phenomenon on the fretting surface [14]. This phenomenon was observed in the present experimental study and analyzed combined with numerical computation.
Numerical computation analysis of the fretting fatigue experiment was usually carried out with finite element method [26,27,28,29]. It is clear that the finite element model needs to have a very fine mesh on the contact surface to ensure the accuracy, which leads to a reduction of efficiency greatly. Hence, most of the studies sacrificed some accuracy to improve the efficiency by using a 2D model instead of a 3D model [14,22], creating sub-modeling [30], and the method of semi-analytical [31]. Although these methods can speed up the numerical calculation, this paper adopts the fully 3D finite element model of the original structure to obtain a more accurate stress distribution on the contact surface. During the analysis, augmented Lagrange algorithm methods of representing the contact constraints were used and it is finally confirmed that the calculated results are in good agreement with the experimental results.
The paper aims to study the fretting fatigue behavior of dovetail specimens in contact with fretting pads at high temperature. A set of clamping structures for the specimens and heating coils are designed for the fretting fatigue experiment. Surface morphologies of the fretting wear are observed through the scan electron microscopy (SEM). Finite element method (FEM) analysis considering crystal plasticity is applied to the contact state and stress distribution. Moreover, the theoretical partition phenomenon on the contact surface caused by the different degrees of fretting wear is observed and confirmed in the experimental investigation. This paper is arranged as follows. The experimental details are introduced and analyzed in Section 2. Section 3 discusses the method of numerical calculation elaborately. In Section 4, the experimental results are mainly stated including the fitted curve for the fretting fatigue life and the observation results using SEM. In Section 5, the numerical calculation results based on the finite element method are analyzed and compared with the experimental results. Section 6 summarizes and concludes the present research.

2. Experimental Details

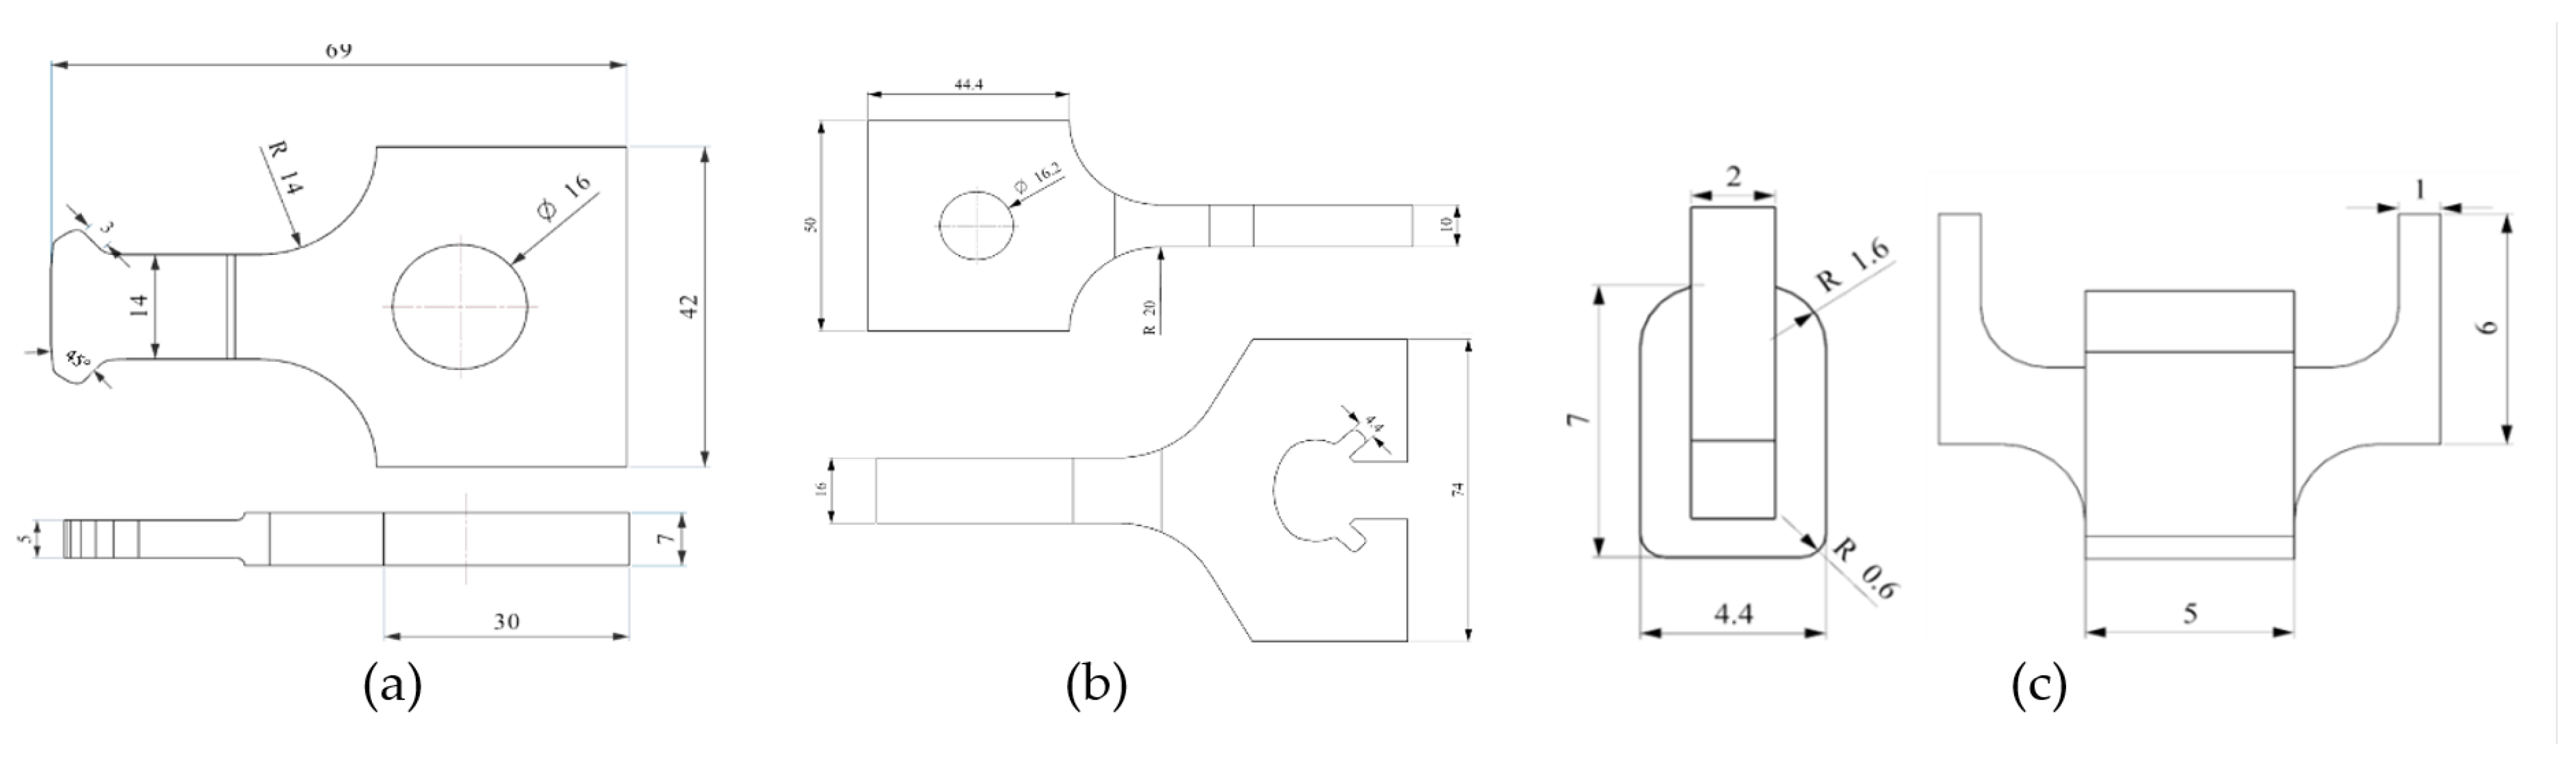
2.1. Materials and Specimens

In the experimental research of this article, the materials used for processing the specimens are DD10 nickel-based single crystal superalloy and FGH99 powder metallurgy. DD10 is the representative material found in the aero-engine turbine blades for its extraordinary thermal-mechanical fatigue resistance, and the dovetail specimens are cut from the DD10 plate. The fretting pads in contact with the dovetail specimens are machined from the material of FGH99, which is usually used in turbine disks of aero-engine. The chemical composition of DD10 nickel-based single crystal superalloy and FGH99 powder metallurgy are shown in Table 1 and Table 2.
Figure 2 shows the three-dimensional diagram and the specific geometrical dimensions of the specimen. The horn-shaped structure on the fretting pad shown in Figure 2c is to facilitate the installation and removal of the fretting pads, for the high temperature will cause the fretting pads to stick to the grooves of the clamp. The pad can be easily removed and replaced by hitting the horn-shaped structure on the fretting pad with a hammer. The angle between the contact surface and the bottom surface of the dovetail specimen is 45°, which is a classic value used in the fretting fatigue test for the turbine engine [13]. Eight DD10 specimens and 16 fretting pads were machined for eight cases of the fretting fatigue test. Although fretting wear and micro-cracks may be seen in the fretting pads, the pads will not fail. Therefore, in this paper we mainly focus on the fretting fatigue behavior of the DD10 specimens.

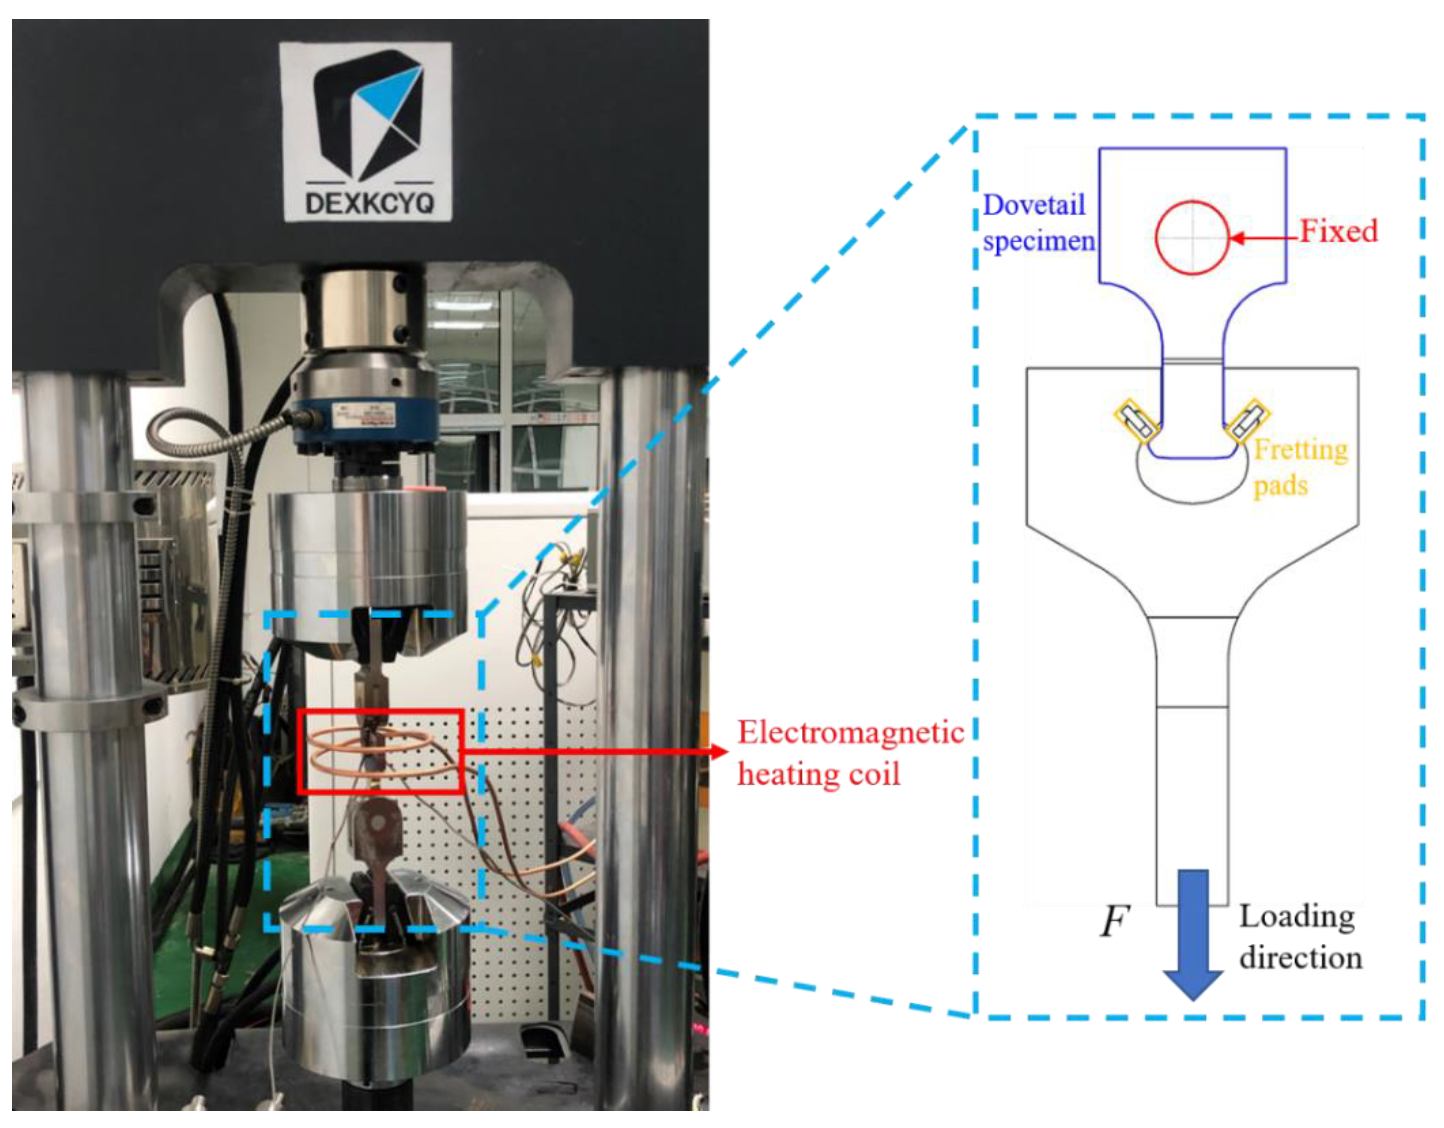
2.2. Procedures of Fretting Fatigue Experiment

The dovetail attachment in an aero-engine is subjected to the fluctuating centrifugal and tangential forces originating from the aerodynamic impact [32]. However, compared with the centrifugal force, the tangential force caused by the airflow impact is much smaller, which is usually simplified, and the fretting fatigue damage is mainly caused by the centrifugal force [20]. Therefore, a uniaxial tensile fatigue machine was used to perform the fretting fatigue test shown in Figure 3. The dovetail configuration tested in the present work is similar to the one used by Conner [19], but the fretting pads are redesigned to better adapt to the testing condition. The assembled attachment structure shown in the blue dashed wireframe of Figure 3 is fixed on the test apparatus through the circular pins on the top and bottom, respectively. The loads applied rely on the DEXKCYQ DPL9010 servo-hydraulic system, providing a maximum tensile force of 100 kN. When the axial fatigue load is applied on the dovetail configuration, both contact surfaces of the dovetail specimen joint on the fretting pads simultaneously. It should be reminded that the contact torque induced by the reaction force can be ignored [12].
The fretting test was carried out at a uniform temperature of 630 °C and the electromagnetic induction coil is capable of heating an elevated temperature to a maximum of 1000 °C. To achieve uniform heating of the assembled dovetail specimen, a heating system of electromagnetic induction coil was designed and manufactured marked by the red wireframe in Figure 3. The heater consists of two heating coils, the diameter of which is 20 cm. The real-time temperature is monitored by 4 K-type thermocouples welded on the dovetail specimen and is maintained constant through a feedback adjustment mechanism of the heating system.
Four load conditions were performed for the test and the specific parameters are shown in Table 3. The load ratio is 0.05 with an alternating load of 1 Hz. Before the dovetail specimen was fixed to the clamp, the surfaces in contact with the fretting pads were cleaned using acetone to remove the oil and impurities. After all the specimens were fixed on the servo-hydraulic system, the electromagnetic heating coil should be turned on firstly to heat the specimen to the target value of temperature. Then the servo-hydraulic system for the fretting fatigue test was turned on and two dovetail specimens were tested at each load condition on the apparatus. The test was paused intermittently once the dovetail specimen failed, then the dovetail specimen and the two fretting pads were replaced.
After all the specimens were tested, the contact surfaces and fracture of the dovetail specimens were observed with a Scanning Electron Microscope (ZEISS EVO18 Special Edition). The samples prepared for the SEM observation should be machined into small pieces to stick to the observation platform. The characteristics of the worn contact surface and the fretting fatigue on the failed fracture surface can be observed through the SEM. Through the observation of SEM, the results calculated from the finite element model can be compared and verified with the observed and tested results. It needs to be pointed out that the contact pressure of the current test configuration cannot be measured directly. Therefore, the numerical analysis based on the finite element method was carried out to investigate the contact pressure distribution under fretting fatigue load described in the latter section.

3. Numerical Simulation Method

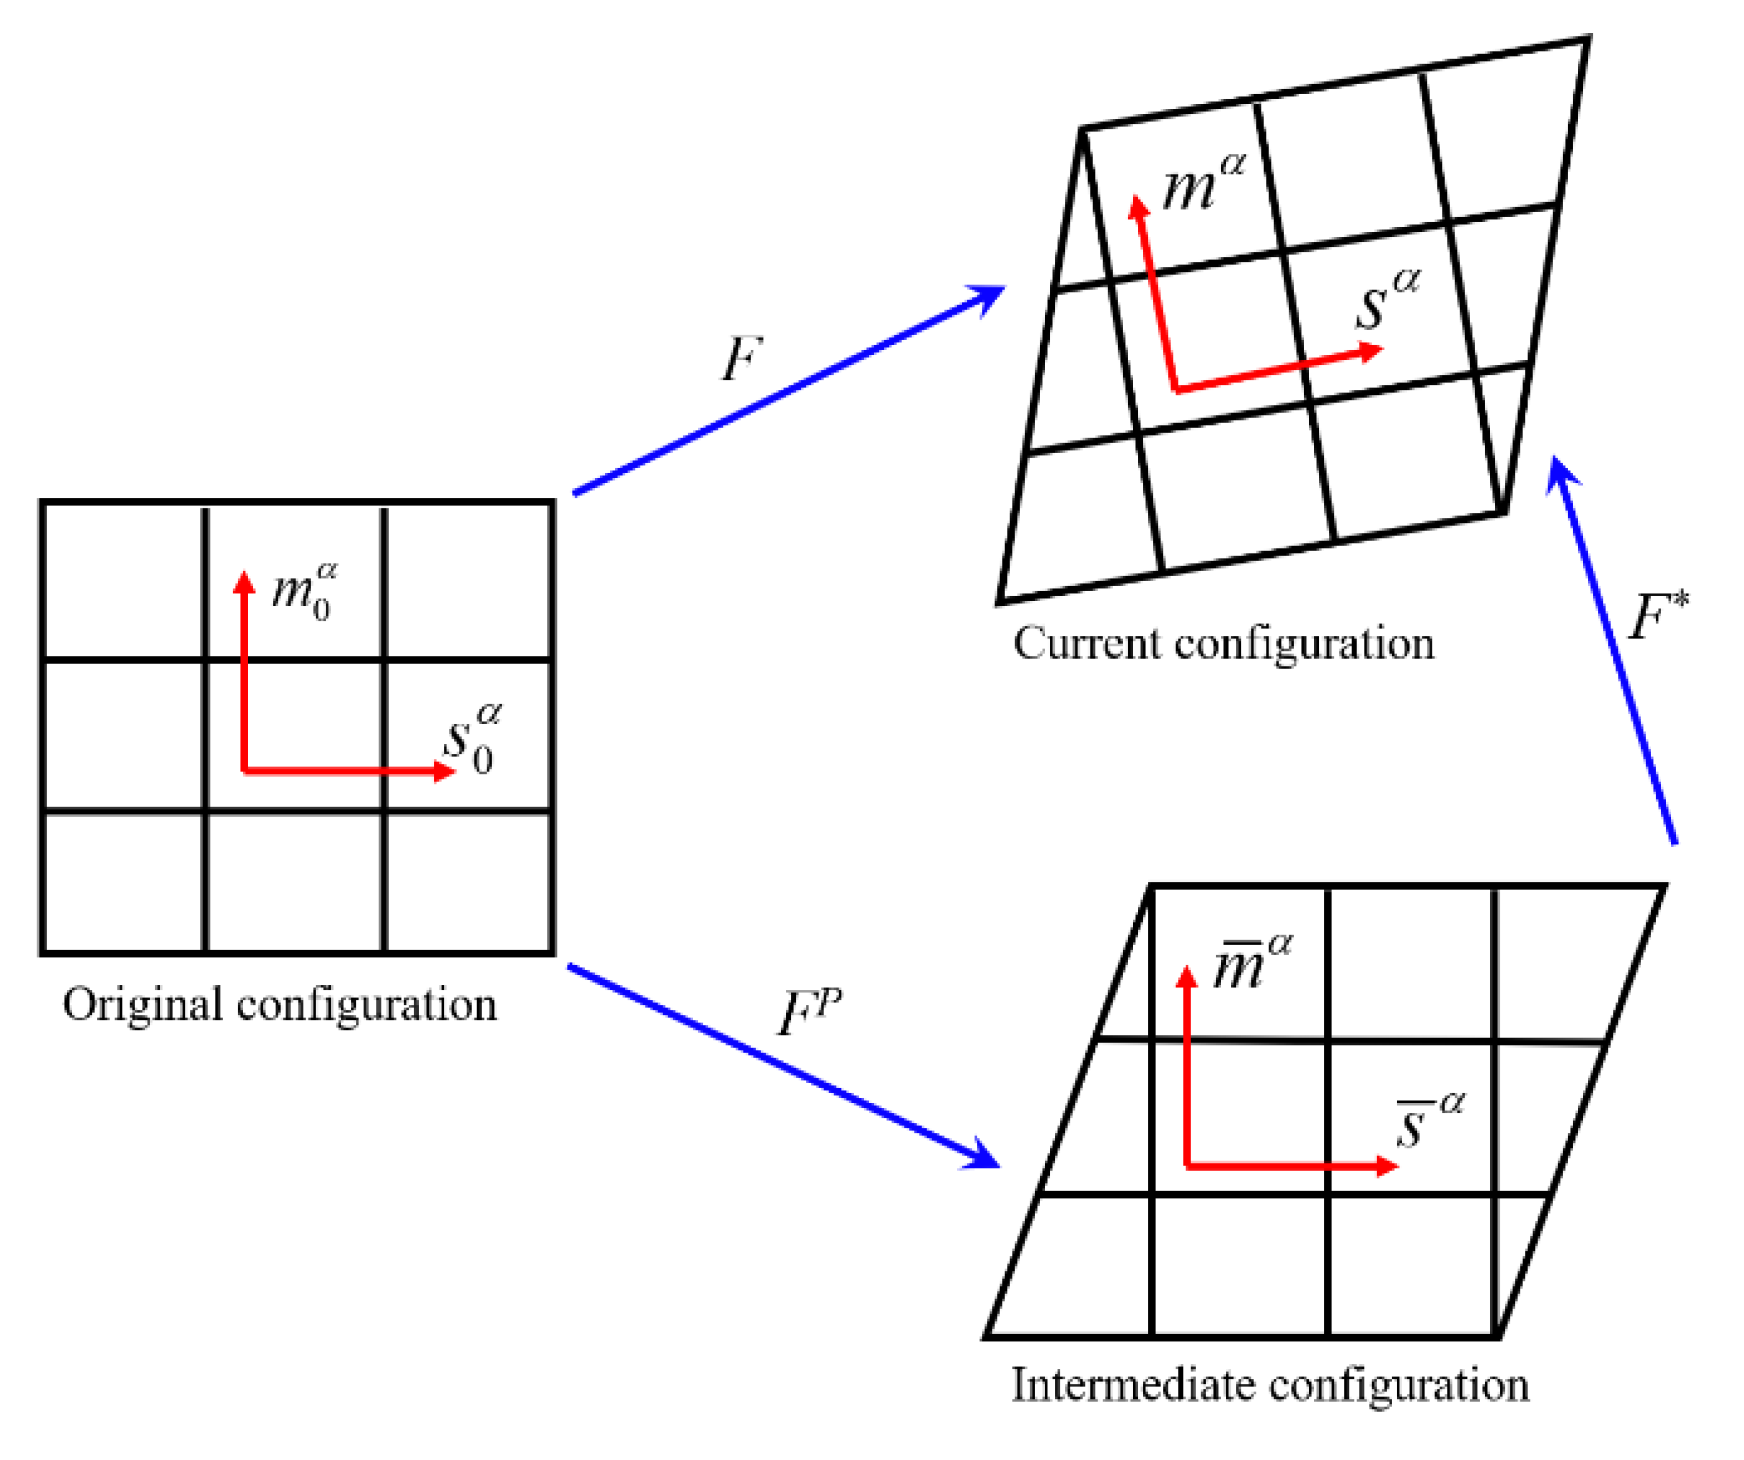
3.1. Modeling of Crystal Plastic

In previous research, the majority of the constitutive model was linear elastic, and thus the material’s plastic behavior was ignored [27]. Plastic characteristics, on the other hand, have been thought to have a significant impact on fretting wear and fracture [28]. The theory of crystallographic plastic was added to the ANSYS program as a supplement to the analysis of finite element contact strength in the present research. The rate-dependent constitutive formulation [33,34] is taken up with continuum frame theory to describe the dislocation slip mechanism quantitatively.
The multiplicative decomposition of the deformation gradient in Figure 4 shows a free stress configuration during the deformation process of the deformable body from the reference configuration to the current configuration. This free stress configuration contains only the deformation caused by the plastic slip, which is the intermediate configuration. The intermediate configuration only contains plastic slip deformation, and the dislocation plastic slip does not change the orientation of the crystal grains, which can be described as:
s ¯ α = s 0 α , m ¯ α = m 0 α
where s ¯ α and m ¯ α are the slip direction and the normal direction of the slip surface in the intermediate configuration, respectively. The subscripts of s 0 α and m 0 α correspond to those vectors in the original configuration. The superscript α represents the number of the slip system.
In the current configuration, the orientation of the slip system evolves as follows:
s α = F · s 0 α , m α = m 0 α · F 1
where s α and m α are the slip direction and the normal direction of the slip surface in the current configuration. F represents the elastic part of the deformation gradient. It can be seen that the crystal plasticity model based on the current configuration needs to update the slip system orientation for each constitutive iteration. In contrast, the model based on the intermediate configuration does not need to perform this calculation, which significantly reduces the scale of constitutive calculations.
Most of the crystal plastic models established in the current configuration are the linear elastic relationship between the stress rate and the deformation rate tensor, as shown in the following formula [14]:
τ ( α ) = P ( α ) : T
where P ( α ) is the Schmid factor of slip system α and T represents the second Piola–Kirchhoff stress tensor relative to the intermediate configuration. The strain rate was expressed using a power-law relationship:
γ ˙ ( α ) = γ ˙ 0 ( α ) [ τ ( α ) g ( α ) ] [ | τ ( α ) g ( α ) | ] ( 1 / m ) 1
where g ( α ) is the slip system strength or shear resistance, m is the strain rate sensitivity exponent, and γ ˙ 0 ( α ) represents the reference shear strain rate. The current crystal state of strain hardened is characterized by functions g ( α ) . Simply, each g ( α ) is taken to depend on the sum of the slip magnitudes, i.e.,
g ( a ) = g ( α ) ( γ )
where γ = a | γ ( α ) | . To make the program more straightforward, the material strain hardening can be described in terms of the evolution of g ( α ) [35], which can be modeled by the following equations:
g ˙ ( α ) = β h α β | γ ˙ ( β ) |
h α β = q α β h β = q α β h 0 ( 1 g α / τ s ) β
where τ s and β are constant parameters for the model, h β and h 0 are the single hardening rate and hardening modulus, q α β is the matrix describing the latent hardening, and h α β is the coefficient of hardening.

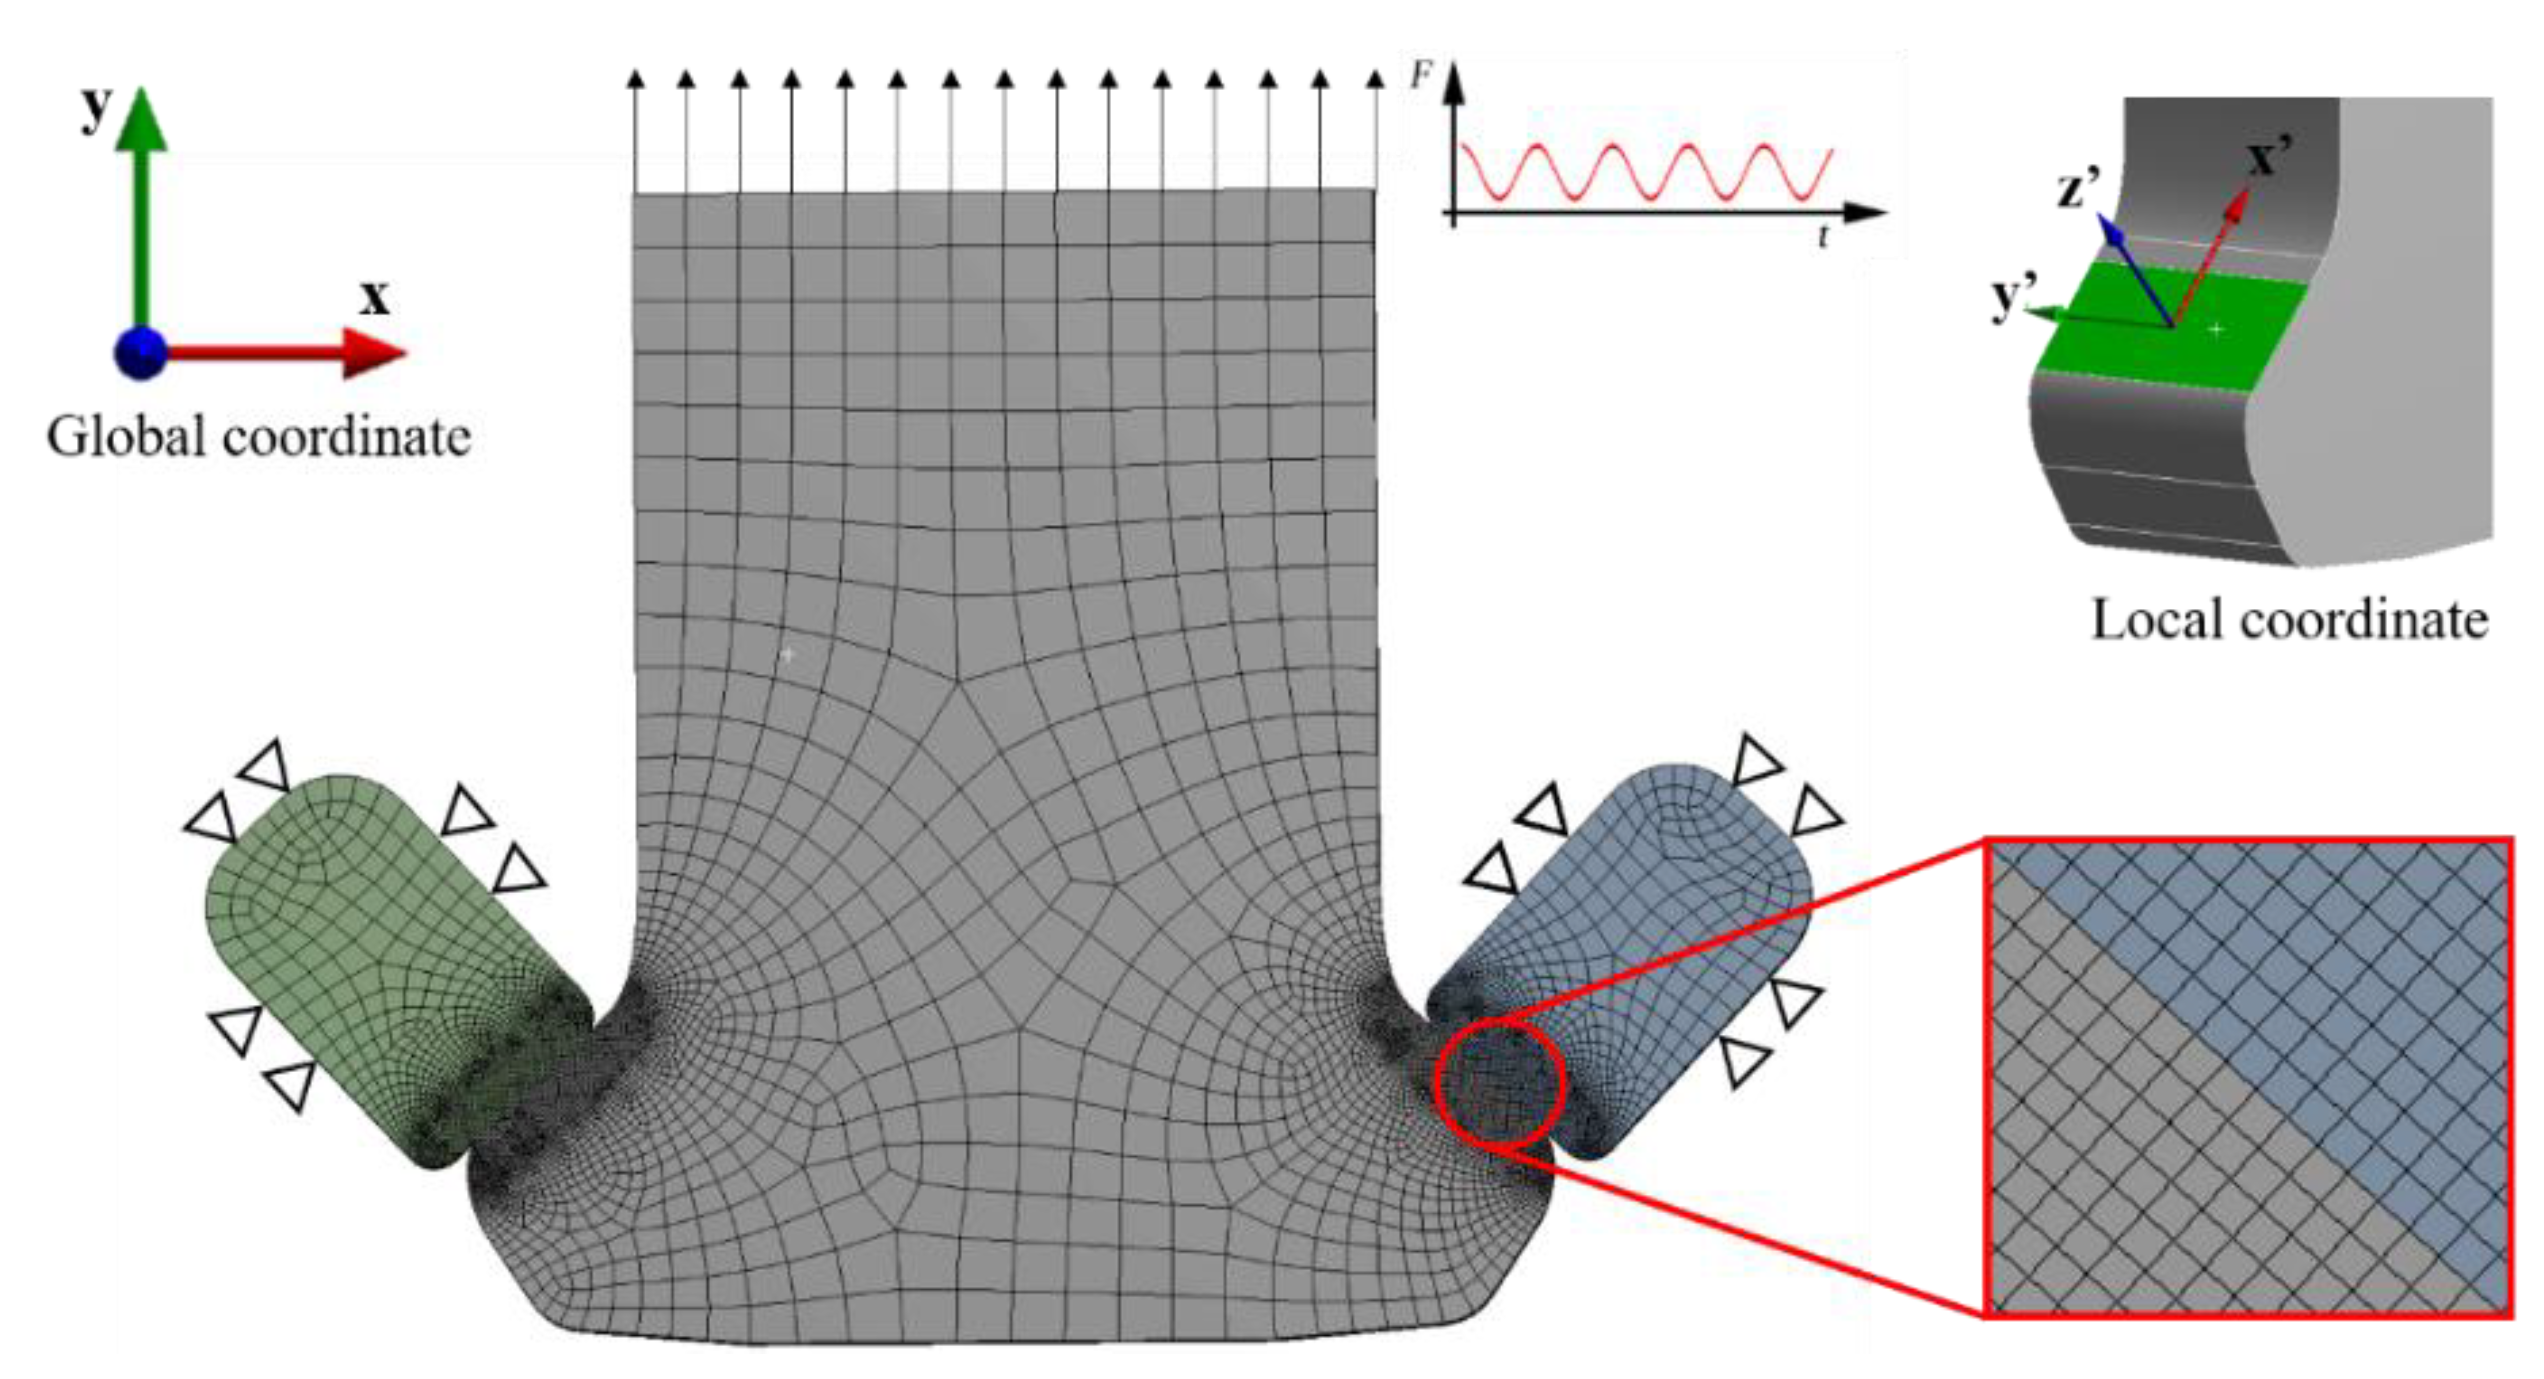
3.2. Finite Element Analysis Method

Traditional fretting fatigue tests employ a basic contact configuration in which fretting is produced by the contact of a flat specimen and cylindrical pads [16]. This line contact form enables an analytical stress estimation through a traditional Hertz contact. However, in the dovetail configuration, a theoretical solution of the stress distribution is perhaps more challenging and finite element analysis would be helpful. The contact pressure and stress distribution were calculated using the commercial program ANSYS in this analysis. What is more, the finite element model developed in the ANSYS program can be used to analyze the fretting fatigue damage and verify the test results.
In the ANSYS finite element modeling, the fretting contact can be characterized either by surface or contact element. To describe the interaction between the dovetail specimen and fretting pads, we used the surface-to-surface contact with Coulomb friction. Detailed analyses were performed on the accurate three-dimensional model of dovetail specimen and fretting pads to achieve a more credible result, though a 2D model [14] may improve the efficiency. The temperature will affect the elastic modulus and Poisson’s ratio of DD10 and FGH99. Through the measured values of elastic modulus E and Poisson’s ratio υ at specific temperatures shown in Table 4 and Table 5, the accurate material parameters under the test temperature 630 °C can be calculated.
To simplify the scale of the finite element model, only the dovetail specimen and two fretting pads are meshed in the ANSYS program. Besides, only the local elements near the contact surfaces are refined to ensure the accuracy of contact calculation. Figure 5 depicts the boundary conditions and the load application in the finite element model in the global coordinate system, as well as the exact mesh at the contact surfaces. The local coordinate system of x’-y’-z’ is established based on the contact surface. The fatigue load is applied on the top of the dovetail specimen in a type of sine wave. Fixed supports are applied on the three side surfaces except for the contact surface of each fretting pad.
Solid 186 of quadratic hexahedral elements is used for the solid structure in the finite element model, which is defined by 20 nodes for each element. The contact surfaces between the dovetail specimen and fretting pads are defined as contact pairs. Conta174 and Targe170 of contact elements overlay the contact and target surfaces of the finite element model, respectively, thus small sliding between the contact surfaces is permitted during the numerical computation due to the unique characteristics of the contact elements. The meshing method of “Contact sizing” was used to create same size meshes where the surfaces of the two pads and dovetail specimen are coming in contact. To enhance the convergence and the quality of results for structural contact analysis, the mesh is refined at the contact surfaces to capture the accurate stress distribution and the minimum size of the mesh is 0.008 mm. For the 2D contact finite element model, previous studies [21,22] have proved that when the mesh density is less than 0.008 mm, the impact of the contact surface element size on pressure distribution is no longer as significant. Coincidentally, the result on the local coordinate system for the 3D model revealed that when the mesh density is between 0.005 and 0.008 mm, the relative error for contact pressure is less than 4%, shown in Table 6. The augmented Lagrange method with asymmetric behavior was utilized for the contact formulation with a constant COF of 0.3.

4. Experimental Results

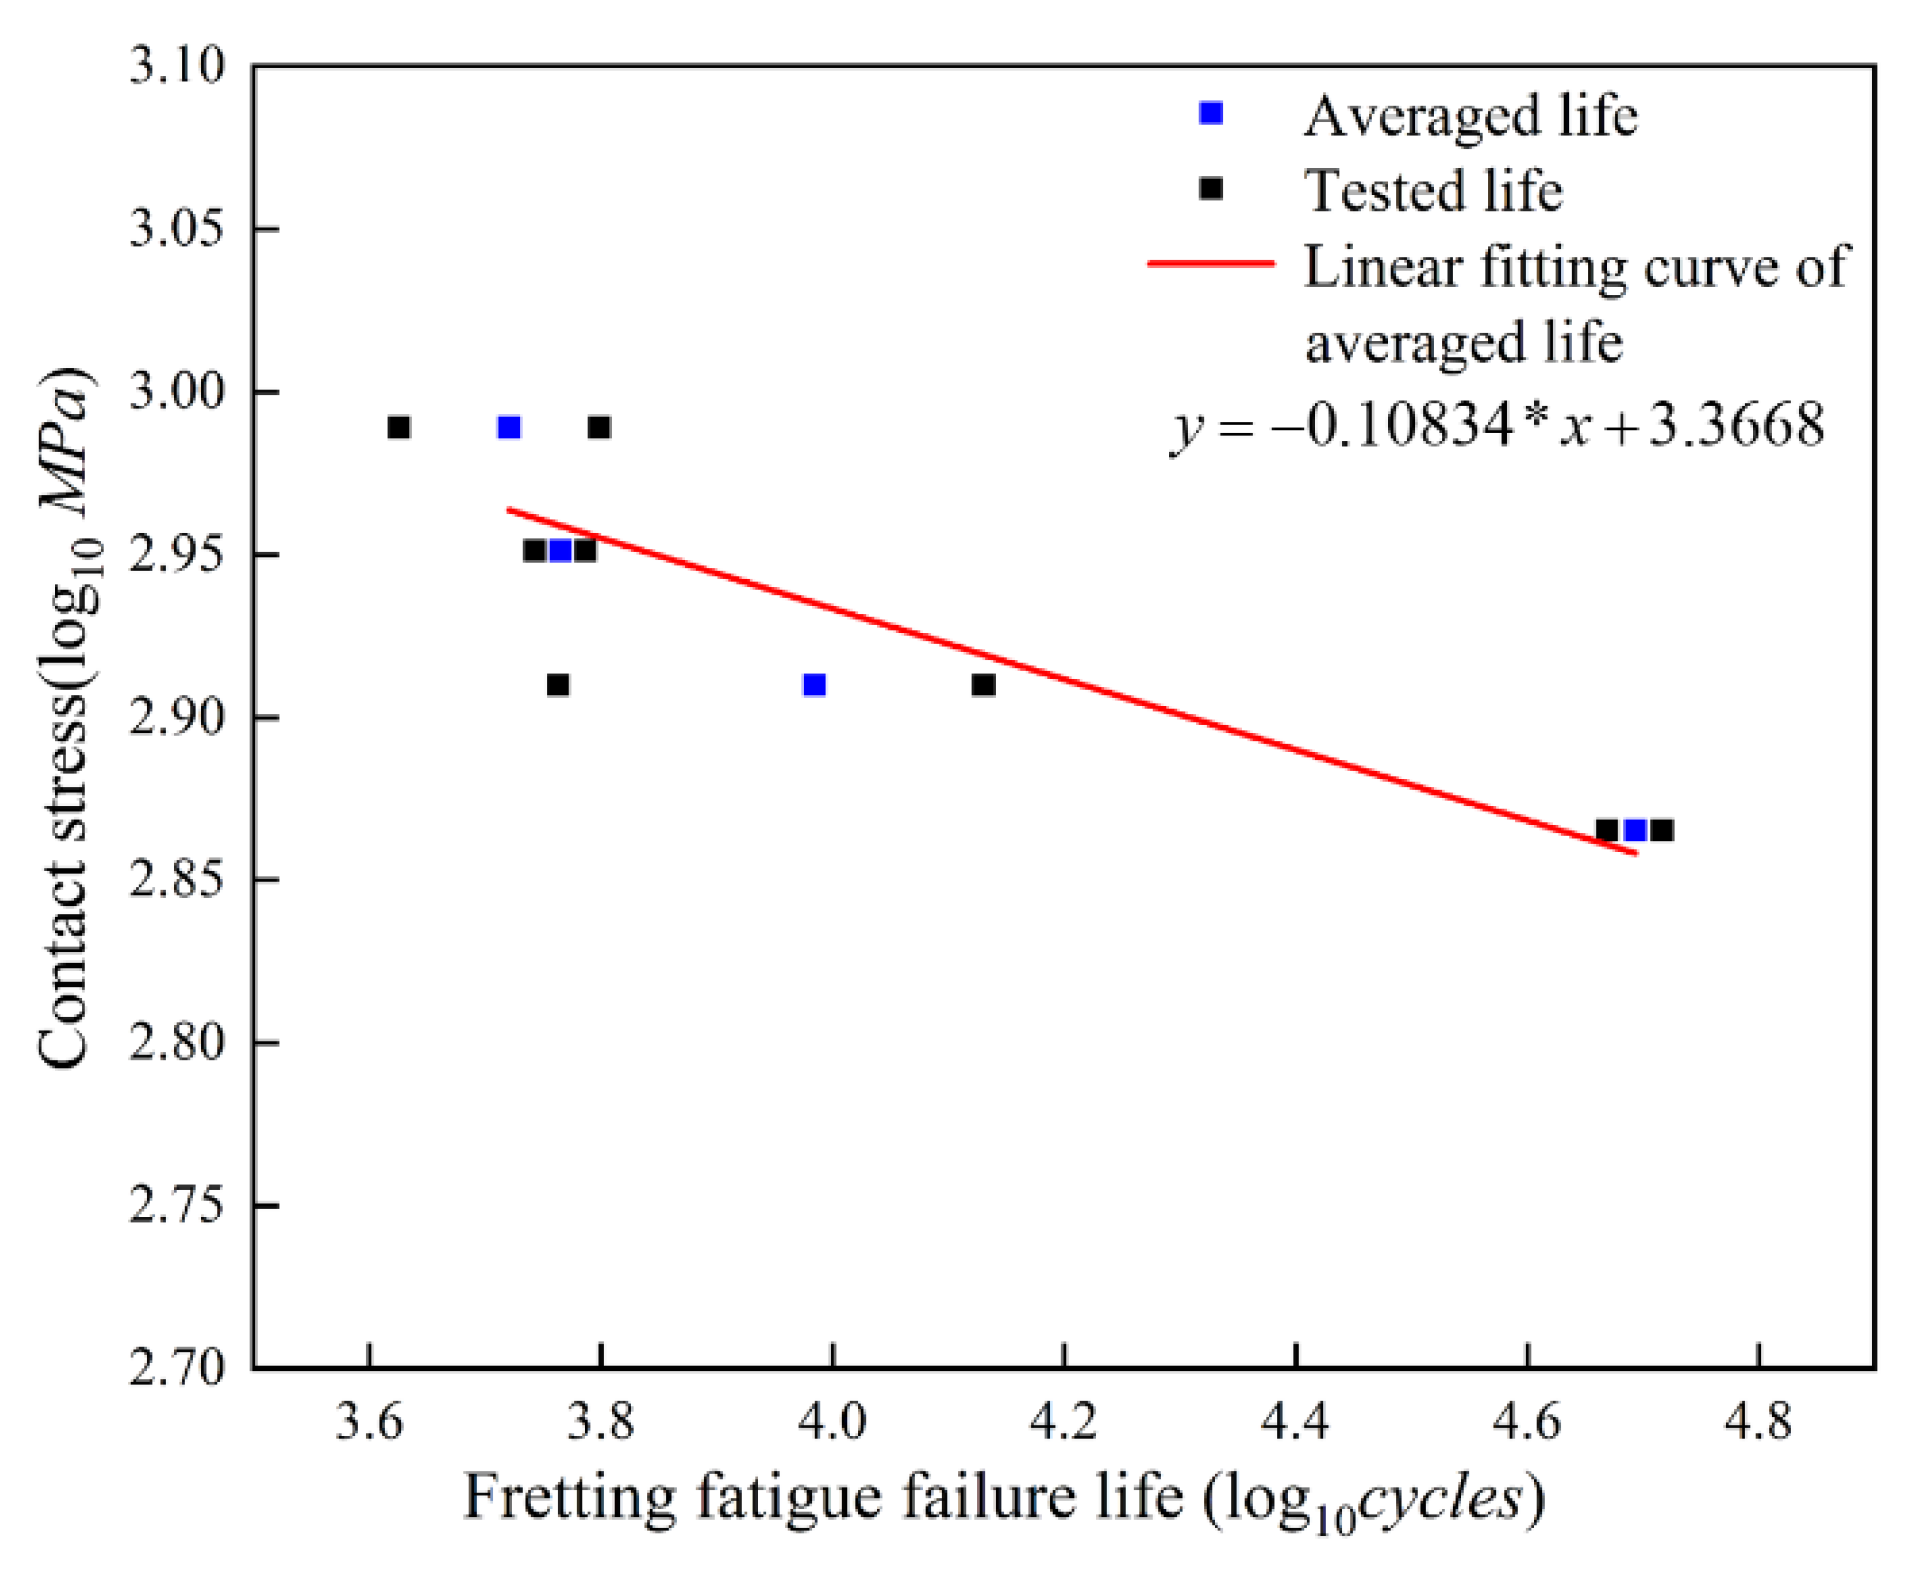
4.1. Experimental Fretting Fatigue Life

Although the fretting fatigue life can be divided into two stages of crack initiation life and propagation life, there is no widely accepted standard to distinguish the two stages [14,21]. Since the period from crack initiation to fracture is too short to capture, the present study does not distinguish the above two stages and only considers the overall fretting fatigue failure life. The experimental results of eight dovetail specimens are summarized in Table 7. It is clear that the fretting fatigue failure life decreases with the increase of the maximum load. The relationship between the experimental fretting fatigue failure life and the contact stress is shown in Figure 6 in logarithmic coordinate. The contact stress here can be obtained through dividing the maximum experimental load by the effective contact area, which is a concept of nominal compressive stress. The effective contact area of the dovetail specimen depends on the inclined angle (45°) of the contact surface shown in Figure 2a. A linear function is fitted to match the relationship between the experimental fretting fatigue failure life and the contact stress (R2 = 0.837):
y = 0.10834 x + 3.3668
In Function (8), x and y represent the fretting fatigue failure life of the DD10 dovetail specimen and the contact stress on the effective contact surface in logarithmic form, respectively. As the number of the specimen is limited due to the material limitations, the curve in Figure 6 and the Function (8) can just be used to assess the trend of fretting fatigue life.
It is well known that tiny wear debris will be generated on the contact surfaces under fretting fatigue load, and the higher the load, the more wear debris will be generated. At the same time, debris generated from the fretting contact surfaces will also be discharged from between the contact surfaces. The amounts of debris generated between the contact surfaces are dynamically changing. Since the fretting debris and initial fretting fatigue cracks are produced simultaneously, the newly initiated cracks may fall off the contact surface with the debris. That is the reason that the specimens of No.4, No.5, and No.8 have a longer fretting fatigue life than the other specimens in the same load condition. Moreover, a large amount of wear debris between the contact surfaces would act as a kind of solid lubricant which can reduce the abrasion damage in the fretting area [36].

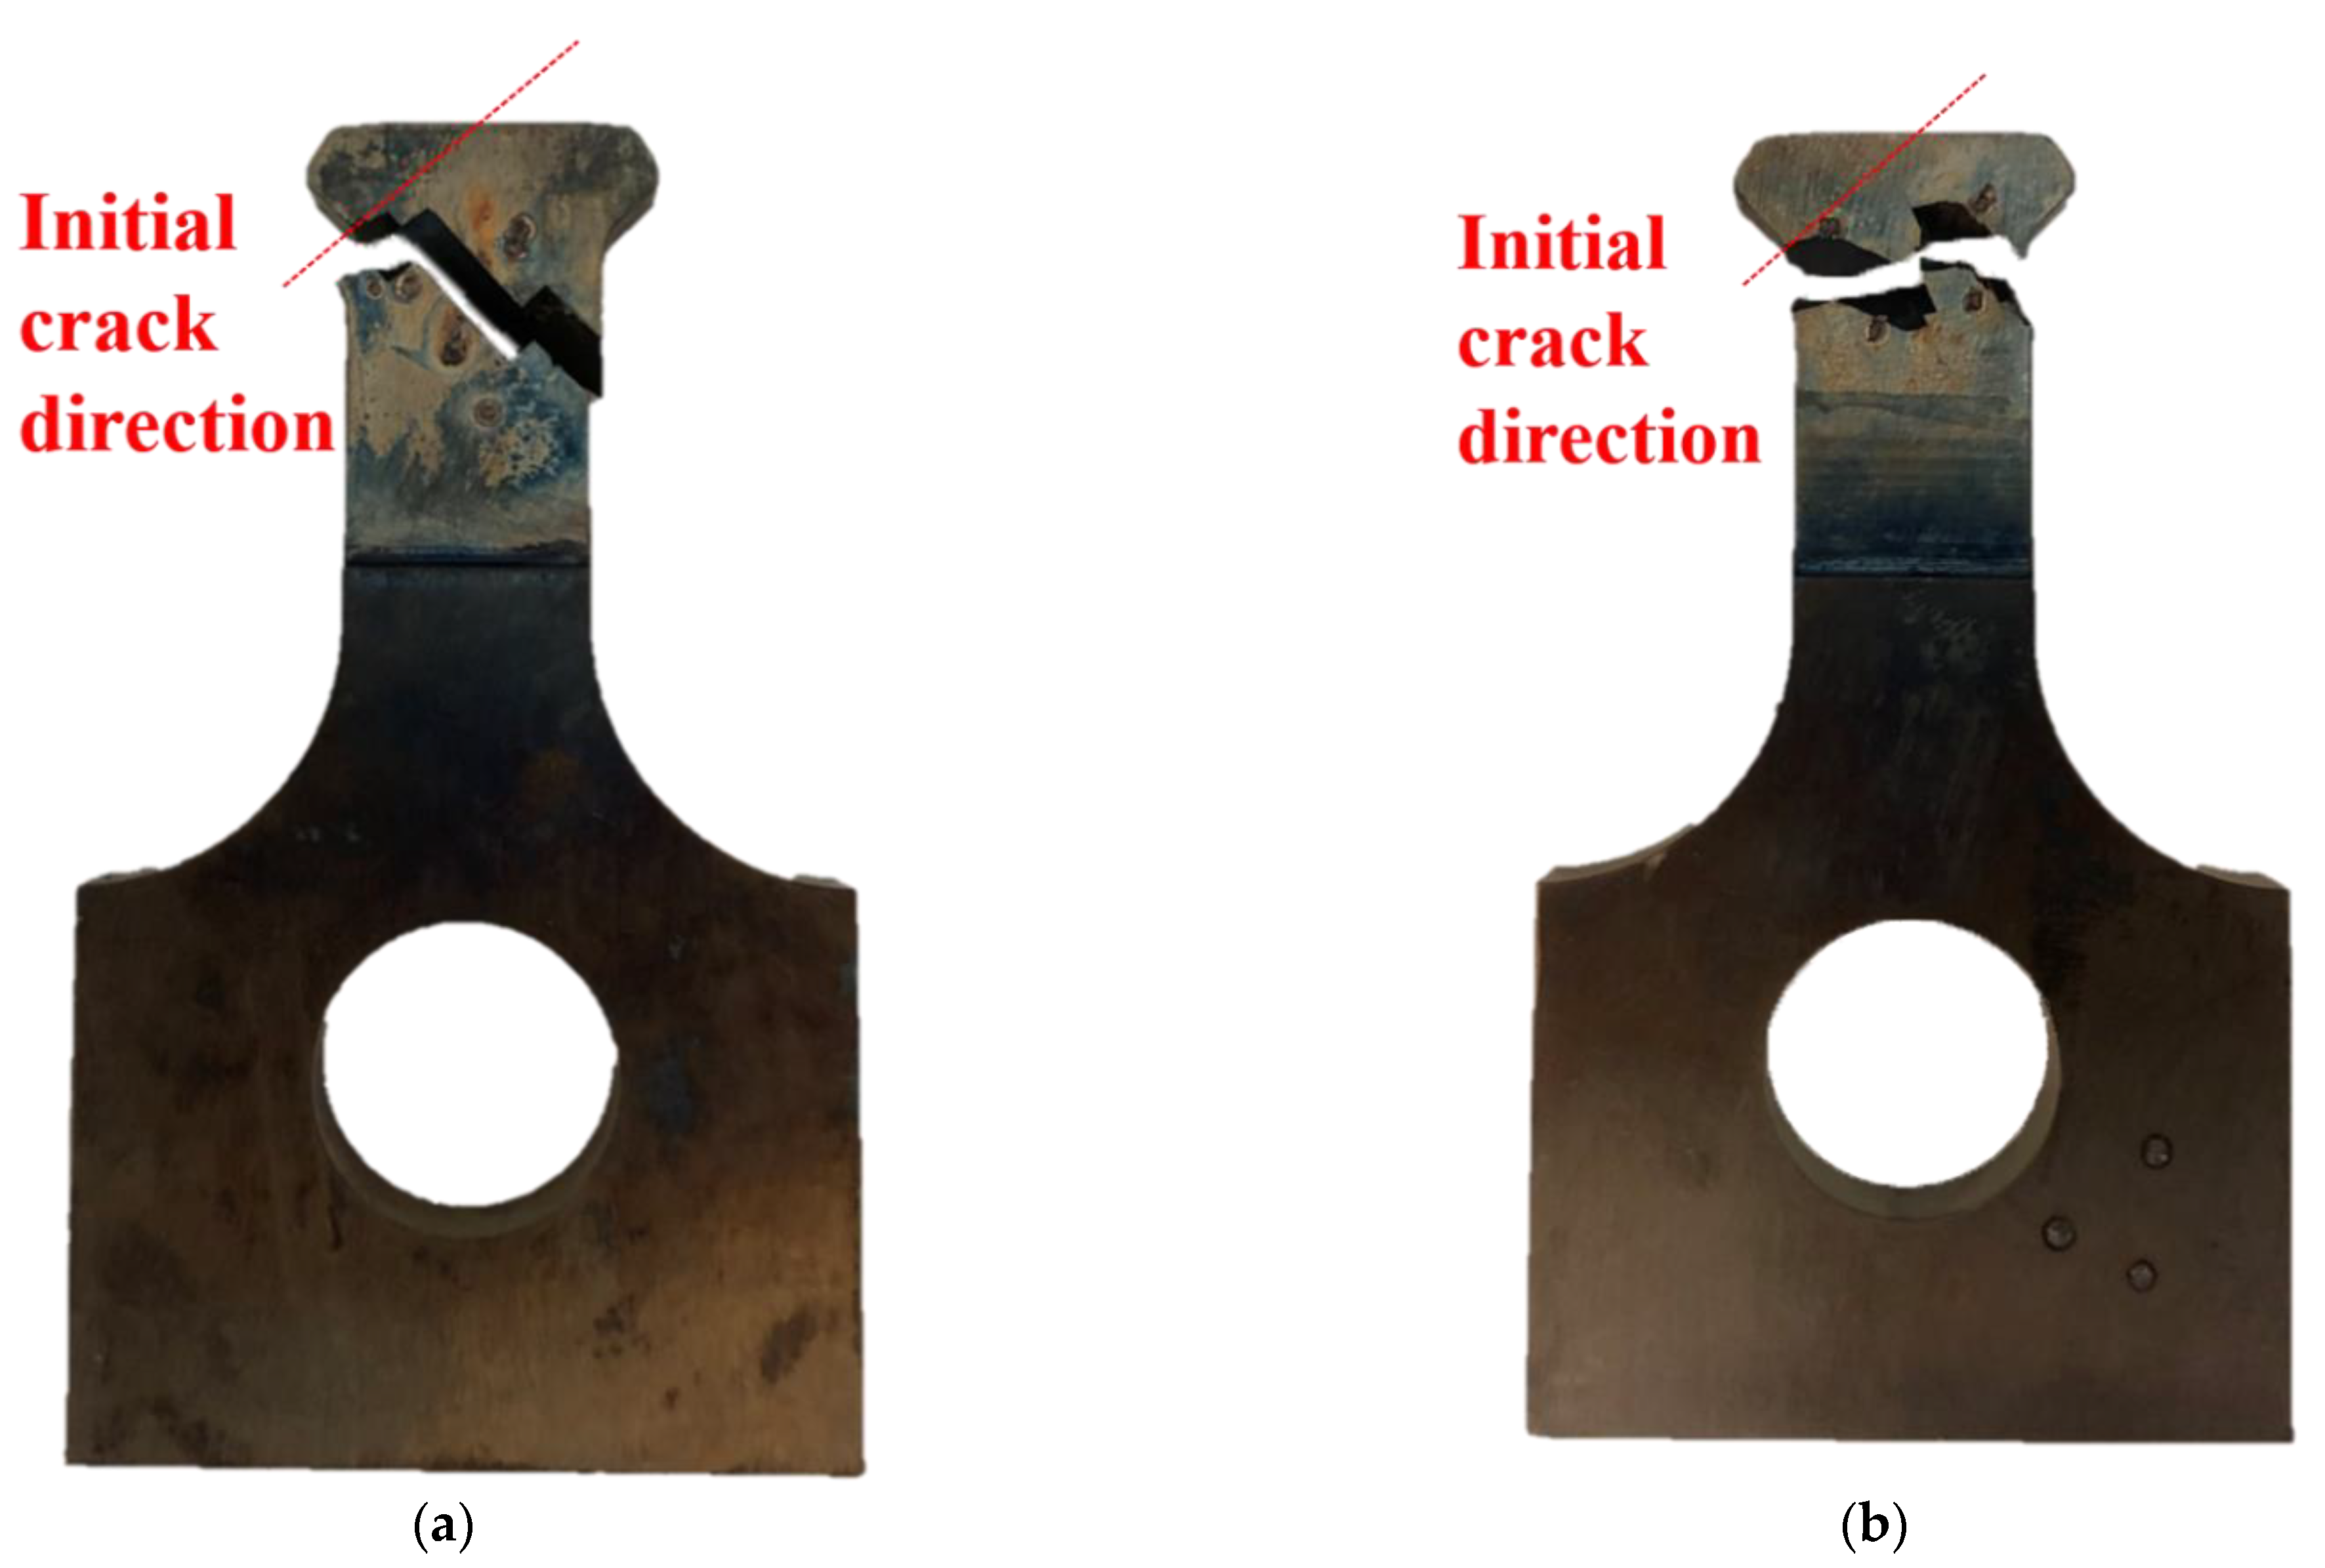
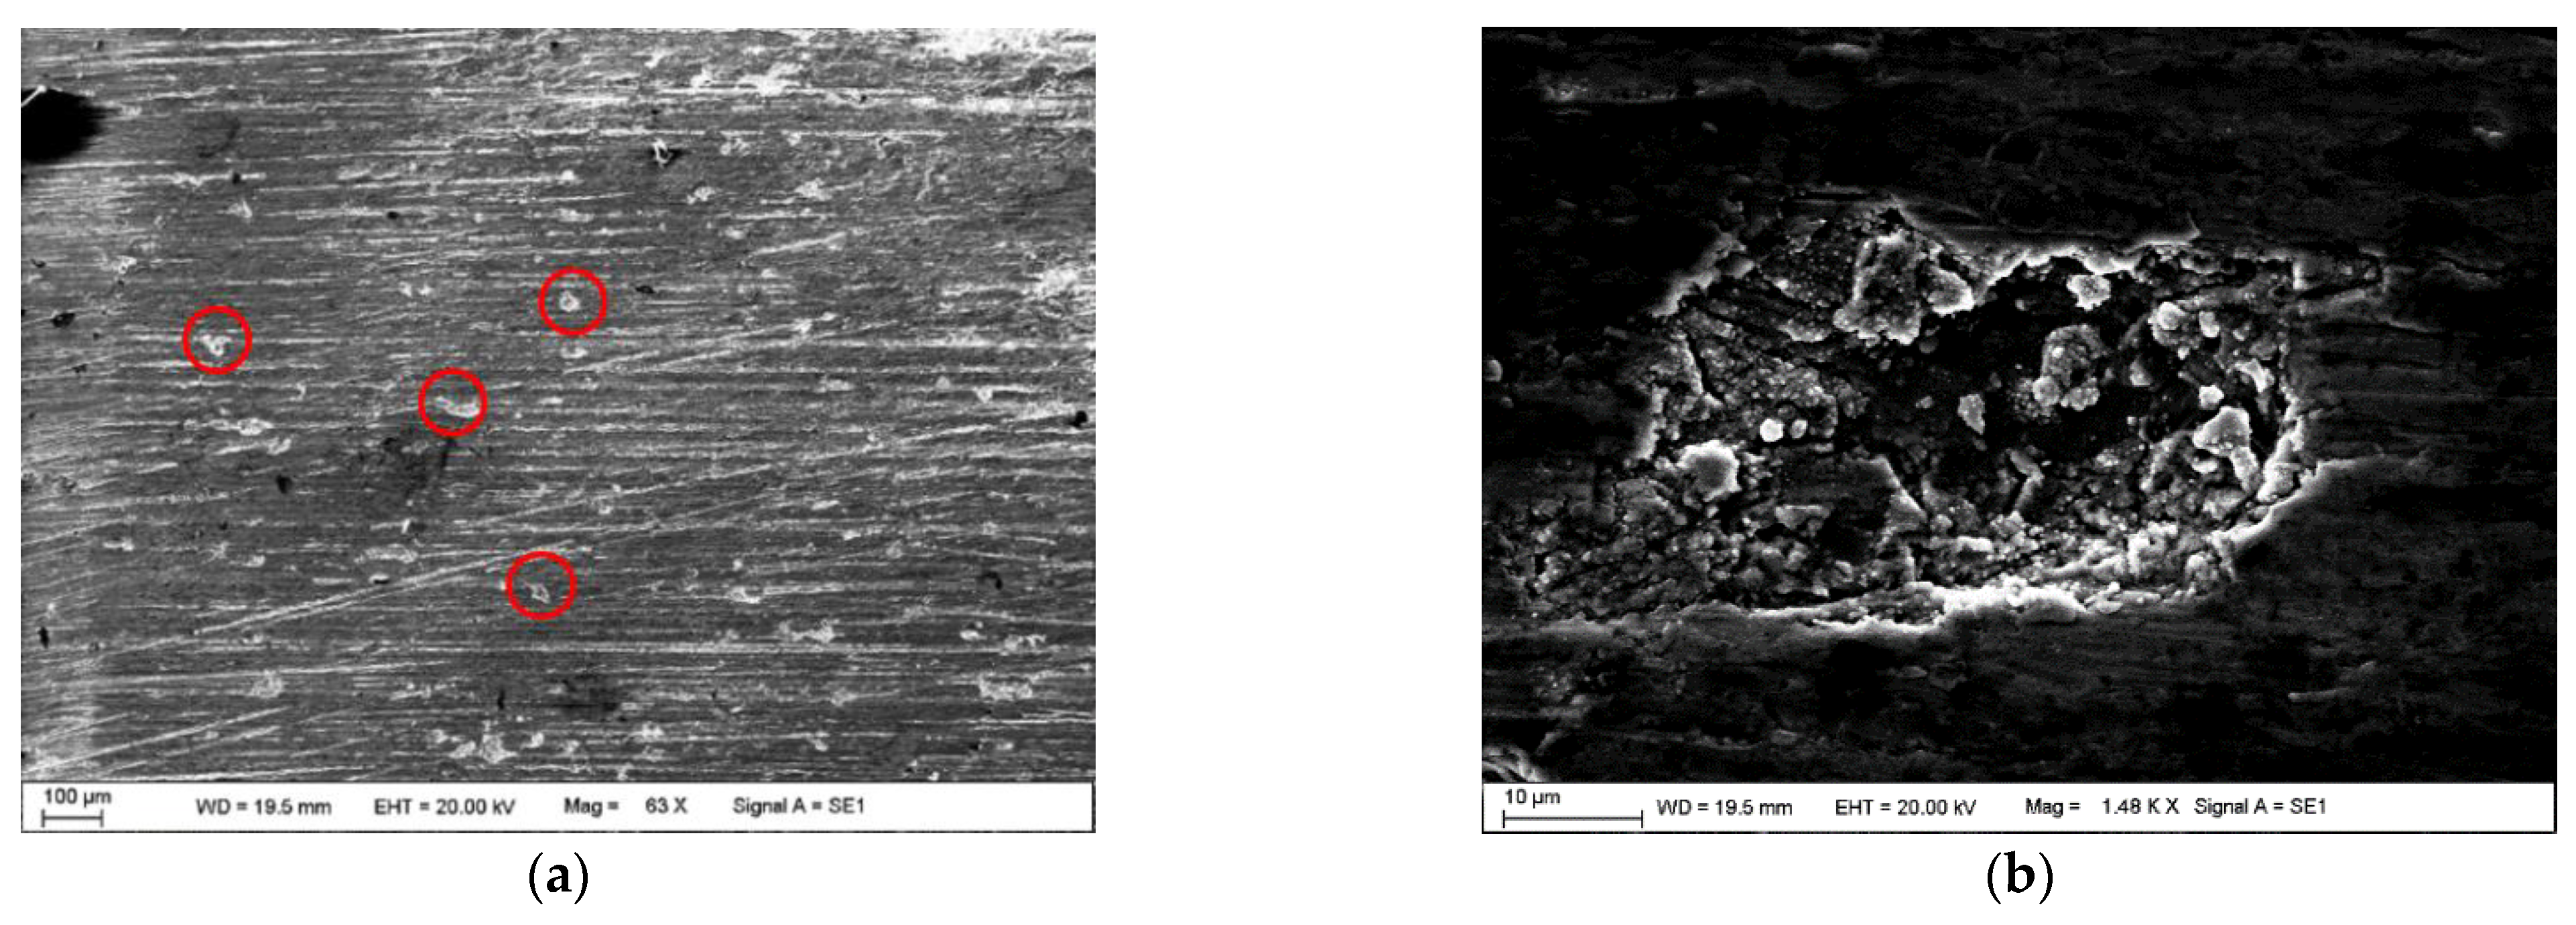
4.2. Fracture and Microscopic Damage

The two representative fracture failure modes for the dovetail specimens are shown in Figure 7. The red dotted line in Figure 7a,b represents the crack direction at the crack initiation and propagation stage. The position of the initial crack is at the upper edge of the contact surface based on the local coordinate system. The direction is almost perpendicular to one of the contact surfaces for the dovetail specimen, which is along the -z’ direction of the local coordinate. Although the two contact surfaces of one dovetail specimen have the same contact state and stress distribution theoretically, due to the roughness errors of the contact surface in the machining process fretting fatigue cracks start to initiate from the surface with larger stress.
It is common knowledge that the macro-flat metal has a fluctuant surface, which is usually called fractal, with certain tiny regions appearing higher and some lower [37,38]. The higher ones are prior to touching the target surface as the fretting load is applied, leading to colossal contact stress and it is easy to form the initial fretting wear damage. After completing a certain number of cycles, all the dovetail specimens eventually fractured due to the fretting fatigue during the test. Pitting corrosion, a typical fretting phenomenon, can be clearly seen on the contact surface of dovetail specimens shown in Figure 8. The presence of pitting corrosion diminishes the effective contact area, resulting in the actual contact stress being larger than the theoretical value. Therefore, cracks are more likely to initiate from the severely worn area.
Considering that the effects of the force are all mutual, the surfaces of fretting pads that are in contact with each dovetail specimen can be used to observe the wear state of the contact surface. The SEM of the fretting pads’ contact surface is shown in Figure 9. Since the contact surfaces of the two fretting pads corresponding to each dovetail specimen have similar micro-morphologies, only one of a pair of fretting pads is shown here. The left side of the contact surface in Figure 9 corresponds to the upper edge of the contact surface. It can be clearly seen in Figure 9 that the fretting wear on the left edge (Region II) of the fretting pad surface is more serious than the other region (Region I). Moreover, the degree of fretting wear is growing severe with the increasing maximum fretting load. Furthermore, the apparent fretting trace can be observed in Figure 8a and Figure 9, resulting from the micro relative displacement between the fretting pads and the dovetail specimen. When focusing on the severe wear area on the left of the contact surface, however, the fretting trace grows hazy as the load increases.
The area where the contact surface of the fretting pad is more severely worn corresponds to the crack initiation area of the dovetail specimen. From the fractured dovetail specimen shown in Figure 10a and the SEM of the fracture surface, the initiation position can be accurately located. The location of fretting crack initiation is similar to Sun’s study [14], which is more likely to form at the leading edge than at the edge of the specimen. During the fretting test, the area of cracks on the dovetail specimen has undergone uninterrupted opening and closing, and eventually fracture failure occurred. The area to the left of the red dashed line in Figure 10b shows the fretting fatigue stripe and the right area of the dashed line is the instantaneous fracture surface. The crack initiation location can be found along the direction perpendicular to the fatigue strip as indicated by the red oval circle in Figure 10.

5. Discussion

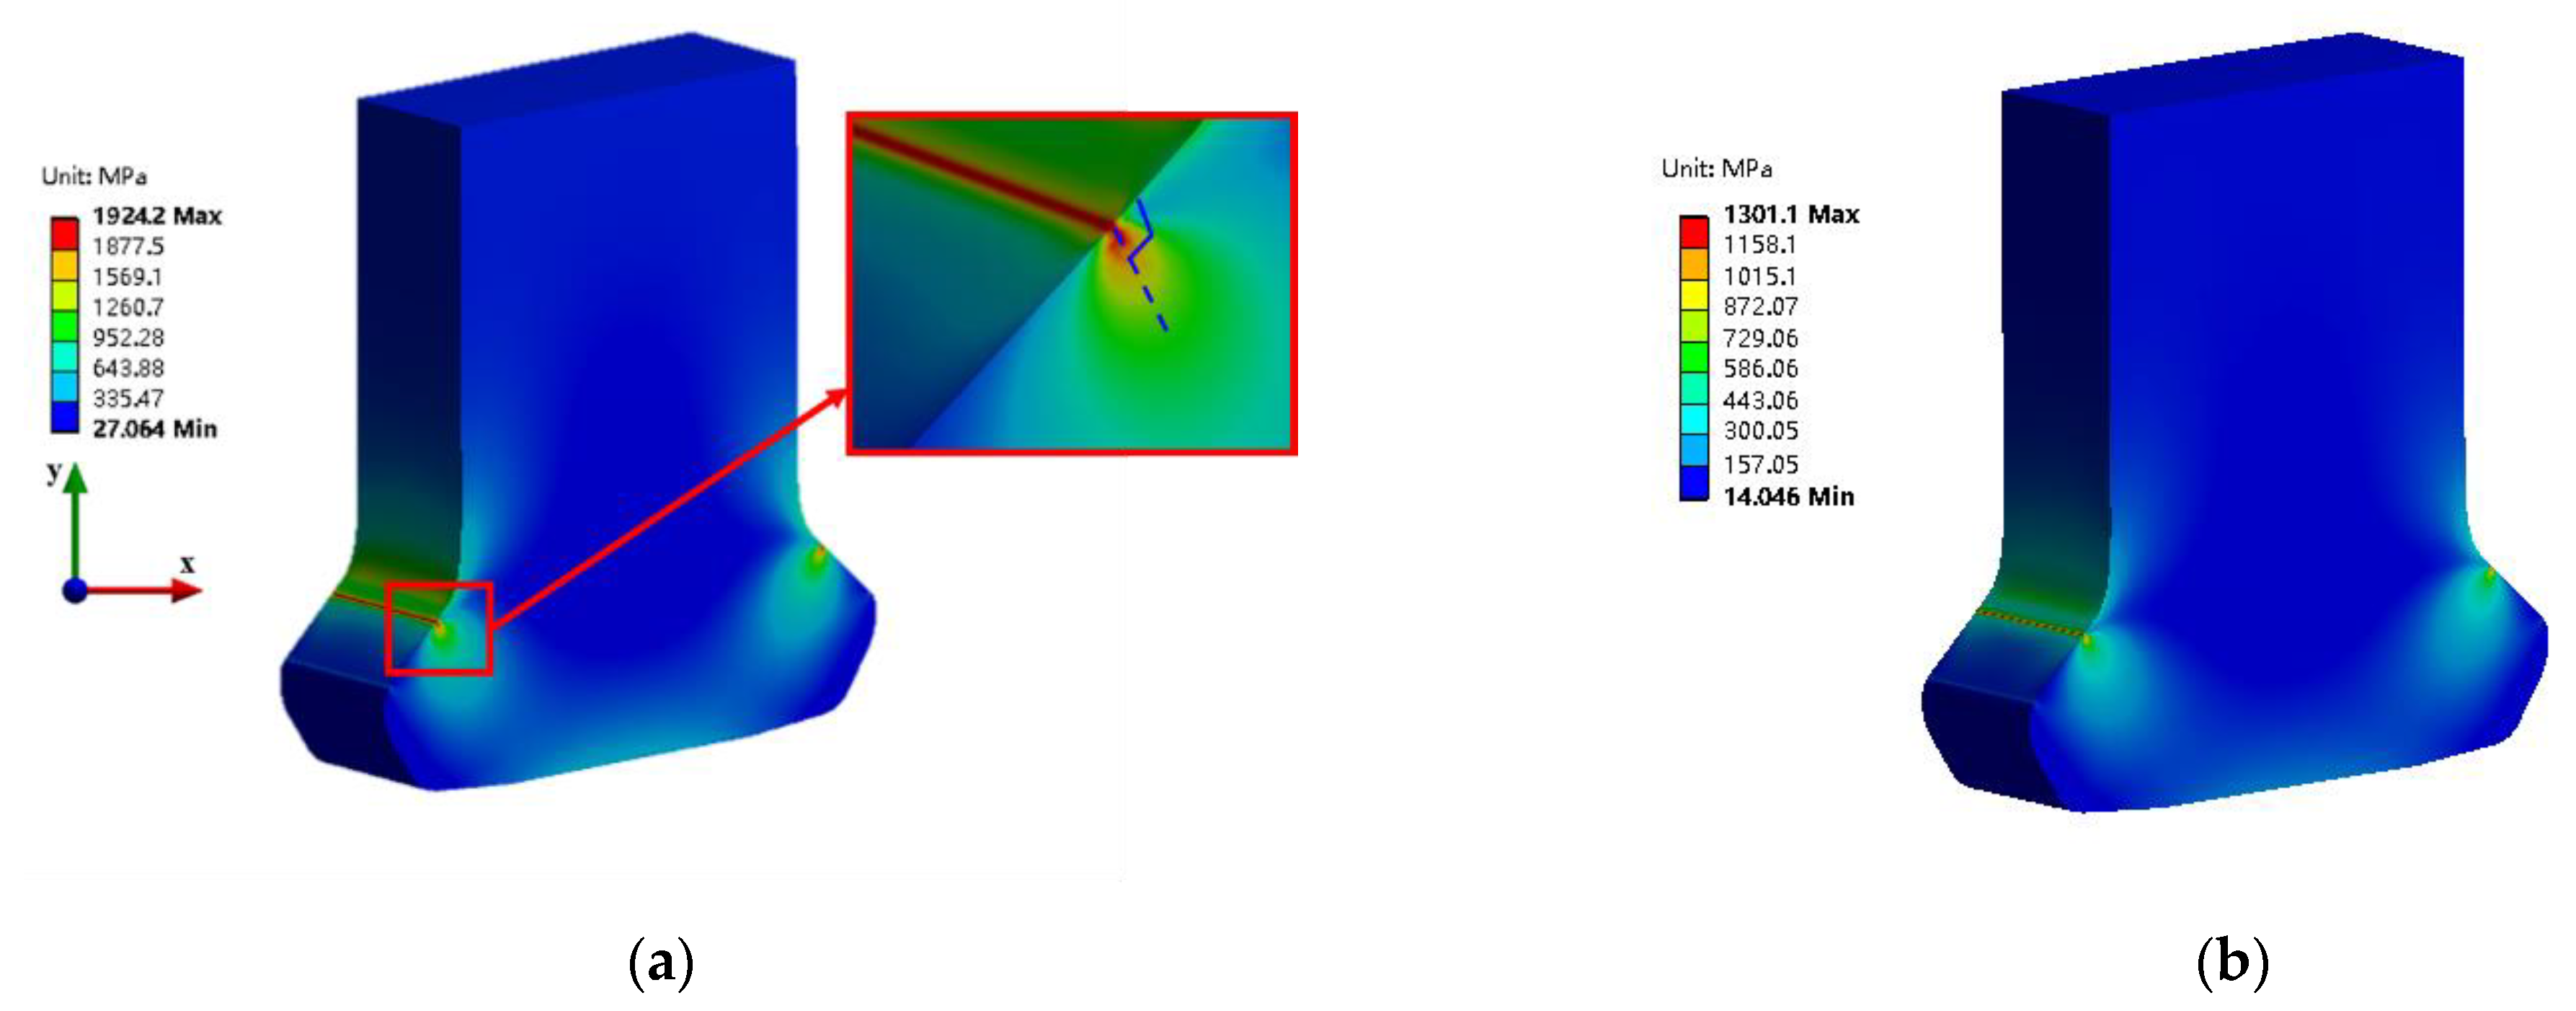
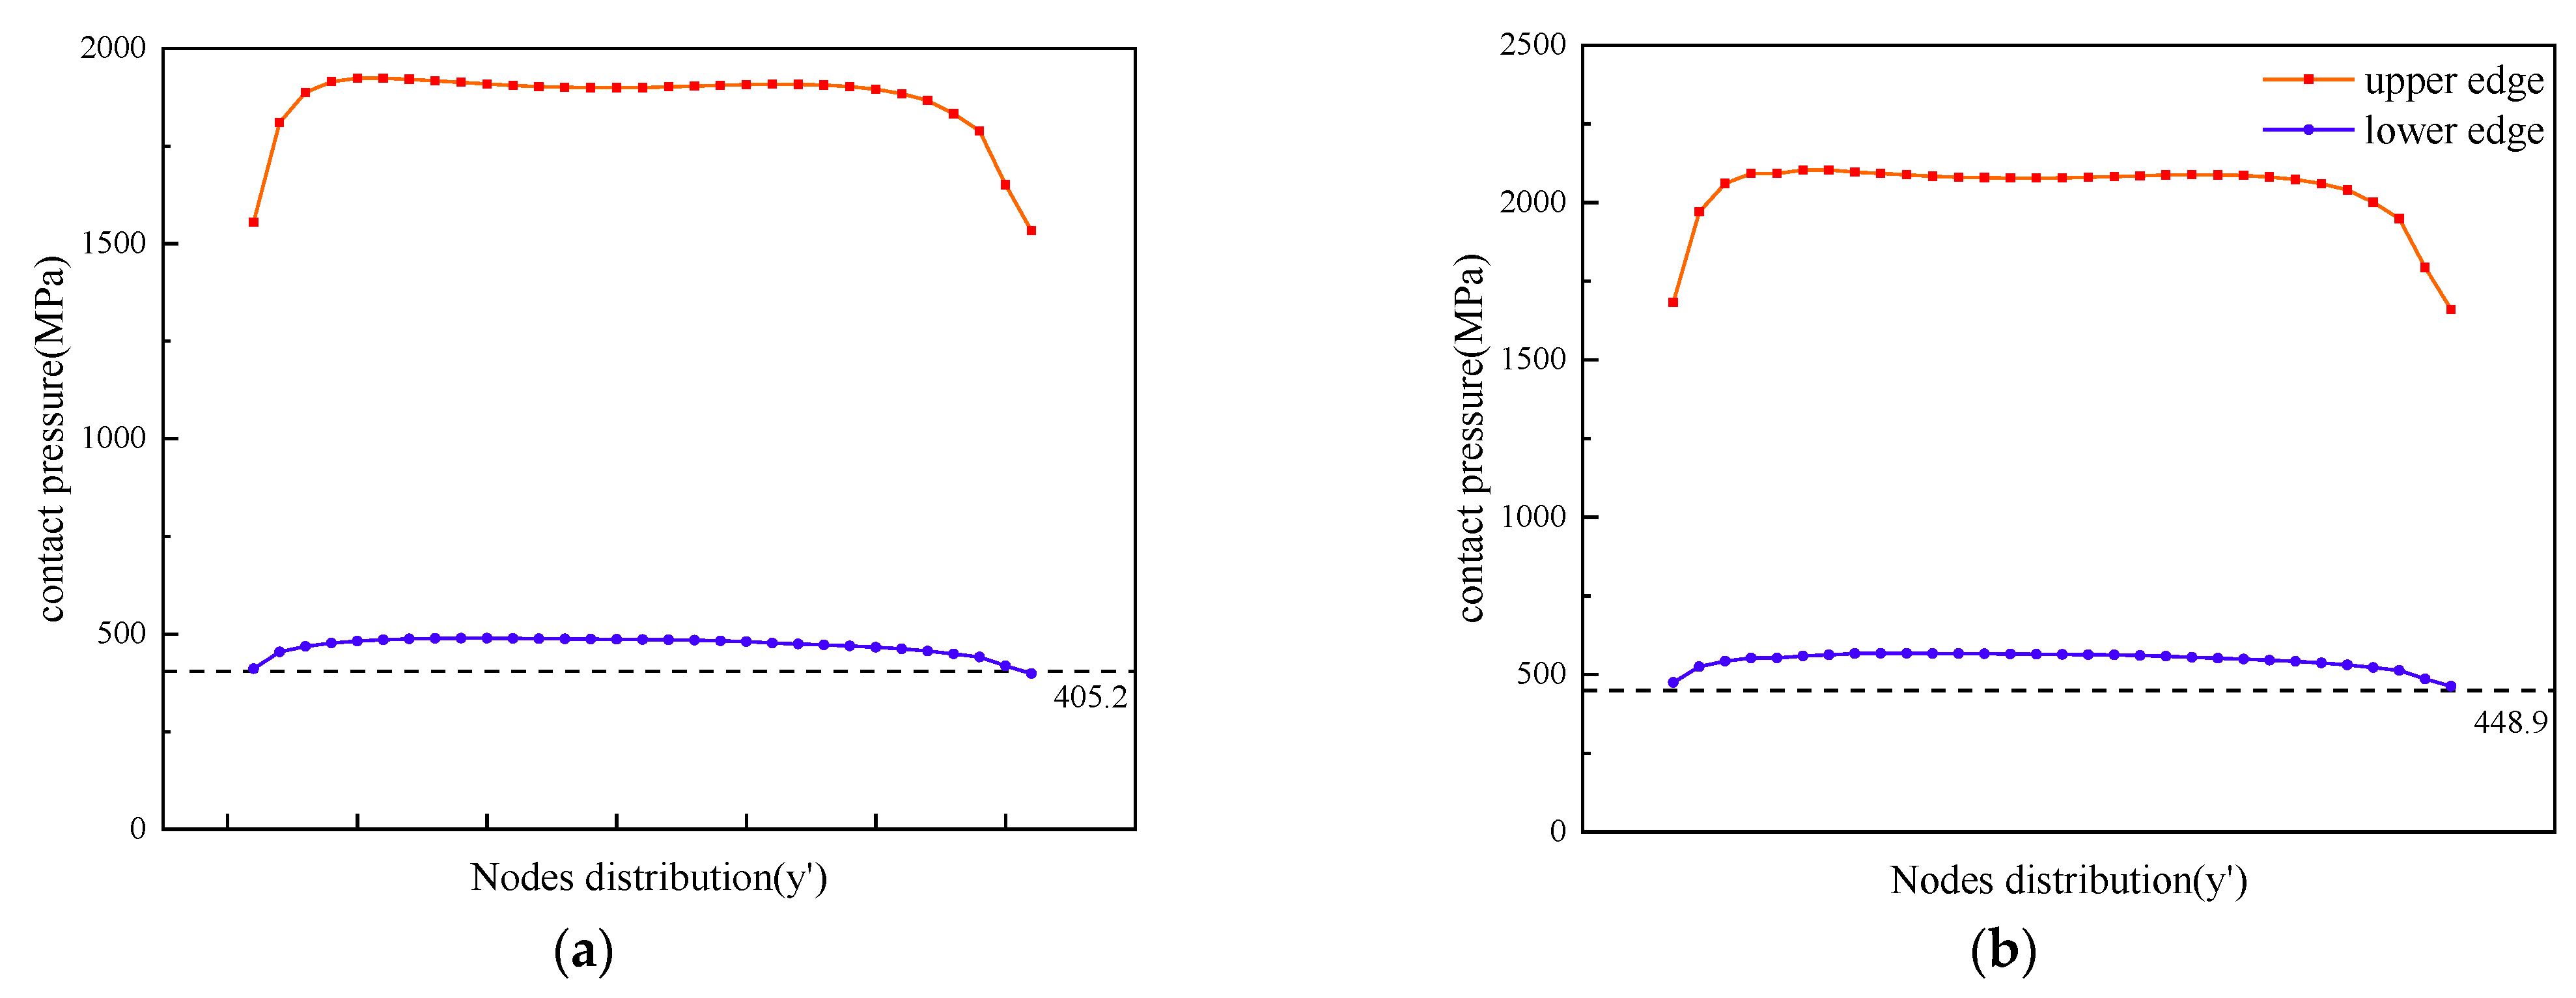
5.1. Contact Pressure and Stress Distribution

The distribution of von Mises stress on the 3D model of the specimen is shown in Figure 11a. It is evident that the von Mises stress is tremendous due to the stress concentration at the upper edge of the contact area. The maximum von Mises stress is 1924.2 MPa which is larger than the material yield limit. The distribution of maximum shear stress shown in Figure 11b is similar to the von Mises stress field and there is also a stress concentration at the exact location as the von Mises stress. The von Mises stress distributes along the direction of the blue dotted line which is almost perpendicular to the contact surface; hence, the fretting fatigue crack is prone to initiate in this direction, which is in conformity with the experimental results in Section 3.2. The same result can be obtained for the analysis of the maximum shear stress in Figure 11b.
It can be roughly seen that the stress distribution in Figure 11 is almost the same along the thickness direction of the dovetail specimen, based on which many studies use 2D models instead of 3D models to analyze the stress distribution [19,22]. However, the stress distribution along the thickness direction is not entirely uniform. The contact pressure values for the element nodes on the contact surface of the dovetail specimen are presented in Figure 12, from which the distribution can be described more clearly. The two figures in Figure 12 are based on the local coordinate system, i.e., x’-y’-z’ coordinate in Figure 5.
The theoretical values of contact pressure are marked as a blue plane in Figure 12. The plane for the theoretical value intersects the numerical contact pressure distribution curves at two end areas. The pressure distribution at the right end is considerably higher than the theoretical value due to the stress concentration. The left end is only slightly higher than the theoretical value, as shown by δ in Figure 12. Moreover, in the middle of the distribution curve, the theoretical value is greater than the numerical results for the contact pressure, as shown by Δ. This phenomenon is due to the larger contact pressure in the upper contact area resulting in a larger strain, which destroyed the originally uniformly distributed contact pressure, leading to the numerical result of the middle area being smaller than the theoretical value. As a result, more severe fretting wear at the upper edge causes the fretting crack initiation and propagation, which is consistent with the experimental results (Figure 7 and Figure 10).
The red wireframe in Figure 12 indicates that the distribution of stress peaks in the high-stress area is not uniform and this is the reason for the inaccuracy of using a 2D model to describe the stress distribution. In addition, the stress peaks distribution of the contact surface is shown in Figure 13, where the abscissa axis is the distribution of finite element nodes on the dovetail contact surface along y’ direction. The red curves in Figure 13a,b indicate that the maximum stress gradient in the peak stress area is not located in the marginal area, but in the position somewhat inward of the contact edge, which is in good agreement with the experimental crack initiation position in Figure 10.

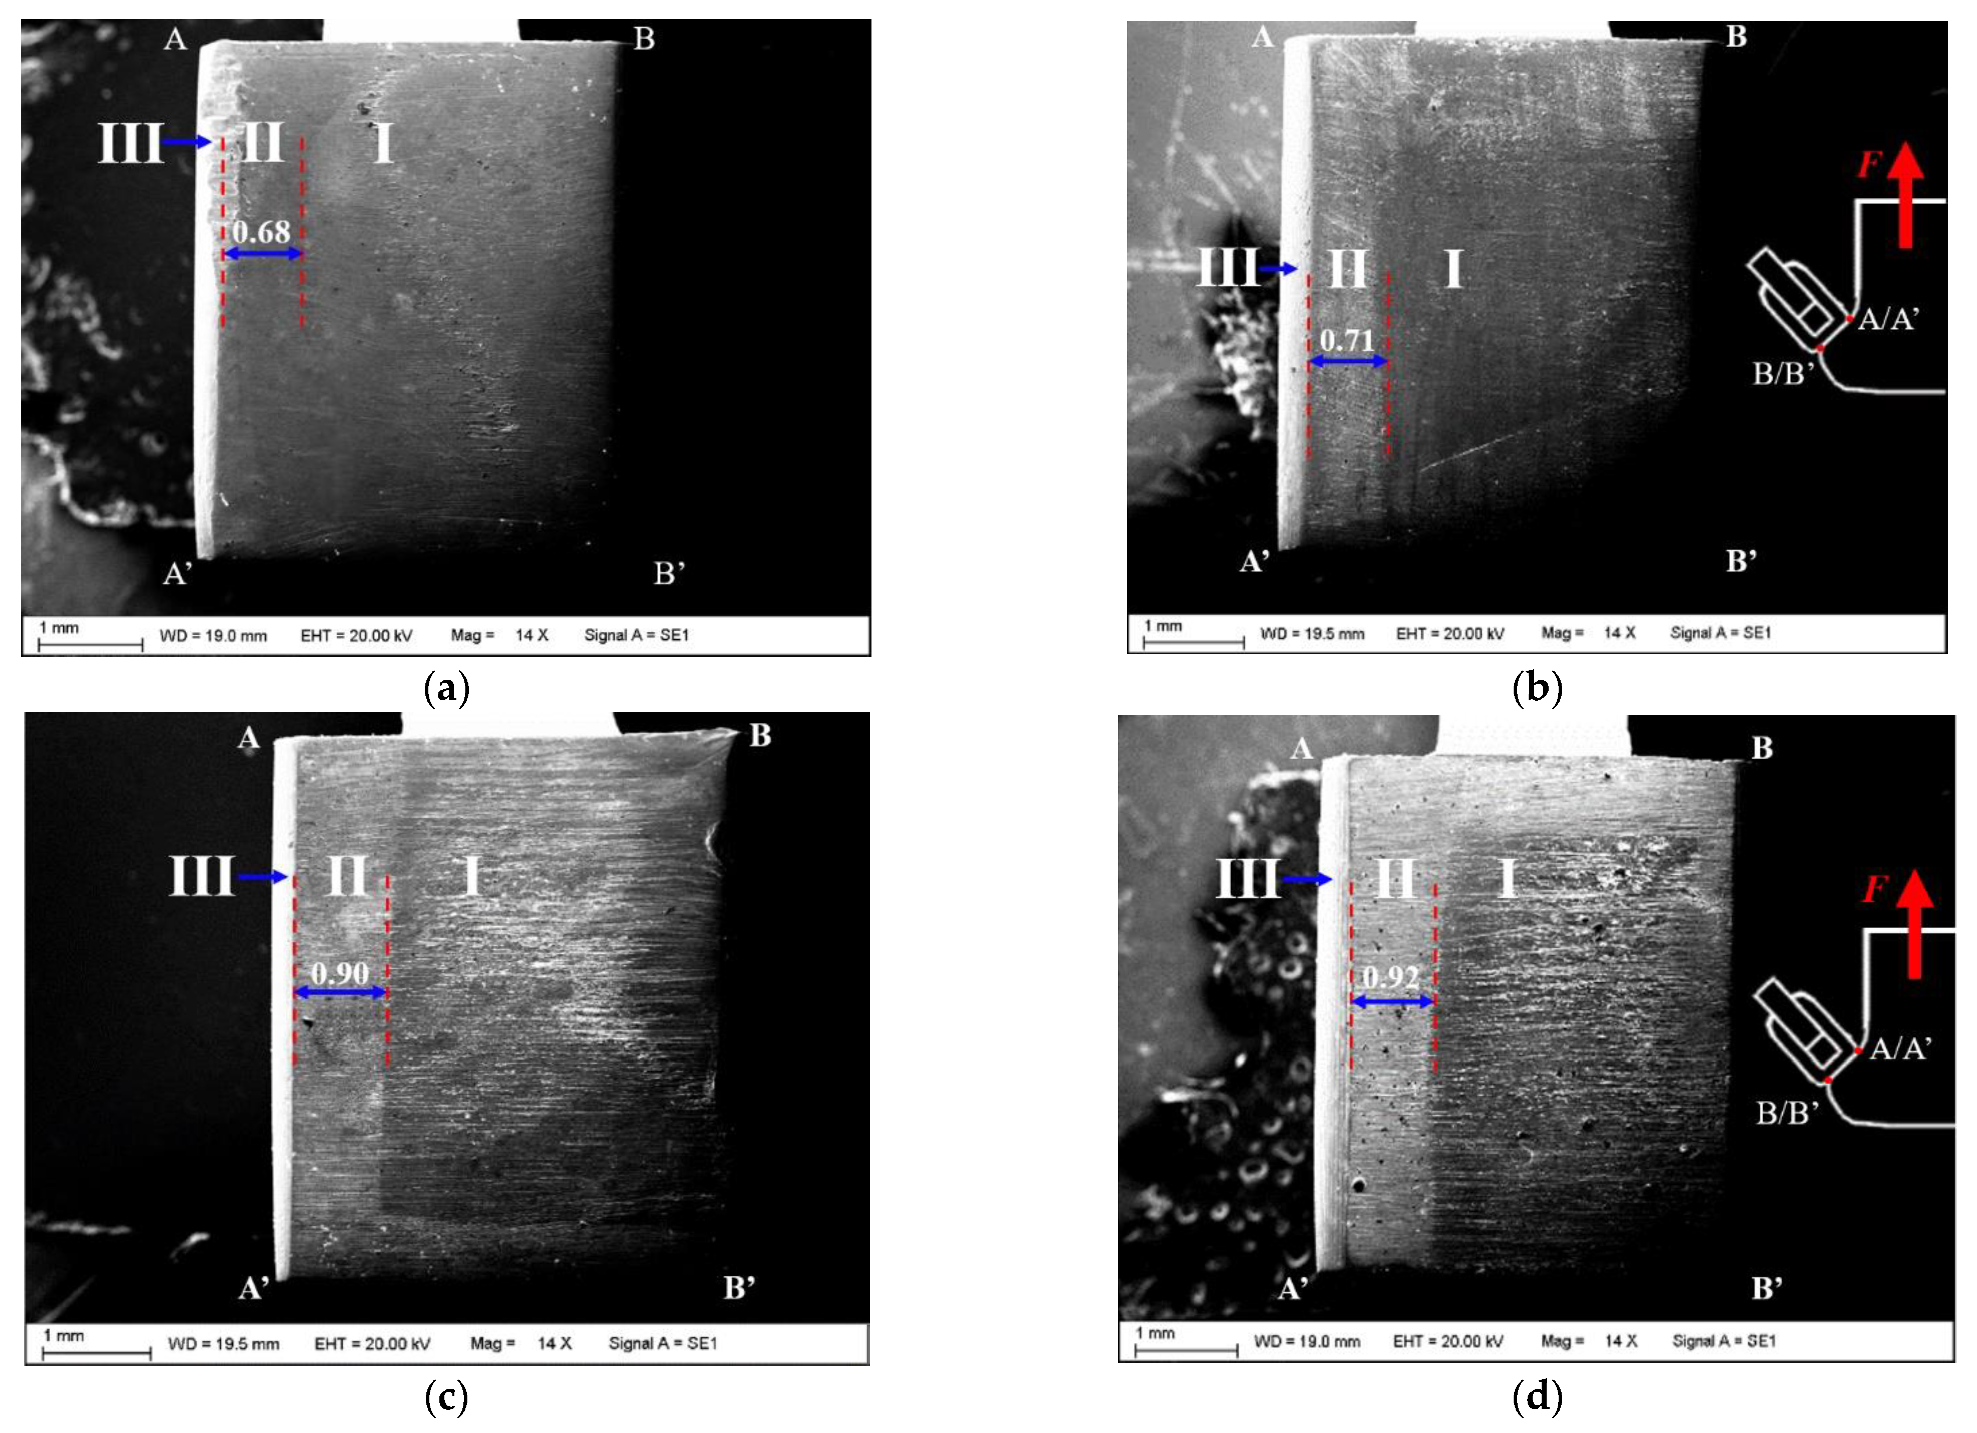
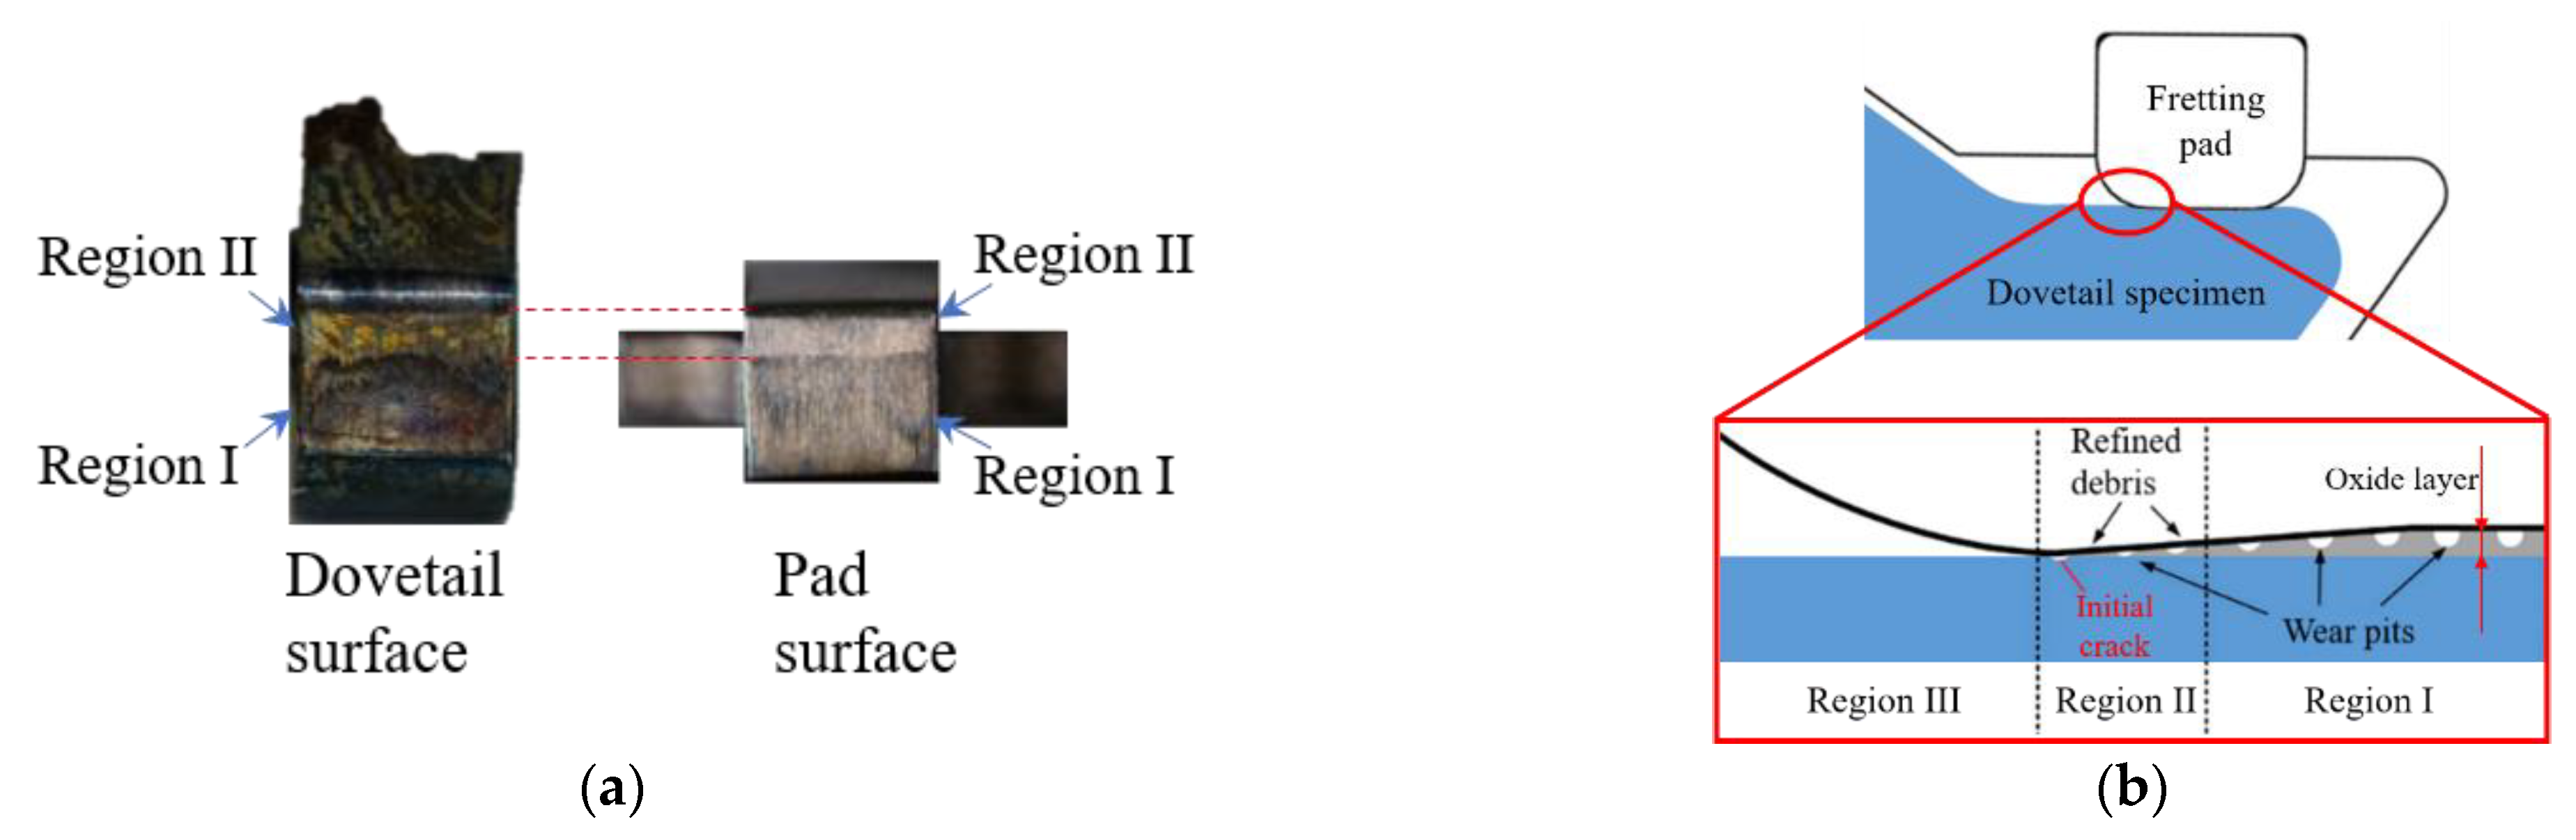
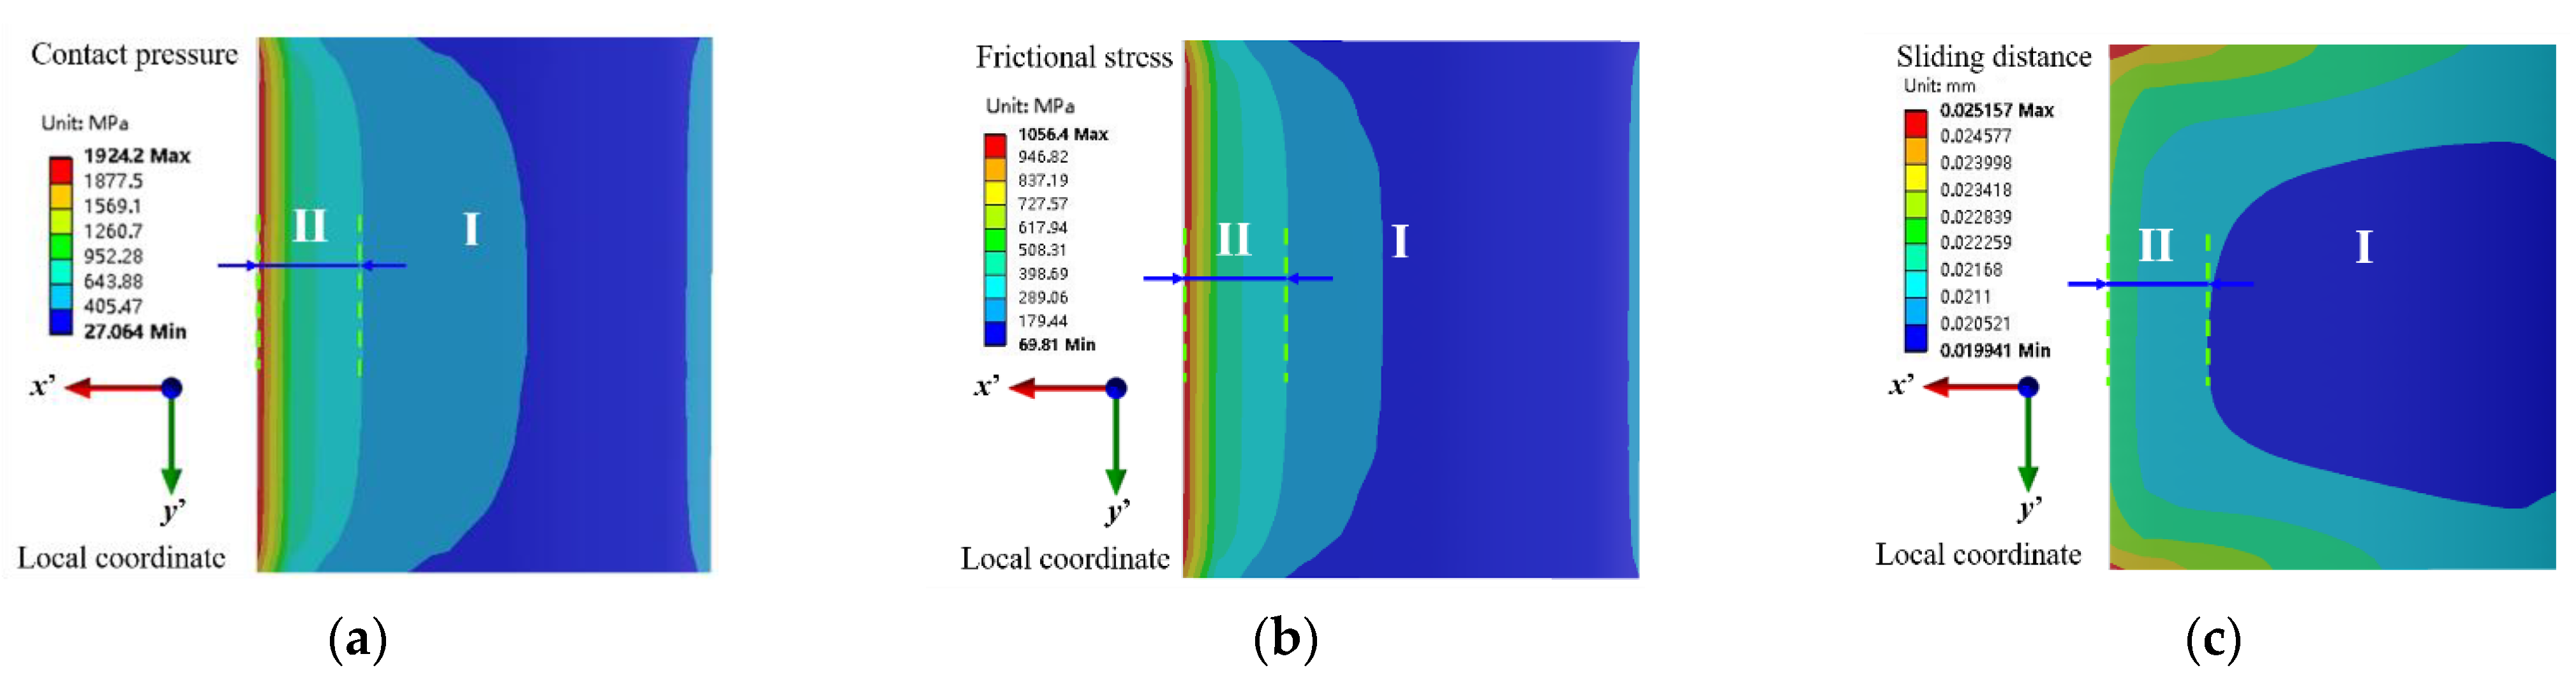
5.2. Partition Characteristics of the Fretting Contact Surface

It is reported from [14] that the specimen surface can be divided into three regions according to damage mechanism theoretically, namely, the stable wear region (Region I), crack initiation region (Region II), and undamaged region (Region III), as shown in Figure 14b. In this study, three regions can be easily distinguished from the SEM observations in Figure 9, reflecting a high degree of unity between theoretical analysis and experimental results. Moreover, the width of Region II increases slightly as the fatigue load increases. In addition, the intensification of fretting wear will result in the thinning and shedding of the oxide layer on the contact surface. In the SEM observation results of Figure 10 and the pictures of specimens in Figure 14a, the color of Region II is lighter than that of Region I. Therefore, it is obvious that the thickness of the oxide layer has been significantly reduced in Region II due to the dramatically changing stress state, which is consistent with the analysis of fretting fatigue mechanism in [14].
The stress state and sliding distance of the contact surface under 13,500N fatigue load are shown in Figure 15. Compared with Region I in Figure 15, the gradient of the calculated result in Region I is obviously more significant. The high stresses and relative sliding displacements result in the formation of wear pits, which reduces the effective loading area and increases stress as compared to the unworn specimen. Therefore, the oxidation layer becomes thinner as the fretting wear intensifies, and the fretting wear debris is constantly generated, resulting in fretting damage such as pitting on the fretting surface of Region II. Finally, under the simultaneous action of high-stress gradient and continuous large slip, fretting fatigue cracks were initiated, causing the fretting fatigue fracture from Region II.
The experimental results and theoretical analysis show that the contact surface of fretting fatigue has partition characteristics. The surface in contact can be divided into Region I and Region II by the observation of the specimen. Obviously, Region II has the characteristics of higher stress gradient, larger sliding distance, and thinner oxide layer. Hence, the degree of fretting wear in Region II is significantly higher than that in Region I. The rationality of contact surface partition was verified by the experiments in this paper.

5.3. Summary of the Numerical and Experimental Study

The experimental results in this paper show a high degree of consistency with the numerical calculation results. The consistency can be summarized in the following three aspects. Firstly, by comparing the experimental results of the fractured dovetail sepcimenand the numerical results of contact pressure distribution, it can be obtained that the crack initiation on the dovetail specimen occurred at the location of the maximum pressure gradient in the numerical calculation results. Secondly, the initial crack propagation direction of the broken specimen is along the Von Mises stress distribution direction. Thirdly, the theoretical partition phenomenon on the contact surface due to fretting wear can be clearly observed in the experimental results.
Limited by the calculation scale, the finite element calculation does not complete the process simulation from crack propagation to fracture and fretting fatigue life prediction. Further study may focus on the model reduction for the nonlinear contact computation and life evaluation.

6. Conclusions

In this paper, a fretting fatigue experimental system for the nickel-based single crystal superalloy dovetail specimen was designed, including the clamping device and a heating system of an electromagnetic induction coil. The fretting fatigue life of the dovetail specimen and microscopic damage were investigated. The contact surface’s stress state and partition characteristics were investigated by the finite element method and verified by the experimental results. The following is a summary of the major conclusions:
  • The initial fretting fatigue cracks of the dovetail specimen occurred at the location where the stress gradient is highest. The fretting fatigue life decreases as the fatigue load increases. The wear morphology of both the dovetail specimen and fretting pads is similar for different load conditions.
  • In the numerical calculation of the contact surface, the place where the contact pressure gradient is largest is verified as the initial crack position of fretting fatigue by the experiment. This area also has a larger gradient of frictional stress and sliding distance.
  • The calculation results of stress state and distribution using the 3D finite element model of contact surface show that the simplified method using 2D or quasi 3D model in contact calculation is not accurate enough. The calculated results for the 3D model are in good agreement with the experimental results.
  • The theoretical partitioning of the fretting surface can be clearly observed in the present experiment. There are apparent differences in the degree of wear for different regions of contact surfaces under fretting load. The flaking of the oxide layer in the upper edge area due to fretting wear is more serious, which promotes the initiation and propagation of fretting fatigue cracks.

Author Contributions

Conceptualization, Z.Q.; methodology, Z.Q.; software, Z.Q.; validation, Z.Q. and Z.C.; formal analysis, Z.Q.; investigation, Z.Q.; resources, B.W.; data curation, K.L.; writing—original draft preparation, Z.Q.; writing—review and editing, Z.Q. and K.L.; visualization, Z.Q.; supervision, Z.C.; project administration, Z.C. All authors have read and agreed to the published version of the manuscript.

Funding

This research received no external funding.

Institutional Review Board Statement

Not applicable.

Informed Consent Statement

Not applicable. Written informed consent has been obtained from the patients to publish this paper.

Data Availability Statement

All data generated and analyzed in this research are included in this published article.

Conflicts of Interest

The authors declare no conflict of interest. The funders had no role in the design of the study; in the collection, analyses, or interpretation of data; in the writing of the manuscript, or in the decision to publish the results.

References

  1. Rajasekaran, R.; Nowell, D. Fretting fatigue in dovetail blade roots: Experiment and analysis. Tribol. Int. 2006, 39, 1277–1285. [Google Scholar] [CrossRef]
  2. Nicholas, T. Critical issues in high cycle fatigue. Int. J. Fatigue 1999, 21, S221–S231. [Google Scholar] [CrossRef]
  3. Ciavarella, M.; Demelio, G. A review of analytical aspects of fretting fatigue, with extension to damage parameters, and application to dovetail joints. Int. J. Solids Struct. 2001, 38, 1791–1811. [Google Scholar] [CrossRef] [Green Version]
  4. Farris, T.N.; Szolwinski, M.P.; Harish, G. Fretting in aerospace structures and materials. In Fretting Fatigue: Current Technology and Practices; ASTM International: West Conshohocken, PS, USA, 2000. [Google Scholar]
  5. ASTM. Astm E2789-10: Standard Guide for Fretting Fatigue Test; ASTM International: West Conshohocken, PS, USA, 2010; p. 10. [Google Scholar]
  6. Jin, O.; Mall, S. Shear force effects on fretting fatigue behavior of Ti-6Al-4V. Metal. Mater. Trans. A 2004, 35, 131–138. [Google Scholar] [CrossRef]
  7. Alfredsson, B.; Cadario, A. A study on fretting friction evolution and fretting fatigue crack initiation for a spherical contact. Int. J. Fatigue 2004, 26, 1037–1052. [Google Scholar] [CrossRef]
  8. Li, X.; Yang, J.; Li, M. An investigation on fretting fatigue mechanism under complex cyclic loading conditions. Int. J. Fatigue 2016, 88, 227–235. [Google Scholar] [CrossRef]
  9. Murthy, H.; Gao, G.; Farris, T.N. Fretting fatigue of single crystal nickel at 600 °C. Tribol. Int. 2006, 39, 1227–1240. [Google Scholar] [CrossRef]
  10. Fenner, A.J. A study of the onset of fatigue damage due to fretting. N. E. Coast Inst. Eng. Shipbuild. 1960, 76, 183. [Google Scholar]
  11. Golden, P.J.; Hutson, A.; Sundaram, V. Effect of surface treatments on fretting fatigue of Ti-6Al-4V. Int. J. Fatigue 2007, 29, 1302–1310. [Google Scholar] [CrossRef]
  12. Golden, P.J.; Nicholas, T. The effect of angle on dovetail fretting experiments in Ti-6Al-4V. Fatigue Fract. Eng. Mater. 2005, 28, 1169–1175. [Google Scholar] [CrossRef]
  13. Golden, P.J. Development of a dovetail fretting fatigue fixture for turbine engine materials. Int. J. Fatigue 2009, 31, 620–628. [Google Scholar] [CrossRef]
  14. Sun, S.; Li, L.; Yue, Z. Fretting fatigue failure behavior of Nickel-based single crystal superalloy dovetail specimen in contact with powder metallurgy pads at high temperature. Tribol. Int. 2020, 142, 105986. [Google Scholar] [CrossRef]
  15. Nowell, D. An Analysis of Fretting Fatigue. Ph.D. Thesis, University of Oxford, Oxford, UK, 1988. [Google Scholar]
  16. Lykins, C.D.; Mall, S.; Jain, V. An evaluation of parameters for predicting fretting fatigue crack initiation. Int. J. Fatigue 2000, 22, 703–716. [Google Scholar] [CrossRef]
  17. Lykins, C.D.; Mall, S.; Jain, V.K. Combined experimental-numerical investigation of fretting fatigue crack initiation. Int. J. Fatigue 2001, 23, 703–711. [Google Scholar] [CrossRef]
  18. Huang, X.; Gibson, T.E.; Zhang, M. Fretting on the cubic face of a single-crystal Ni-base superalloy at room temperature. Tribol. Int. 2009, 42, 875–885. [Google Scholar] [CrossRef]
  19. Conner, B.P.; Nicholas, T. Using a dovetail fixture to study fretting fatigue and fretting palliatives. J. Eng. Mater. Technol. 2006, 128, 133–141. [Google Scholar] [CrossRef]
  20. Ruiz, C.; Boddington, P.H.B.; Chen, K.C. An investigation of fatigue and fretting in a dovetail joint. Exp. Mech. 1984, 24, 208–217. [Google Scholar] [CrossRef]
  21. Shi, L.; Wei, D.; Wang, Y. An investigation of fretting fatigue in a circular arc dovetail assembly. Int. J. Fatigue 2016, 82, 226–237. [Google Scholar] [CrossRef]
  22. Chen, J.J.; Liu, L.; Li, S.X. Experimental and numerical investigation on crack initiation of fretting fatigue of dovetail. Fatigue Fract. Eng. Mater. 2018, 41, 1426–1436. [Google Scholar] [CrossRef]
  23. Jin, O.; Mall, S. Effects of slip on fretting behavior: Experiments and analyses. Wear 2004, 256, 671–684. [Google Scholar] [CrossRef]
  24. Zhen, J.; Han, Y.; Chen, J. Influence of Mo and Al elements on the vacuum high temperature tribological behavior of high strength nickel alloy matrix composites. Tribol. Int. 2019, 131, 702–709. [Google Scholar] [CrossRef]
  25. Kesavan, D.; Done, V.; Sridhar, M.R. High temperature fretting wear prediction of exhaust valve material. Tribol. Int. 2016, 100, 280–286. [Google Scholar] [CrossRef]
  26. Wei, D.S.; Wang, Y.R. Analysis of fretting fatigue life of dovetail assemblies based on fracture mechanics method. Eng. Fail. Anal. 2012, 25, 144–155. [Google Scholar] [CrossRef]
  27. Sinclair, G.B.; Cormier, N.G. Contact stresses in dovetail attachments: Physical modeling. J. Eng. Gas. Turbines Power 2002, 124, 325–331. [Google Scholar] [CrossRef]
  28. Wei, D.S.; Wang, Y.R.; Yang, X.G. Analysis of failure behaviors of dovetail assemblies due to high gradient stress under contact loading. Eng. Fail. Anal. 2011, 18, 314–324. [Google Scholar] [CrossRef]
  29. Matlik, J.F.; Farris, T.N.; Haynes, J. Prediction of fretting crack location and orientation in a single crystal nickel alloy. Mech. Mater. 2009, 41, 1133–1151. [Google Scholar] [CrossRef] [Green Version]
  30. Rajasekaran, R.; Nowell, D. On the finite element analysis of contacting bodies using submodelling. J. Strain Anal. Eng. 2005, 40, 95–106. [Google Scholar] [CrossRef]
  31. Lemoine, E.; Nélias, D.; Thouverez, F. Influence of fretting wear on bladed disks dynamic analysis. Tribol. Int. 2020, 145, 106148. [Google Scholar] [CrossRef]
  32. Qu, Z.; Hu, D.; Chen, Z. Contact nonlinear analysis for the under-platform dampers of blade based on a frictional energy dissipation model. Structures 2021, 30, 146–155. [Google Scholar] [CrossRef]
  33. Peirce, D.; Asaro, R.J.; Needleman, A. Material rate dependence and localized deformation in crystalline solids. Acta Metall. Sin. 1983, 31, 1951–1976. [Google Scholar] [CrossRef]
  34. Asaro, R.J.; Needleman, A. Overview no. 42 texture development and strain hardening in rate dependent polycrystals. Acta Metall. Sin. 1985, 33, 923–953. [Google Scholar] [CrossRef]
  35. Mao, H.Z.; Wen, Z.X.; Yue, Z.F. The evolution of plasticity for nickel-base single crystal cooled blade with film cooling holes. Mater. Sci. Eng. A 2013, 587, 79–84. [Google Scholar] [CrossRef]
  36. Yang, Q.; Zhou, W.; Zhong, Y. Effect of shot-peening on the fretting wear and crack initiation behavior of Ti-6Al-4V dovetail joint specimens. Int. J. Fatigue 2018, 107, 83–95. [Google Scholar] [CrossRef]
  37. Zhang, D.; Xia, Y.; Scarpa, F. Interfacial contact stiffness of fractal rough surfaces. Sci Rep.-UK 2017, 7, 12874. [Google Scholar] [CrossRef] [Green Version]
  38. Bo, S.; Feilong, Y.; Jingyao, D. A fractal contact friction model and nonlinear vibration response studies of loosely assembled blade with dovetail root. Turbo Expo: Power for Land, Sea, and Air. Am. Soc. Mech. Eng. 2016, 49835, V07. [Google Scholar]
Figure 1. Illustration of different fretting fatigue arrangements. (a) Bridge-type; (b) block-type; (c) dovetail-type; (d) dovetail-type with pads.
Applsci 11 09913 g001
Figure 2. Dimensions of the specimen. (a) Dovetail specimen; (b) clamp; (c) fretting pad specimen. (Unit: mm).
Applsci 11 09913 g002
Figure 3. Test equipment for fretting fatigue.
Applsci 11 09913 g003
Figure 4. Schematic diagram of the multiplicative decomposition of the deformation gradient.
Applsci 11 09913 g004
Figure 5. Mesh and boundary conditions.
Applsci 11 09913 g005
Figure 6. The fitting curve of maximum load and fretting failure life.
Applsci 11 09913 g006
Figure 7. The fracture failure mode of dovetail specimens for different fretting loads. (a) 13,500 N; (b) 16,451.6 N.
Applsci 11 09913 g007
Figure 8. Pitting corrosion on the fretting surface. (a) The 63 times magnification; (b) the 1480 times magnification.
Applsci 11 09913 g008
Figure 9. Wear morphology of the fretting surfaces for four loading conditions (unit: mm). (a) 13,500 N; (b) 14,956 N; (c) 16,451.6 N; (d) 17,947.2 N.
Applsci 11 09913 g009
Figure 10. Observation of the cracked specimen. (a) Fractured dovetail specimen; (b) SEM of the fracture surface.
Applsci 11 09913 g010
Figure 11. Stress distribution of dovetail specimen (13,500 N). (a) Von Mises stress; (b) maximum shear stress.
Applsci 11 09913 g011
Figure 12. Distribution of the contact pressure on the contact surface for two fatigue load conditions. (a) 13,500 N; (b) 16,451.6 N.
Applsci 11 09913 g012
Figure 13. Peak pressure distribution at the upper and lower end of the contact surface. (a) 13,500 N; (b) 16,451.6 N.
Applsci 11 09913 g013
Figure 14. Fretting fatigue damage mechanism for experimental and theoretical analysis. (a) Picture of specimens; (b) partition of contact surface.
Applsci 11 09913 g014
Figure 15. Contact state of the contact surface for the numerical results (13,500 N). (a) Contact pressure; (b) frictional stress; (c) sliding distance.
Applsci 11 09913 g015
Table 1. Chemical composition of DD10(wt.%).
CrCoWAlTaMoTiNi
12.55.04.54.05.50.54.0Bal.
Table 2. Chemical composition of FGH99(wt.%).
CCoCrWMoAlTiNbHf
0.0320134.32.93.63.51.50.35
Table 3. Parameters for the fretting fatigue test.
ParameterValue
Temperature630 °C
Load amplitude13,500 N,14,956 N,16,451.6 N,17,947.2 N
Load ratio0.05
Frequency1 Hz
Load spectrum typeSine wave
Table 4. Material parameters for DD10.
T(°C)253006007007608509801070110011201140
E (GPa)128.149121.668113.044108.178104.46698.83590.12981.41177.06974.10171.238
υ 0.3690.3820.3990.4070.4140.4200.4320.4420.4510.4570.464
Table 5. Material parameters for FGH99.
T(°C)20200350400500600700750800
E (GPa)221216210205198180161193178
υ 0.3
Table 6. Relative error for the finite element method.
Element Size of
Contact Surface (mm)
Maximum Contact
Pressure Pm (MPa)
Maximum Contact
Pressure Increment Pi (MPa)
Relative
Error Pi/Pm (%)
0.11732.61
0.051851.08118.476.4
0.0081924.273.123.8
0.0051976.4652.262.6
Table 7. Fretting fatigue failure life of DD10 dovetail specimen.
No. of SpecimenMaximum
Load (N)
Load RatioFretting Fatigue Failure
Life (Cycles)
Averaged Failure Life
(Cycles)
113,5000.0546,63449342
252,050
314,9560.0557969652.5
413,509
516,451.60.0561175823.5
65530
717,947.20.0542235256.5
86290
Publisher’s Note: MDPI stays neutral with regard to jurisdictional claims in published maps and institutional affiliations.

