Abstract
In this study, we present a simple, sensitive and selective analytical procedure for the ibuprofen (IBP) analysis using the commercially available screen-printed carbon electrode electrochemically activated (aSPCE) by cyclic voltammetry in 0.1 M NaOH. The quantitative determinations of IBP were carried out in 0.25 M acetate buffer solution of pH 4.5 ± 0.1 using the differential-pulse voltammetry (DPV). Different experimental parameters for DPV analysis were optimized, including pH and concentration of supporting electrolyte, amplitude (ΔEA), scan rate (ν) and modulation time (tm). The linear ranges of calibration curve were from 0.50–20.0 and 20.0–500.0 µM. The detection and quantification limits were estimated to be 0.059 and 0.20 µM. The aSPCE displayed satisfactory repeatability, reproducibility, and selectivity. Furthermore, the DPV procedure with the use of aSPCE was used to determination of IBP in pharmaceutical formulations. The results achieved by DPV show satisfactory agreement with those obtained by manufacturers (the relative errors are in the range of 3.1–4.7%).
1. Introduction
Ibuprofen, 2-(4-isobutyphenyl)propionic acid is one of the important nonsteroidal anti-inflammatory drugs (NSAIDs) commonly prescribed for treatment of chronic and acute pain and many rheumatic and musculoskeletal disorders. It is also used in case of fever symptoms [1,2,3]. Ibuprofen works by non-selective inhibition of cyclooxygenase-1 (COX-1) and cyclooxygenase-2 (COX-2). While its anti-inflammatory properties can be weaker than those of some other NSAIDs, it has a prominent analgesic and antipyretic role. Its effects are due to the inhibitory actions on cyclo-oxygenases, which are involved in the synthesis of prostaglandins involved in production of pain, inflammation and fever [4].
Ibuprofen is available as tablets with an active substance content of 200 to 800 mg. The usual dose is 400 to 800 mg three times a day [4]. It is rapidly absorbed, peak serum concentrations are reached within 3 h of administration, and highly protein bound (98%). Ibuprofen is completely eliminated in 24 h after last dose. Ibuprofen is metabolized by two pathways. The major pathway is oxidation in the liver, which produces two major inactive metabolites (hydroxyibuprofen and carboxyibuprofen). The second pathway is glucuronidation, which produces the reactive ibuprofen acylglucoronide and contributes to an increased risk of toxicity [5]. More than 90% of the administered dose is excreted in the urine in the form of metabolites or their conjugates, the main metabolites are hydroxylated and carboxylated compounds [4].
The popularity and availability make ibuprofen one of the most frequently detected and quantified analyte in pharmaceutical analysis. In the literature, you can find many methods of ibuprofen quantification in various types of samples. The methods used include spectrophotometry [3,6], spectrofluorometry [2], reversed-phase high-performance liquid chromatography (RP-HPLC) [7,8], liquid chromatography-tandem mass spectrometry (LC-MS/MS) [5], gas chromatography-mass spectrometry (GC-MS) [1] and capillary zone electrophoresis (CZE) [9]. In the determination of ibuprofen, electrochemical methods, such as voltammetry, are also used, both with the use of traditional working electrodes [10,11] and screen-printed sensors [12,13,14]. Nevertheless, most of these methods suffer from poor sensitivity/selectivity or high consumption of reagents and cost of apparatus. Thus, the focus of the present paper is the use of electrochemically activated screen-printed carbon sensor (aSPCE) and voltammetric technique to develop reliable and sensitive analytical method, which can permit cost-effective, convenient, rapid and selective IBP determination.
2. Materials and Methods
2.1. Apparatus and Regents
Electrochemical measurements, i.e., cyclic voltammetry (CV) and differential-pulse voltammetry (DPV) were performed on a µAutolab analyzer (Eco Chemie, Utrecht, The Netherlands) controlled by GPES 4.9 software. The experiments were done in a electrochemical cell with a commercially available screen-printed carbon sensor (Metrohm-DropSens, Asturias, Spain).
Ibuprofen sodium salt was obtained from Merck (Darmstadt, Germany). A ibuprofen stock solution was prepared by dissolving reagent in water. Sodium acetate and acetic acid were obtained from Merck (Darmstadt, Germany) and prepared as acetate buffer solution (1.0 M). The effect of interferences was examined using reagents (glucose, and paracetamol) purchased from Merck, Darmstadt, Germany. All solutions were prepared using ultrapurified water (>18 MW cm, Milli-Q system, Millipore, UK).
2.2. Preparation of aSPCE
The SPCE was electrochemically activated using already described procedure [15]. Five voltammetric cycles between 0 and 2 V at a scan rate of 100 mV s−1 were done in a 0.1 M solution of NaOH. Then, the sensor was rinsed with deionized water and used for IBP analysis.
2.3. Ibuprofen (IBP) Analysis
Under optimized conditions IBP determinations were done in 0.25 M acetate buffer solution of pH 4.5 ± 0.1 using differential-pulse voltammetry (DPV). After 45 s of stirring solution under open circuit, DPVs were recorded from 0.2 to 1.8 V with an amplitude (ΔEA) of 150 mV, a scan rate (ν) of 200 mV s−1, and a modulation time (tm) of 25 ms. The background curve was subtracted from each voltammogram. The average values of Ip are shown with the standard deviation of n = 3.
2.4. Pharmaceutical Formulations
Pharmaceutical formulations (tablets 1 containing 200 mg IBP; tablets 2 containing 200 mg IBP and 12.8 mg codeine) were tested. The three tablets of each drug were powdered in a mortar and the samples with corresponding average weight of one tablet were dissolved in 10 mL of 0.1 M NaOH. The samples were placed in an ultrasonic bath for 30 min and filtered through a 0.22 µm Millipore filter. Then, 2.30 µL of sample was added to the supporting electrolyte and DPV analyzed.
3. Results and Discussion
3.1. Electrochemical Behaviour of IBP
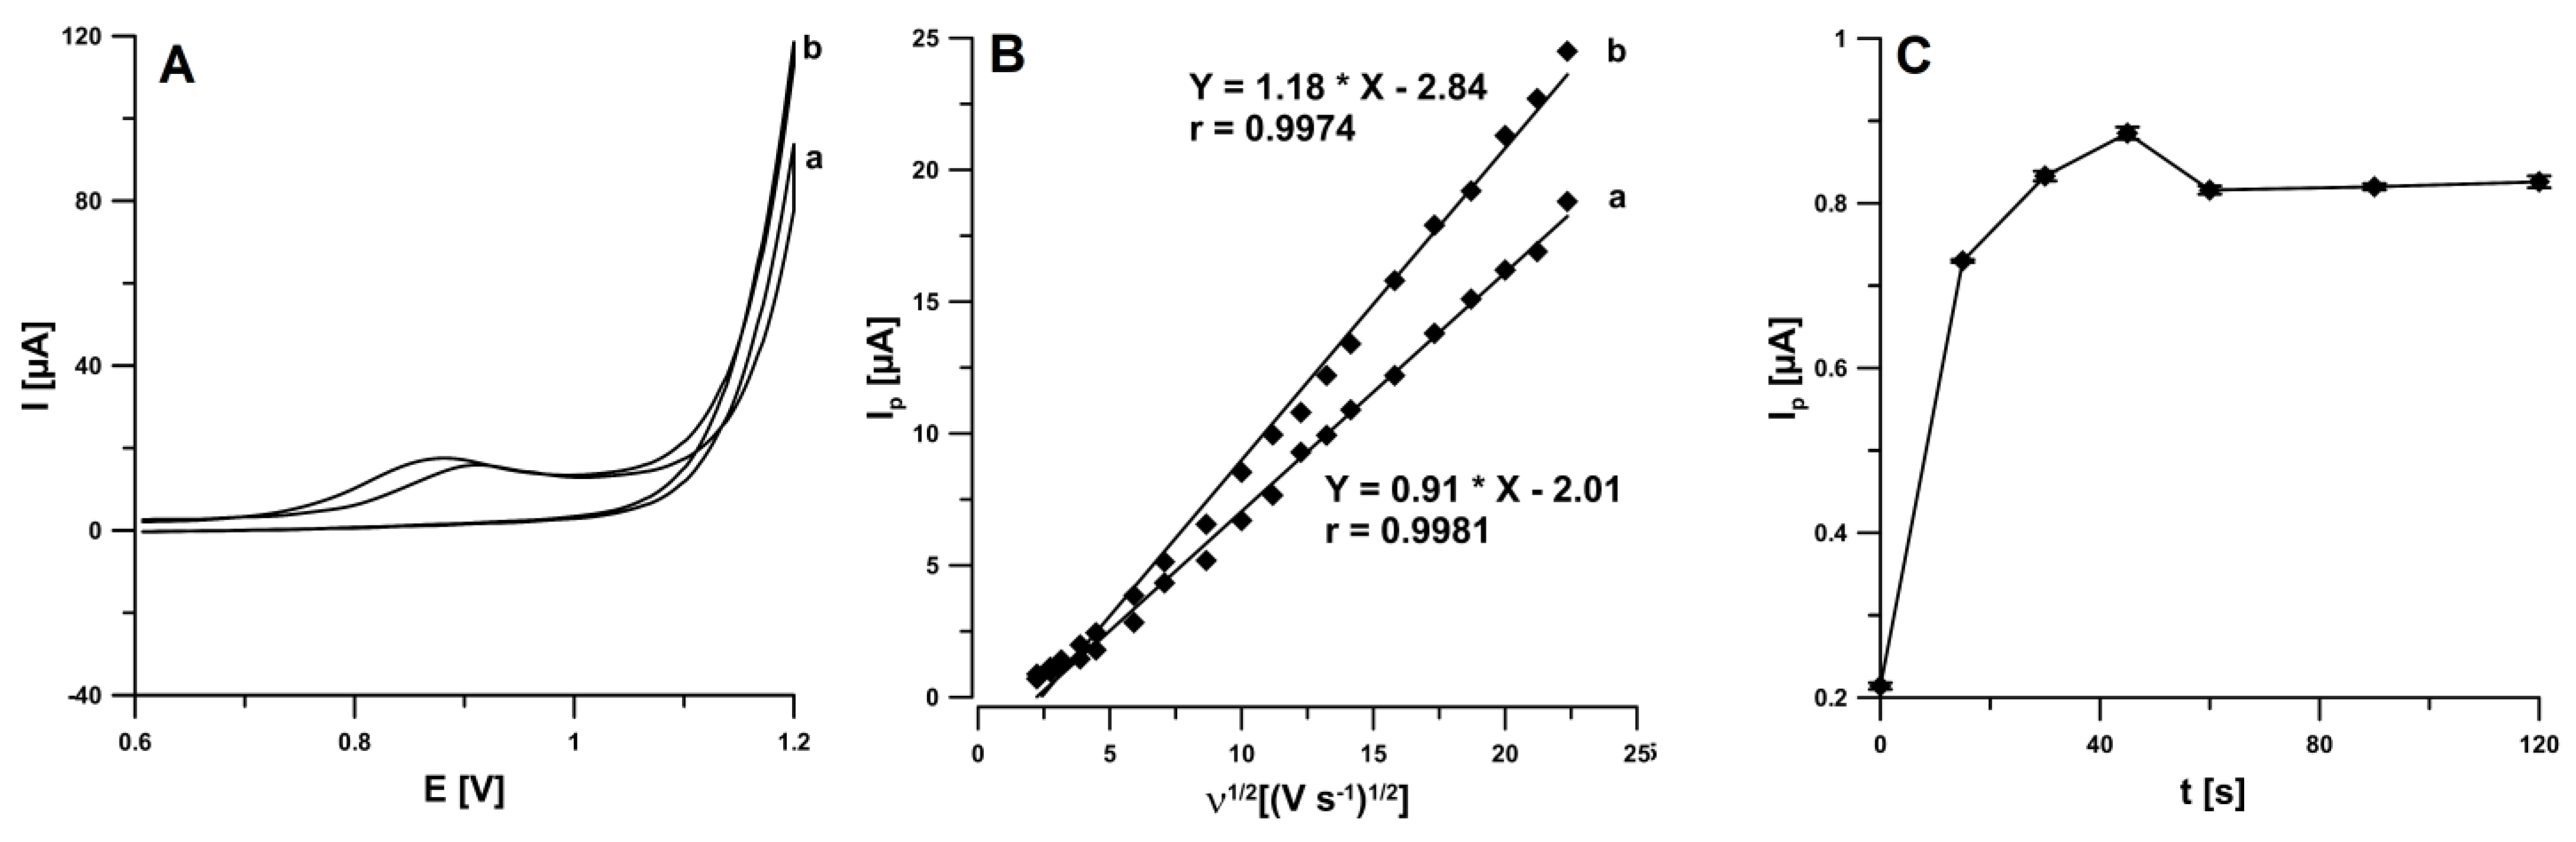
In the first stage of experimental work, the electrochemical behaviour of IBP was examined at the SPCE in the 0.25 M acetate buffer solution of pH 4.5 ± 0.1 containing 0.1 mM IBP. The cyclic voltammograms (CVs) were recorded for the different scan rates from 5 to 500 mV s−1, and two time of stirring solution (5 and 60 s without applying potential to the working electrode) before IBP determination. CVs indicated the presence of one peak in the anodic run (around 0.9 V). In the backward scan of the CVs no IBP signal was visible (Figure 1A). The stirring time extending contributed to an increase in the intensity of the IBP peak current (6.7 vs. 8.5 µA). This is connected with facilitated diffusion of IBP molecules in the supporting electrolyte to the electrode surface during stirring [16]. It was confirmed on the basis of the dependence between the IBP peak current (Ip) and the square root of the scan rate (v1/2). As can be seen in Figure 1B, the linear correlations (r = 0.9974 for 5 s and r = 0.9981 for 60 s) suggest that the process is diffusion-controlled. Moreover, the effect of solution stirring time under open circuit (0–120 s) on the analytical signal of 20.0 µM IBP was evaluated (Figure 1C). It was found that the peak current of IBP is lower without stirring solution before the voltammetric signal recording. The IBP signal reached maximal and stable value in the time of 45 s, so for further studies the stirring solution time of 45 s was chosen.

Figure 1.
(A) CVs recorded in 0.25 M acetate buffer solution of pH 4.5 ± 0.1 containing 0.1 mM IBP at scan rate of 100 mV s−1 (a—5 s, b—60 s), (B) the dependence between Ip and ν1/2 for ν from 5 to 500 mV s−1 (a—5 s, b—60 s), (C) effect of solution stirring time on the analytical signal of 20.0 µM IBP.
3.2. Optimization of pH and Supporting Electrolyte Concentration
The influence of supporting electrolyte type (0.25 mol L−1 H2SO4, CH3COONa + CH3COOH of pH 3.5, 4.0, 4.5, 5.0 and 6.0 ± 0.1) on the IBP signal (20.0 µM) was tested (Figure 2A). The IBP oxidation peak was visible in all acetate buffer solutions. However, the highest signal was obtained in the acetate buffer solution of pH 4.5 ± 0.1, so CH3COONa + CH3COOH of pH 4.5 ± 0.1 was applied in subsequently studies. Then, the optimization of supporting electrolyte concentration was performed (0.025–0.50 M). As shown in Figure 2B, the oxidation peak current of IBP gradually increased with increasing buffer concentration from 0.025 to 0.25 M, and for concentration of 0.5 M, the peak current was decreased. Therefore, 0.25 M was used as the optimal acetate buffer concentration for each measurement of IBP.
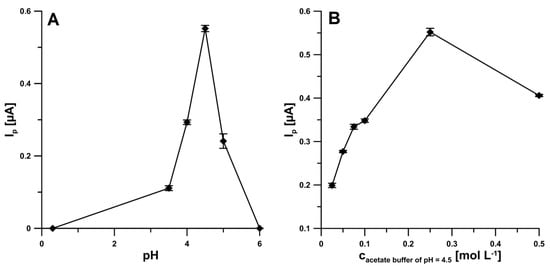
Figure 2.
Effect of pH (A) and acetate buffer concentration (B) on the analytical signal of 20.0 µM IBP.
3.3. Optimization of DPV Parameters
It was checked that square-wave voltammetry (SWV) allowed to obtain the lower peak current of IBP than DPV for the same conditions and concentration of analyte (20.0 µM). Therefore, the DPV was recommended for the IBP analysis. The influence of different levels of DPV instrumental parameters (amplitude (ΔEA), scan rate (ν), and modulation time (tm)) on the IBP peak current was investigated. For ν of 100 mV s−1 and tm of 20 ms, the amplitude was varied from 25 to 225 mV. As can be seen in Figure 3A, taking into account the highest peak current of IBP, the ΔEA of 225 mV can be considered as an optimum. However, as a compromise between the height and peak shape an amplitude of 150 mV was chosen. Next, the effect of the ν value, ranging from 50 to 250 mV s−1 (ΔEA of 150 mV, tm of 20 ms), was analyzed. The highest IBP peak current was found at the ν value of 200 mV (Figure 3B), so this value was used for subsequent studies. Moreover, the tm was varied from 10 to 35 ms (ΔEA of 150 mV, ν of 200 mV s−1). For tm of 25 ms, the highest IBP peak current was obtained (Figure 3C), therefor this value was chosen.
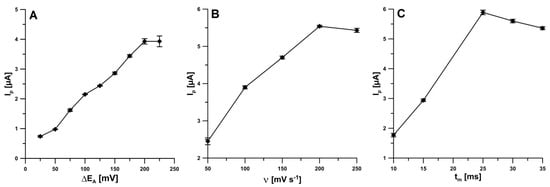
Figure 3.
Effect of ΔEA (A), ν (B) and tm (C) on the analytical signal of 20.0 µM IBP.
3.4. Analytical Characteristic (LOD, LOQ, Repeatability, Reproducibility and Selectivity)
In our earlier work, we found that the electrochemical activation of the electrode surface using CV in 0.1 M NaOH resulted in changes in its morphology and a decrease in the charge transfer resistance, which translated into a significant increase in the rifampicin oxidation peak current [15]. Based on these conclusions, under optimized conditions the DPV measurements were made to two IBP calibration curves, at the non-activated electrode (SPCE) and electrochemically activated using CV in 0.1 M NaOH electrode (aSPCE). As shown in Figure 4A,C, with the increase of IBP concentrations, the DPV oxidation peaks increased gradually. As can be seen, the linear ranges of calibration curve obtained at the SPCE were from 5.0–50.0 and 50.0–500.0 µM. Moreover, the results demonstrated that the anodic peak currents were proportional to two ranges of IBP concentration intervals (Figure 4D), one is 0.5–20.0 µM (r = 0.9988) and the other is 20.0–500.0 µM (r = 0.9992) at the aSPCE. The limits of detection (LOD) and quantification (LOQ) were 1.50 and 5.0 µM (for SPCE), and 0.059 and 0.20 µM (for aSPCE), respectively (LOD = 3SDa/b; LOQ = 10SDa/b, SDa—standard deviation of intercept (n = 3); b—slope of calibration curve) [17]. The results confirmed that the electrochemical activation by CV in 0.1 M NaOH surface of screen-printed electrode contributes to the enhancement of analytical signals and thus to lowering the LOD and LOQ of IBP. Moreover, compared with the aSPCE and SPCE, the oxidation peak shifted towards less positive potential at the aSPCE. As can be seen, the LOD is significantly lower than those obtained for another methods and electrodes. It should be emphasized that the SPCE activation procedure was performed only once before all DPV measurements for the one IBP calibration curve. So the SPCE surface should be electrochemically activated before replacing the IBP solution.
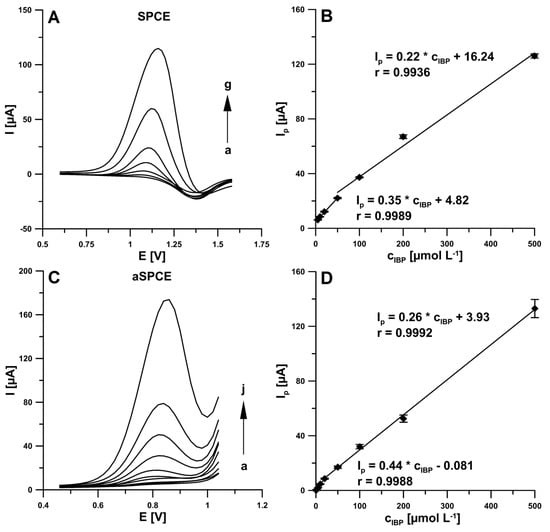
Figure 4.
(A) DPVs recorded at the SPCE in 0.25 M acetate buffer solution of pH 4.5 ± 0.1 containing increasing concentrations of IBP: (a) 5.0, (b) 10.0, (c) 20.0, (d) 50.0, (e) 100.0, (f) 200.0, (g) 500.0 µM. (B) Calibration plot of IBP at the SPCE. (C) DPVs recorded at the aSPCE in 0.25 M acetate buffer solution of pH 4.5 ± 0.1 containing increasing concentrations of IBP: (a) 0.5, (b) 1.0, (c) 2.0, (d) 5.0, (e) 10.0, (f) 20.0, (g) 50.0, (h) 100.0, (i) 200.0, (j) 500.0 µM. (D) Calibration plot of IBP at the aSPCE. Stirring solution of 45 s under open circuit. The DPV parameters: ΔEA of 150 mV, ν of 200 mV s−1 and tm of 25 ms.
A comparison between the analytical performance of the present activated sensor and other methods as well as some previous literature electrodes for the determination of IBP in pharmaceutical formulations is given in Table 1.

Table 1.
Comparison of different methods for IBP determination in pharmaceutical formulations.
For validation of the proposed analytical procedure, IBP signal repeatability, reproducibility of electrode-to-electrode and selectivity of method were evaluated. The repeatability was examined by the determination of 20.0 µM at the aSPCE for ten successive measurements. The relative standard deviation (RSD) of the result was 3.5% (n = 10), indicating that the IBP at the aSPCE has good repeatability. Moreover, under the same procedure, three aSPCE were prepared independently and the reproducibility was estimated. The RSD was 4.5% (n = 9) for the peak current measured for 20.0 µM IBP, which demonstrates the reliability of the electrochemical activation procedure.
Next, the effect of potential interferents occurring in pharmaceutical formulations on the IBP signal (20.0 µM) was studied. It was found that the IBP signals are stable (up to ±10%) for the 50-fold excess of glucose and paracetamol.
3.5. Application
In order to evaluate the ability of the DPV procedure with aSPCE for the IBP analysis in real samples and to investigate the possibility of interfering matrix effect, the IBP was determined in pharmaceuticals by the standard additions method. The results were presented in Table 2. According to the results, the obtained standard deviation (SD) and relative error values were satisfactory and acceptable. These results confirm the good precision and accuracy of the proposed analytical procedure and indicating that the aSPCE had potential in the real sample analysis and is free from interferences of substances found in pharmaceutical formulations.
Table 2.
Summary of IBP determination in pharmaceutical tablets using DPV and aSPCE.
4. Conclusions
In this paper, we proposed analytical procedure for the determination of IBP using the DPV and the electrochemically activated screen-printed carbon electrode (aSPCE). Compared with the aSPCE and SPCE, the current responses of IBP, linear range, LOD and LOQ were improved significantly at the aSPCE. The signal enlargements can be attributed to our already published conclusions, the electrochemical activation of the electrode surface using CV in 0.1 M NaOH resulted in changes in surface morphology and a decrease in the charge transfer resistance [15]. The developed procedure with the aSPCE has advantages such as simplicity of electrode preparation and DPV measurements, wide linear range, low LOD and LOQ, selectivity, good IBP signal repeatability and reproducibility of electrode-to-electrode, low consumption of reagents, simplicity of sample preparation, and low cost of IBP analysis. To the best of our knowledge, no other works in the literature have been reported on applying the aSPCE for the IBP determination in pharmaceutical formulations.
Author Contributions
Conceptualization, K.T.-R.; methodology, K.T.-R.; investigation, K.T.-R., J.K. and A.W.; writing—original draft preparation, K.T.-R. and J.K.; writing—review and editing, K.T.-R. and J.K.; supervision, K.T-R. All authors have read and agreed to the published version of the manuscript.
Funding
This research received no external funding.
Institutional Review Board Statement
Not applicable.
Informed Consent Statement
Not applicable.
Data Availability Statement
The data presented in this study are available on request from the corresponding author.
Conflicts of Interest
The authors declare no conflict of interest.
References
- Yilmaz, B.; Erdem, A.F. Determination of ibuprofen in human plasma and urine by gas chromatography/mass spectrometry. J. AOAC Int. 2014, 97, 415–420. [Google Scholar] [CrossRef] [PubMed]
- Mohammadnejad, M. Simultaneous determination of ibuprofen and caffeine in urine samples by combining MCR-ALS and excitation-emission data. Anal. Bioanal. Chem. Res. 2016, 3, 123–130. [Google Scholar]
- Wang, Q.-L.; Xie, J.; Li, X.-D.; Ding, L.-S.; Liang, J.; Pei, L.; Qing, L.-S. Development of a nano-SiO2 based enzyme-linked ligand binding assay for the determination of ibuprofen in human urine. Talanta 2017, 167, 617–622. [Google Scholar] [CrossRef] [PubMed]
- Bushra, R.; Aslam, N. An overview of clinical pharmacology of ibuprofen. Oman Med. J. 2010, 25, 155–161. [Google Scholar] [CrossRef] [PubMed]
- Puangpetch, A.; Limrungsikul, A.; Prommas, S.; Rukthong, P.; Sukasem, C. Development and validation of a liquid chromatography-tandem mass spectrometry method for determination of ibuprofen in human plasma. Clin. Mass Spectrom. 2020, 15, 6–12. [Google Scholar] [CrossRef]
- Türk, S.C.; Şatana, E.; Basan, H.; Göǧer, N.G. Determination of ibuprofen and paraben in pharmaceutical formulations using flow-injection and derivative spectrophotometry. J. Anal. Chem. 2015, 70, 50–54. [Google Scholar] [CrossRef]
- Han, Z.; Lu, L.; Wang, L.; Yan, Z.; Wang, X. Development and Validation of an HPLC Method for Simultaneous Determination of Ibuprofen and 17 Related Compounds. Chromatographia 2017, 80, 1353–1360. [Google Scholar] [CrossRef]
- Borahan, T.; Unutkan, T.; Şahin, A.; Bakırdere, S. A rapid and sensitive reversed phase-HPLC method for simultaneous determination of ibuprofen and paracetamol in drug samples and their behaviors in simulated gastric conditions. J. Sep. Sci. 2019, 42, 678–683. [Google Scholar] [CrossRef] [PubMed]
- Ragab, M.A.A.; Abdel-Hay, M.H.; Ahmed, H.M.; Mohyeldin, S.M. Application of capillary zone electrophoresis coupled with a diode array detector (CZE-DAD) for simultaneous analysis of ibuprofen and phenylephrine. J. AOAC Int. 2019, 102, 473–479. [Google Scholar] [CrossRef] [PubMed]
- Švorc, L.; Strežová, I.; Kianičková, K.; Stanković, D.M.; Otřísal, P.; Samphao, A. An advanced approach for electrochemical sensing of ibuprofen in pharmaceuticals and human urine samples using a bare boron-doped diamond electrode. J. Electroanal. Chem. 2018, 822, 144–152. [Google Scholar] [CrossRef]
- EL Ouafy, H.; El Ouafy, T.; Oubenali, M.; EL Haimouti, A.; Gamouh, A.; Mbarki, M. Electrocatalytic effect of Al2O3 supported on clay in oxidizing of ibuprofen at graphite electrode. Metods Objects Chem. Anal. 2021, 16, 81–87. [Google Scholar] [CrossRef]
- Apetrei, I.M.; Bejinaru, A.A.; Boev, M.; Apetrei, C.; Buzia, O.D. Determination of ibuprofen based on screen-printed electrodes modified with carbon nanofibers. Farmacia 2017, 65, 790–795. [Google Scholar]
- Serrano, N.; Castilla, O.; Ariño, C.; Diaz-Cruz, M.S.; Diaz-Cruz, J.M. Commercial screen-printed electrodes based on carbon nanomaterials for a fast and cost-effective voltammetric determination of paracetamol, ibuprofen and caffeine in water samples. Sensors 2019, 19, 4039. [Google Scholar]
- Amin, S.; Soomro, M.T.; Memon, N.; Solangi, A.R.; Qureshi, S.T.; Behzad, A.R. Disposable screen printed graphite electrode for the directelectrochemical determination of ibuprofen in surface water. Environ. Nanotechnol. Monit. Manag. 2014, 1–2, 8–13. [Google Scholar]
- Kozak, J.; Tyszczuk-Rotko, K.; Wójciak, M.; Sowa, I.; Rotko, M. First screen-printed sensor (electrochemically activated screen-printed boron-doped diamond electrode) for quantitative determination of rifampicin by adsorptive stripping voltammetry. Materials 2021, 14, 4231. [Google Scholar] [CrossRef] [PubMed]
- Strzemski, M.; Wójciak-Kosior, M.; Sowa, I.; Kocjan, R.; Tyszczuk-Rotko, K. Methodological approach to determine carlina oxide—A main volatile constituent of Carlina acaulis L. essential oil. Talanta 2019, 191, 504–508. [Google Scholar] [CrossRef] [PubMed]
- Mocak, J.; Bond, A.M.; Mitchell, S.; Scollary, G. A statistical overview of standard (IUPAC and ACS) and new procedures for determining the limits of detection and quantification: Application to voltammetric and stripping techniques. Pure Appl. Chem. 1997, 69, 297–328. [Google Scholar] [CrossRef]


Publisher’s Note: MDPI stays neutral with regard to jurisdictional claims in published maps and institutional affiliations. |
© 2021 by the authors. Licensee MDPI, Basel, Switzerland. This article is an open access article distributed under the terms and conditions of the Creative Commons Attribution (CC BY) license (https://creativecommons.org/licenses/by/4.0/).