1. Introduction
The flourishing development of global technology, the use of artificial intelligence and the Internet of Things, and the integration of data analysis with cloud computing have facilitated great progress in smart manufacturing. This new trend in the technological application and the impact of the COVID-19 pandemic have resulted in a substantial increase in the demand for work from home. Therefore, the market has an urgent demand for high-performance personal computers, data processing servers, 5G smartphones, high-performance logic semiconductors, large-capacity semiconductor memory components, and Wi-Fi modules, which stimulates the development of the electronics industry.
Despite the benefits of the increased demand for consumer electronics products, the high frequency of old technologies being replaced with new ones in the electronics industry and the shortness of products’ life cycles emphasize the critical importance of supply chain management. Because every link in the supply chain must maintain very high efficiency, warehousing is an indispensable part of the supply chain. Warehousing activities include receiving, put-away, internal replenishment, order picking, sorting, packing, and shipping [
1]. Order picking is the process of retrieving and obtaining specific materials from storage locations to complete customer orders and is the most time-consuming and laborious warehousing activity. According to De Koster et al. [
2], order picking accounts for approximately 55% of overall warehouse operating costs, which indicates the pivotal role of order picking in warehousing activities. Therefore, warehouse managers strive to implement correct warehouse location planning and fast, accurate order picking methods to reduce warehouse operating costs and increase warehousing efficiency. Common methods of optimizing order picking include picking path planning, storage zone planning, optimal storage location planning, and batch picking. These methods are primarily used to reduce picking distance and time. To our knowledge, past studies explored the use of picking path planning and storage location planning separately to reduce overall picking time but have rarely focused on the simultaneous implementation of storage location planning and picking-list clustering to create an optimal picking-list consolidation strategy.
Storage location planning is a crucial part of warehouse operations, and an optimal picking operation approach that lacks optimal storage location planning limits the increase in picking efficiency. To overcome this blind spot, this study focuses on improving picking operation performance from the perspective of storage location planning and order clustering. Therefore, this study estimates the demand for component storage space by using order forecast data given by clients to calculate the expected future quantities of required components. Moreover, this study also uses the warehouse data to calculate the average duration of stay (DoS) value of each component in the warehouse. If the component has a less average duration of stay, the component should be placed near the exit of the warehouse to reduce the travel time and distance of picking operation. Accordingly, this study proposes the best suggestion for storage location planning. To increase the picking efficiency, the proposed storage location planning and bill of materials are used as the basis for picking list clustering.
Finally, this paper applies the hierarchical clustering method and the K-means clustering method to perform the analysis of picking list consolidation. After the picking capacity of the pickers is considered, a feasible, optimal picking list consolidation strategy is created. The warehouse management personnel can employ the analytical result to consolidate the picking lists so as to significantly reduce the picking time and error rate, thereby reducing manpower and the cost of picking operations.
The remaining sections are organized as follows. Related studies on Storage location planning are reviewed in
Section 2.
Section 3 expounds on the proposed clustering methods to develop an optimal storage location planning-based consolidated picking methodology. Subsequently, in
Section 4, an example of the warehouse planning for Company H’s concept storage location planning is illustrated for the feasibility of the proposed method. Finally,
Section 5 concludes this study with a discussion of primary results and summarizes the main academic and empirical contributions.
2. Literature Review
To address the short life cycle of electronic products, warehouse management requires more effective storage planning methods. Storage location planning affects almost all key warehouse performance indicators, including order picking time and costs, production rate, shipping and inventory accuracy, and storage density [
3]. The key performance indicators in warehousing are usually related to the time or workload required for order picking [
4]. Roodbergen and De Koster [
5] proposed four aspects of reducing the distance and time required for order picking activities, i.e., order picking path, warehouse partitioning planning, storage location planning, and batch picking. Storage location planning is used to allocate materials to the correct storage location. Appropriate storage location planning can effectively reduce the order picking distance and time than the other three aspects [
6]. Because storage location planning directly affects order picking performance. Therefore, this iterative relationship between storage location planning and picking operations must be considered in the design stage of warehouse planning [
7]. Accordingly, the optimization of storage location planning is the primary consideration in this study, and then picking list clustering is performed to increase picking efficiency.
The different methods of storage location planning are introduced, classified, and discussed. Storage location planning ways are divided into two main types: the dedicated storage way and the shared storage way. The dedicated storage way allocates specific items to fixed storage locations and is more commonly implemented in manually managed warehouses. In dedicated storage, when the inventory space for the specific items is full, these items cannot be stored in other empty storage spaces. Therefore, to improve the utilization of storage space, scholars proposed a shared storage way that allows any item to be allocated to an empty storage location. Warehouses that implement the shared storage way must be managed by a computer system to accurately track the location of the items. The shared storage way is divided into the random storage method and the classified storage method. When a random storage method is adopted, storage-location information is required during the receiving and pick-up operation of items [
8]. The classified storage method is based on the logic of dedicated storage and eliminates the need for detailed and accurate tracking of the items’ locations and other tedious tasks [
9]. Thus, the classified storage method classifies items in accordance with the appropriate standards; then, storage locations are conveniently allocated with the random storage method. Bahrami et al. [
10] described three commonly used storage location planning policies: the haphazard storage policy, the dedicated storage policy, and the class-based storage policy. The haphazard storage policy can result in the longest order picking distance but requires the minimum warehouse space. The dedicated storage policy yields the shortest order picking distance but the lowest warehouse space utilization. If the demand for the product changes, the optimal storage location of the product is affected, which necessitates a readjustment of the storage location and in turn, causes substantial increases in maintenance costs. By contrast, the average order picking distance in the class-based storage policy is between that of the haphazard and dedicated storage policies [
11]. Because class-based storage offers the flexibility to respond to changes in classification methods and order picking frequency, it is the widely used method in practice. The class-based storage method is a compromise between the dedicated and haphazard storage methods. Muppani and Adil [
12] noted that in the class-based storage method, random arrangement of the locations of the materials in each class can improve the utilization of space and shorten order picking time. Sorting materials on the basis of turnover is the most common method of classification. Generally, materials with a higher turnover are arranged on shelves close to the exit, whereas those with low turnover are arranged on shelves farther from the exit. Guo and De Koster [
13] noted that despite the similarity in order picking distances between the class-based storage method and the dedicated storage method, the storage space required by the class-based strategy is two-thirds less than that required by the other storage method.
Moreover, the class-based storage method uses a combination of the dedicated storage method and the random storage method to reduce tediousness in execution. Therefore, for a system with large changes in raw materials, the class-based storage method yields a more favorable result [
14]. Accordingly, this study used the class-based storage method as the basis for storage location planning based on the product configuration [
15]. Goetschalckx and Ratliff [
16] proposed a duration-of-stay-based shared storage policy that assumes that the arrival and departure time of each material within the planned range is known in the beginning, and the storage location of each material is arranged on the basis of their DoS values in the warehouse. The shorter the materials remain in the warehouse, the closer they are placed to the exit. Because scholars have made several assumptions about DoS that are not applicable to the real case in this research, the equations for the estimation of DoS values have been developed that suit the problem and context of this study.
Picking operations are one of the most labor-intensive and time-consuming activities [
17]. The manual picking expense accounts for about 50 percent of the total warehouse operating cost [
18]. To decrease the order picking cost, the order-batching policy is adopted by consolidating small orders to a single large order that can be picked in a single picking tour [
19,
20]. Yang et al. [
21] formulated the order batch picking problem for three storage locations and developed the location interval distance algorithm, location selection algorithm and order batching algorithm to minimize the picking distance. Glock and Grosse [
22] proposed the order picking strategies suitable for the assembly line supplied with different items. The warehouse contains multiple zones. The shelves in each of the zones are arranged in the shape of a U. The proposed method can reduce the average picking time for completing an order. However, it only studied a single zone of a warehouse. Kuo et al. [
23] improved the efficiency of the order picking process by a synchronized zone order picking system. If two items often appear in the same order, they are located in two different zones. Hence, two pickers can pick them at the same time to reduce the waiting time of the customer. However, the method prominently raises the labor cost. To increase the picking efficiency, Franzke et al. [
17] investigated picker blocking under different order picker-route combinations and developed an agent-based simulation model to study the behavior of each order picker to avoid picker blocking to increase mean throughput times. Cheng et al. [
24] used the particle swarm optimization algorithm to create the best picking plan. Moreover, the ant colony optimization algorithm minimized the sum of the traveling distance for the joint order batching problem. Lin et al. [
25] investigated the joint order batching by classifying similar orders as the same batch for shortening the picker Manhattan routing. Furthermore, this work used particle swarm optimization to determine the optimal order batching allocation. However, these methods just are applied in a few order products and items. De Santis et al. [
26] proposed an adapted ant colony optimization (ACO) approach to minimize the travel distance of pickers in manual warehouses. The approach can be divided into two stages. In the first stage, the Floyd–Warshall algorithm was used to find the shortest path connecting each pair of nodes. The second stage identified the shortest picker route by utilizing ACO. However, that approach cannot work in the stereoscopic warehouse. In addition, the storage locations for the items are separated into three areas. Consequently, the storage location planning does not be optimized.
3. Architecture of an Optimal Storage Location Planning Based Consolidated Picking Methodology
This research applies the clustering methods to develop an optimal storage location planning-based consolidated picking methodology for driving the smart manufacturing of wireless modules.
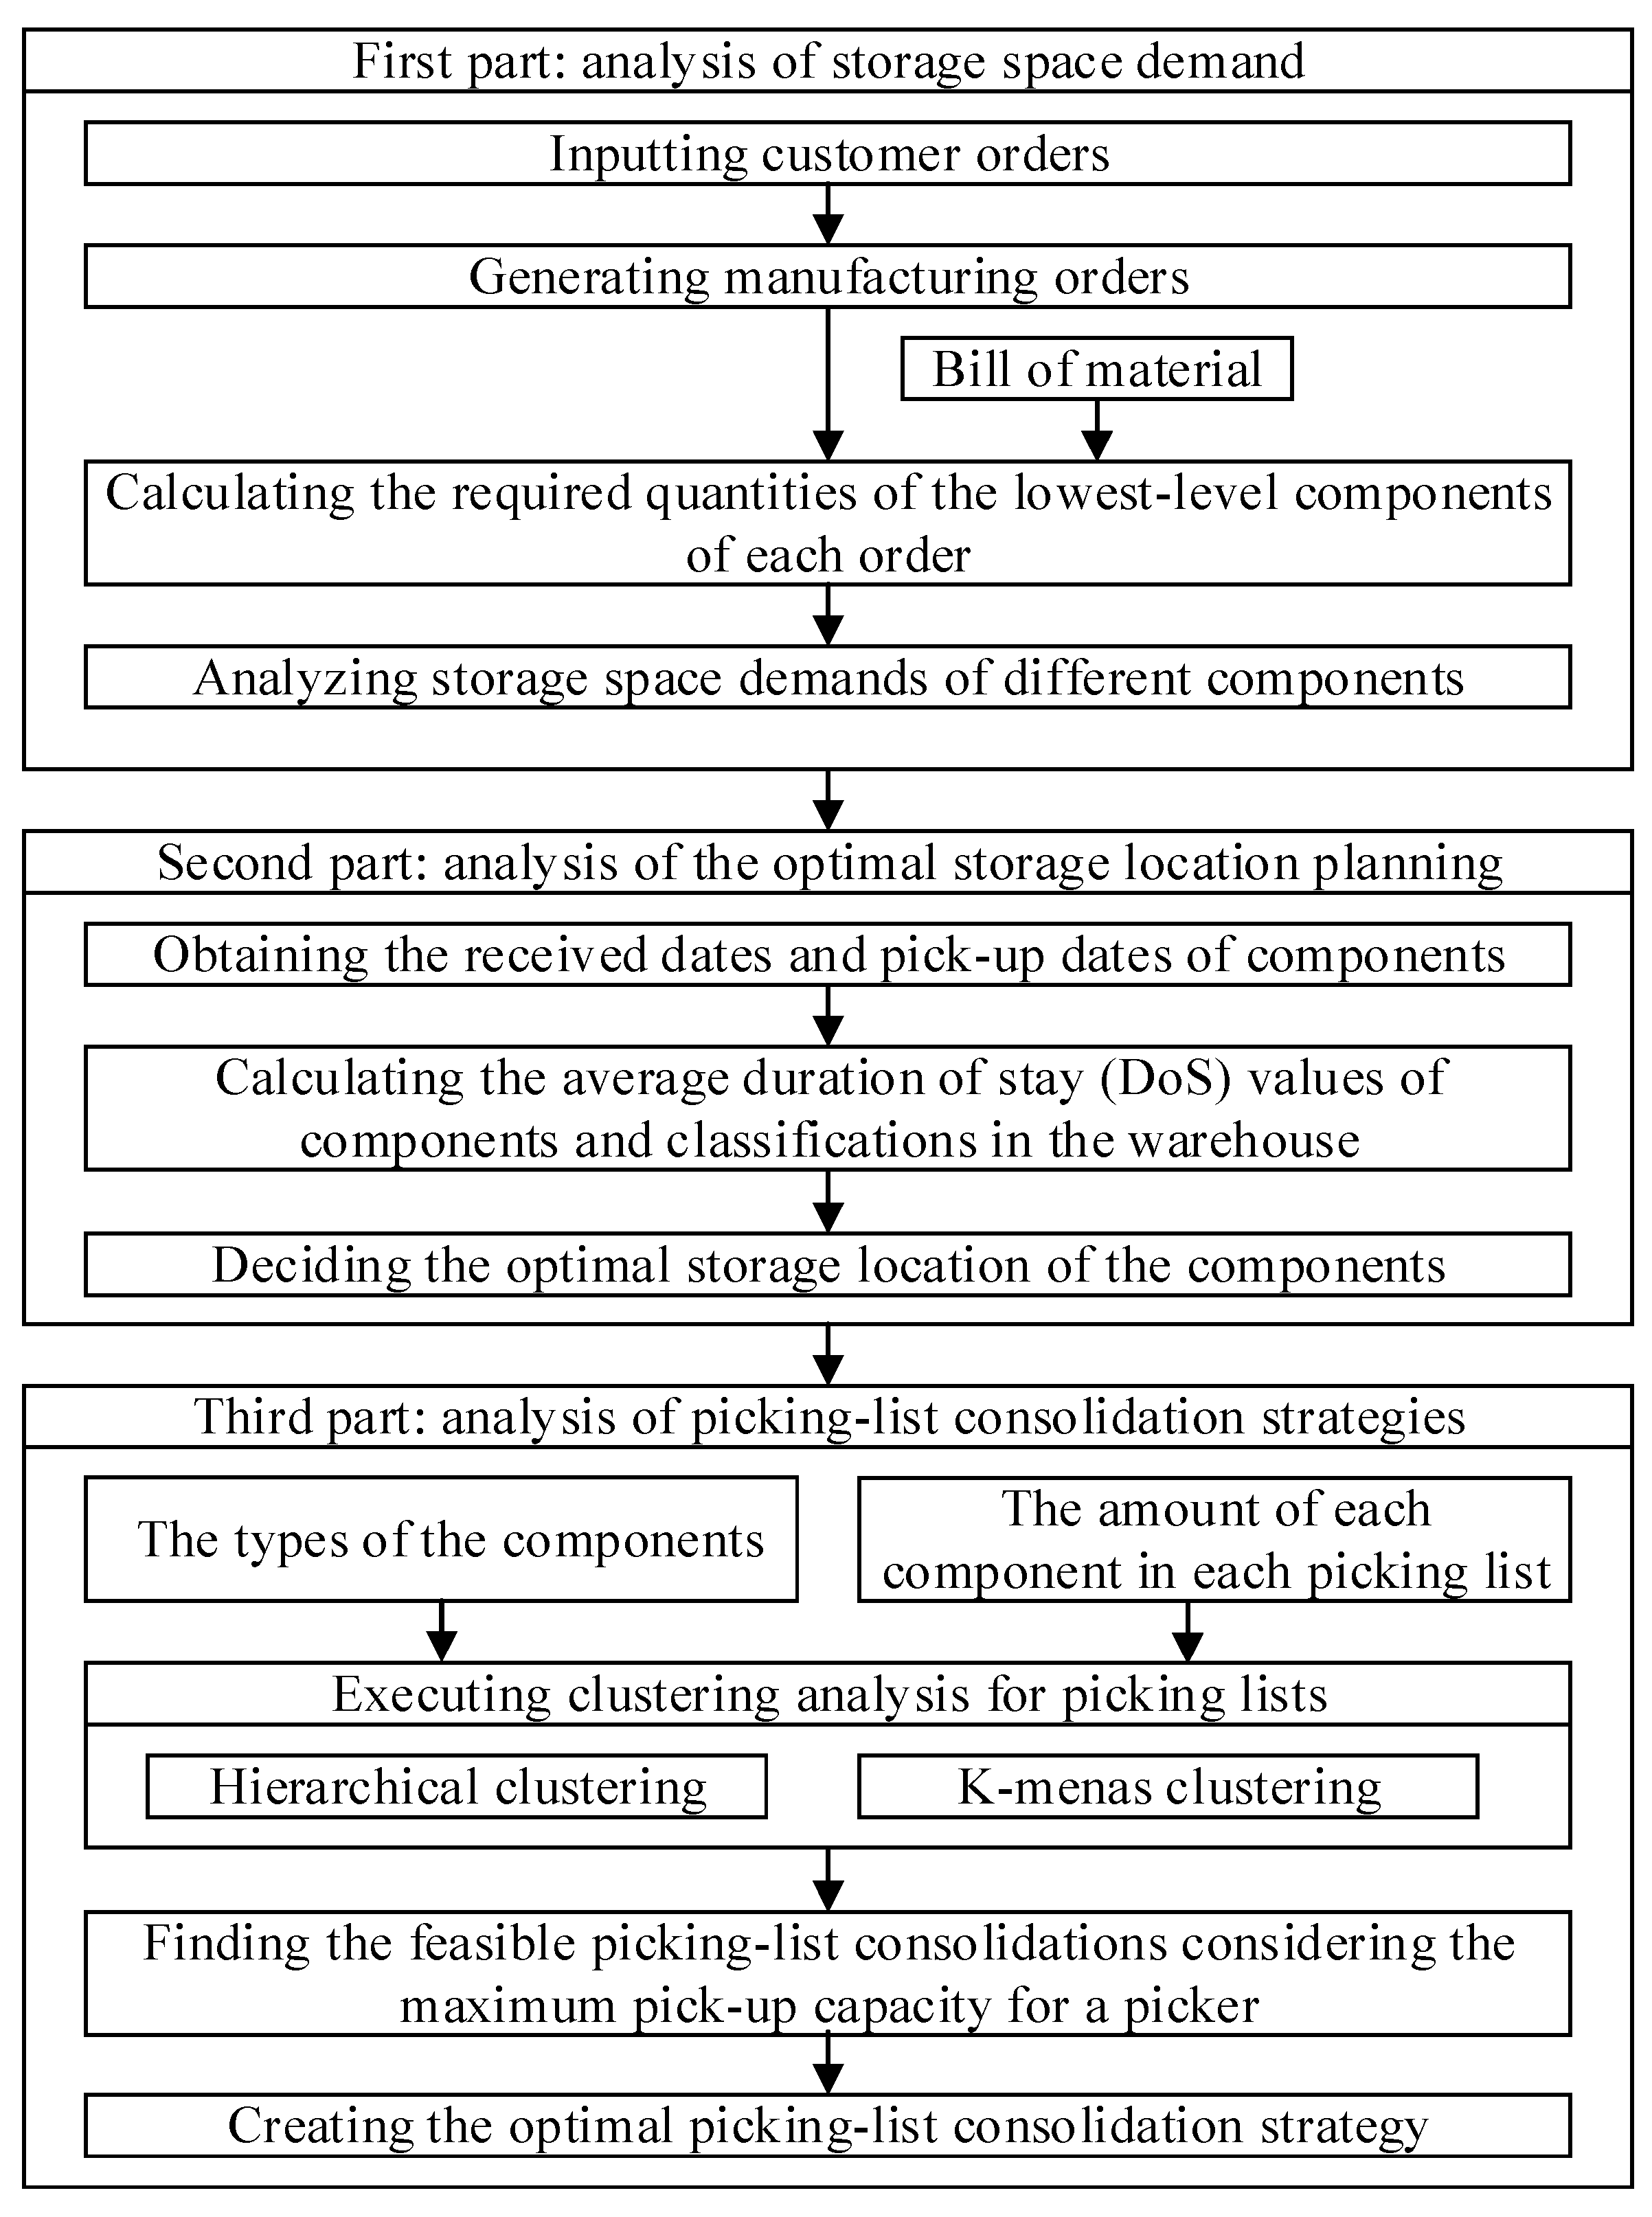
Figure 1 displays the architecture of the proposed methodology, which is divided into three parts. The first part is the analysis of storage space demand; the second part is the analysis of the optimal storage location planning; the third part is the analysis of picking list consolidation strategies.
In the first part, the manufacturing orders are generated from the input data of the customers’ orders. The bills of materials (BOM) are used to calculate the quantities of the components at the lowest level of each order. The storage space demand of each component can be obtained by using the above information. After the storage space demand of each component is determined, the second part can perform the analysis of the optimal storage location planning. In this part, the average DoS values for each component and each component classification in the warehouse are analyzed using historical data. The average DoS value and the storage space demand for each component classification can be used to determine the storage location. Hence, the average DoS values serve as the priorities of storage location planning. A shorter average DoS value indicates higher pick-up frequency and the component classification must be placed closer to the exit; thus, the relative position of the component classification can be determined to complete the classification-based storage location planning. Subsequently, the detailed storage location planning for each component is performed. Using the same concept, the average DoS value of each component within the classification can be utilized to decide the detailed relative location of each component. Based on the optimal storage location planning, the third part is to assist the pickers by increasing the picking efficiency of components. This study uses the types and amounts of the components in each picking order as the feature variables and employs the hierarchical clustering method and the K-means clustering method to consolidate multiple picking lists to reduce picking time. After considering the maximum pick-up capacity for a picker, this study can find feasible picking-list consolidations. Finally, the performance of the feasible picking orders consolidations is compared to determine the optimal picking-list consolidation strategy.
3.1. Analysis of Storage Space Demand
The main purpose of the first part is to estimate storage space demands. First, the customer orders are used as input data to generate a manufacturing order, after which the manufacturing order is expanded using the BOM to obtain the required quantities of the lowest-level components of each order. Next, the volume of a component is multiplied by the number of the component to estimate the storage space required. In addition, because of the short lifecycle of electronic products and the large fluctuations in customer demand, electronic products’ components generally have a high turnover and low inventory rate. Thus, this study analyzes storage space demand on the basis of the order forecast of the most recent period, with the assumption that the storage location planning is based on a rolling adjustment of a 7-day cycle. The storage space demands of the components could be recalculated and reviewed every 7 days to adjust the storage space planning for the next week.
3.2. Analysis of the Optimal Storage Location Planning
Yu et al. [
16] noted that the classification-based storage method saves picking time and decreases the demand for storage space. Therefore, the proposed optimal storage location planning is based on the classification-based storage method. In addition, in order to decide the relative storage location, this research uses the DoS concept to propose the optimal storage location planning method. Firstly, this study uses Equation (1) to calculate the average DoS value of each component classification in the warehouse through the analysis of historical data in the warehouse management system. The average DoS value of each classification is served as the priority index of storage location planning. If the average DoS value of this classification is shorter, then the storage location of the components within this classification is closer to the exit. At the same time, the components within the same classification are stored according to the same rule. Therefore, the DoS value of each component in the warehouse is also calculated by using Equation (2) so as to arrange its relative storage position in its classification area. By employing the optimal storage location planning method, this research can reduce the time required to locate the components and the picking distance so as to increase the picking efficiency.
The first-in-first-out (FIFO) method is used in this study. The picking up date of the component is subtracted from the receiving date of the component to obtain the DoS value of the component. Equation (2) can be used to calculate the average DoS value of component K. This research uses the same concept to acquire the average DoS values of components within the specific classification. The average DoS values of components can be served as the priority to determine the storage location of components. Then, the priorities are ranked on the basis of the calculated DoS values to determine the optimal storage locations of the components in the warehouse.
where
CDoSe is the average DoS of component classification
e,
Qe,k,i is the picking-up quantity of the
ith batch of component
k classification
e,
OTe,k,i is the picking-up date of the
ith batch of component
k, and
ITe,k,i is the receiving date of the
ith batch of component
k.
where
NDoSk is the average DoS value of component
k,
Qk,i is the picking-up quantity of the
ith batch of component
k,
OTk,i is the picking-up date of the
ith batch of component
k, and
ITk,i is the receiving date of the ith batch of component
k.
3.3. Analysis of Picking-List Consolidation Strategy
The main goal of the picking list consolidations is to increase picking efficiency by merging multiple picking lists. When the required components in the picking lists are highly similar or even the same, the storage locations of the components in the warehouse are in the similar or same storage locations. The picking lists can thus be consolidated to reduce the picking distance and time. In this research, the hierarchical clustering method and the k-means clustering method are used and compared to formulate an optimal picking-list consolidation strategy, which is divided into the following steps:
Step 1: Data integration and cleaning: The customer orders of a company are collected as the data for the cluster analysis. Because the pickers pick the components on the basis of the lowest-level components listed in the picking lists, the products ordered by the customers must be expanded into the required quantities of the lowest-level components in accordance with the BOM. The types and quantities of the lowest-level components in each order are used as the feature variables. To eliminate redundant feature variables in the data, this study assumed that the main materials and substitute materials are placed in the same storage location to reduce the number of feature variables.
Step 2: Similarity calculation: The Euclidean distance between two picking lists is used to calculate the degree of similarity between the two picking lists, as shown in (3).
where
is the Euclidean distance between the two picking lists,
J is the picking list containing
J attribute variables,
is the value of the
jth attribute variable of the first picking list, and
is the value of the
jth attribute variable of the second picking list.
The hierarchical clustering algorithm is based on the similarity between two clusters. This study uses the average linkage method to measure the similarity degree between the two clusters as shown in (4). The hierarchical clustering algorithm adopts the bottom-up method. Therefore, in the beginning, each data point is considered to be a separate cluster. Next, the hierarchical clustering algorithm uses the similarity degree to find and merge the two closest data points to form a new cluster. The iterative steps are performed until all data points become a cluster.
where
is the average linkage distance between the two clusters,
is the
ith cluster in the sample,
is the number of data points in the cluster
,
is the number of data points in the cluster
, and
is the distance between two data points.
By using the results of the hierarchical clustering, the appropriate cluster number can be determined by the sum of squares within clusters. When the number of clusters is added and the sum of squares within clusters does not have significant improvement, the appropriate cluster number can be decided and, at the same time, used as the initial cluster number for the K-means clustering algorithm. Based on the number of clusters, the K-means algorithm selects the data points as the centroids of the clusters and calculates the distances between the data points to the centroids of the clusters. Every data point is allocated to the nearest cluster and then calculate the new centroid of each cluster. If the centroid of a cluster is updated, then the K-means clustering algorithm searches for the nearest cluster for each data point and updates the data points of each cluster. The K-means clustering algorithm performs the above-mentioned steps until the centroid of each cluster is unchanged.
Step 3: Evaluation and interpretation of clustering results: This step compares the hierarchical clustering and K-means clustering results. Because the number of picking lists in each cluster affects the workload of the picking tasks assigned to the pickers, whether the number of picking lists in each cluster is evenly distributed must be considered. In addition, this research considers the maximum pick-up capacity for each picker to find feasible picking-list consolidations. Finally, the picking time and the picking distance of the feasible picking-list consolidations are analyzed to formulate the optimal picking list consolidation strategy.
4. Case Study
This study focuses on the Wi-Fi modules produced by company H. The main components are stored on the heavy-duty shelves of the warehouse. The as-is model of the warehouse planning for Company H is to divide the space into multiple areas on the basis of the classifications of components under the assumption of sufficient storage space. However, in terms of the implementation of warehouse management, Company H faces some problems. Firstly, the prearranged storage spaces are sometimes not sufficient for receiving components; this rendered no fixed storage locations available. Moreover, because no fixed storage location is available for the components, no detailed storage location planning and arrangement system is used in company H’s warehouse. Thus, the storage locations might not have been able to accommodate the receiving quantities of components, resulting in an incapacity to fix the shelf positions for components and subsequently forcing the on-site pickers to compare and search for components one by one, which in turn led to increased labor and time costs. Furthermore, when the system assigned an individual picker to one or more picking lists, it did not consider the storage locations of the components in the warehouse and the total load that pickers are capable of carrying. Consequently, the distance between the locations of the components assigned to a picker could have been far away, or the picking list could have exceeded the picker’s maximum load, requiring multiple trips of picking to complete the picking work.
This research collected 98 customer orders of Wi-Fi modules for company H. Based on these customer orders, manufacturing orders were generated and expanded in accordance with the BOM to obtain the required quantities of the lowest-level components. The storage space demand is planned on the basis of the number of components used. In addition, rolling storage location planning is performed on a 7-day cycle; that is, the quantities of components that would be purchased in the following week are reviewed every 7 days to dynamically adjust the storage space. The proportions of different component classifications relative to the quantities used were calculated to evaluate the storage space for each classification of components. After the component space demand was determined, the average DoS value of each component classification in the warehouse was calculated to decide the optimal storage locations for different component classifications as shown in
Table 1. Each classification of components was arranged in the optimal storage location relative to the exit on the basis of the average DoS value as shown in
Figure 2. Then, detailed storage location planning was performed for the same classifications of components. The first-in-first-out method was used to calculate the average DoS values of different components in the same classification. This research uses the integrated circuit (IC) components as an example to explain how to perform the detailed storage location planning.
Table 2 shows the average DoS values of 39 IC components in the warehouse.
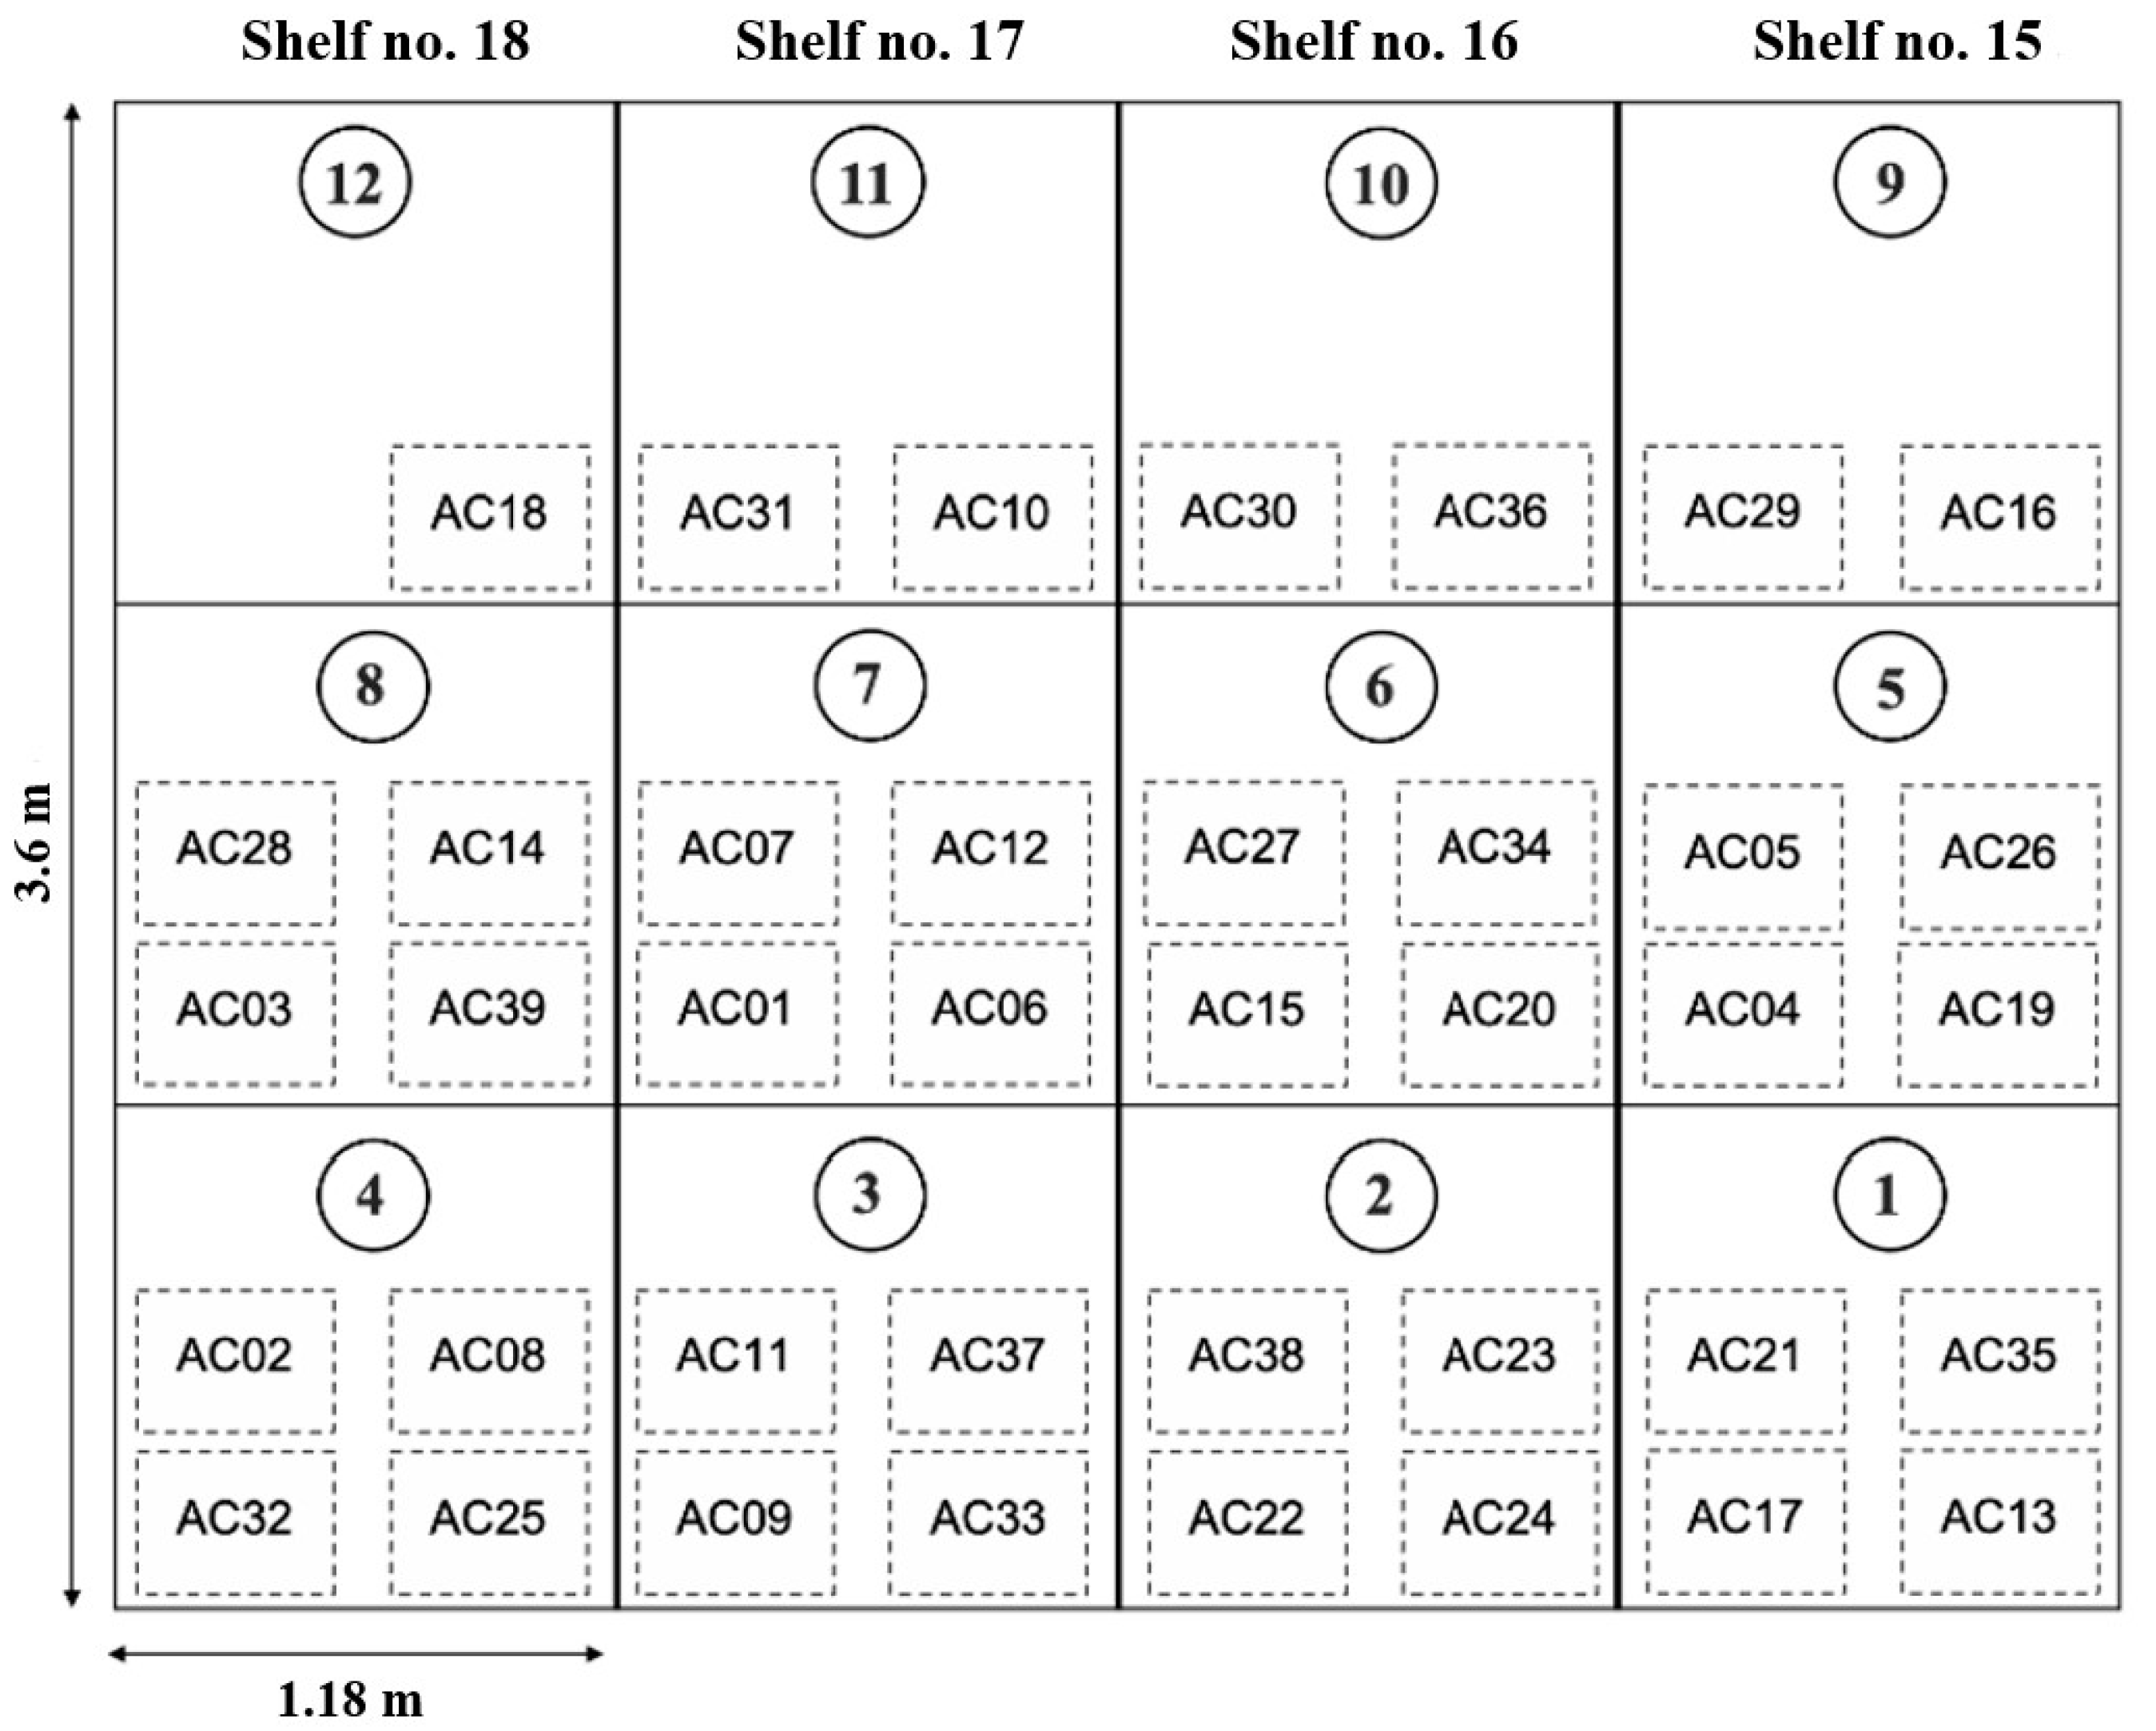
Based on the storage space demands and the average DoS values of various types of IC components, the optimal detail storage location planning can be obtained as shown in
Figure 3.
Figure 3 presents the perspective of a picker facing the shelves where they stock and pick up IC components and the schematic diagram of the storage locations of the 39 IC components in area no. 5-AC. Shelf 15 is the location closest to the exit. Because the height of the shelf affects the convenience of picking, the components with the shortest DoS are arranged on the first shelf, which pickers can access without an elevator. The IC Components with long DoS values are arranged on the second and third shelves, which require an elevator for the pickers to reach. According to the above-mentioned principles, the optimal detail storage locations for all IC components are decided.
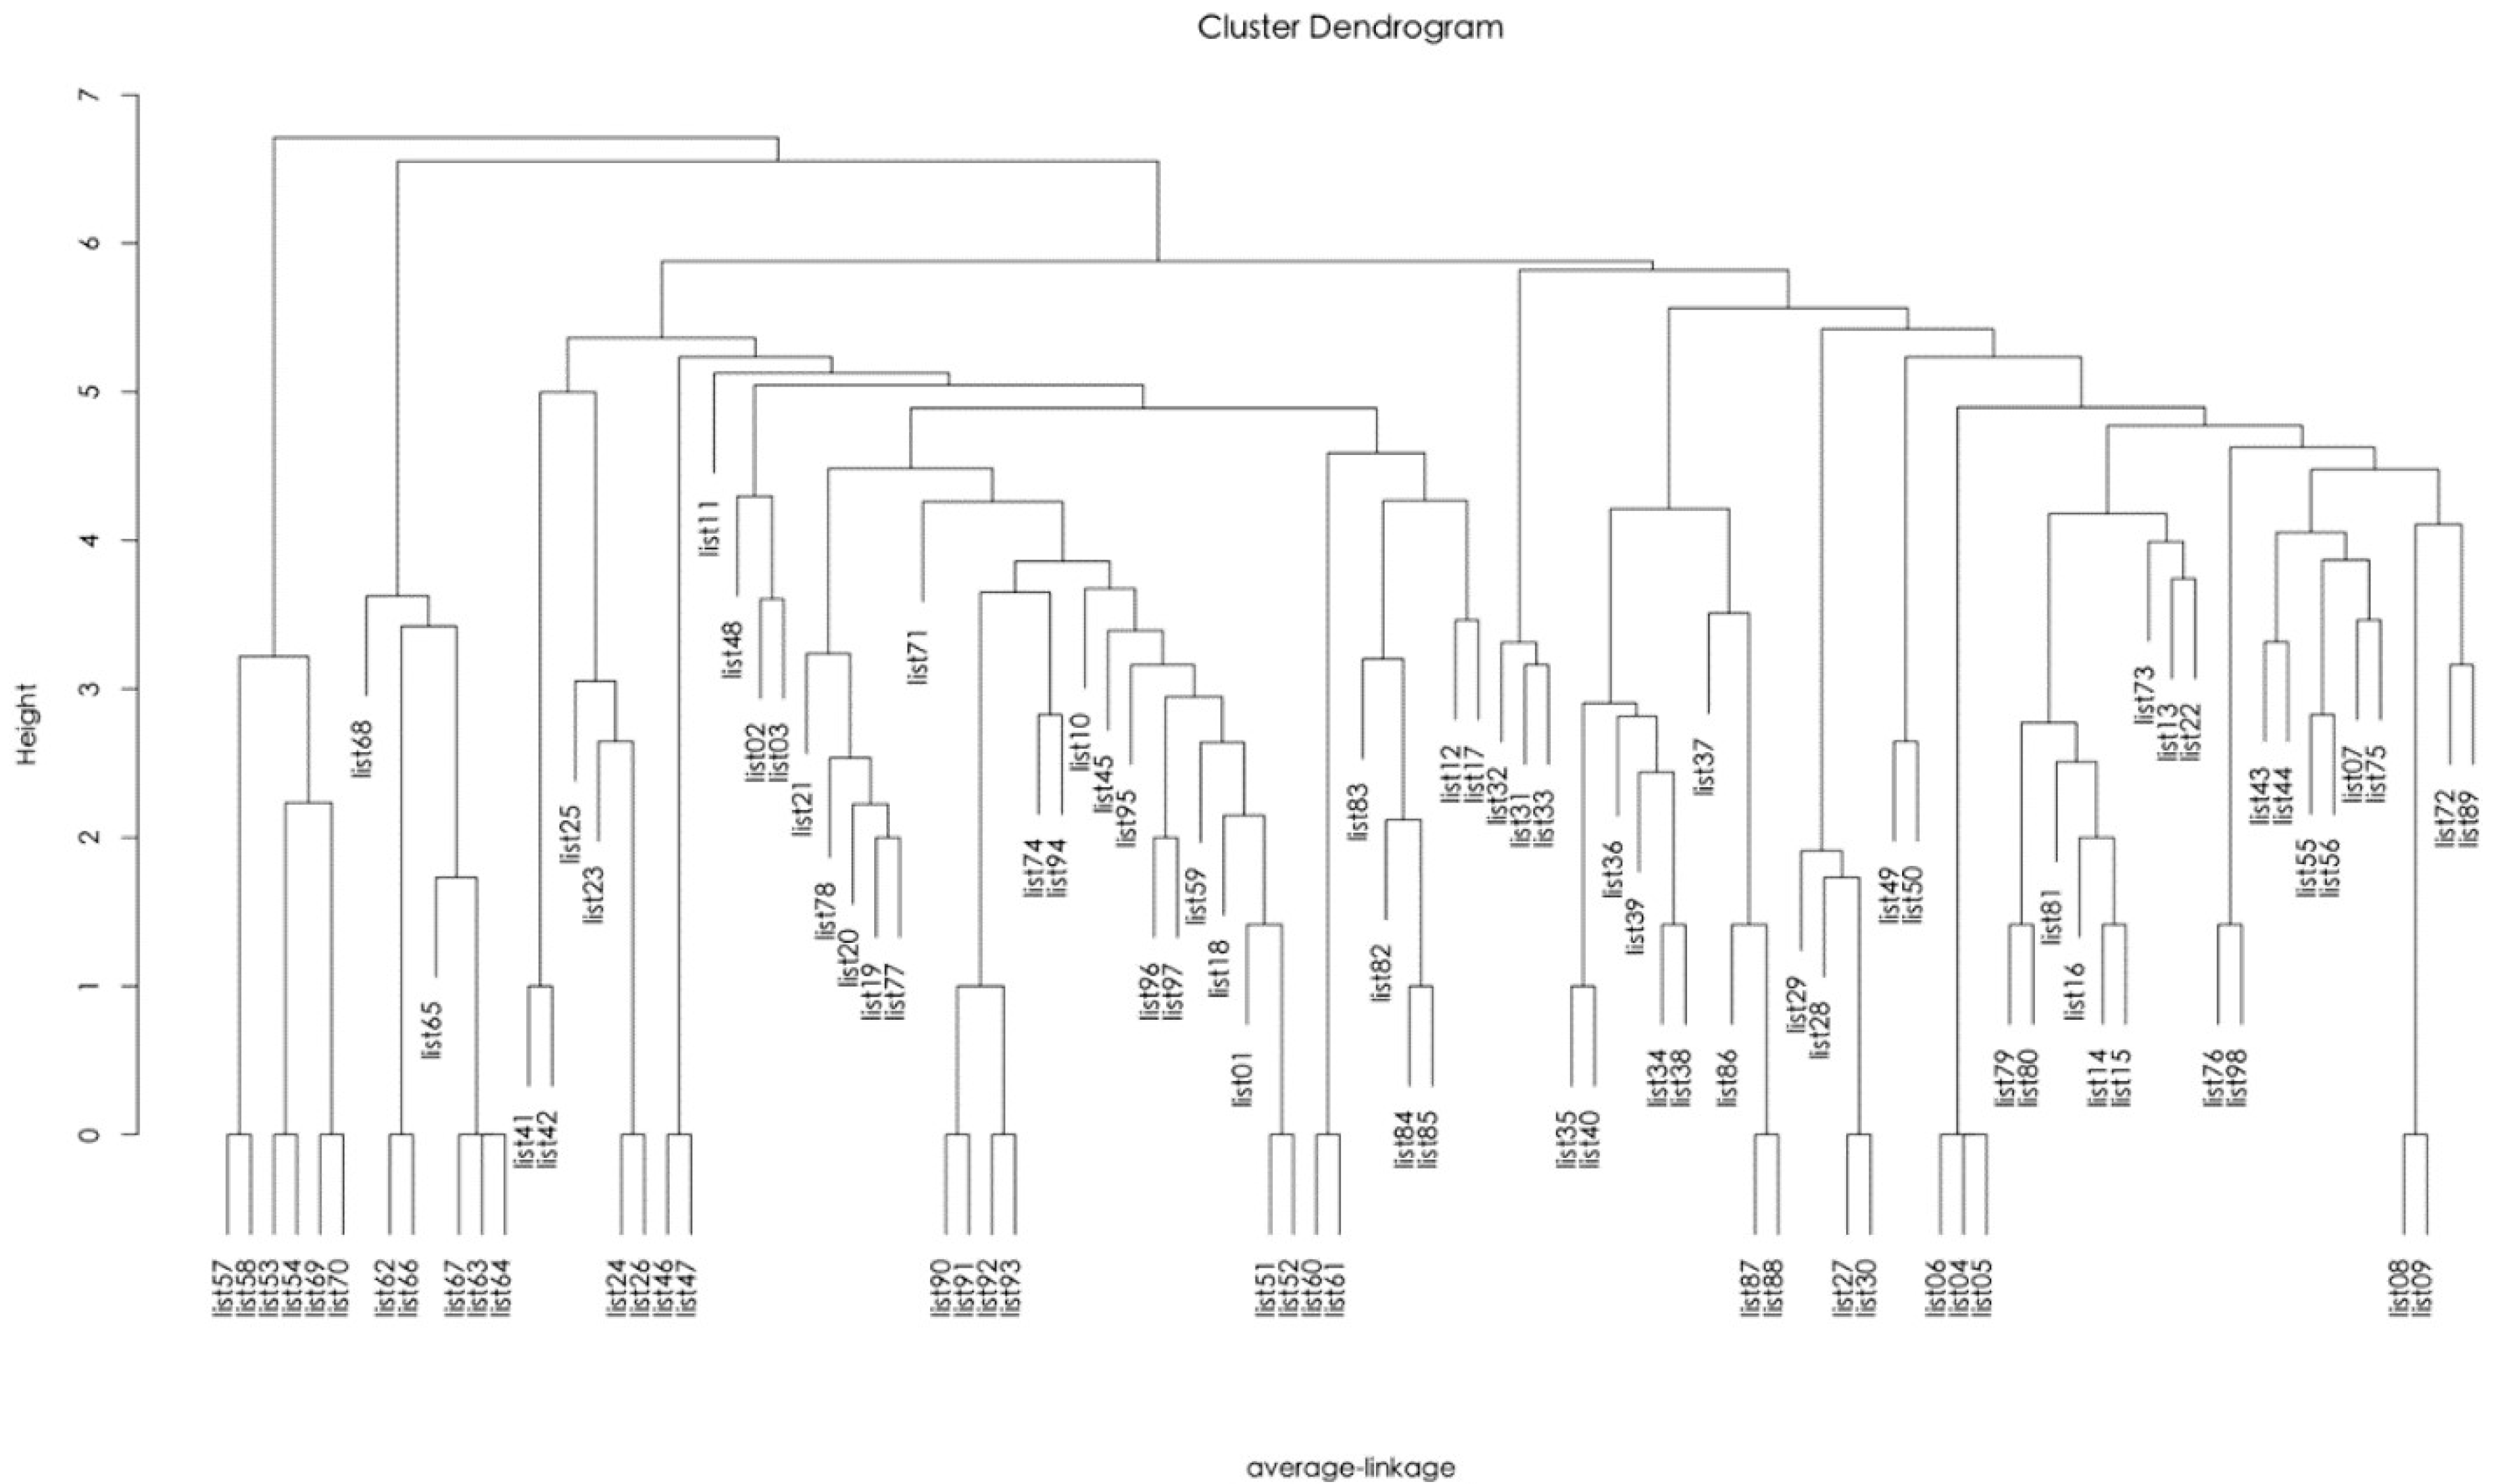
According to the optimal storage locations of the components on the shelves, this research performed the picking-list clustering analysis. The 98 customer orders for Wi-Fi modules were collected and expanded in accordance with the BOM. Next, a total of 1156 types of lowest-level components, which represented the number of feature variables, can be obtained. Because the number of feature variables was too high to clearly observe the clustering patterns of picking lists, data extraction was performed. Components that were seen fewer than six times were deleted among the 98 orders; and the more frequently used and repeatedly seen components were extracted as the feature variables, resulting in a total of 155 feature variables. The demands for the different components in each order were used as the values of feature variables, and the R programming language was used to perform the hierarchical clustering analysis. The similarity between clusters was calculated using the average linkage method and the Euclidean distance.
Figure 4 presents the results of the hierarchical clustering in the form of a tree diagram. The within-group diminishing differences slowed down when the number of hierarchical clusters exceeded 26 as shown in
Figure 5. Therefore, the number of hierarchical clusters was 26.
The hierarchical clustering method was then compared with the K-mean clustering method to determine which was more effective.
Figure 6 presents the sum of the square broken line graph obtained by using different cluster numbers (1–30) and exhibits fluctuations in within-group and between-group differences among the clusters. When the number of clusters was 26, the degree of within-group diminishing difference was 53.0936, a more pronounced decline compared with when the cluster number was 23. Therefore, the cluster number of 26 was appropriate when the data were clustered through K-means clustering as shown in
Table 3. The optimal cluster number of the K-means method was the same as that of the hierarchical cluster analysis. In addition, when the cluster number was 26, the within-group differences of hierarchical clustering and K-means clustering were 303.3458 and 320.0222, respectively. Although the within-group difference of K-means clustering was higher than that of hierarchical clustering, the slight difference was still within an acceptable range. Moreover, the number of orders allocated to each cluster through K-means clustering was more even than that allocated through hierarchical clustering when the cluster number was 26. Thus, with K-means clustering, the initial workload assigned to the pickers was evenly distributed and satisfied the constraint of the maximum pick-up capacity for a picker. Therefore, the K-means clustering method is more effective than the hierarchical clustering method, indicating that the K-means clustering method should be used to create the picking list consolidation strategy.
The first cluster was selected from the results. The cluster consisted of lists 10, 11, and 71, each of which was expanded using the BOM, and the types and quantities of components required for each order were obtained. Then, the current storage and picking method of company H was compared with the proposed method. In company H, the pickers located the components through the warehouse management system while picking and spent more time searching for components in a specific area. The pickers were unable to arrange their picking route in advance after they received the picking list, resulting in long picking distances.
Figure 2 displays the storage locations of various components as determined by the proposed optimal storage location planning method.
Figure 2 also presents a simulated route for a picker to complete three orders based on this method. Because the components were classified on the basis of classifications and their locations were arranged on the basis of their average DoS values, the pickers used the optimal storage location planning to create a path to pick the components and avoid picking errors and moving repeatedly along a single route.
Table 4 shows the total picking distances required by the two methods. The distance the pickers walked to complete the three orders by using company H’s method was approximately 73.6 m longer than the distance required by the proposed method. This verified that the proposed storage location planning and the picking list consolidation strategy increased the picking efficiency substantially.
5. Conclusions
Within the supply chain process, picking operation is the most time-consuming and labor-intensive activity. Warehouse managers need to employ the smart manufacturing method to boost the picking efficiency to reduce warehouse operating costs. Due to storage location planning as a key factor affecting picking efficiency, this research firstly applies warehouse data to calculate the average DoS values and estimate the storage space demands by the customer orders to develop an optimal storage location planning to reduce the time for the pickers to search and retrieve the components from the shelves. Based on the macro-level optimal result, this research utilizes the hierarchical clustering method and the K-means clustering method to find the picking lists with high similarity to help warehouse managers create the best picking-list consolidation strategy for decreasing the distances and trips traveled by pickers and increasing the picking efficiency. To validate the feasibility and effectiveness of the proposed approach, a case study of new storage location planning and consolidated picking process was illustrated.
To sum up, this study makes several significant contributions explained as follows. To our knowledge, many studies have investigated picking route planning, storage location planning, and batch picking separately and have rarely considered combining two or more above-mentioned factors. Because storage location planning affects picking performance, this research uses the storage space demands of the components and their DoS values in the warehouse to optimize the storage locations of the components. In addition, this study develops a method of calculating DoS values to ensure that they reflected the warehouse operations of company H. Moreover, the hierarchical clustering method and the K-means clustering method were used to effectively consolidate multiple picking lists and reduce the number of picking trips. According to the study result, the performance of the K-means clustering method is more effective than that of the hierarchical clustering method. Furthermore, the proposed method used the class-based storage strategy to improve on company H’s haphazard storage method, which was based on rules of thumb and reduced the time required by pickers to locate components. Therefore, the optimal picking list consolidation strategy proposed by this study enabled pickers to pick components from multiple picking lists and decreased the number of picking trips. This study increased pickers’ work efficiency and streamlined the picking process, and the results can provide a practical reference for the warehouse managers in company H and other companies. For the generalization of the proposed method, it can be generally applied to other manufacturers with the same enterprise context with the intelligent machinery under Industry 4.0 to enhance the efficiency and effectiveness of storage location planning and consolidated picking. It is hoped that this work provides practical guidance for achieving a more advanced storage location planning and consolidated picking in intelligent machinery and Industry 4.0.


