Article

Modelling of a Non-Transferred Plasma Torch Used for Nano-Silica Powders Production

1
Energy and Water Research Institute, King Abdulaziz City for Science and Technology (KACST), Riyadh 11442, Saudi Arabia
2
Department of Physics, College of Sciences, Princess Nourah Bint Abdulrahman University, Riyadh 11671, Saudi Arabia
3
Department of Physics, College of Sciences, Imam Mohammad Ibn Saud Islamic University (IMSIU), Riyadh 11623, Saudi Arabia
4
Laboratory of Physics of Materials and Nanomaterials Applied at Environment (LaPhyMNE), Faculty of Sciences in Gabes, Gabes University, Gabes 6072, Tunisia
5
Chemistry Department, College of Science, King Saud University, Riyadh 11451, Saudi Arabia
*
Author to whom correspondence should be addressed.
Appl. Sci. 2021, 11(21), 9842; https://doi.org/10.3390/app11219842
Submission received: 19 September 2021 / Revised: 4 October 2021 / Accepted: 11 October 2021 / Published: 21 October 2021
(This article belongs to the Special Issue Recent Advances in Atmospheric-Pressure Plasma Technology)

Abstract

:
In this study, a two-dimensional numerical model was developed to simulate operation conditions in the non-transferred plasma torch, used to synthesis nanosilica powder. The turbulent magnetohydrodynamic model was presented to predict the nitrogen plasma flow and heat transfer characteristics inside and outside the plasma torch. The continuity, momentum, energy, current continuity equations, and the turbulence model were expressed in cylindrical coordinates and numerically solved by COMSOL Multiphysics software with a finite element method. The operation conditions of the mass flow rate of ionized gas ranging from 78 sccm to 240 sccm and the current varying between 50 A to 200 A were systematically analyzed. The variation in the electrothermal efficiency with the gas flow rate, the plasma current, and the enthalpy was also reported. The results revealed that the increase in working current lead to a raise in the effective electric power and then an increase in the distribution of plasma velocity and temperature. The efficiency of the torch was found to be between 36% and 75%. The plasma jet exited the nozzle torch with a larger fast and hot core diameter with increasing current. The numerical results showed good correlation and good trends with the experimental measurement. This study allowed us to obtain more efficient control of the process conditions and a better optimization of this process in terms of the production rate and primary particle size. X-ray diffraction (XRD) and transmission electron microscopy (TEM) were used to characterize the primary nanosilica powder that was experimentally collected. The arc plasma method enabled us to produce a spherical silicon ultra-fine powder of about 20 nm in diameter.

1. Introduction

Plasma technology has in the last years evolved to be a promising technique for the efficient manufacture of nano-sized materials, which are in increasing demand by recent technological advancement for diverse applications such as industrial, biomedical, and environmental purification processes [1,2,3,4,5,6,7]. For example, Ananth and Mok [8] revealed that the nanomaterials prepared by atmospheric plasma exhibit high crystallinity and good thermal resistivity. Additionally, Post et al. [9] describe that the plasma-manufactured nanoparticles are the best technique to obtain homogenized coating on metal nanoparticles and to control their outer surface properties. Another important aspect of plasma-based nanomaterials is the possibility to adjust the thermal efficiency of the solar cells and the use of atmospheric pressure plasma in order to generate silver and gold nanoparticles on tin oxide solar cells [10]. By virtue of these characteristics, plasma nanofabrication has grown into an interesting new field, which exhibits many advantages for the synthesis of nanoparticles and the deposition of nanostructured films and coatings, in a more cost-effective and ecologically friendly manner.
The present invention has attracted intense and increasing industrial interest as a novel mass-production method, using a variety of thermal plasma sources, such as alternating current at radiofrequency (RF plasma) and direct current (DC plasma), which can be operated in transferred and non-transferred arc-modes. Nano-metal powders have been broadly generated by transferred DC plasma torches [11,12]. However, in this kind of plasma torch the manufacturing process often becomes non-continuous because target metals, used as electrodes, should be replaced after each batch of metal nano-powder by reason of their non-resistance to the elevated temperature generated in the plasma torch. Alternative technologies, non-transferred DC, or RF plasma torches have been used to offer a continuous production system of nano-sized powders.
In non-transferred DC plasma torches, the electrodes are exclusively utilized for maintaining the arc plasma formation, and the targeted materials are introduced into the flame of thermal plasma as a precursor powder [13,14]. In comparison with RF plasma jets [15,16], there are multiple advantages of using non-transferred DC plasma torches in nanomanufacturing. The DC plasma torch has a narrow diameter that confines the plasma jet, resulting in an increase in the temperature and the velocity of the plasma flow at the torch axis. In addition, DC plasma jets are commonly turbulent, which reinforces mixing of the precursors injected. Generally, a DC plasma torch can attain 90% thermal efficiency, while RF plasma only attains 75% [17,18].
To synthesize nanosilica particles, a non-transferred arc system is run on nitrogen plasma gas, followed by a short mixing section of silicon tetrachloride (SiCl4) and carrier mixing gas (nitrogen and hydrogen) heated to about 1373.15 K and injected in the plasma tail flame.
The process starts with vaporization of precursor materials owing to the high enthalpy of the plasma, and then the temperature of the material vapor transported by the nitrogen tail flame decreases drastically; the vapor is highly supersaturated due to this quenching, which results in a rapid production of numerous nanoparticles via homogeneous nucleation, heterogeneous condensation, and coagulation between nanoparticles themselves.
Nowadays, the manufacturing processes of nanoparticles by a thermal plasma process is experimentally achieved. However, the understanding of the growth mechanism of the nanoparticles and the control of the size and the composition of the particle remains insufficient. In most cases, it is impossible to measure different aspects of the process, and only the characteristics of the final products are evaluated because there is a complex interaction between the thermo-fluid field, the induced electromagnetic field, and the particle concentration field [19].
Numerical modelling can be a powerful approach, allowing a better understanding of the growth mechanism of nanoparticles and improving torch designs and plasma processes at relatively low prices. Several research efforts have been dedicated to modelling the plasma flow and heat transfer coupled with the electromagnetic field inside and outside the plasma torch. Simulation of the arc inside a DC torch was first developed by Li and Chen [20] and Trelles [21]. In these models, the arc breakdown and reattachment operations in the plasma torch are accurately evaluated. A transient simulation of a DC plasma torch has been performed later by Selvan [22] to evaluate the substrate temperature with heating time and to estimate different precursor effects on the thermal flux to the substrate. Subsequently, Guo [23] and Modirkhazeni [24] employed new models with the large eddy simulation technique to simulate the turbulent plasma flow inside a DC non-transferred arc plasma torch and the effect of particle injection. For nanopowder production, the nanoparticles are generated not in the high-temperature plasma core but in the interfacial regions between the plasma and the cold gas at low to intermediate temperature. Lower-temperature regions tend to be more turbulent with multiscale eddies. These eddies strongly affect the transport processes of nanoparticles.
Moreover, a combined plasma torch including a plasma jet of the DC arc plasma torch fed to the inlet of the RF-ICP plasma torch and used for nano-powder production has been presented by Frolov [25] in order to reduce the power of the RF discharge in the plasma torch. Recently, a numerical model applied to a triple DC plasma torch used to synthesize nanoparticles was performed by Kim [26]. The results of the simulation presented an analysis of the thermal environment inside the reactor to control the condensation process of the nanoparticles.
In the present study, a two-dimensional axisymmetric turbulent model of a DC non-transferred plasma torch used for the synthesis of nano-silica was developed. Moreover, the effect of different plasma parameters such as the current and the gas flow rate were investigated, and discussion about the efficiency of the torch for different cases was realized. Furthermore, in this work, a DC non-transferred plasma torch was used to synthesis silica nanoparticles. In this study, the principal objective was the optimization of the circumstances of this process in terms of the production rate and the primary particle size. Numerical results were compared with the experimental measurements.

2. Numerical Model

2.1. Basic Assumptions

To simulate the heat transfer and the gas flow of the plasma, the following assumptions were used:
  • The plasma is optically thin (when the optical depth approaches to zero, radiation has a small effect on the overall heat transfer process within the plasma, and the opacity can be neglected).
  • Turbulence thermal plasma flow is considered (turbulence offers a strong mixing of plasma flow, and its eddies affects the transport processes of nanoparticles).
  • The flow is treated as being weakly compressible when the Mach number (the ratio of the speed of the flow to the speed of sound) is smaller than 0.3 (Ma < 0.3), and the density change due to velocity is about 5% in that case.
  • High collision frequencies among constituents in thermal plasma leads to a state close to local thermodynamic equilibrium (LTE), in which all plasma components (electrons, ions, and neutrons) have the same temperature.
  • The gravity effects are negligible due to a high Froude number ( 3   ×   10 6 ).
  • The arc is assumed to be steady and rotationally symmetric.
  • Thermodynamic and transport properties of gas plasma expressed as a function of the local temperature and pressure are obtained from the literature provided by Boulos et al. study [27].

2.2. Control Equations

Based on the model assumptions cited above, the conservation equations of mass, momentum, and energy, as well as the electric potential and magnetic vector potential, are given by the following equations, respectively:
· ( ρ u ) = 0
· ( ρ u u ) = P + · ( τ = ) + J × B
· ( ρ h u ) = ( λ c p h ) + J · E 4 π ε r
· J = · ( σ ( · ) ) = 0
2 · A = μ 0 · J
where u , P ,   τ = ,   J , B ,   E , h ,   and A   are the gas velocity, pressure work, stress tensor, current density, magnetic field, electric field, plasma enthalpy, electric potential, and magnetic vector potential, respectively. The terms ρ ,   λ ,   c p ,   σ , μ 0   and ε r   are the gas density, thermal conductivity, specific heat, electric conductivity, permeability of free space, and the effective net emission coefficient, respectively, whereas ( J × B ) , ( J · E ) , and 4 π ε r are the electromagnetic force (Lorentz force), the Joule heating, and the volumetric radiation loss, respectively.
The stress tensor can be written as:
τ = = μ [ ( u + u T ) 2 3 · u δ ]
where μ is the dynamic viscosity, the superscript “T” indicates the transpose of matrix u , and δ is the unit tensor.
To obtain the electromagnetic field within the plasma torch, it is necessary to combine Equations (4) and (5) with the following equations:
E =
J = σ E
B = × A
The use of turbulence models in thermal plasma flows simulation is significantly requested due to their inherent characteristics (reactivity, large variation, and the electromagnetic effect). Hence, the standard ( K ε ) turbulence model developed by Launder and Splalding [28] was implemented in our model, where K stands for the turbulent kinetic energy, and ε is the turbulent kinetic energy dissipation rate.
· ( ρ K u ) = · [ ( μ + μ t σ K ) · K ] + G K ρ ε + Y M
· ( ρ ε u ) = · [ ( μ + μ t σ ε ) · ε ] + ε K ( C 1 ε G K C 2 ε ρ ε )
Y M represents the contribution of fluctuating dilatation. The turbulent viscosity μ t , and the turbulent generation term G K are defined as:
μ t = ρ C μ ( K 2 ε )
G K = μ t ( u i x j + u j x i )
where u i x j is the production of turbulence kinetic energy. The turbulent model constants C 1 ε ,   C 2 ε ,   C μ ,   σ K , and σ ε were identified as 1.44, 1.92, 0.09, 1.0, and 1.3, respectively.

2.3. Calculation Domain and Boundary Conditions

The geometry of the DC plasma torch consists typically of a tungsten tip rod-type cathode and a copper anode. The nitrogen gas was input through a nozzle with a diameter of 8.2 mm on either side of the cathode. The length of the anode nozzle channel and the exit diameter were 225 mm and 17.2 mm, respectively (Figure 1). The nozzle at the end of the torch was used to spread out the heated gas in the form of a plasma jet.
The axisymmetric boundary conditions performed in this study are mentioned in Table 1. Inflow boundary conditions are typically specified by imposing values of known properties of the gas injection, typically velocity and temperature. At the torch inlet, the gas was injected at 300   K , with a uniform axial ( u z i n ) and zero radial velocity component ( u r i n ) . A swirl flow was required to enhance gas mixing, and an inflow tangential velocity component ( u θ i n ) was introduced. In addition, the turbulent inlet parameter of the kinetic turbulent energy,   ( K = 0.005 × u i n 2 ) , and its rate of dissipation ( ε = 0.1 × K 2 )   were considered. The inflow mass flow rate of the plasma gas can be obtained by integrating the axial velocity at the surface of the torch inlet, namely:
Q i n = S i n l e t u z i n   d s = u z i n S i n l e t z
where S i n l e t is the inlet surface and z is the unit vector along the torch axis.
The temperature and the current density implemented on the cathode surface of the torch can be estimated by Gaussian profiles:
T c a t h ( r ) = 500 + 3000 exp [ ( r 2 R c a t h ) n c a t h ]
J c a t h ( r ) = J m a x exp [ ( r R c a t h ) n c a t h ]
where r   is the radial distance from the torch axis, and n c a t h , J m a x , and   R c a t h   are parameters that satisfy the distribution of the working current and temperature profiles over the cathode surface. The values of shape parameters for three cases are given in Table 2.
In non-transferred arc torches, an overall convective heat transfer is used for the modelling of heat transfer of the regions of the anode far from arc attachment, namely:
k n T = h w ( T T w )
The term ( n n · ), denotes the derivative in the direction of the outer normal to the surface, where n represents the outer normal to the surface boundary. h w = 1   ×   10 4   W / ( m 2 K ) is the convective heat transfer coefficient at the anode surface, and T w = 500   K is the temperature of cooling water. At the torch exit, P o u t was set equal to the atmospheric pressure.
To solve the Maxwell equations in terms of the potentials and A as indicated in Table 1, we defined a normal current density Jcathode in the range of 106 A/m2.
There was electric insulation, i.e., n · J = 0 , on the remaining surface of the cathode and a grounded anode ( = 0 ) on the anode’s outer surface and magnetic insulation in all boundaries, with the magnetic potential n × A = 0 and a gauge fixing Ψ 0 = 1   A / m .
According to the LTE hypothesis, the current is not able to pass through the plasma electrode interface. For this reason, an artificially high electrical conductivity ( 8   ×   10 3   S / m ) was set in a thin layer close to the electrodes, allowing the formation of a new arc attachment, even when the arc fringe gets near to the anode surface.
Then, we specified the physical values for the electrodes of the plasma torch in the equilibrium discharge interface. Both the cathode tip and the copper anode wall were modeled as boundary plasma heat sources mapping the electromagnetic surface losses as heat sources on the boundary. In this case, a surface work function of 4.15 V was the default value for copper electrodes in COMSOL Multiphysics®.
The numerical model of the DC non-transferred plasma torch was implemented in COMSOL Multiphysics® 5.4 software [29,30,31,32] using the physics of CFD (turbulent flow), heat transfer (heat transfer in fluid/solid), AC/DC (electric currents, magnetic fields), and plasma (equilibrium discharge interface). The steady state equations of conservation of fluid mechanics, heat transfer, and electromagnetics were developed by using the Multiphysics couplings options available in the software.
The thermodynamic and transport properties of gas plasma ( ρ ,   λ ,   c p ,   σ , μ 0 , and ε r ) obtained from literature and expressed as a function of the local temperature and pressure were implemented in the COMSOL Multiphysics using a piecewise cubic interpolation method and a linear extrapolation method to preserve the shape of the data and to respect monitoring.
The partial differential equations used in this stationary model were numerically solved by the finite element method, where a SIMPLE-Type algorithm was adopted to decouple velocity components and pressure. Triangular instructed grids were generated with refinement close to the torch wall, gas inlet, cathode, and the symmetric axis in order to resolve the strong variation in flow properties within these regions. The computational domain included the inside and the outside of the plasma torch region, which was discretized using 105,600 mesh points. Averaged values of the physical quantities at the grid points in the mesh were calculated. Temperature and velocity distributions results were generated directly with COMSOL Multiphysics.

3. Equipment and Operating Conditions

Figure 2 shows the plasma system used to synthesis nano-silica. A non-transferred DC torch was used to create extremely reactive gas species at a high temperature for the reaction of gas precursors and for the synthesis of nanoparticles. The torch was operated with nitrogen gas followed by a short mixing section where a SiCl4 and carrier gas mixture (nitrogen and hydrogen) were introduced and heated in the plasma tail flame to about 1100 °C. This torch used a ( 10 30   kW ) power supply at a pressure slightly above one atmosphere ( 4   atm ) . The electric arc was initially generated by applying a voltage varied between 80 and 200 V, and gases were flown around the arc column for heating via conductive, convective, and radiative heat exchanges. A typical non-transferred DC torch with a rod-type cathode produced a plasma jet with temperature in the interval of (2400–4800 °C) and few hundreds of m/s velocity at the torch exit. The temperature or velocity jet conditions were largely determined by the nozzle design and thus can be adjusted for an efficient manufacturing of nanomaterials. Table 3 summarizes the optimum operation conditions used to synthesis the silica nanoparticles.
Different technics were used to characterize the silica nanopowder prepared by the thermal plasma. These techniques were X-ray diffraction (XRD) and transmission electron microscopy (TEM). The XRD patterns of silica nanopowder were determined with a Bruker D5005 diffractometer and using CuKα radiation (λ = 1.78901 Å). In the TEM characterization, the synthesized products were placed in EtOH, then the samples were immersed for 15 min in an ultrasonic bath, and in the last step a few drops of the resulting suspension containing the synthesized materials were placed onto a TEM grid.

4. Results and Discussion

In this section, the simulation results of the DC non-transferred arc plasma torch used for the synthesis of nano-silica are presented. Furthermore, the influence of the working current on the plasma distribution fields is analyzed, and the efficiency of the torch is discussed for different cases based on comparisons with experimental results. At the nozzle exit, the distributions of temperature and velocity plasma jet are represented. Moreover, the nanosilica particles elaborated in the experimental device were characterized by X-ray diffraction and transmission electron microscopy. For all representative results, the operating gas introduced in the torch was nitrogen gas with flow rates varying in the range (78–240) sccm and current varying in the range ( 100 200   A ) .

4.1. Flow of Plasma in the Torch

In Figure 3, the distribution of plasma temperature is presented in the torch under the fixed gas flow rate Q i n = 78   sccm and for different current values. When the cold plasma forming gas passes through the anode column, it will be strongly heated and accelerated, so there is a fast increase in the temperature and velocity. Indeed, when the current rose from 100 A to 200 A the maximum temperature was increased from 5200 K to 5500 K.
To show with greater clarity the effect of increasing current on plasma temperature changes, the temperature distributions, in front of the cathode tip, are represented in Figure 4. It can be clearly seen that the region area of the plasma temperature higher than 5000 K expands when the current increases. This can be explicated by the effect of the Joule heat produced, namely:
Q j o u l e = J · E = | J | 2 σ
Indeed, the rising of the current leads to an increase in the current density responsible for Joule heating. Although the electric conductivity of nitrogen gas presents a slow raise as the temperature increases, its influence remains insignificant compared to the current density. Then, the plasma temperature increases with increasing current.
A small temperature variation was observed at the torch exit (from 5200 K to 5500 K), when the current rose from 100 A to 200 A. This was because the energy benefit of joule heating that contributed to the current growth was practically offset by the energy loss due to the length reduction in the electric arc. This effect consequently leads to a trivial dependance of the arc current on the average temperature at the torch exit [33].
A temperature above 3000 K was observed at the electrode tip, indicating that a melt could occur at the electrode tip. This high temperature was generally compensated by the cooling water of the cathode that causes thermal power loss through it, which can be calculated by:
C a t h o d e l o s s = Q c a t h o d e I · V a r c
where C a t h o d e l o s s represents the thermal power loss through cathode cooling water. However, sometimes after several hours we could observe erosion in the cathode tip [34]. This indicates that cooling of the cathode was not sufficient in this case.
In Figure 5, the distribution of the velocity magnitude field is presented in the torch under the fixed gas flow rate Q i n = 78   sccm and for different current values. The results show that the highest plasma velocities within the torch were approximately 90, 110, and 150 m/s for current values of 150, 200, and 200 A, respectively. The augmentation of working current led to the increase in velocity magnitude.
This axial acceleration of plasma flow was simultaneously influenced by the Lorentz force and by the rise in temperature driven by the joule heating effect [35], which reduces the gas density and reinforces the expansion of the plasma.
Figure 6 shows the variation in plasma voltage versus current at different nitrogen mass flow rates (Q). An increase in the current led to an increase in the voltage of the plasma arc, which reinforced the electric power of the plasma. This linear variation in plasma voltage with plasma current shows that the plasma closely obeys Ohm’s law. Moreover, it can be clearly seen that the voltage increased with the increasing nitrogen flow rate, and the plasma was stable when the current and the nitrogen flow rate varied.
To study the efficiency of the plasma torch, we must consider that a portion of the input electric power was transferred to the plasma arc, and the rest of energy was extracted by the cooling water. The energy balance for the plasma torch is written as:
E e x p = U e x p I Q l o s t
where E e x p is the effective power transferred to the plasma arc, U e x p I is the electric power supplied by the DC generator, and Q l o s t represents the energy lost by the cooling water.
Q l o s t = 4.18 × C p w × m ˙ w ( T o u t T i n )
where C p w is the specific heat capacity of water (1 cal/cm3), 4.18 is the conversion factor for converting cal/s into watts, m ˙ w is the amount of cooling water flow rate (sccm), and T o u t and T i n are the outlet and inlet temperatures, respectively.
However, for numerical simulation, the energy of the plasma leaving the torch can be calculated by integrating the plasma enthalpy at the surface of the torch output:
E c a l = m ˙ g h d s
The electrothermal efficiency can be obtained by dividing the energy transferred to the plasma gas by the electric power, mainly:
η = E e x p U e x p I = E c a l U c a l   I
Figure 7 illustrates the numerical results and experimental measurements of electrothermal efficiency of the plasma torch for different working currents and at different mass flow rates. At lower mass flow rates, the increase in current led to an increase in the degree of ionization, which increased the plasma pressure inside the torch; then, the plasma velocity increased, and more plasma came out from the nozzle exit of the torch. Thus, the efficiency increased with current. However, at a higher gas flow rate, the amount of plasma coming out from the torch did not increase significantly because the increase in the plasma pressure inside the torch due to the increase in the current caused a higher collision of the plasma particles with the anode wall (limitation of the velocity) and led to more heat loss from the plasma to the walls, decreasing the total efficiency of the torch [36].
Furthermore, in Figure 8, experimental measurements and numerical predictions of electrothermal efficiency display that the plasma efficiency decreased linearly when the enthalpy increased.
The comparison between the value of numerical results and the measured one showed the same variation tendency of the efficiency, but the values of the numerical model were less than those of experimental measurements. Indeed, the measured value of total energy included both the energy transferred to the plasma arc and the heat dissipated by cooled water. Experimentally, the energy extracted by the cooling water was under-evaluated because a part of heat dissipated into the environment. In this case, the effective thermal efficiency was overestimated.
In addition, Figure 9 shows that the specific enthalpy of nitrogen gas increased rapidly as temperature increased, which led to greater electrical energy needed.
Another effect of current on the plasma characteristics, at the torch exit, can be intuitively shown in Figure 10. As the current increased from 100 to 200 A, the plasma temperature and velocity distributions were plotted in the ranges of 0–4000 K and 0–150 m/s scales, respectively. Figure 10a exhibits that the area of the high temperature (>2800 K) was progressively increased. Simultaneously, as shown in Figure 10b, the plasma velocity had the same variation tendency. This occurrence suggests that the increment in working current forced the plasma jet to exit the nozzle torch with a faster and larger hot core diameter.
Figure 11 represents the radial profiles of the temperature and velocity plasma jet at the torch exit for different values of working current. The increase in current had a greater effect on the plasma velocity (Figure 11a) compared to the temperature. Indeed, the maximum temperature had only risen by about 600 K when the current varied from 100 A to 200 A (Figure 11b). This was due to the dissipation of electrical energy by the cooling water. This effect can be confirmed by the decrease in the thermal efficiency versus current, presented in Figure 7.

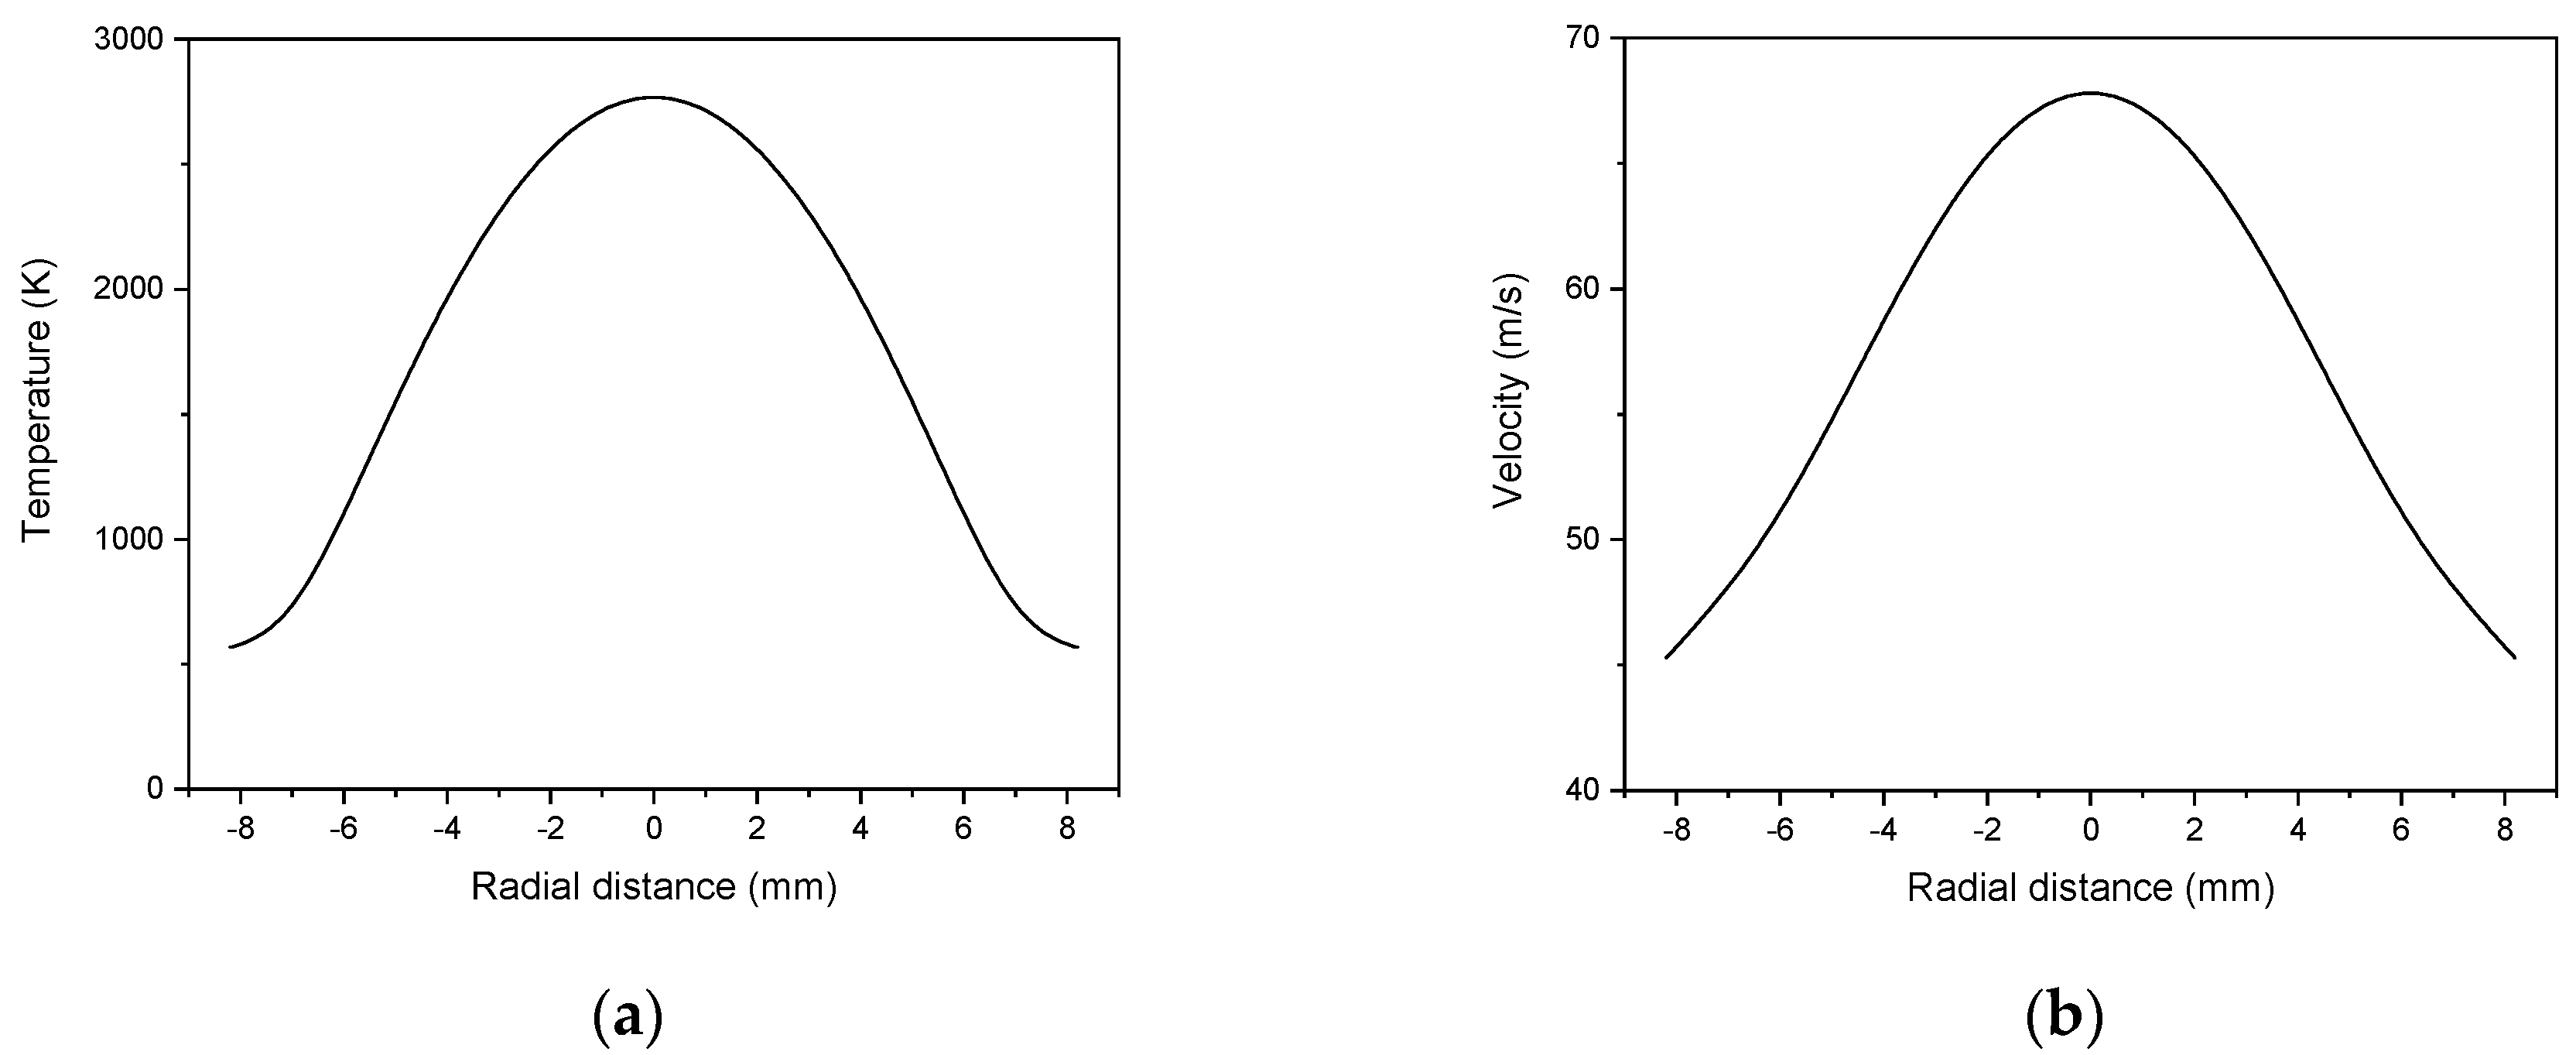
4.2. Plasma Jet Outside the Torch

Figure 12a shows the velocity distribution inside and outside the torch. When leaving the torch exit, the velocity displayed a high downward tendency, which was mainly due to the expansion process of the plasma jet outside the torch. This expansion process was due to the absence of a constrained effect and to the entrainment of cold ambient air. Indeed, the considerable increase in driven cold air resulting from the fluctuated plasma jet led to a significant decrease in plasma temperature and velocity.
The local enlarged picture of velocity vector in the grey rectangle (Figure 12a) is shown in Figure 12b. These arrows pointing in the opposite side to the flow of the plasma jet signal that a vortex roll-up formed, which displayed obvious evidence of the cold air driven into the plasma jet. Indeed, the velocity vector distribution presents alternating forward and backward stripes of the velocity vector direction, where forward velocity vectors show the blowing of the plasma jet outside the nozzle exit of the torch, and backward velocity vectors show the effect of the cold air outside the jet.
Both radial profiles of plasma temperature (Figure 13a) and velocity (Figure 13b) at 80 mm from the nozzle torch exit are shown in Figure 13. If we compare these radial profiles with the radial temperature and velocity profiles at the torch exit, presented in (Figure 11), we can notice that both temperature and velocity regions derived from the centerline at the torch exit decrease along the axial direction due to turbulent mixing of plasma with cold air.
The diameter of the plasma jet core increased, and the radial dimension of the core extended gradually. Particles injected into the plasma jet may gain different temperatures and velocities from the plasma. Therefore, an increase in the plasma jet core region implies that additional in-flight particles will be more heated and accelerated, which ultimately increases the efficiency of the deposition and the quality of the coating. Those phenomena were coherent with the actual manufacturing process [13].

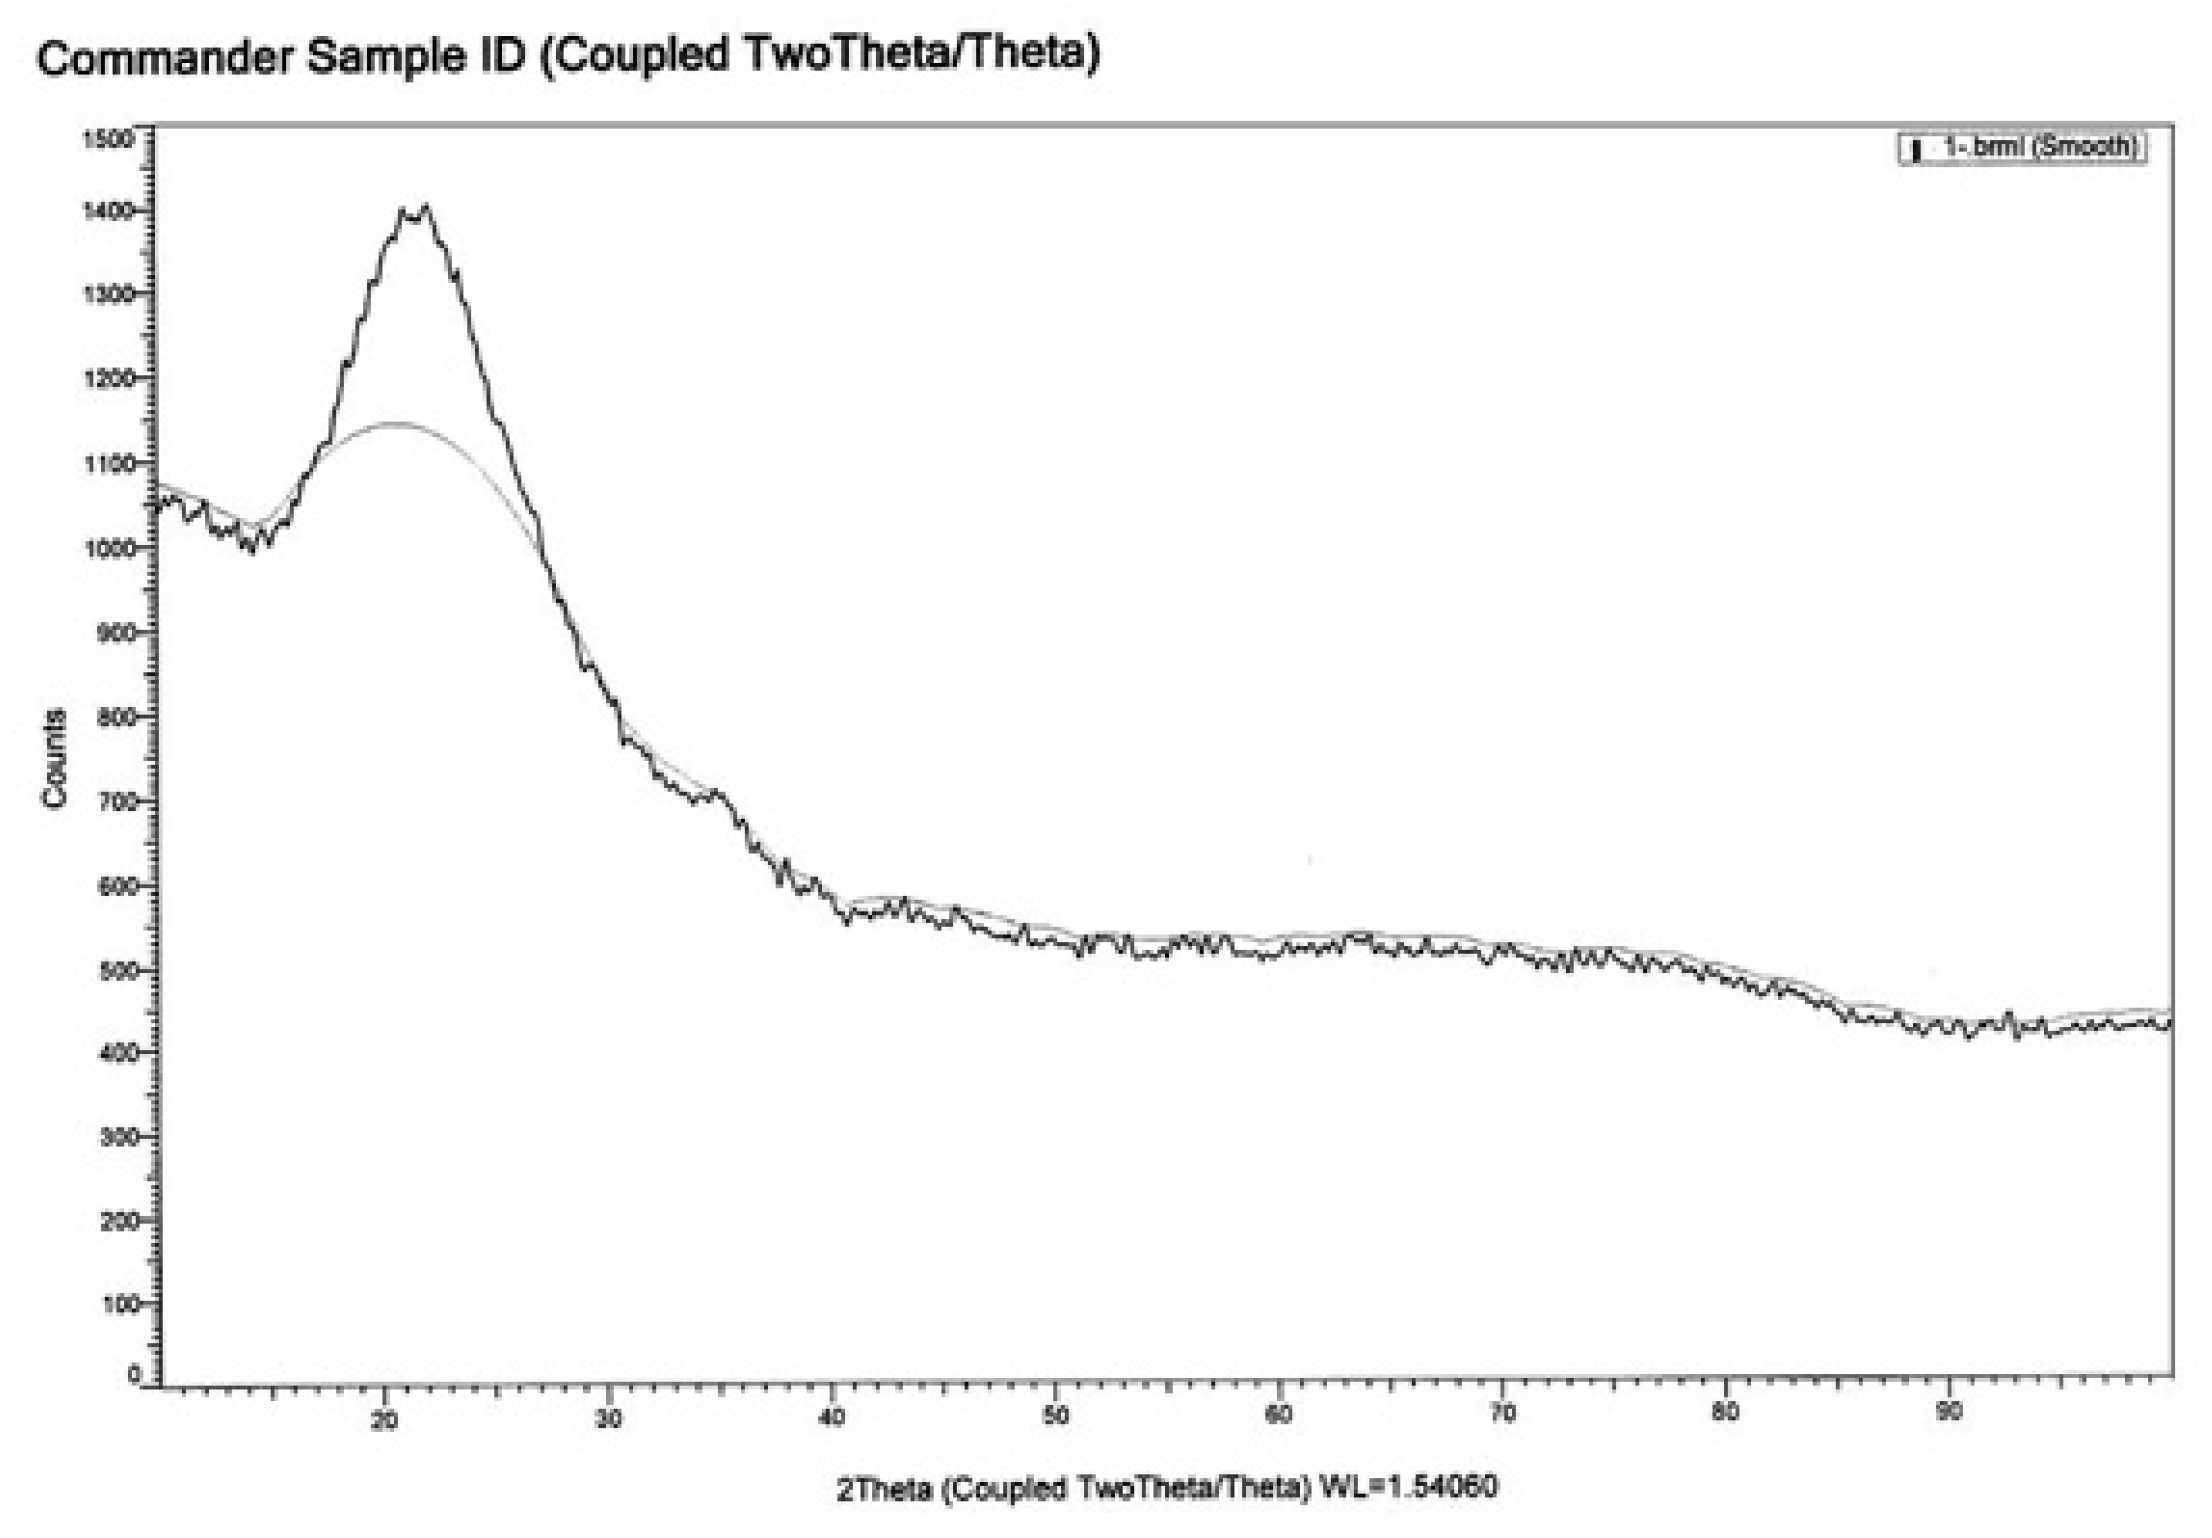
4.3. Structure of Nanosilica Particles

X-ray diffraction is an interesting technique to identify the purity, size, and crystalline nature of the materials. Figure 14 depicts the X-ray diffraction patterns of the silica sample. This figure contains, around the angle 2 theta 22–23, a strong broad, which is the characteristic of silica. This result confirms that the state of the synthesized nanosilica was amorphous. The Scherrer formula and the full width at half maximum (FWHM) were used to determine the average particle size of the silica samples. The average size of nanoparticles was calculated using the following formula:
G = K λ B c o s Θ B
where K is a dimensionless shape factor with a typical value of about 0.9, λ is the X-ray wavelength (λ = 1.78901 Å for Co Ka), θB is the maximum of Bragg diffraction peak (in rad), and B is the line width at half maximum. Using this formula, the calculated average grain size of nanoparticles was 24 nm.
The Debye–Scherrer formula was obtained from a model in which the size distribution of the crystallites was ignored; hence, the average grain size obtained from this formula was not precise compared to the size of the nanoparticles measured by TEM. Different images at variable magnifications (50,000–60,000) were recorded for the sample to investigate its average grain size. The recorded TEM images of nanosilica are shown in Figure 15. These images show that the morphology of the nanoparticles had a nearly spherical shape with a diameter ranging from 10 to 20 nm. These results confirm that the average particle dimension of the obtained silica was in nanoscale size and that they are in accordance with the XRD results.

5. Conclusions

In this work, a pilot plasma system, which contained a non-transferred arc system with a power of 30 KW, was used to synthesis nano-sized silica. The plasma operated on nitrogen, and the nitrogen tail flame could be heated to the range of 4273.15 K to 6773.15 K. A 2D numerical model was established to predict the plasma flow and heat transfer inside and outside of the torch. Simulation results showed that the plasma temperature and velocity became higher with increasing current, while the electrothermal efficiency was reduced. Additionally, the thermal efficiency decreased with increasing enthalpy because more energy was removed by cooling water. With increasing current, the plasma jet core with high velocity and temperature was expanded in axial and radial directions. Numerical simulation results were in good accordance with the experimental measurements. In addition, the initial nanosilica particles elaborated in the experimental device were characterized by X-ray diffraction (XRD) and transmission electron microscopy (TEM) to identify the purity, size, and crystalline nature of the materials and to study their mean size. The arc plasma method enabled one to produce spherical silicon ultra-fine powder of about 20 nm in diameter.

Author Contributions

Conceptualization, S.E., I.G. and I.A.A.; methodology, S.E., I.A.A. and I.G.; formal analysis, I.A.A., S.E., S.S.A. and I.G.; investigation, I.A.A., S.E., S.S.A., A.A.A. and I.G.; resources, I.A.A., S.S.A. and A.A.A.; writing—original draft, S.E., I.A.A. and I.G.; writing—review and editing, S.E., I.A.A. and I.G. All authors have read and agreed to the published version of the manuscript.

Funding

This research received no external funding.

Institutional Review Board Statement

Not applicable.

Informed Consent Statement

Not applicable.

Data Availability Statement

Data are contained within the article.

Conflicts of Interest

The authors declare no conflict of interest.

References

  1. Hussain, C.-M. Handbook of Nanomaterials for Industrial Applications; Elsevier: Amsterdam, The Netherlands, 2018. [Google Scholar]
  2. Jun, B.-M.; Kim, S.; Heo, J.; Park, C.-M.; Her, N.; Jang, M.; Huang, Y.; Han, J.; Yoon, Y. Review of MXenes as new nanomaterials for energy storage/delivery and selected environmental applications. Nano Res. 2019, 12, 471–487. [Google Scholar] [CrossRef] [Green Version]
  3. Yia, H.; Qina, L.; Huanga, D.; Zenga, G.; Laia, C.; Liua, X.; Lia, B.; Wanga, H.; Zhoua, C.; Huanga, F.; et al. Nano-structured bismuth tungstate with controlled morphology: Fabrication, modification, environmental application and mechanism insight. Chem. Eng. J. 2019, 358, 480–496. [Google Scholar] [CrossRef]
  4. Kaliannan, D.; Palaninaicker, S.; Palanivel, V.; Mahadeo, M.-A.; Ravindra, B.-N.; Jae-Jin, S. A novel approach to preparation of nano-adsorbent from agricultural wastes (Saccharum officinarum leaves) and its environmental application. Environ. Sci. Pollut. Res. 2019, 26, 5305–5314. [Google Scholar] [CrossRef]
  5. Bisla, A.; Rautela, R.; Yadav, V.; Singh, P.; Kumar, A.; Ghosh, S.; Kumar, A.; Bag, S.; Kumar, B.; Srivastava, N. Nano-purification of raw semen minimises oxidative stress with improvement in post-thaw quality of buffalo spermatozoa. Andrologia 2020, 52, e13709. [Google Scholar] [CrossRef]
  6. Aversa, R.; Petrescu, R.V.; Apicella, A.; Petrescu, F.-I. Nano-Diamond Hybrid Materials for Structural Biomedical Application. Am. J. Biochem. Biotechnol. 2016, 13, 34–41. [Google Scholar] [CrossRef]
  7. Nasrin, S.; Chowdhury, F.-U.-Z.; Hoque, S.-M. Study of hyperthermia temperature of manganese-substituted cobalt nano ferrites prepared by chemical co-precipitation method for biomedical application. J. Magn. Magn. Mater. 2019, 479, 126–134. [Google Scholar] [CrossRef]
  8. Ananth, A.; Mok, Y.S. Dielectric Barrier Discharge (DBD) Plasma Assisted Synthesis of Ag2O Nanomaterials and Ag2O/RuO2 Nanocomposites. Nanomaterials 2016, 6, 42. [Google Scholar] [CrossRef]
  9. Post, P.; Jidenko, N.; Weber, A.P.; Borra, J.-P. Post-Plasma SiOx Coatings of Metal and Metal Oxide Nanoparticles for Enhanced Thermal Stability and Tunable Photoactivity Applications. Nanomaterials 2016, 6, 91. [Google Scholar] [CrossRef] [Green Version]
  10. Dao, V.-D.; Choi, H.-S. Highly Efficient Plasmon-Enhanced Dye-Sensitized Solar Cells Created by Means of Dry Plasma Reduction. Nanomaterials 2016, 6, 70. [Google Scholar] [CrossRef] [Green Version]
  11. Samokhin, A.; Alekseev, N.; Sinayskiy, M.; Astashov, A.; Kirpichev, D.; Fadeev, A.; Tsvetkov, Y.; Kolesnikov, A. Nanopowders Production and Micron-Sized Powders Spheroidization in DC Plasma Reactors. In Powder Technology; IntechOpen: London, UK, 2018. [Google Scholar]
  12. Stein, M.; Kruis, F.-E. Optimization of a transferred arc reactor for metal nanoparticle synthesis. J. Nanopart. Res. 2016, 18, 258. [Google Scholar] [CrossRef] [Green Version]
  13. Choi, S.; Lee, H.; Park, D.-W. Synthesis of Silicon Nanoparticles and Nanowires by a Non-transferred Arc Plasma System. J. Nanomater. 2016, 2016, 5849041. [Google Scholar] [CrossRef] [Green Version]
  14. Ghedini, E.; Colombo, V. Time Dependent 3D Large Eddy Simulation of a DC Non-Transferred Arc Plasma Spraying Torch with Particle Injection. In Proceedings of the 34th International Conference on Plasma Science (ICOPS), Santa Fe, NM, USA, 17–22 June 2007; p. 899. [Google Scholar]
  15. Ishigaki, T. Synthesis of Functional Oxide Nanoparticles through RF Thermal Plasma Processing. Plasma Chem Plasma Process 2017, 37, 783–804. [Google Scholar] [CrossRef] [Green Version]
  16. Santosh, V.S.; Kondeti, K.; Gangal, U.; Yatom, S.; Bruggeman, P.-J. Ag+ reduction and silver nanoparticle synthesis at the plasma-liquid interface by an RF driven atmospheric pressure plasma jet: Mechanisms and the effect of surfactant. J. Vac. Sci. Technol. A 2017, 35, 061302. [Google Scholar]
  17. Sama, S. Thermal plasma technology: The prospective future in material processing. J. Clean. Prod. 2017, 142, 3131–3150. [Google Scholar] [CrossRef]
  18. Aboughaly, M.; Gabbar, H.-A.; Damideh, V.; Hassen, I. RF-ICP Thermal Plasma for Thermoplastic Waste Pyrolysis Process with High Conversion Yield and Tar Elimination. Processes 2020, 8, 281. [Google Scholar] [CrossRef] [Green Version]
  19. Vardelle, A.; Moreau, C.; Themelis, N.-J.; Chazelas, C. A perspective on plasma spray technology. Plasma Chem. Plasma Process 2015, 35, 491–509. [Google Scholar] [CrossRef]
  20. Li, H.-P.; Chen, X. Three-dimensional modelling of a dc non-transferred arc plasma torch. J. Phys. D Appl. Phys. 2001, 34, L99–L102. [Google Scholar] [CrossRef]
  21. Trelles, J.-P.; Chazelas, C.; Vardelle, A.; Heberlein, J.-V.-R. Arc Plasma Torch Modeling. J. Therm. Spray Technol. 2009, 18, 728–752. [Google Scholar] [CrossRef] [Green Version]
  22. Selvan, B.; Ramachandran, K.; Sreekumar, K.-P.; Thiyagrajan, T.-K.; Ananthapadmanabhan, P.-V. Three-Dimensional Numerical Modeling of an Ar-N2 Plasma Arc inside a Non-Transferred Torch. Plasma Sci. Technol. 2009, 11, 679. [Google Scholar] [CrossRef]
  23. Guo, Z.; Yin, S.; Qian, Z.; Liao, H.; Gu, S. Effect of Asymmetrical Distribution of Current Density on the Three-Dimensional Non-Transferred Arc Plasma Torch. Comput. Fluids 2015, 114, 163–171. [Google Scholar] [CrossRef]
  24. Modirkhazeni, S.-M.; Trelles, J.-P. Non-transferred Arc Torch Simulation by a Non-equilibrium Plasma Laminar-to-Turbulent Flow Model. J. Therm. Spray Technol. 2018, 27, 1447–1464. [Google Scholar] [CrossRef]
  25. Frolov, V.; Ivanov, D. Development of mathematical models of thermal plasma processes. Mater. Science. Non-Equilib. Phase Transform. 2017, 3, 56–59. [Google Scholar]
  26. Kim, T.-H.; Lee, Y.-H.; Kim, M.; Oh, J.-H.; Choi, S. Thermal Flow Characteristics of the Triple Plasma Torch System for Nanoparticle Synthesis. IEEE Trans. Plasma Sci. 2019, 47, 3366–3373. [Google Scholar] [CrossRef]
  27. Boulos, M.I.; Fauchais, P.; Pfender, E. Thermal Plasmas: Fundamentals and Applications; Plenum Press: New York, NY, USA, 1994. [Google Scholar]
  28. Launder, B.-E.; Spalding, D.-B. Lectures in Mathematical Models of Turbulence; Academic Press: London, UK, 1972. [Google Scholar]
  29. COMSOL Multiphysics® v. 5.1. CFD Module User’s Guide; COMSOL AB: Stockholm, Sweden, 2015. [Google Scholar]
  30. COMSOL Multiphysics® v. 5.1. Heat Transfer Module User’s Guide; COMSOL AB: Stockholm, Sweden, 2015. [Google Scholar]
  31. COMSOL Multiphysics® v. 5.1. AC/DC Module User’s Guide; COMSOL AB: Stockholm, Sweden, 2015. [Google Scholar]
  32. COMSOL Multiphysics® v. 5.1. Plasma Module, User’s Guide; COMSOL AB: Stockholm, Sweden, 2015. [Google Scholar]
  33. Chau, S.W.; Lu, S.Y.; Wang, P.J. Study on arc and flow characteristics of a non-transferred DC steam torch. J. Chin. Inst. Eng. 2021, 44, 646–658. [Google Scholar] [CrossRef]
  34. Selvan, B.; Ramachandran, K.; Sreekumar, K.P.; Thiyagarajan, T.K.; Ananthapadmanabhan, P.V. Numerical and experimental studies on DC plasma spray torch. Vacuum 2010, 84, 444–452. [Google Scholar] [CrossRef]
  35. Wen, K.; Liu, X.; Liu, M.; Zhou, K.; Long, H.; Deng, C.; Mao, J.; Yan, X.; Liao, H. Numerical simulation and experimental study of Ar-H2 DC atmospheric plasma spraying. Surf. Coat. 2019, 371, 312–321. [Google Scholar] [CrossRef]
  36. Bora, B.; Aomoa, N.; Kakati, M. Characteristics and temperature measurement of a non- transferred cascaded DC plasma torch. Plasma Sci. Technol. 2010, 12, 181. [Google Scholar] [CrossRef]
Figure 1. (a) The geometry of the plasma torch. (b) Revolution of the 3D geometry of the torch. All dimensions are in mm.
Applsci 11 09842 g001
Figure 2. Plasma pilot for the synthesis of nano-silica.
Applsci 11 09842 g002
Figure 3. Distribution of plasma temperature for different current values ((a) 100 A, (b) 150 A, (c) 200 A) in the torch.
Applsci 11 09842 g003
Figure 4. Distribution of the temperature of plasma at the nozzle exit for different current value ((a) 100 A, (b) 150 A, (c) 200 A).
Applsci 11 09842 g004
Figure 5. Distribution of plasma velocity for different current values ((a) 100 A, (b) 150 A, (c) 200 A) in the torch.
Applsci 11 09842 g005
Figure 6. Plasma voltage as a function of current.
Applsci 11 09842 g006
Figure 7. Numerical and experimental variation of thermal efficiency with working current (100 A, 150 A, 200 A) for different gas flow rates (Q = 233.3 sccm and Q = 100 sccm).
Applsci 11 09842 g007
Figure 8. Numerical and experimental variation in thermal efficiency as a function of enthalpy with a gas flow rate Q = 233.3 sccm.
Applsci 11 09842 g008
Figure 9. Enthalpy of plasma gas (N2) as a function of temperature.
Applsci 11 09842 g009
Figure 10. Distributions of plasma temperature (a) and velocity (b) at the torch exit at different current 100 A, 150 A, and 200 A.
Applsci 11 09842 g010
Figure 11. The radial profiles of the temperature (a) and velocity (b) plasma jet at the torch exit for different values of working current.
Applsci 11 09842 g011
Figure 12. Velocity field distribution (a) and the corresponding velocity vector (b) in the grey rectangle.
Applsci 11 09842 g012
Figure 13. The radial profiles of the temperature (a) and velocity (b) plasma jet at 80 mm from the nozzle torch exit.
Applsci 11 09842 g013
Figure 14. XRD of nanosilica.
Applsci 11 09842 g014
Figure 15. TEM images of nanosilica.
Applsci 11 09842 g015
Table 1. Boundary conditions of the numerical model.
Boundary P u T A
Inlet P = P i n u i n T i n = 300   K n = 0 n A = 0
Cathode n P = 0 u = 0 T = T c a t h ( r ) ρ n = J c a t h ( r ) n A = 0
Anode n P = 0 u = 0 k n T = h w ( T T w ) = 0 n A = 0
Torch wall n P = 0 u = 0 n T = 0 n = 0 n A = 0
Outlet P = P o u t n u = 0 n T = 0 n = 0 A = 0
Table 2. Parameters of current density profiles.
Current (A) J m a x   ( A / m 2 ) n c a t h R c a t h   ( m )
100 0.17 × 10 7 4 8.2 × 10 3
150 0.26 × 10 7 4 8.6 × 10 3
200 0.35 × 10 7 4 8.9 × 10 3
Table 3. Operation conditions used to synthesis nano-silica.
ItemDescription
Working gasNitrogen
Reactor pressure400 kPa
Nitrogen flow rate(78–240) sccm
Power range10–30 kW
Current plasma100–200 A
Plasma voltage80–200 V
Cathode materialThoriated tungsten
Anode materialHigh-purity copper
Interelectrode gap1.8–2 mm
Overall length250 mm
Outlet electrode diameter17.2 mm
Temperature of exit gas2400–4800 °C
Publisher’s Note: MDPI stays neutral with regard to jurisdictional claims in published maps and institutional affiliations.

