Abstract
In this paper, we focus on fabrication and physicochemical properties investigations of silica–multiwalled carbon nanotubes/poly(dimethylsiloxane) composite coatings deposited on the glass supports activated by cold plasma. Air or argon was used as the carrier gas in the plasma process. Multiwalled carbon nanotubes were modified with poly(dimethylsiloxane) in order to impart their hydrophobicity. The silica–multiwalled carbon nanotubes/poly(dimethylsiloxane) nanocomposite was synthesized using the sol–gel technique with acid-assisted tetraethyl orthosilicate hydrolysis. The stability and the zeta potential of the obtained suspension were evaluated. Then, the product was dried and used as a filler in another sol–gel process, which led to the coating application via the dip-coating method. The substrates were exposed to the hexamethyldisilazane vapors in order to improve their hydrophobicity. The obtained surfaces were characterized by the wettability measurements and surface free energy determination as well as optical profilometry, scanning electron microscopy, and transmittance measurements. In addition, the thermal analyses of the carbon nanotubes as well as coatings were made. It was found that rough and hydrophobic coatings were obtained with a high transmittance in the visible range. They are characterized by the water contact angle larger than 90 degrees and the transmission at the level of 95%. The X-ray diffraction studies as well as scanning electron microscopy images confirmed the chemical and structural compositions of the coatings. They are thermally stable at the temperature up to 250 °C. Moreover, the thermal analysis showed that the obtained composite material has greater thermal resistance than the pure nanotubes.
1. Introduction
Silica materials are a large group of functional materials with a wide range of applications [1]. They can be obtained in a polycondensation reaction from silicon alkoxides or other similar precursors using the sol–gel process. The final properties of the product depend on the process parameters such as type of precursor and solvent, catalyst, or temperature. This makes it an effective, simple, and cheap technology characterized by many advantages [2]. Silica-based coatings are one of such materials; they are largely developing and future-oriented because they can impart a wide variety of predetermined properties to a surface [3]. Silica coatings can be doped with various fillers or modifiers in order to improve or change their properties. This makes them a composite material. The composite is produced from two or more constituent materials with different physical and chemical properties [4]. Their combination results in a material with properties dissimilar to those of individual elements. When the two constituents are at the nanometer or molecular level, this is a hybrid material [5]. This combination, consisting of organic and inorganic constituents, makes an interesting material with specific physical, thermal, optical, electrical, and mechanical properties that are promising for various applications [6,7].
Recently, the use of carbon nanotubes (CNTs) [8] has become more common, and they are now one of the most widely used organic additives due to their unique properties such as small density, excellent mechanical properties, and good thermal and electrical conductivity, which make them an ideal component for the organic phase in composites or hybrids [9,10,11,12]. CNTs are cylindrical structures consisting of rolled-up sheets of single-layer carbon network with the structure (sp2) of graphene [13]. In the case of the single-walled carbon nanotubes (SWCNTs), this is a single sheet close to 1 nanometer in diameter [14], whereas for the multiwalled carbon nanotubes (MWCNTs), there are several concentrically interlinked single tubes, and the end diameter of the structure can reach up to 100nm [15]. The length of nanotube ranges from nanometers, through millimeters, up to several centimeters [16]. The popularity of carbon nanotubes applications can be demonstrated by their usage not only for nanocomposites [17,18] but also in many fields—for example, drug delivery systems [19], functional fabrics production [20], medicine [21], electronics [22], solar energy systems [23], road constructions [24], and even spacecrafts [25]. There is a quick and simple method to synthesize doped silica composites—mix an organic additive with one of the precursors (for example tetraethyl orthosilicate) followed by the sol–gel reaction assisted with acid or base catalysis [26]. The hydrogen bonds formed between the two constituents prevent phase separation and result in obtaining a transparent and stable composition or a film [27]. However, so far, there are no reports in the literature on the use of carbon nanotubes as a silica coating modifier, but they have been successfully used, for example, to produce composite polymer materials [28] or different types of hybrid materials [29].
Another possibility to modify the properties of the coatings is to modify the support with plasma. Plasma is commonly defined as a fourth state of matter, distinct from a solid, liquid, or gas, that is composed of high-energy ions, electrons, neutral or excited molecules, and UV light [30]. It was first described by the American chemist Irving Langmuir in the 1920s [31,32]. It is crucial to distinguish between thermal and nonthermal (cold) plasmas, and the classification is based on the relative temperatures of their constituents. In the case of the cold plasma, there will not be a local thermodynamic equilibrium between the highly energetic electrons generating plasma and other particles (Telectrons >> Tplasma) because the density of the electrons in the plasma is small compared to that of other constituents. Thus, the term “cold” refers to the plasma with the temperature between 40 °C and 70 °C [33]. This plays a key role if plasma is used to modify heat-sensitive materials because plasma modification of a solid surface is one of its common applications. It can be used for food decontamination [34] and in medicine [35], nanotechnology [36], and surface engineering [37]. The high-energy constituents of the plasma interact with a surface and can change a wide range of its properties such as surface free energy, wettability, roughness, surface charge, and biocompatibility. The ability of plasma modification to induce any changes in the bulk of a solid is still an open question.
The aim of this study was to obtain a new silica–multiwalled carbon nanotubes/poly(dimethylsiloxane) (silica–MWCNTs/PDMS) composite coating. The hydrophobic properties of the product were to be ensured by the modification of carbon nanotubes with poly(dimetylsiloxane) (PDMS) as well as hydrophobization of the surfaces with hexamethyldisilazane. The influence of cold plasma modification of the support on the surface properties of the coating was investigated. The physicochemical properties of the obtained coatings were comprehensively studied using scanning electron microscopy, X-ray diffraction, optical profilometry, thermal analysis, contact angle measurements, and surface free energy evaluation.
2. Materials and Methods
2.1. Materials and Reagents
During the investigation, the following reagents and materials were used:
- demineralized water (SPRING 20 from Hydrolab, Straszyn, Poland)
- ultrapure water (Milli-Q™ system from Merck, Darmstadt, Germany; 18.2 MΩ∙cm−1 at 298 K)
- multiwalled carbon nanotubes, MWCNTs
- tetraethyl orthosilicate, TEOS (98%, Aldrich, St. Louis, USA)
- hydrochloric acid, HCl (35–38%, POCH S.A., Lublin, Poland)
- ethanol, EtOH (96%, POCH S.A., Lublin, Poland)
- hexamethyldisilazane, HMDS (98%, Aldrich, St. Louis, USA)
- potassium chloride, KCl (reagent grade, POCH S.A., Lublin, Poland)
- glass microscope slides with the dimensions of 76 × 26 × 1 mm (ChemLand, Stargard, Poland)
2.2. Samples Preparation
2.2.1. Synthesis of the Filler
The multiwalled carbon nanotubes were obtained in another experiment using the catalytic chemical vapor deposition (CCVD) method as described by Kartel et al. [38], using pyrolysis of propylene on the complex metal oxide catalysts [39]. The product was hydrophobized by physical adsorption of poly(dimethylsiloxane) as follows. Before the process, the samples were dried at 110 °C for 2 h; then, the hexane solution of PDMS (1 wt% PDMS) was prepared and 5 wt% of the solution was added to the determined amount of dried MWCNTs. After that, the suspension was mechanically stirred and finally dried at room temperature for 48 h and then at 80 °C for 3 h, obtaining the powder form (similar to that of unmodified MWCNTs). The detailed description of the synthesis and study on physicochemical properties of these MWCNTs is available in another paper [40].
The silica–MWCNTs/PDMS hybrid filler was synthesized via the acid-assisted tetraethoxysilane hydrolysis at the molar ratio 1.0:4.6 × 10⁻²:3.45 (TEOS:HCl:H2O). The composition was stirred using a magnetic stirrer at 300 rpm at 50 °C for 2 h. Then, the MWCNTs suspension in ethanol (3‰ m/v) was instilled, which corresponds to the volume dilution of 1:3, and the composition was stirred for 30 min. After that, a portion of the sample was submitted to stability testing while the rest was dried at room temperature for 24 h (gelation and solvent evaporation). Sequentially, the powder was suspended in 5 mL of ultrapure water and centrifuged at 5000 rpm for 10 min at room temperature; the procedure was repeated three times. Then, the product was dried at room temperature for 48 h, ground gently in the agate mortar for 2 min into a powder form and heated at 150 °C for 24 h.
2.2.2. Plasma Activation of the Supports
The glass microscope slides, which are factory cleaned, degreased, and ready to use, were taken as the supports for the coatings. They were activated by air or argon cold plasma by means of PICO Low Pressure Plasma System (Diener Electronic GmbH, Germany) using the parameters in Table 1.

Table 1.
Plasma process parameters for the activation of the glass supports.
2.2.3. Synthesis and Coating Application
The coating was synthesized by the sol–gel method as it was described in our previous paper [41] with the difference that the synthesis proceeded at 50 °C. TEOS was used as the precursor and HCl as a catalyst of the hydrolysis at the molar ratio of 1.0:4.6 × 10⁻²:3.45 for TEOS:HCl:H2O, respectively. The filler (silica–MWCNTs/PDMS composite) suspension in EtOH was prepared at the concentration 3% (m/v). After the synthesis completion, a sample of the product was taken for stability testing (parallel with the coating process).
The KSV NIMA KN4001 Dip Coater (Biolin Scientific, Sweden) was used for the glass supports covering. The withdrawal speeds of the samples as well as the methods of the support activation are presented in Table 2. Between the successive coatings of the samples the sol was still being stirred at 300 rpm and its temperature was maintained at 50 °C. The sample #7 was coated by manual immersion while #8 by spreading of 5 mL of the sol on the support.
Table 2.
Parameters of individual samples.
2.2.4. Hydrophobization of the Coatings
To impart the surface hydrophobicity, the substrates were modified with hexamethyldisilazane. They were kept in a desiccator under the HMDS saturated vapor at ambient temperature and pressure for 24 h. Then, the residual modifier (unbound hexamethyldisilazane) and the byproduct (ammonia) were dismissed by heating the substrates at 100 °C for 1 h.
2.3. Samples Study
2.3.1. Stability
The stability measurements were made by the TurbiscanLAB (Formulaction, Toulouse, France) apparatus equipped with the cooler unit, which is a cooling/heating module. The silica–MWCNTs/PDMS hybrid material suspension as well as the sol used for the surface coating with the dip-coating technique were tested. The products were put into the Turbiscan vessel immediately when the synthesis was over, and the measurements were made at 50 °C (the synthesis temperature). The transmission profiles were collected for 3 h every minute and then for 9 h every 30 min. Based on these data, the Turbiscan Stability Index (TSI) was calculated by the TurbiSoft 2.3 software as it was described in our previous paper [42].
The zeta potential was determined using the Zetasizer Nano ZS90 (Malvern Instruments Ltd., Malvern, United Kingdom) with the automatic measurement procedure that uses the modified PALS (phase analysis light scattering) signal processing technique called M3-PALS based on the electrophoretic mobility. The sample in its native pH was prepared as follows: about 0.02 g of the silica–MWCNTs/PDMS composite was dissolved in 6 mL of the 32.5% aqueous ethanol solution and 10 mL of 1 mM KCl was added in order to improve conductivity in the continuous phase. Finally, the alcohol concentration in the water solution (masses of CNTs and KCl are negligible) was about 12%. The measurements were made at 20 °C using the universal dip cell (Pd electrodes with 2 mm spacing, 40 µL disposable microcuvette) and the Smoluchowski approximation [43,44] was applied in order to transform the measured electrophoretic mobilities into the zeta potential. The appropriate parameters for the dispersant were established in the software: the viscosity equal to 2.16 cP [45], the refractive index equal to 1.3410 at a wavelength (589.29 nm) close to the laser wavelength (632.8 nm) [46], and the dielectric constant equal to 75.67 [47].
2.3.2. Thermal Analysis
The thermogravimetric (TG) study of the carbon nanotubes was carried out using a Derivatograph MOM Q–1500 D (Paulik–Paulik–Erdey, Budapest, Hungary) with registration of the differential TG (DTG) and differential thermal analysis (DTA) data. The measurements were made under atmospheric pressure, at 30–1000 °C, in the static air atmosphere, at a heating rate of 10 °C/min.
The TG/MS/FTIR studies of coating were carried out using STA 449 F1 Jupiter (Netzsch, Selb, Germany) in the range of 30–1000 °C with the heating rate of 10 °C/min, in the synthetic air atmosphere with the gas flow 50 cm3/min and the mass of the sample was about 4 mg. The apparatus was coupled simultaneously with Tensor 27 (Bruker, Karlsruhe, Germany) FTIR spectrometer as well as QMS 403 D Aëolos Quadro (Netzsch, Selb, Germany) quadrupole mass spectrometer in order to detect volatile products evolved during the analysis.
2.3.3. Wettability and Surface Free Energy
The contact angle measurements were made using the DigiDrop Contact Angle Meter (GBX, Romans-sur-Isère, France) equipped with a closed and thermostated chamber. The Milli-Q ultrapure water (γl ≅ 72.8 mN/m at 20 °C) was used as the probe liquid. The sessile droplet technique was used as follows: a 6 µL droplet was settled on the examined surface and the advancing contact angle was measured, then 3 µL of liquid was sucked and the receding contact angle was measured. The contact angle values were calculated by the WinDrop++ software using the polynomial algorithm based on the droplet shape using the contour mode. Ten water droplets were measured and averaged along each surface in order to increase the measurement accuracy.
The surface free energy (SFE) of each sample was estimated using the contact angle hysteresis (CAH) approach proposed by Chibowski [48]:
where: γs—the surface free energy, γl—the surface tension of the probe liquid, θa—the advancing contact angle, θr—the receding contact angle. This allows us to determine the SFE as the function of three directly measurable parameters: liquid surface tension and both advancing and receding contact angles.
2.3.4. Surface Topography and Thickness of the Coatings
The surfaces height maps were made using the ContourGT-K1 3D Optical Profiler (Bruker, Germany) in order to evaluate the surface roughness and to obtain information about its topography. The measurements were made with 5× objective at 1× magnification using the white light and VXI technique. The sampling area was 1261 μm × 946 μm. The roughness parameters were calculated using the Vision64 (ver. 5.41) software. The same equipment and procedure were used to estimate the thicknesses of the obtained coatings.
2.3.5. Scanning Electron Microscopy
The morphology of the carbon nanotubes as well as the obtained surfaces were studied using scanning electron microscopy. The images were taken using the Quanta 3D FEG (FEI, Hillsboro, USA) apparatus equipped with the secondary electron detector (SED)—an Everhart-Thornley detector (ETD). The beam operated at 20 kV in the case of CNTs samples or 30 kV in the case of coated surfaces (accelerating voltage for the electrons). The other specific parameters are shown in the SEM images. In the case of the carbon nanotubes samples, the quantitative SEM/EDS (energy dispersive X-ray spectroscopy) analysis was also performed.
2.3.6. X-Ray Diffraction Analysis (XRD)
The surface obtained by the dip-coating with the largest contact angle was examined by the Empyrean multipurpose diffractometer (Malvern Panalytical, Almelo, The Netherlands) with CuKα radiation. The small angle X-ray diffraction patterns were scanned at room temperature in the angular range 2θ from 6° to 95° with a step size of 0.02°.
2.3.7. Optical Properties
The Helios Gamma UV-Vis Spectrophotometer (Thermo Electron Corporation, Beverly, USA) was used in order to make the transmission measurements of the samples. The apparatus was equipped with the quartz-coated single-beam optical system with the 2 nm spectral bandwidth. The tungsten lamp and the deuterium lamp were used as light sources. The measurements were made at room temperature in the wavelength range from 190 nm to 800 nm with the 0.5 nm step, which corresponds to the ultraviolet C (UV-C) and visible (VIS) light. The obtained data were recorded by the VISION software and the baseline subtraction was made automatically.
3. Results and Discussion
The Turbiscan transmission profiles of the silica–MWCNTs/PDMS hybrid filler suspension are shown in Figure 1. Just after the synthesis, the transmission along the entire length of the flask was equal to zero because of the formation of an opaque, black product (the color comes from the carbon nanotubes). The increase in transmission at the top of the vessel over the time is due to the start of the gelling process and the phase separation—formation of a transparent solvent (alcohol) layer. To estimate the stability of the sample, the Turbiscan Stability Index (TSI) was calculated. This is a dimensionless indicator that allows one to compare the samples with each other and can vary in the range of 0–100. The value of the TSI is inversely proportional to the system stability [49]. The Turbiscan brochure states that up to the Turbiscan Stability Index equal to 1, the system is stable (referred to as Visually Excellent for TSI < 0.5 or Visually Good for TSI < 1.0). In this case, the TSI exceeded the value of 0.5 after 8 h 20 min. This means detecting the beginning of destabilization, but in a very early stage, this can be particles migration or size variation. The global TSI after 12 h is equal to 0.9, which allows to confirm the stability of the system during this time. It exceeded the value of 1.0 after 13 h 15 min, but the destabilization remains still invisible for the eye. The red curve shows the transmission profile for the system with complete gelling. The lowering of the upper meniscus of the sample is noteworthy. This confirms the formation of particle agglomerates and the reduction of their mobility, and thus the contraction of the system volume.
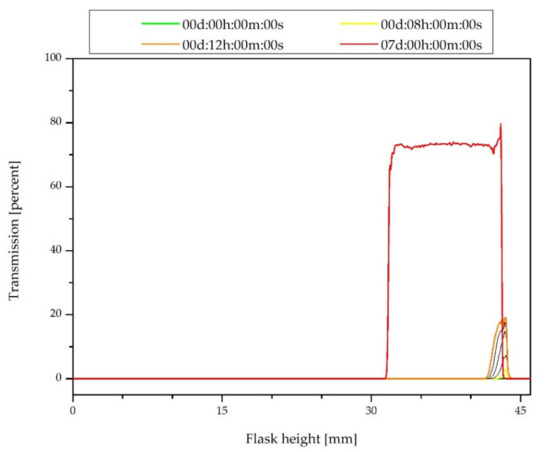
Figure 1.
Transmission profiles of the silica–MWCNTs/PDMS hybrid filler suspension just after the synthesis.
As it can be observed in Figure 2, in the case of a composition for the dip-coating, the destabilization occurs faster. The TSI exceeded the value of 0.5 just after 6 min 28 s and 1.0 after 12 min 54 s. The value of 3.0 was reached after 38 min 32 s, which means that important stability destabilization occurs due to large sedimentation. In this stage, the destabilization may not be visible yet, but based on the transmission profiles in Figure 2, it can be concluded that the filler particles fall (sedimentation) to the bottom of the flask. If the composition is used for the spray coating, its stabilization should be considered.
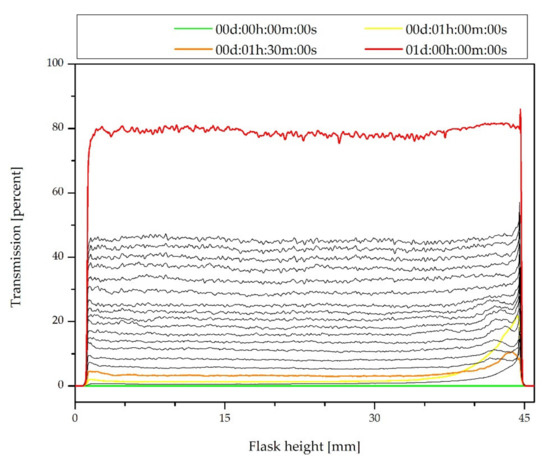
Figure 2.
Transmission profiles of the coating composition just after the synthesis.
The zeta potential (ZP) of the obtained filler (dried gel) suspension in the 32.5% ethanol solution was equal to −11.1 mV. The negative value indicates the presence of negative charges on the nanoparticles surface. Therefore, it can be concluded that the surface silanol groups (Si-OH) take the form of the ionized Si-O- species. They can initiate a cross-linking reaction of the silanol groups, which will result in the formation of the oxygen bridging between the nanoparticles and could induce its agglomeration [50]. The ability to create bonds with nanoparticles of the filler is desirable in the synthesis of a coating composition. The information about the surface charge and its structure also allows for the stabilization of the filler nanoparticles suspension.
The results of the thermal analysis of nonmodified multiwalled carbon nanotubes, PDMS, and the MWCNTs/PDMS composite are shown in Figure 3.
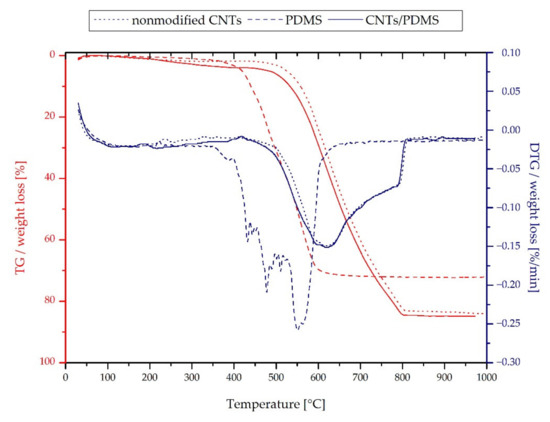
Figure 3.
Thermal analysis of the MWCNTs, PDMS, and silica–MWCNTs/PDMS composite.
The first step of weight loss of the PDMS starts from about 290 °C and corresponds to the depolymerization reaction resulting in the volatile cyclic oligomers.
A significant weight loss in the second step from approximately 500 °C is caused by oxidation, which leads to the polymer residue decrease to even about 10% of its previous mass [51,52]. The pristine MWCNTs are thermally stable up to about 400 °C, but above 500 °C, the decomposition process proceeds relatively fast. It corresponds to the sample combustion and can be confirmed by the DTG curve due to the appearance of a high peak [53]. Figure 3 shows that the MWCNTs/PDMS composite decomposes at a much higher temperature than pure PDMS but not much lower than that of the unmodified carbon nanotubes. However, there is a slight initial weight loss at lower temperatures up to 500 °C, which can correspond to the depolymerization of PDMS.
The thermal analysis results of the coating material can be observed in Figure 4. In the first step, from about 60 °C to 200 °C, the adsorbed water is removed. This is confirmed by the DTG peak at 99.1 °C and the DSC peak corresponding to the heat necessary to evaporate the water (endothermic process). Moreover, in the mass spectrum in Figure 5, a strong signal at m/z equal to 17 and 18 can be observed as well as wide peaks in the range of 3000–3400 cm−1 in the FT-IR spectrum. The process in the range of 200–500 °C can be associated with decomposition of the surface methyl group due to hydrophobization by HMDS, which is confirmed by the peak in the FT-IR spectrum (Figure 5) in the range of 2800–3000 cm−1. The combustion process of the material begins at a temperature above 600 °C, which confirms the release of carbon dioxide in both spectra in Figure 5. This can be confirmed by the DSC curve, which shows the exothermic peak in the range of 600–700 °C. In the case of the coating, the effects of earlier PDMS depolymerization cannot be clearly observed because the filler is predominantly built in the bulk phase of the material. This will be confirmed also by the SEM images of the surface as well as the XRD analysis further in this paper.
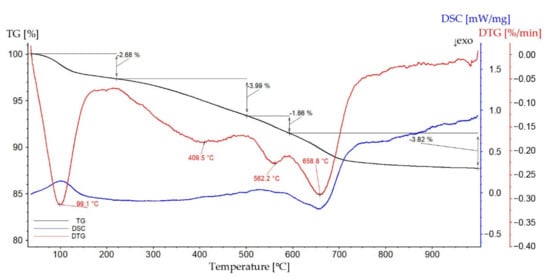
Figure 4.
TG, DTG, and DSC curves of the coating.
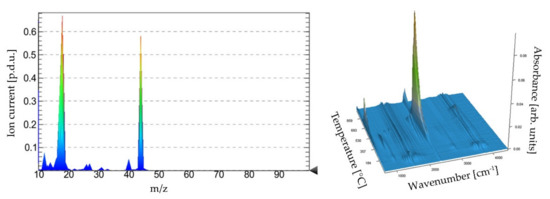
Figure 5.
Mass and FT-IR spectra of volatile products of the thermal analysis of the coating.
The total weight loss is equal to 12.35%, of which 2.68% is adsorbed water. This is a significant difference compared to the decomposition of the main filler component, carbon nanotubes with adsorbed PDMS. Thus, it can be concluded that the obtained composite coating is characterized by better stability and thermal resistance.
The water contact angles (WCAs) on each sample are presented in Figure 6. On each real surface, the advancing contact angle is the highest one and the receding contact angle is the smallest contact angle possible to measure. Young’s contact angle is somewhere between them, and its experimental measurements are practically impossible [54,55]. For this reason, in order to describe the wettability of the surfaces better, the equilibrium contact angles were calculated using Tadmor’s approach [56].
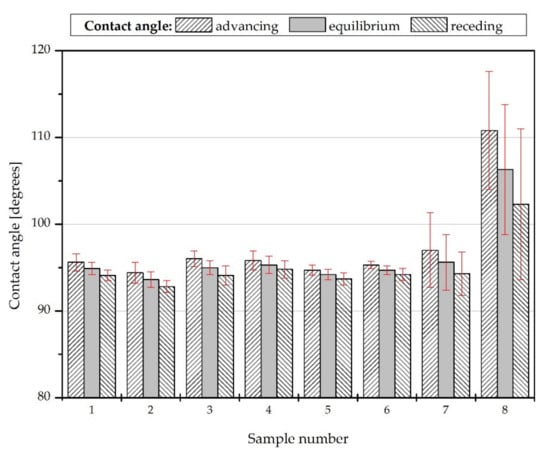
Figure 6.
Water wettability of the obtained coatings.
The highest WCA, equal to 106.3 ± 7.5 degrees, can be observed in the case of sample #8. As shown in Figure 7, this surface is also characterized by the largest contact angle hysteresis (8.5 ± 4.1 degrees) and the smallest surface free energy (21.2 ± 3.8 mJ/m2). This results from the method of applying the coating; the layer with the largest thickness and heterogeneity was obtained, which confirms its roughness parameters and the surface height map. The high standard deviations of the contact angles, contact angles hysteresis, and surface free energies indicate a wide physical and chemical heterogeneity of surfaces #7 and #8.
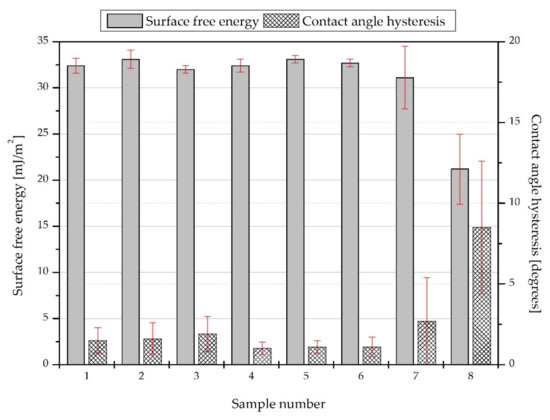
Figure 7.
Surface free energies of the obtained surfaces.
Sample #4 has the largest contact angle (95.3 ± 1 degrees) among the samples obtained with the dip coating. However, the difference in the withdrawal speed in the critical range does not affect the surface properties of the produced coatings significantly; the equilibrium contact angles of the corresponding samples only differ by about one degree.
In the case of the air plasma modification of the support, a slight decrease in the water contact angle on the coating can be observed (sample #1 compared to #2 and sample #4 compared to #5), while argon plasma modification causes a slight increase of the contact angle (sample #1 compared to #3) or does not affect surface wettability (sample #4 compared to #6). Moreover, plasma activation will improve the coatings adhesion [57,58]. However, it is necessary to carry specialized durability tests out in order to investigate this phenomenon.
The linear (R) as well as the areal (S) roughness parameters of the obtained surfaces are presented in Table 3. The arithmetic mean deviation of the roughness profile (Ra) and the root mean square deviation of the roughness profile (Rq) are commonly used to describe surface roughness [59,60]. However, they are linear roughness parameters and do not take the entire sampling area into account, only the roughness profile along one of the arbitrary selected axes. As can be seen in Table 3, the linear parameters (Ra and Rq) differ significantly from the corresponding areal parameters (arithmetical mean height—Sa, and root mean square height—Sq). It is postulated that the areal parameters provide more information about the complexity of surfaces and allow for better understanding of surface morphology than the profile (linear) parameters [61]. Thus, the areal parameters were calculated, and they will be analyzed for better surface description.
Table 3.
Linear and areal roughness parameters of the obtained surfaces.
Sa and Sq are significantly higher in the case of samples #7 and #8—they differ by several orders of magnitude. This explains the different methods of applying the coatings, and thus obtaining a layer with a greater thickness and heterogeneity, compared to the other samples. This is reflected in the surface height maps in Figure 8, where there are more peaks and high flat areas compared to samples #1–#6. This is also the reason for the larger contact angles and contact angles hysteresis values on surfaces #7 and #8 as it was mentioned above. It should be kept in mind that the Sa and the Sq parameters can be specious for the surfaces with different spatial and height symmetries. They can have the same Sa or Sq while the texture will be completely different. Thus, other height, spatial or hybrid parameters for the obtained surfaces were calculated. The skewness (Ssk) for all surfaces, except #3, is a positive value. This indicates the predominance of peaks structures, while the negative value for sample #3 points out to predominance of the surface comprising valleys. The kurtosis (Sku) evaluates sharpness in the height distribution; its value above 3.0 for all the samples means that there are excessively high peaks and/or deep valleys on these surfaces. The root mean square gradient (Sdq) represents the mean magnitude of the local slopes forming the surface—the greater the value of Sdq, the more steeply the surface is inclined. This is useful for differentiating surfaces with similar Sa values. Samples #2 and #5 are such an example. They are both deposited on the support activated by air plasma and characterized by similar Sa values (4.289 nm and 4.11 nm, respectively). However, coating #5 is described by a larger Sdq value (0.14°) than #2 (0.06°), which corresponds to the height maps in Figure 8; visually, there are more peaks on surface #5.
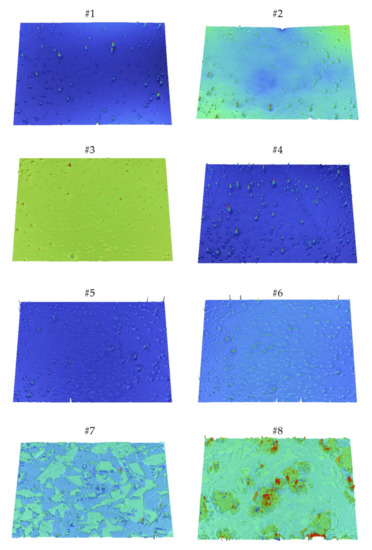
Figure 8.
3-D height maps of the obtained surfaces (sample number above the image).
Sdq can be also associated to the wetting degree of surface by various fluids. The developed interfacial area ratio (Sdr) describes in percentage the increasing surface area after applying coating compared to the flat surface of the support. It can be concluded that in the case of the samples produced by dip-coating, there are only microroughness due to small Sdr values, while on surfaces #7 and #8, there is macroroughness resulting from an increase in the surface area of up to about 10% and 50%, respectively. This confirms the summit density (Sds) parameter, which corresponds to the number of summits per unit area making up the surface. Samples #1–#6 are described by smaller values of the Sds due to single and sharp peaks, while samples #7 and #8 have wider summits. The texture aspect ratio (Str) evaluates directionality of the surface texture. For all samples, the Str values are greater than 0.5 with an average of 0.75, which indicates that the surfaces textures do not have periodicity in the specific direction. Regardless of the type of plasma, the modification of the substrate causes an increase in the surface roughness (characterized by the Rq or Sq parameter), and the effect is the most noticeable in the case of argon plasma.
Coatings #1–#3 and #4–#6 were applied with the dip-coating technique with the withdrawal speed equal to 50 mm/min and 20 mm/min, respectively. The differences in the withdrawal speed result in various thicknesses of the obtained layers [62]. In the case of the silica coatings prepared by the acid-assisted TEOS hydrolysis, the withdrawal speed in the range of 20–80 mm/min is referred to as the critical withdrawal speed. The value of 50 mm/min allows to get homogeneous, transparent, and crack-free silica coatings of a minimum film thickness [63]. The approximate thickness of the coatings in the case of its deposition by the dip-coating technique is about 0.46 µm, while for the manual immersion or spreading, it is about 0.79 µm.
The scanning electron microscopy images of the multiwalled carbon nanotubes are shown in Figure 9. In Figure 9a, the pristine nanotubes with a diameter of about 20 nm are presented. In Figure 9b, the MWCNTs/PDMS composite is presented. An increase in the diameter of the nanotubes and characteristic shading can be observed as a result of the PDMS adsorption.
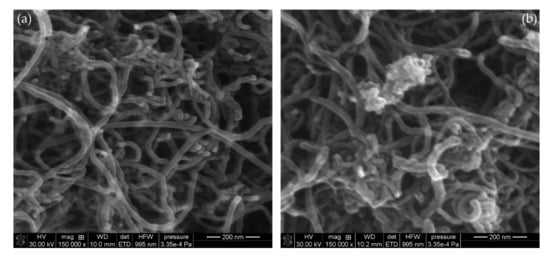
Figure 9.
SEM images of MWCNTs: nonmodified (a) and modified with PDMS (b).
The SEM-EDS elementary analysis results of the carbon nanotubes are shown in Table 4. The effectiveness of PDMS adsorption is evidenced by the decrease in the carbon content from 92.96% to 88.37% with the simultaneous increase in the contents of oxygen and silicon, which are the polymer constituents. The remaining elements such as Mo or Fe are probably impurities left over from the nanotube synthesis process or introduced during the analysis.
Table 4.
SEM-EDS elementary analysis of carbon nanotubes (MWCNTs): nonmodified and modified with PDMS.
The SEM images of samples #4 and #7 are shown in Figure 10. Both images show amorphous silica nanoparticles formed on the surface. More regular arrangement and larger sizes were obtained on surface #4 produced by the dip-coating method (Figure 10a). In the case of surface #7, which was coated manually, the nanoparticles are smaller, and the coverage of the support is heterogeneous. In both cases, the carbon nanotubes (filler particles) cannot be seen on the surface; this means that they are built into the bulk structure of the coating, which will be also confirmed by the XRD analysis (Figure 11).
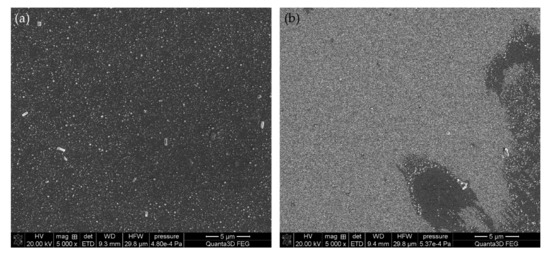
Figure 10.
SEM images of the sample #4 (a) and #7 (b).
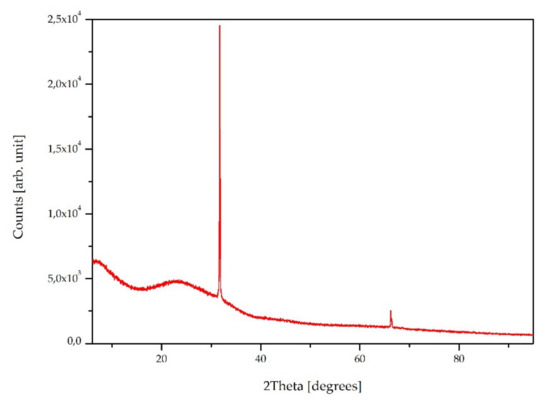
Figure 11.
XRD pattern of the sample #4.
The XRD pattern of sample #4 is presented in Figure 11. There can be observed as a much broadened peak over the 2θ range of 20–30°, which corresponds to the amorphous silica structures on the surface [64]. However, the peaks at 32° (100 plane) and 66° also indicate the presence of trigonal silica [65]. This means that during the coating fabrication by the TEOS hydrolysis under the applied conditions, two forms of silica are created. As it was mentioned above, the XRD analysis showed no nanotubes in the top layer of the coating. The XRD patterns for the MWCNTs should appear at around 26° (indexed as 002 reflection of the hexagonal graphite structure) and 43° (100 graphitic planes) [66,67], but there is a lack of them.
As it is presented in Figure 12, the optical properties of the samples investigations show the formation of largely transparent composite films in the case of the samples produced by the dip-coating technique. The transmittance values of samples #1–#6 remain at about 95%. This value is a few percent smaller than for silica (pure polysiloxane coatings) without any filler [42]. However, it should be emphasized that the coatings include carbon nanotubes, the suspension of which during the stability tests revealed no transmission. Moreover, the differences are not significant, and furthermore, the transmission values are greater than for the uncoated glass substrate [42]. For manually applied coatings, the transmission is equal to 70% and only 30% for samples #7 and #8, respectively. This is due to the greater thickness and structure of the coatings, which was confirmed by the above optical profilometry, and therefore more nanotubes concentration in the optical path. The effects observed in the wavelength range of 190–350 nm and at 580 nm [68] were described in detail in our previous paper [42].
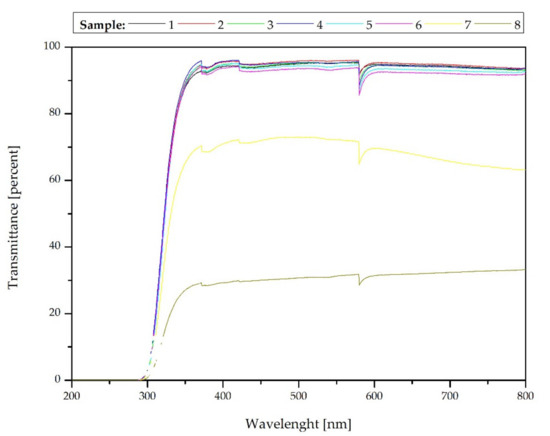
Figure 12.
Optical properties—transmittance of the samples.
4. Conclusions
The silica–MWCNTs/PDMS composite coatings on the glass supports modified with cold plasma were fabricated using the quick and simple sol–gel method. The surfaces with water contact angles larger than 90 degrees were obtained; therefore, they can be described as hydrophobic ones. The influence of the type of plasma on the surface properties of the deposited coating was found. The thin films are largely transparent and rough, and the composite is thermally stable up to 250 °C. The SEM images, thermal analysis, and XRD analysis showed that the silica–MWCNTs/PDMS filler is in the bulk phase of the material, not on the surface. Additional investigations are required in order to study the effect of withdrawal speed on the coating thickness and composition. The results will be reported in a due course.
Author Contributions
Conceptualization and methodology, M.C. and K.T.; nanotubes design and synthesis, I.Y.S.; coating synthesis and application, M.C.; investigation, M.C., I.Y.S., K.T., and D.S.; writing—original draft preparation, M.C.; writing—review and editing, M.C. and K.T.; supervision, K.T. All authors have read and agreed to the published version of the manuscript.
Funding
This research received no external funding.
Institutional Review Board Statement
Not applicable.
Informed Consent Statement
Not applicable.
Data Availability Statement
Data are available within the sources mentioned in the references as well as collected by the authors during the experiments and included in this paper (raw data can be available on request from the corresponding author).
Acknowledgments
Not applicable.
Conflicts of Interest
The authors declare no conflict of interest.
References
- Ciriminna, R.; Fidalgo, A.; Pandarus, V.; Béland, F.; Ilharco, L.; Pagliaro, M. The Sol-Gel Route to Advanced Silica-Based Materials and Recent Applications. Chem. Rev. 2013, 113, 6592–6620. [Google Scholar] [CrossRef] [PubMed]
- Almeida, R.M.; Gonçalves, M.C. Chapter 8.8: Sol-Gel Process and Products. In Encyclopedia of Glass Science, Technology, History, and Culture; Richet, P., Conradt, R., Takada, A., Dyon, J., Eds.; John Wiley & Sons: Hoboken, NJ, USA, 2021. [Google Scholar]
- Carrera-Figueiras, C.; Pérez-Padilla, Y.; Estrella-Gutiérrez, M.A.; Uc-Cayetano, E.G.; Juárez-Moreno, J.A.; Avila-Ortega, A. Surface Science Engineering through Sol-Gel Process. In Applied Surface Science; Injeti, G., Ed.; IntechOpen: London, UK, 2019. [Google Scholar]
- Soyaslan, İ.İ. Thermal and sound insulation properties of pumice/polyurethane composite material. Emerg. Mater. Res. 2020, 9, 859–867. [Google Scholar] [CrossRef]
- Salmi, L.D. Atomic Layer Deposition of Inorganic—Organic Hybrid Material Thin Films. Ph.D. Thesis, University of Helsinki, Helsinki, Finland, 2020. [Google Scholar]
- Ozkazanc, E.; Ozkazanc, H. Multifunctional polyaniline/chloroplatinic acid composite material: Characterization and potential applications. Polym. Eng. Sci. 2019, 59, 66–73. [Google Scholar] [CrossRef] [Green Version]
- Belardja, M.S.; Djelad, H.; Lafjah, M.; Lafjach, M.; Chouli, F.; Benyoucef, A. The influence of the addition of tungsten trioxide nanoparticle size on structure, thermal, and electroactivity properties of hybrid material–reinforced PANI. Colloid Polym. Sci. 2020, 298, 1455–1463. [Google Scholar] [CrossRef]
- Iijima, S. Helical microtubules of graphitic carbon. Nature 1991, 354, 56–58. [Google Scholar] [CrossRef]
- Salehi, S.; Maghmoomi, F.; Sahebian, S.; Zebarjad, S.; Lazzeri, A. A study on the effect of carbon nanotube surface modification on mechanical and thermal properties of CNT/HDPE nanocomposite. J. Thermoplast. Compos. Mater. 2021, 34, 203–220. [Google Scholar] [CrossRef]
- Shi, X.; Hassanzadeh-Aghdam, M.K.; Ansari, R. A comprehensive micromechanical analysis of the thermoelastic properties of polymer nanocomposites containing carbon nanotubes with fully random microstructures. Mech. Adv. Mater. Struct. 2021, 28, 331–342. [Google Scholar] [CrossRef]
- Gawęda, M.; Długoń, E.; Sowa, M.; Jeleń, P.; Marchewka, J.; Bik, M.; Mroczka, K.; Bezkosty, P.; Kusz, K.; Simka, W.; et al. Polysiloxane-Multiwalled Carbon Nanotube Layers on Steel Substrate: Microstructural, Structural and Electrochemical Studies. J. Electrochem. Soc. 2019, 166, D707–D717. [Google Scholar] [CrossRef]
- Guo, C.; Itoh, K.; Sun, D.; Kondo, Y.; Fuji, M. Carbon Nanotube/Polysiloxane Foams with Tunable Absorption Bands for Electromagnetic Wave Shielding. ACS Appl. Nano Mater. 2020, 3, 5944–5954. [Google Scholar] [CrossRef]
- Li, Y.; Li, Z.; Lei, L.; Lan, T.; Li, Y.; Li, P.; Lin, X.; Liu, R.; Huang, Z.; Fen, X.; et al. Chemical vapor deposition-grown carbon nanotubes/graphene hybrids for electrochemical energy storage and conversion. FlatChem 2019, 15, 100091. [Google Scholar] [CrossRef]
- Raval, J.P.; Joshi, P.; Chejara, D.R. Carbon nanotube for targeted drug delivery. In Applications of Nanocomposite Materials in Drug Delivery; Woodhead Publishing: Sawston, UK, 2018; pp. 203–216. [Google Scholar]
- Korri-Youssoufi, H.; Zribi, B.; Miodek, A.; Haghiri-Gosnet, A.M. Carbon-Based Nanomaterials for Electrochemical DNA Sensing. In Nanotechnology and Biosensors; Elsevier: Amsterdam, The Netherlands, 2018; pp. 113–150. [Google Scholar]
- Husen, A.; Siddiqi, K.S. Carbon and fullerene nanomaterials in plant system. J. Nanobiotechnol. 2014, 12, 16. [Google Scholar] [CrossRef] [PubMed] [Green Version]
- Basheer, B.V.; George, J.J.; Siengchin, S.; Parameswaranpillai, J. Polymer grafted carbon nanotubes—Synthesis, properties, and applications: A review. Nano-Struct. Nano-Objects 2020, 22, 100429. [Google Scholar]
- Sulym, I.; Zdarta, J.; Ciesielczyk, F.; Sternik, D.; Derylo-Marczewska, A.; Jesionowski, T. Pristine and Poly(Dimethylsiloxane) Modified Multi-Walled Carbon Nanotubes as Supports for Lipase Immobilization. Materials 2021, 14, 2874. [Google Scholar] [CrossRef] [PubMed]
- Afzal, M.; Ameeduzzafar; Alharbi, K.S.; Alruwaili, N.K.; Al-Abassi, F.A.; Al-Malki, A.A.L.; Kazmi, I.; Kumar, V.; Kamal, M.A.; Nadeem, M.S.; et al. Nanomedicine in treatment of breast cancer—A challenge to conventional therapy. Semin. Cancer Biol. 2021, 69, 279–292. [Google Scholar] [CrossRef]
- Xue, C.H.; Wu, Y.; Guo, X.J.; Liu, B.Y.; Wang, H.D.; Jia, S.T. Superhydrophobic, flame-retardant and conductive cotton fabrics via layer-by-layer assembly of carbon nanotubes for flexible sensing electronics. Cellulose 2020, 27, 3455–3468. [Google Scholar] [CrossRef]
- Ungvári, K.; Mészáros, S.; Szabó, A.; Hernádi, K.; Tóth, Z. In Vitro Biocompatibility Test of Multiwall Carbon Nanotubes with Human Osteoblast Cells: Potential Application for Bone Implant Interface Reinforcement. J. Nanosci. Nanotechnol. 2021, 21, 2394–2403. [Google Scholar] [CrossRef]
- Gaviria, W.A.; Hersam, M.C. Chirality-Enriched Carbon Nanotubes for Next-Generation Computing. Adv. Mater. 2020, 32, 1905654. [Google Scholar] [CrossRef]
- Ghalandari, M.; Maleki, A.; Haghighi, A.; Safdari Shadloo, M.; Alhuyi Nazari, M.; Tlili, I. Applications of nanofluids containing carbon nanotubes in solar energy systems: A review. J. Mol. Liq. 2020, 313, 113476. [Google Scholar] [CrossRef]
- Wu, S.; Tahri, O. State-of-art carbon and graphene family nanomaterials for asphalt modification. Road Mater. Pavement Des. 2021, 22, 735–756. [Google Scholar] [CrossRef]
- Shifa, M.; Tariq, F.; Chandio, A.D. Mechanical and electrical properties of hybrid honeycomb sandwich structure for spacecraft structural applications. J. Sandw. Struct. Mater. 2021, 23, 222–240. [Google Scholar] [CrossRef]
- Rangelova, N.; Radev, L.; Nenkova, S.; Miranda Salvado, I.M.; Vas Fernandes, M.; Herzog, M. Methylcellulose/SiO2 hybrids: Sol-gel preparation and characterization by XRD, FTIR and AFM. Open Chem. 2011, 9, 112–118. [Google Scholar] [CrossRef]
- Li, S.; Liu, M. Synthesis and conductivity of proton-electrolyte membranes based on hybrid inorganic–organic copolymers. Electrochim. Acta 2003, 48, 4271–4276. [Google Scholar] [CrossRef]
- Dul, S.; Ecco, L.G.; Pegoretti, A.; Fambri, L. Graphene/Carbon Nanotube Hybrid Nanocomposites: Effect of Compression Molding and Fused Filament Fabrication on Properties. Polymers 2020, 12, 101. [Google Scholar] [CrossRef] [PubMed] [Green Version]
- Pachekoski, W.M.; Amico, S.C.; Pezzin, S.H.; Moraes d’Almeida, J.R. Carbon nanotube hybrid polymer composites: Recent advances in mechanical characterization. In Hybrid Polymer Composite Materials: Properties and Characterisation; Thakur, V.K., Thakur, M.K., Pappu, A., Eds.; Woodhead Publishing: Sawston, UK, 2017; pp. 133–150. [Google Scholar]
- What Is Plasma Technology and What Are Its Applications? Available online: https://www.azonano.com/article.aspx?ArticleID=5280 (accessed on 30 August 2021).
- Goldston, R.; Rutherford, P. Introduction to Plasma Physics; Institute of Physics Publishing: Bristol, UK, 1995. [Google Scholar]
- Morozow, A.I. Introduction to Plasma Dynamics; CRC Press: Boca Raton, FL, USA, 2013. [Google Scholar]
- Cocktail Party Physics. Chilling Out with Cold Plasmas. Available online: https://blogs.scientificamerican.com/cocktail-party-physics/chilling-out-with-cold-plasmas/ (accessed on 30 August 2021).
- Misra, N.N.; Kaur, S.; Tiwari, B.K.; Kaur, A.; Singh, N.; Cullen, P.J. Atmospheric pressure cold plasma (ACP) treatment of wheat flour. Food Hydrocoll. 2015, 44, 115–121. [Google Scholar] [CrossRef]
- Park, G.Y.; Park, S.J.; Choi, M.Y.; Koo, I.G.; Byun, J.H.; Hong, J.W.; Sim, J.Y.; Lee, J.K.; Collins, G.J. Atmospheric-pressure plasma sources for biomedical applications. Plasma Sources Sci. Technol. 2012, 21, 043001. [Google Scholar] [CrossRef]
- Ananth, A.; Gandhi, M.S.; Mok, Y.S. A dielectric barrier discharge (DBD) plasma reactor: An efficient tool to prepare novel RuO2 nanorods. J. Phys. D Appl. Phys. 2013, 46, 155202. [Google Scholar] [CrossRef]
- Baklanov, M.R.; de Marneffe, J.F.; Shamiryan, D.; Urbanowicz, A.M.; Shi, H.; Rakhimova, T.V.; Huang, H.; Ho, P.S. Plasma processing of low-k dielectrics. J. Appl. Phys. 2013, 113, 041101. [Google Scholar] [CrossRef]
- Kartel, M.; Sementsov, Y.I.; Mahno, S.; Trachevskiy, V.; Bo, W. Polymer composites filled with multiwall carbon nanotubes. Univ. J. Mater. Sci. 2016, 4, 23–31. [Google Scholar] [CrossRef] [Green Version]
- Melezhyk, A.V.; Sementsov, Y.I.; Yanchenko, V.V. Synthesis of Fine Carbon Nanotubes on Coprecipitated Metal Oxide Catalysts. Russ. J. Appl. Chem. 2005, 78, 917–923. [Google Scholar] [CrossRef]
- Sulym, I.; Kubiak, A.; Jankowska, K.; Sternik, D.; Terpiłowski, K.; Sementsov, Y.; Borysenko, M.; Deryło-Marczewska, A.; Jesionowski, T. Superhydrophobic MWCNTs/PDMS-nanocomposite materials: Preparation and characterization. Physicochem. Probl. Miner. Process. 2019, 55, 1394–1400. [Google Scholar]
- Chodkowski, M.; Terpiłowski, K.; Goncharuk, O. Surface properties of the doped silica hydrophobic coatings deposited on plasma activated glass supports. Physicochem. Probl. Miner. Process. 2019, 55, 1450–1459. [Google Scholar]
- Chodkowski, M.; Terpiłowski, K.; Pasieczna-Patkowska, S. Fabrication of transparent polysiloxane coatings on a glass support via the sol-gel dip coating technique and the effect of their hydrophobization with hexamethyldisilazane. Physicochem. Probl. Miner. Process. 2020, 56, 76–88. [Google Scholar] [CrossRef]
- Smoluchowski, M. Handbuch der Electrizität und des Magnetismus, Band II; Barth-Verlag: Leipzig, Germany, 1921; pp. 366–427. [Google Scholar]
- Delgado, A.V.; González-Caballero, F.; Hunter, R.J.; Koopal, L.K.; Lyklema, J. Measurement and interpretation of electrokinetic phenomena. Pure Appl. Chem. 2005, 77, 1753–1805. [Google Scholar] [CrossRef] [Green Version]
- González, B.; Calvar, N.; Gómez, E.; Domínguez, Á. Density, dynamic viscosity, and derived properties of binary mixtures of methanol or ethanol with water, ethyl acetate, and methyl acetate at T = (293.15, 298.15, and 303.15) K. J. Chem. Thermodyn. 2007, 39, 1578–1588. [Google Scholar] [CrossRef]
- Refractive Index of Ethanol Solutions. Available online: http://www.refractometer.pl/refraction-datasheet-ethanol (accessed on 28 June 2021).
- Wyman, J. The dielectric constant of mixtures of ethyl alcohol and water from −5 to 40°. J. Am. Chem. Soc. 1931, 53, 3292–3301. [Google Scholar] [CrossRef]
- Terpiłowski, K.; Hołysz, L.; Chodkowski, M.; Clemente Guinarte, D. What Can You Learn about Apparent Surface Free Energy from the Hysteresis Approach? Colloids Interfaces 2021, 5, 4. [Google Scholar] [CrossRef]
- Matusiak, J.; Grządka, E. Stability of colloidal systems—A review of the stability measurements methods. Annales Universitatis Mariae Curie-Sklodowska Sectio AA-Chemia 2017, 72, 33–45. [Google Scholar] [CrossRef]
- Xu, P.; Wang, H.; Tong, R.; Du, Q.; Zhong, W. Preparation and morphology of SiO2/PMMA nanohybrids by microemulsion polymerization. Colloid Polym. Sci. 2006, 284, 755–762. [Google Scholar] [CrossRef]
- Camino, G.; Lomakin, S.M.; Lazzari, M. Polydimethylsiloxane thermal degradation Part 1. Kinetic aspects. Polymer 2001, 42, 2395–2402. [Google Scholar] [CrossRef]
- Sulym, I.; Klonos, P.; Borysenko, M.; Pissis, P.; Gun’ko, V.M. Dielectric and Thermal Studies of Segmental Dynamics in Silica/PDMS and Silica/Titania/PDMS Nanocomposites. J. Appl. Polym. Sci. 2014, 131, 1236–1246. [Google Scholar] [CrossRef]
- Bužarovska, A.; Stefov, V.; Najdoski, M.; Bogoeva-Gaceva, G. Thermal analysis of multi-walled carbon nanotubes material obtained by catalytic pyrolysis of polyethylene. Maced. J. Chem. Chem. Eng. 2015, 34, 373–379. [Google Scholar] [CrossRef] [Green Version]
- Chodkowski, M.; Terpiłowski, K. Significance of the receding contact angle in the determination of surface free energy. Annales Universitatis Mariae Curie-Sklodowska Sectio AA-Chemia 2018, 73, 61–80. [Google Scholar] [CrossRef]
- Bormashenko, E. Wetting of real solid surfaces: New glance on well-known problems. Colloid Polym. Sci. 2013, 291, 339–342. [Google Scholar] [CrossRef]
- Tadmor, R. Line energy and the relation between advancing, receding, and young contact angles. Langmuir 2004, 20, 7659–7664. [Google Scholar] [CrossRef]
- Cui, L.; Ranade, A.N.; Matos, M.A.; Dubois, G.; Dauskardt, R.H. Improved Adhesion of Dense Silica Coatings on Polymers by Atmospheric Plasma Pretreatment. ACS Appl. Mater. Interfaces 2013, 5, 8495–8504. [Google Scholar] [CrossRef]
- Soma Raju, K.R.C.; Sowntharya, L.; Lavanya, S.; Subasri, R. Effect of plasma pretreatment on adhesion and mechanical properties of sol-gel nanocomposite coatings on polycarbonate. Compos. Interfaces 2012, 19, 259–270. [Google Scholar] [CrossRef]
- Webb, H.K.; Truong, V.K.; Hasan, J.; Fluke, C.; Crawford, R.J.; Ivanova, E.P. Roughness Parameters for Standard Description of Surface Nanoarchitecture. Scanning 2012, 34, 257–263. [Google Scholar] [CrossRef] [Green Version]
- Raghavendra, C.R.; Basavarajappa, S.; Sogalad, I.; Saunshi, V.K.K. Study on surface roughness parameters of nano composite coatings prepared by electrodeposition process. Mater. Today Proc. 2021, 38, 3110–3115. [Google Scholar] [CrossRef]
- He, B.; Ding, S.; Shi, Z. A comparison between profile and areal surface roughness parameters. Metrol. Meas. Syst. 2021, 28, 413–438. [Google Scholar]
- Faustini, M.; Louis, B.; Albouy, P.A.; Kuemmel, M.; Grosso, D. Preparation of Sol−Gel Films by Dip-Coating in Extreme Conditions. J. Phys. Chem. C 2010, 114, 7637–7645. [Google Scholar] [CrossRef]
- Figus, C.; Patrini, M.; Floris, F.; Fornasari, L.; Pellacani, P.; Marchesini, G.; Valsesia, A.; Artizzu, F.; Marongiu, D.; Saba, M.; et al. Synergic combination of the sol–gel method with dip coating for plasmonic devices. Beilstein J. Nanotechnol. 2015, 6, 500–507. [Google Scholar] [CrossRef] [Green Version]
- Zhou, Z.H.; Xue, J.M.; Wang, J.; Chan, H.S.O.; Yu, T.; Shen, Z.X. NiFe2O4 nanoparticles formed in situ in silica matrix by mechanical activation. J. Appl. Phys. 2002, 91, 6015–6020. [Google Scholar] [CrossRef] [Green Version]
- Martínez, J.R.; Palomares-Sánchez, S.; Ortega-Zarzosa, G.; Ruiz, F.; Chumakov, Y. Rietveld refinement of amorphous SiO2 prepared via sol–gel method. Mater. Lett. 2006, 60, 3526–3529. [Google Scholar] [CrossRef]
- He, X.; Xu, X.; Bo, G.; Yan, Y. Studies on the effects of different multiwalled carbon nanotube functionalization techniques on the properties of bio-based hybrid non-isocyanate polyurethane. RSC Adv. 2020, 10, 2180–2190. [Google Scholar] [CrossRef] [Green Version]
- Nie, P.; Min, C.; Song, H.J.; Chen, X.; Zhang, Z.; Zhao, K. Preparation and Tribological Properties of Polyimide/Carboxyl-Functionalized Multi-walled Carbon Nanotube Nanocomposite Films Under Seawater Lubrication. Tribol. Lett. 2015, 58, 7. [Google Scholar] [CrossRef]
- Carter, S.F.; France, P.W. Drawing induced absorption loss in multicomponent glass fibres. J. Non-Cryst. Solids 1983, 58, 47–55. [Google Scholar] [CrossRef]
Publisher’s Note: MDPI stays neutral with regard to jurisdictional claims in published maps and institutional affiliations. |
© 2021 by the authors. Licensee MDPI, Basel, Switzerland. This article is an open access article distributed under the terms and conditions of the Creative Commons Attribution (CC BY) license (https://creativecommons.org/licenses/by/4.0/).