Article

Experimental Testing of Passive Linear TMD for Postural Tremor Attenuation

1
Department of Mechanical Engineering, The International University of Beirut BIU, Beirut 146404, Lebanon
2
Lab Navier, Univ Gustave Eiffel, ENPC, CNRS, F-77447 Marne-la-Vallée, France
3
Department of Mechanical Engineering, Lebanese International University LIU, Bekaa 1803, Lebanon
4
Faculté de Médecine, Institut du Cerveau et de la Moëlle Epinière, Sorbonne Université, UMR S 1127, Inserm U 1127, UMR CNRS 7225, F-75013 Paris, France
5
Département de Neurologie, Hôpital Pitié-Salpêtrière, AP-HP, F-75013 Paris, France
*
Author to whom correspondence should be addressed.
Appl. Sci. 2021, 11(21), 9809; https://doi.org/10.3390/app11219809
Submission received: 28 August 2021 / Revised: 7 October 2021 / Accepted: 12 October 2021 / Published: 20 October 2021

Abstract

:
Research interest to provide a mechanical solution for involuntary tremors is increasing due to the severe side effects caused by the medications used to lessen its symptoms. This paper deals with the design of a cantilever-type tuned mass damper (TMD) used to prove the effectiveness of passive controllers in reducing the involuntary tremor’s vibrational signals transmitted by the muscles to the hand segment. TMD is tested on an experimental arm, reflecting the flexion-extension motion of the wrist, excited by a mechanical shaker with the measured tremor signal of a patient with essential tremor. The designed TMD provides a new operational frequency for each position of the screw fixed to its beam. Modal damping ratios are also calculated using different methods for each position. The effectiveness of the TMD is quantified by measurements using a vibrometer and inertial measurement unit. Three TMDs, representing 15.7% total mass ratio, cause a reduction of 29% for the acceleration, 69% for the velocity, 79% for the displacement, 67% for the angular velocity, and 82% for the angular displacement signals. These encouraging results will allow the improvement of the design of the passive controller in the form of a wearable bracelet suitable for daily life.

Graphical Abstract

1. Introduction

Essential tremor (ET) is one of the most common tremor diseases [1]. The muscles of the patient with ET operate in the frequency range of 4–12 Hz [2]. ET is characterized by postural and kinetic tremors, mostly affecting the hands [3]. Postural tremor (PT) is presented during a voluntary movement to maintain a body part at a position against gravity, whereas kinetic tremor occurs during a voluntary movement towards a target. Propranolol and primidone are the most effective pharmacological treatments for ET; however, a large number of patients do not respond to either of these treatments [2], leaving severe side effects on the patient’s quality of life [3].
Recent studies have been conducted to provide a non-invasive, wearable mechanical device to attenuate the tremor [4,5]. Stone et al. [6] modeled the forearm as a 305 mm × 25 mm × 25 mm aluminum beam attached to the hand. The test bench is fabricated as one segment pinned at the elbow joint and is attached rigidly to the hand at a position reflecting the wrist joint. The system is excited by an electro-dynamic shaker using ET signals in the horizontal direction to reflect the flexion-extension motion. A 120 g proportional–integral–derivative (PID) controller was able to provide a 20–60% reduction in the linear displacement amplitude of the segment at the position of the wrist, within the 6–13 Hz bandwidth. Teixeira et al. [7] modeled the forearm as a 1088 g rectangular beam made up of wood and excited using a shaker by a signal of Parkinson’s disease (PD) in the vertical direction. A TMD with variable weight was adapted to reach the tuning frequency by controlling the level of water entering or leaving the piezoelectric micro-pumps. A 200–400 g TMD operating between 4.5–6 Hz is placed near the free end of the beam. It causes a 57% reduction in the amplitude of acceleration at the resonance frequency of 5.32 Hz. Buki et al. [8] manufactured a forearm as an inertial rod attached rigidly to the hand and excited by a direct-current (DC) motor at the wrist joint to apply a pronation-supination motion. The system is operating at the resonance frequency in a range of 4.40–5.78 Hz, measured for patients with PD using an inertial measurement unit (IMU). A 280 g passive bracelet is tuned to the resonance frequency to reduce the simulated tremor. The passive device reduced to 86% of the angular displacement amplitude at 4.75 Hz, measured using the IMU at the wrist. Rudraraju and Nguyen [9] fabricated an experimental setup with a 1690 g mannequin hand excited by a sinusoidal signal of 50 mm amplitude and a frequency of 4.5 Hz, representing the measured tremor behavior of a patient with PD. Two TMDs designs as a 109 mm × 72 mm × 9 mm metallic rectangular box each, of 530 g total mass, are placed symmetrically on the top and the bottom of the hand, at the wrist joint, to reduce the motion in the horizontal direction. These TMDs were tested on a real patient by tracing the pre-drawn line on a whiteboard. This resulted in a 70–80% reduction in the tremor amplitude, which validates the numerical study. Phan Van and Ngo [10] designed a prototype of a wearable small and comfortable gyroscope-based mechanism device with low power consumption, weighing 268 g and of 105 mm × 84 mm × 50 mm physical size. It is prepared to reduce uniaxial hand tremors in the range of 1.41 ± 2.58˚ and with a frequency between 4–6 Hz of PD. Its effectiveness is validated by a simulation using Matlab; it results in a 92.6% reduction in the amplitude. However, the high-quality testing equipment used was not enough to produce exact tremor data of PD. Masoumi et al. [11] used two seesaw-like actuators with magnetic discs of 120 g mass to reduce a tremor simulated by a wearable tremor simulator device composed of 32 g eccentric mass and a DC motor. The effectiveness of the device was estimated by visualizing the water level in a beaker held by the participant. The tremor assistance device was able to mitigate the fluctuation in the water level.
In this paper, an experimental arm is fabricated in the form of a rectangular beam to reflect the flexion-extension motion of the hand in the horizontal direction. The system is excited by a mechanical shaker, using Electromyography (EMG) signals, measured for the extensor carpi radialis (ECR) muscle involved in the generation of tremors [12,13]. TMDs designed in the form of thin cantilever beams with concentrated masses are used to test the ability of passive absorbers to reduce the amplitude of the system due to the excitation signal measured for a real patient. The mass of the TMDs respects the efficient mass range of 5–25% of the total mass of the system of interest [14]. Similar to most research work related to orthoses, the efficiency of the tremor controller is analyzed depending on the reduction in the power spectral density (PSD) of the measured signals [4].
The TMD is designed to reduce the amplitude of the system at 6.64 Hz, which represents the critical peak frequency of the measured tremor signal of the patient. The operating frequency of a TMD, having a 5.7% mass ratio, changes within a bandwidth of 5.52–7.57 Hz as the position of its proof mass changes. The corresponding mean value of modal damping ratio, for the used stainless steel beam material of the TMD, is estimated to be 0.33% using the half-power bandwidth method and 0.21% using the continuous wavelets method. The optimal modal damping ratio calculated numerically for a similar TMD is 0.99%. The best positions for the proof mass of the one TMD system, determined through experimental measurements, were those corresponding to an operational frequency between 6.44–6.66 Hz representing a 2 mm wide displacement range. Three similar TMDs, with a mass ratio of 15.7%, are attached to the experimental arm to provide a 69% reduction in the amplitude of the velocity signal measured using a vibrometer. Measurements using an IMU show that the reduction in the acceleration, displacement, angular velocity, and angular displacement signals, is 29%, 79%, 67%, and 82%, respectively.
The rest of the paper is organized as follows. Section 2 describes the experimental setup used to simulate the measured tremor of the patient and the fabricated TMD used as a passive controller and gives information about the sensors used to provide the processed signals. Section 3 provides the results of the measurements for the behavior of the TMD and its effect in reducing the amplitude of the system. Section 4 includes a discussion of the results in addition to a comparison with the literature. Section 5 provides the conclusions and perspectives.

2. Materials and Methods

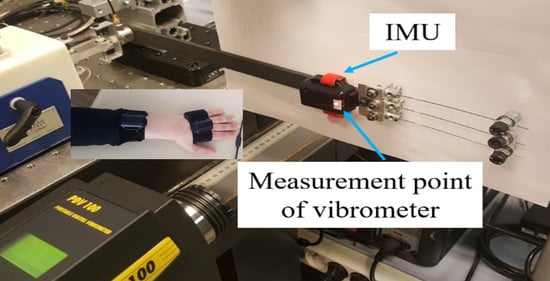
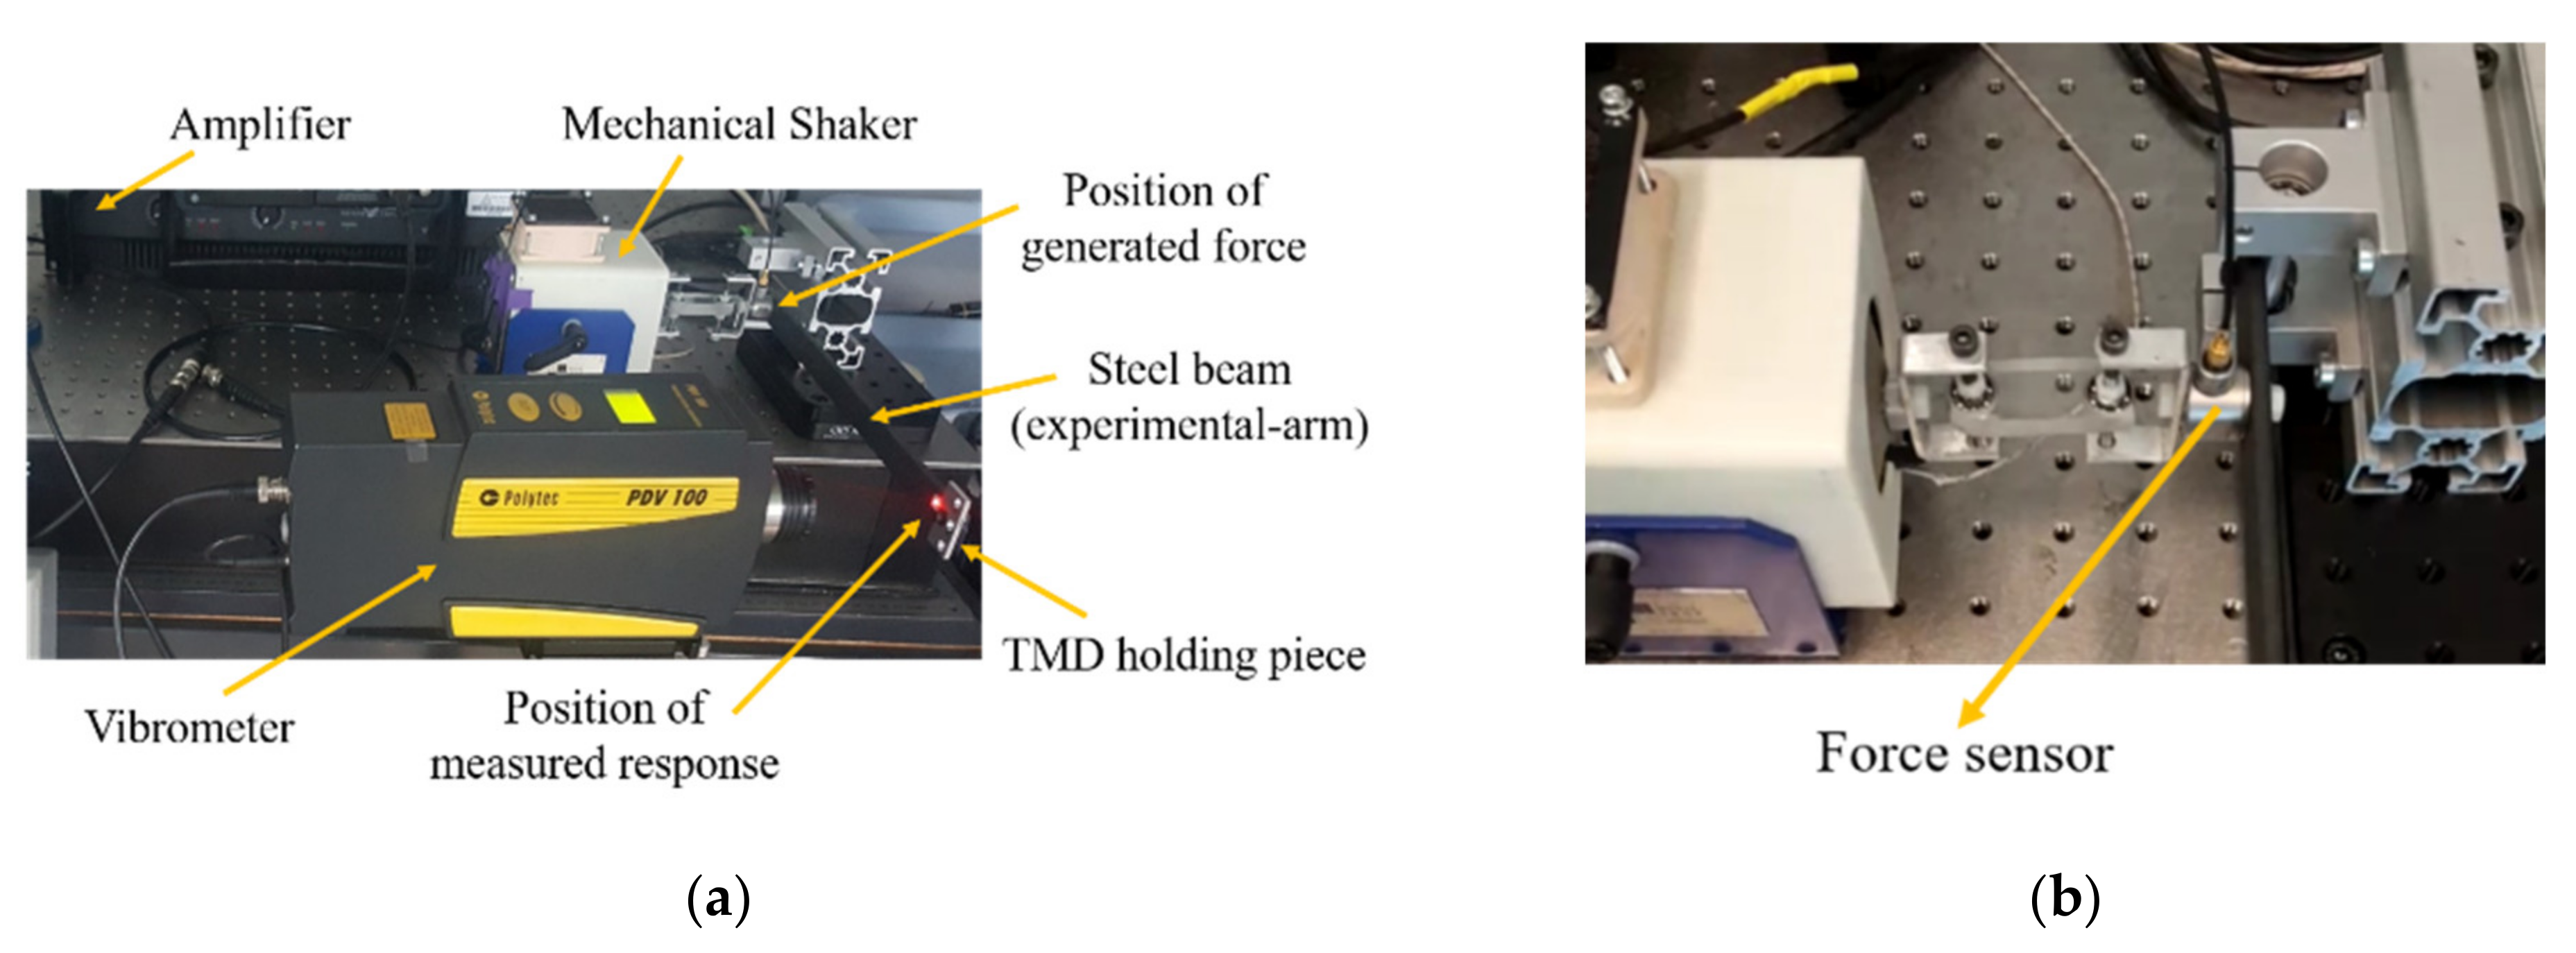
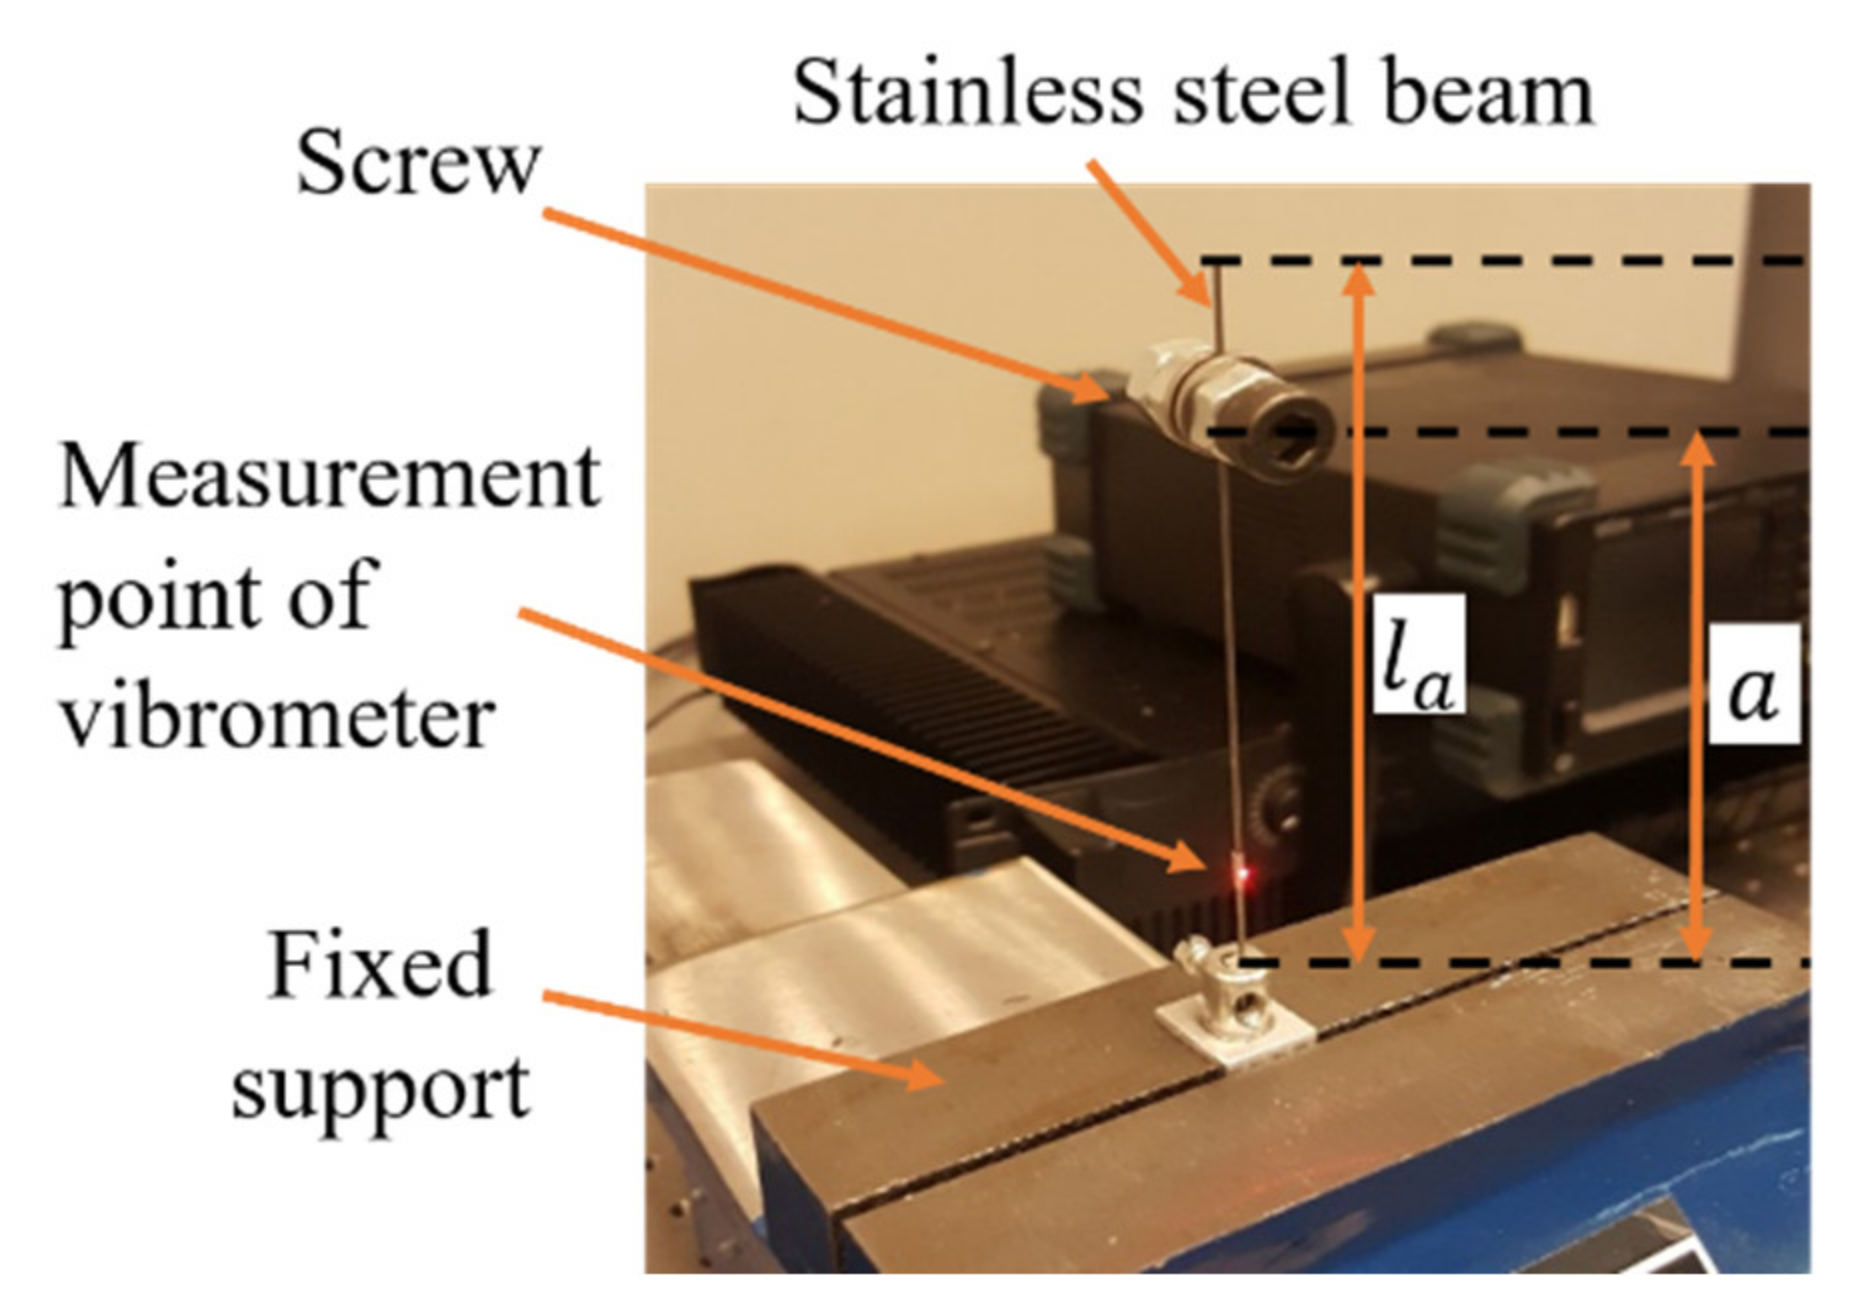
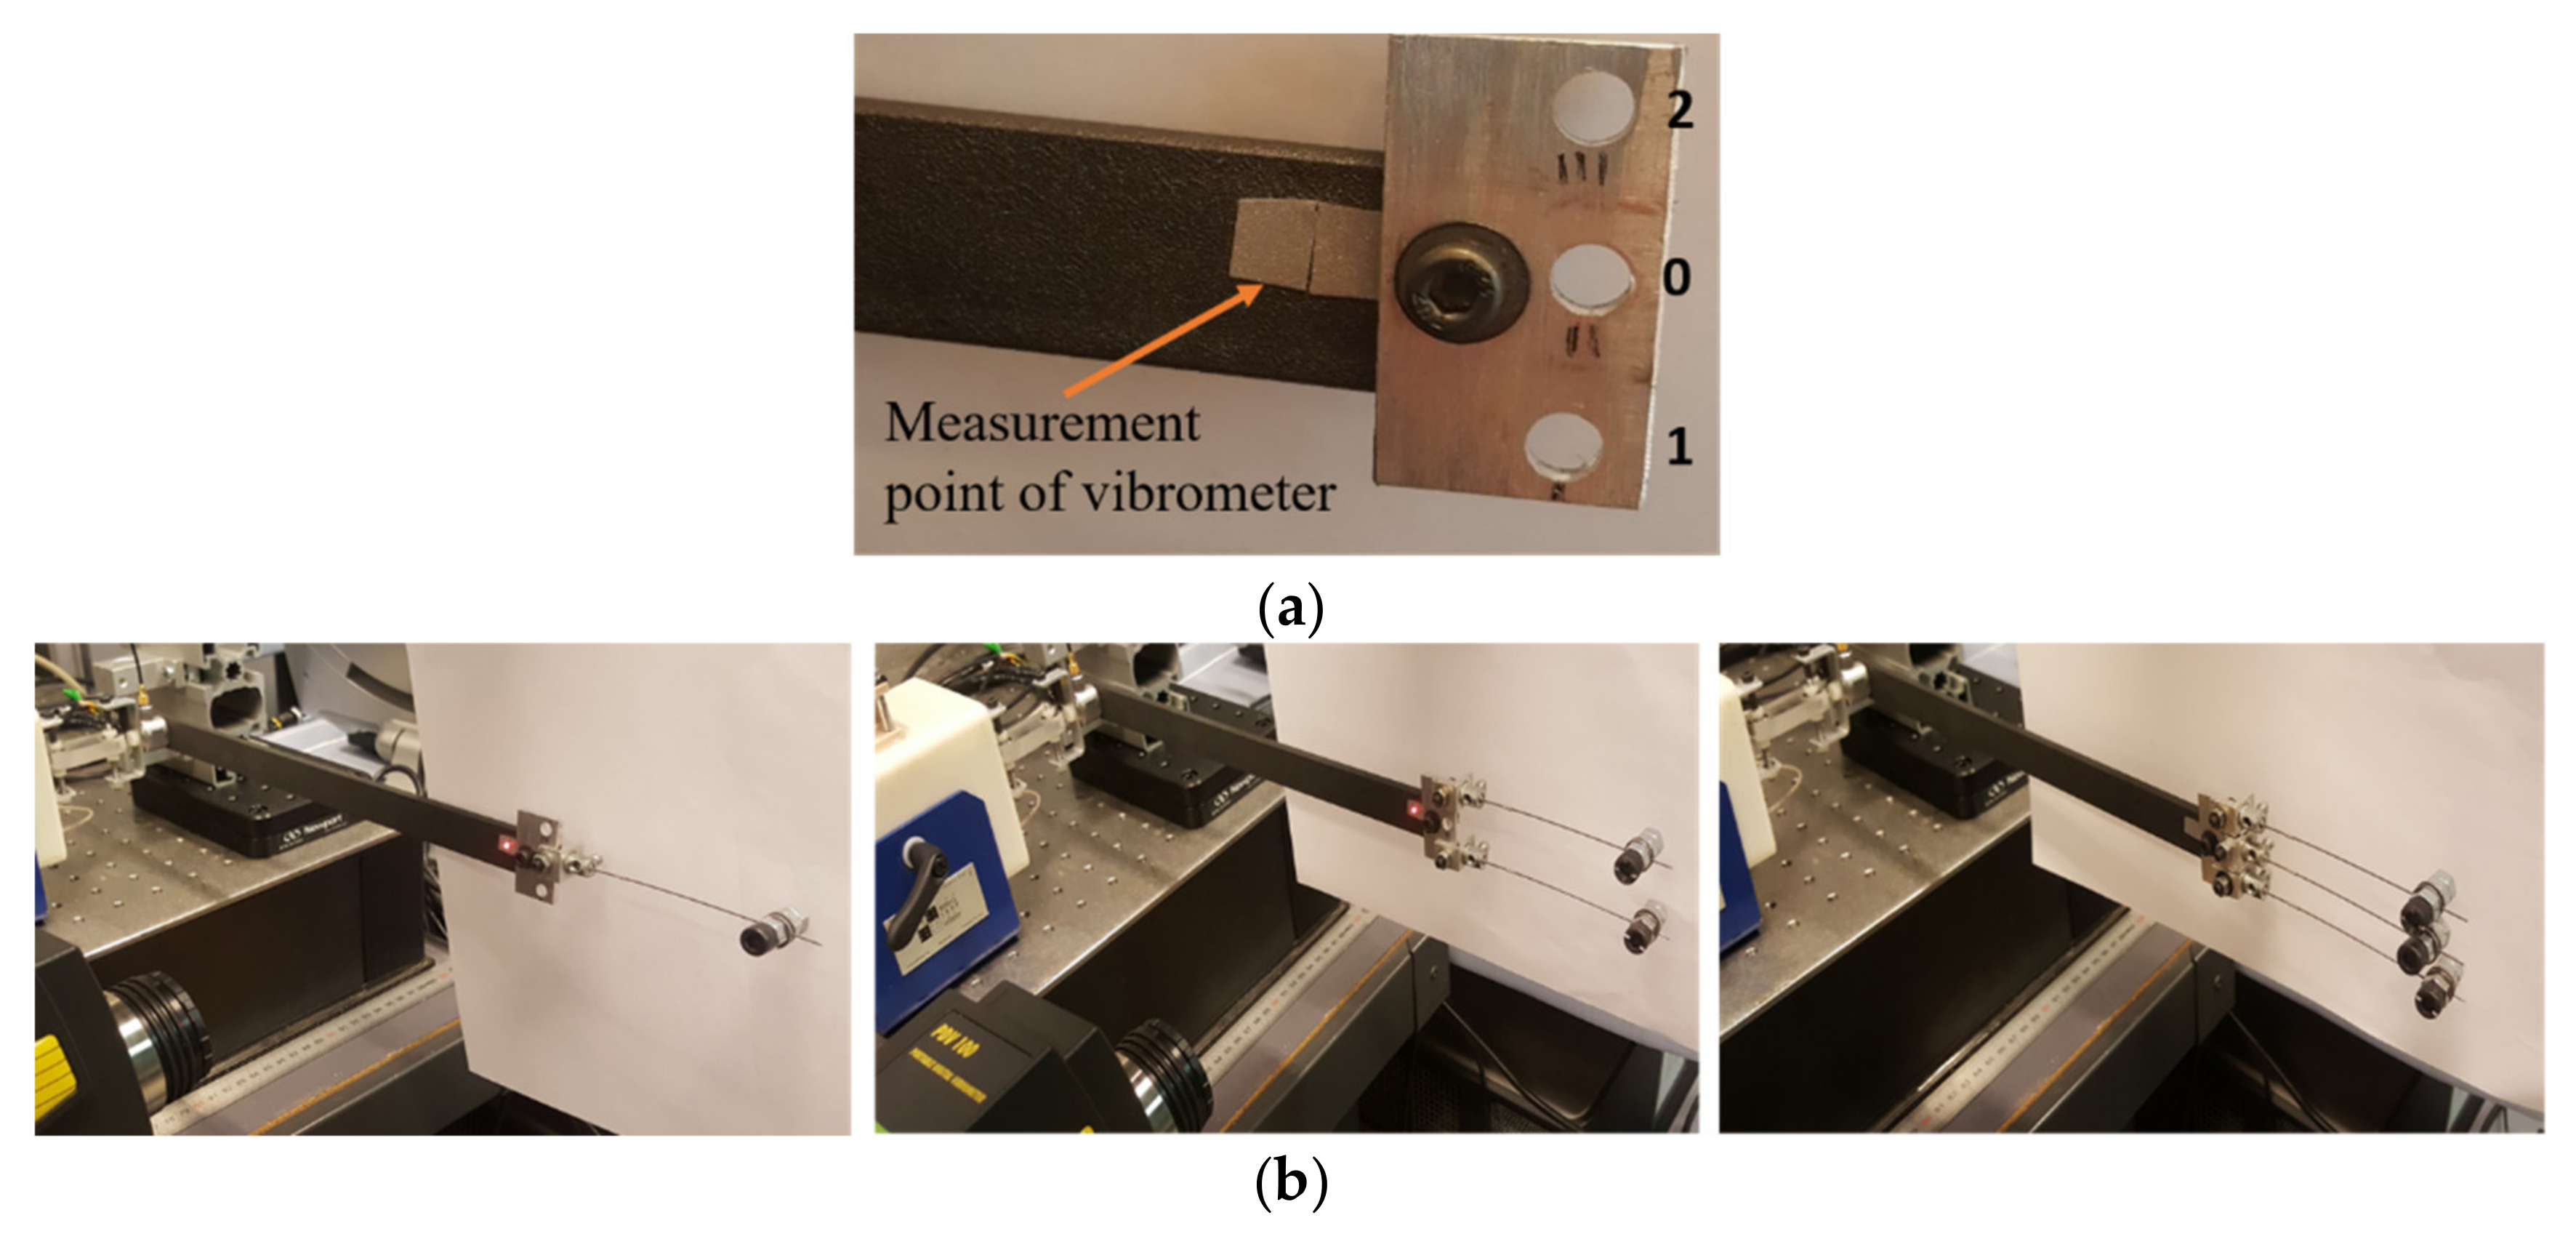
2.1. Experimental Arm

A 77-year-old patient, suffering from ET, participated in this work. The patient performed a postural clinical task to study the PT of the hand. Measurements of the ECR tremor signals were conducted by the department of neurology at Pitié-Salpêtrière Hospital (Paris), following appropriate informed consent. An experimental arm, excited by tremor signals measured for the patient, is used to study the ability of a passive TMD in reducing the amplitude of its response. This work aims to design a prototype to be modeled as a wearable anti-vibration bracelet if the passive absorbers reveal their effectiveness.
The experimental arm, shown in Figure 1a, is fabricated as a steel beam of dimensions 330.0 mm × 18.0 mm × 50.0 mm and mass of 242.30 g. The experimental arm is modeled as a rigid link, representing a hand segment situated in a postural position with a flexion-extension angular motion at the wrist joint. A mechanical shaker is used to excite the experimental arm by a measured signal for the ECR muscle of the patient. The connection of the mechanical shaker to the experimental arm is made in the way shown in Figure 1b. This connection is made to avoid the introduction of stiffness, between the shaker and the steel beam, which may induce a resonance frequency in the range of interest of this study. A force sensor is placed between the experimental arm and the vibrometer, as shown in Figure 1b, to provide the applied excitation signal.
The raw ECR signal (Figure 2a) is implemented on the LabVIEW interface and amplified to obtain the same range as the patient for the response signal. The excitation force is applied to the experimental arm at a distance of 48.0 mm from the clamped end (Figure 1a). A rectangular piece is attached to the end of the experimental arm and used to hold the TMD(s). A vibrometer (PDV-100 from Polytec) is used to measure the response of the experimental arm, before and after the addition of the TMDs. The measurement full-scale range of the vibrometer is 500 mm/s with a corresponding resolution of <0.1 μ m / s / ( H z ) . The measurement point of the vibrometer is at a distance of 20.0 mm from the free end of the experimental arm. All measurements are performed for 60 s. A LabVIEW program is also used for data acquisition with a sampling rate of 1707 Hz. The measured signal is downsampled to obtain a sampling frequency of 50.00 Hz, which is higher than twice the frequencies of biological tremors [15]. Responses in the frequency domain are analyzed in terms of the PSD, obtained in this study using Welch’s method with a Hamming window of 256 points and 80% overlap.
A comparison between the PSD of the input and output signals of the mechanical shaker, corresponding to the measured ECR signal of the patient, is shown in Figure 2b. The plots of PSD are normalized to the amplitude of the first peak. The ECR muscle of the patient operates at two frequencies, 6.64 Hz and 13.28 Hz. Figure 2b shows that the input and output signals of the mechanical shaker fit well, especially at the first critical frequency (the frequency of concern in this study).

2.2. Passive Tuned Mass Damper
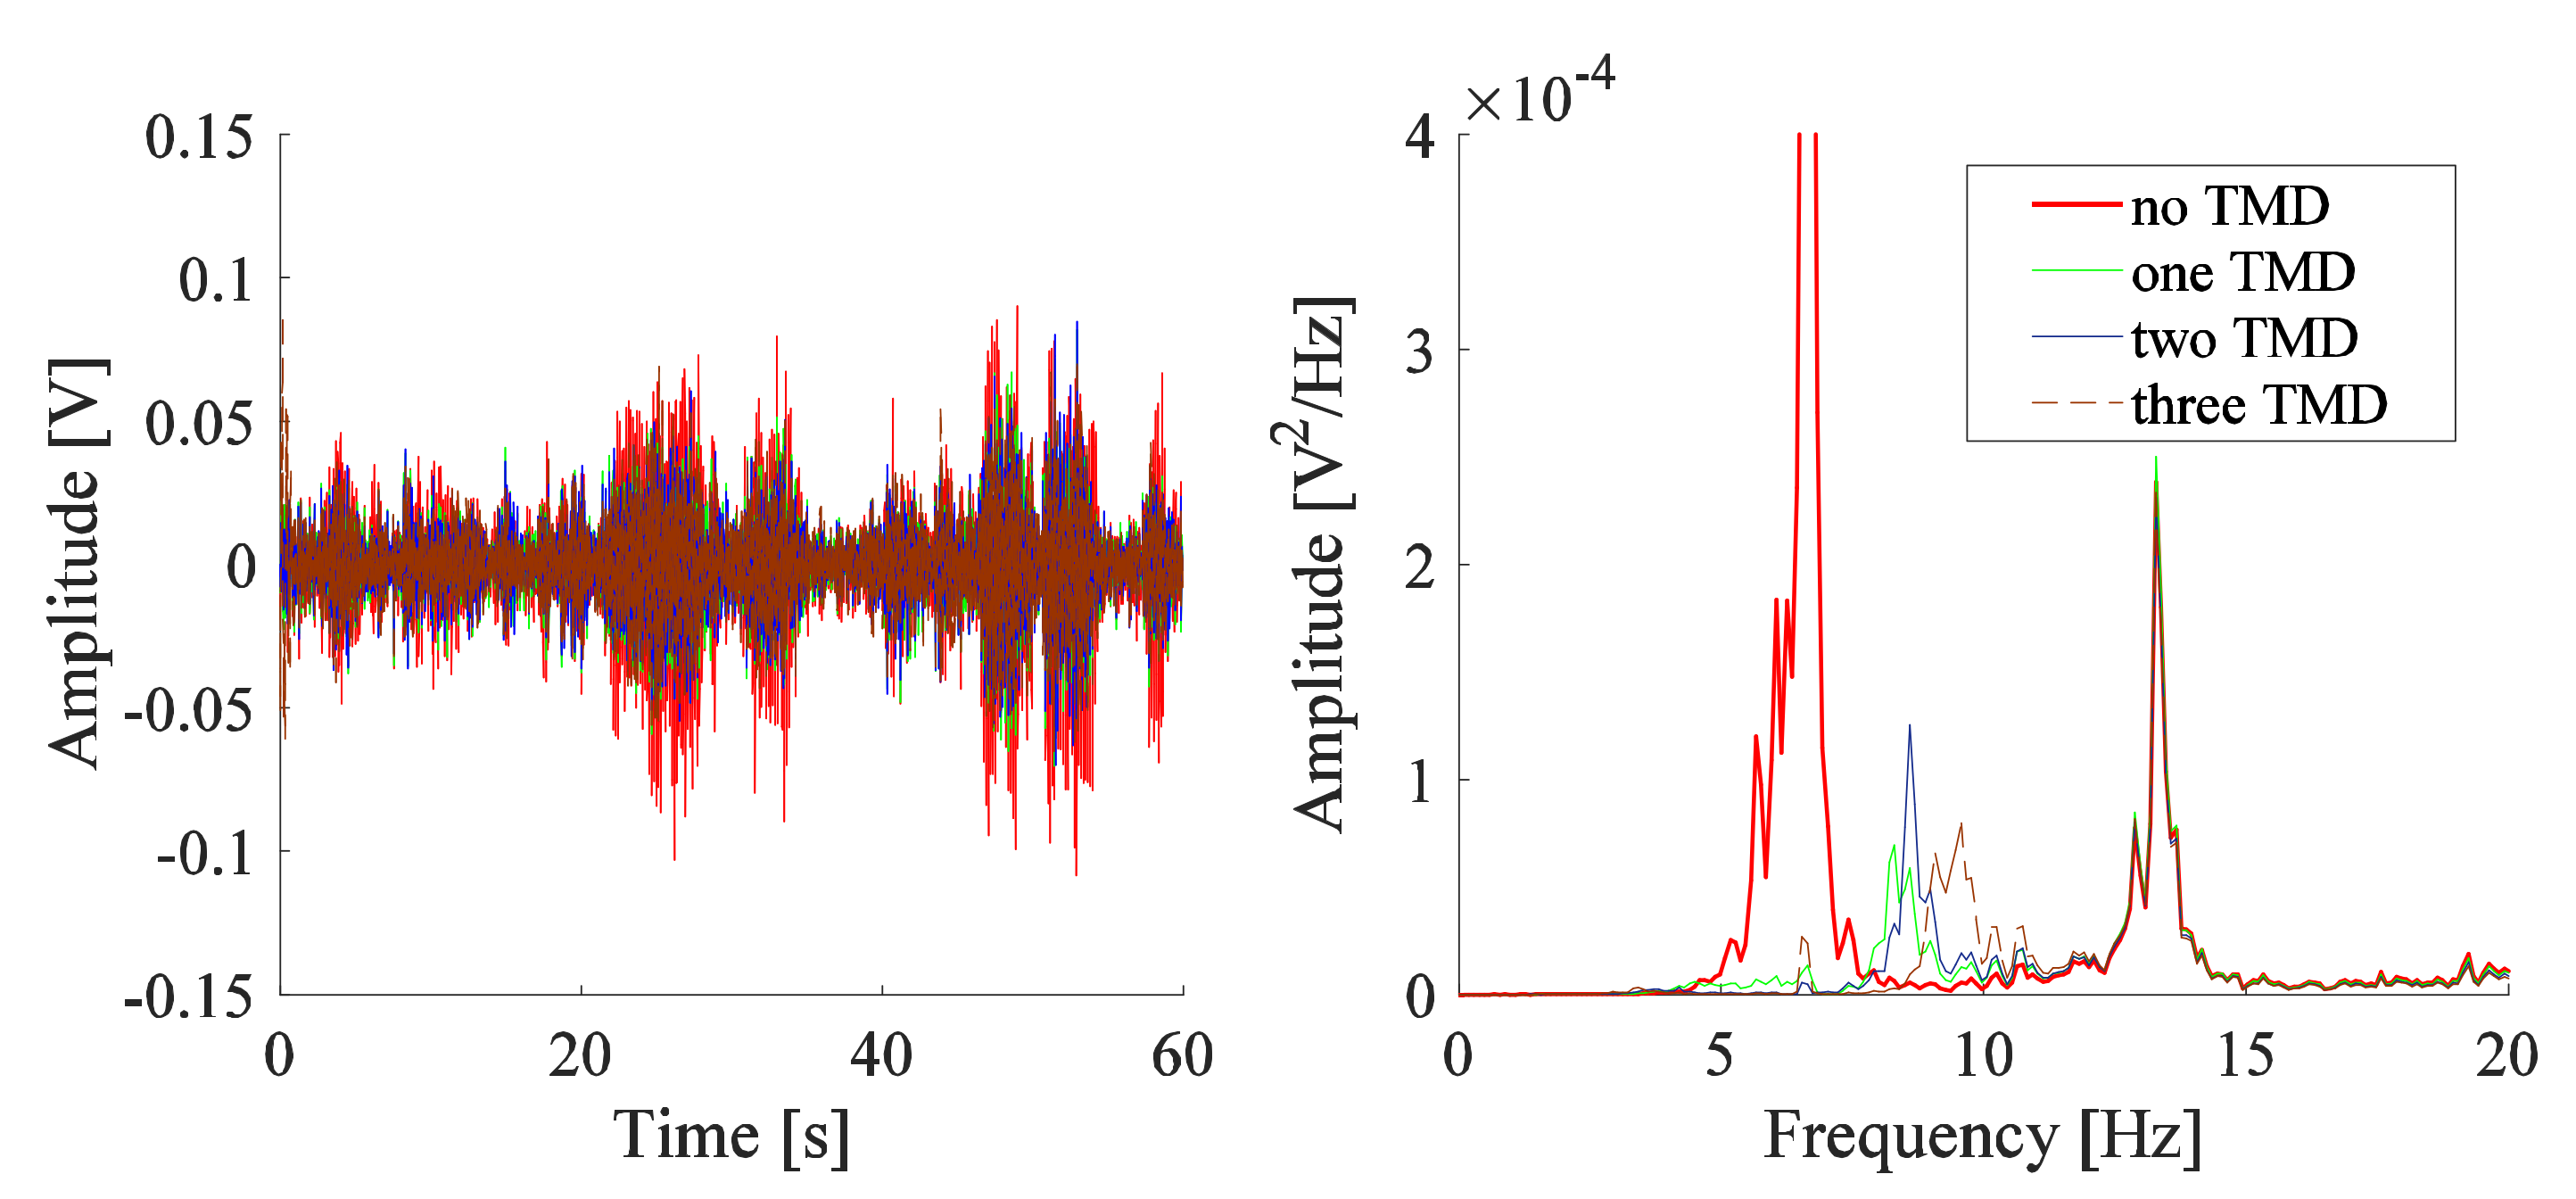
In the current work, an experiment is conducted to study the ability of passive TMD in reducing the amplitude of complex types of signals, the PT signal, which can be modeled as a second-order non-linear Stochastic oscillator [16], Gaussian noise signal [17], etc. The passive TMD having mass, stiffness, and damper as the effective elements, is fabricated in the form of a Cantilever-type TMD, as the design suggested by Gebai et al. [18]. However, in the current design, the beam has a circular cross-section as shown in Figure 3. The TMD is designed to operate within the frequency range of PT. The proof mass ( m a ) of the TMD is represented as a screw attached along a beam of length l a . This TMD can provide different operating frequencies depending on the position ( a ) of the screw.
The measurement point of the vibrometer, on the beam of the TMD, is located at a distance of 15.0 mm from its clamped end. The used measurement full-scale range is 20 mm/s with a corresponding resolution of <0.02 μ m / s / ( H z ) . The measured signals are downsampled to obtain a sampling frequency of 170 Hz, which is greater than twice the fundamental frequency of the cantilever beam alone, obtained as 67.30 Hz. Measurements using the vibrometer also allow the identification of the modal damping ratio of the TMD, which is estimated in this study using the half-power bandwidth method [19], and is also calculated to obtain reliable values using the continuous wavelet method [20]. A comparison is performed between both methods to test the accuracy level of the half-power bandwidth method. The mean value ± standard deviation (SD) is calculated for data obtained using each method, in addition to the root mean square (RMS) error between both. Measured signals are carried out for different positions of the screw along the beam. The position of the center of gravity of the screw, from the clamped end of the beam, is calculated and represented by the position a . The measured frequency ( f a m e a s ) and the modal damping ratio estimated using the half-power bandwidth method are obtained using the fast Fourier transform (FFT) of the measured velocity signal for each position a , whereas the modal damping ratio calculated using the continuous wavelets method is obtained using the velocity signal of the measurements.
Three TMDs are manufactured to have approximately the same size and mass. These TMDs are placed at the free end of the experimental arm, on the TMD holder (Figure 4a), according to the following arrangement: a single TMD is placed in position ‘0’, two TMDs in positions ‘1’ and ‘2’, and three TMDs in positions ‘0’, ‘1’, and ‘2’, as shown in Figure 4b. The beam of the TMDs has a diameter of 0.79 mm. A 13.80 g screw is attached to a 91.0 mm long beam at position ‘0’, a 13.69 g screw to a 91.0 mm long beam at position ‘1’, and a 13.74 g screw to a 92.5 mm long beam at position ‘2’. For one, two, and three TMDs, the mass ratio is equal to 5.7%, 11.4%, and 17.0%, respectively, which represents the ratio of the total mass of the TMD(s) relative to the mass of the experimental arm. The position a of the screw for each TMD is adjusted using the vibrometer, to approach the desired frequency, before it is fixed to the experimental arm.
IMU of Hikob Fox type is added to the experimental arm to obtain the acceleration and angular velocity signals. IMU is added at the position of the measurement point of the vibrometer. The measurements of the full-scale ranges of the accelerometer and gyrometer are ±2 g and ±500°/s with a corresponding resolution of 12 mg and 17.5 m°/s, respectively. Measurements using IMU are recorded for 60 s, with a sampling frequency of 1344 Hz for the acceleration and 800 Hz for the angular velocity, which are downsampled by a ratio of 1:30 and 1:16, respectively. The acceleration signal is integrated twice to obtain the displacement signal. The angular velocity signal is integrated once to obtain the angular displacement signal.

3. Results

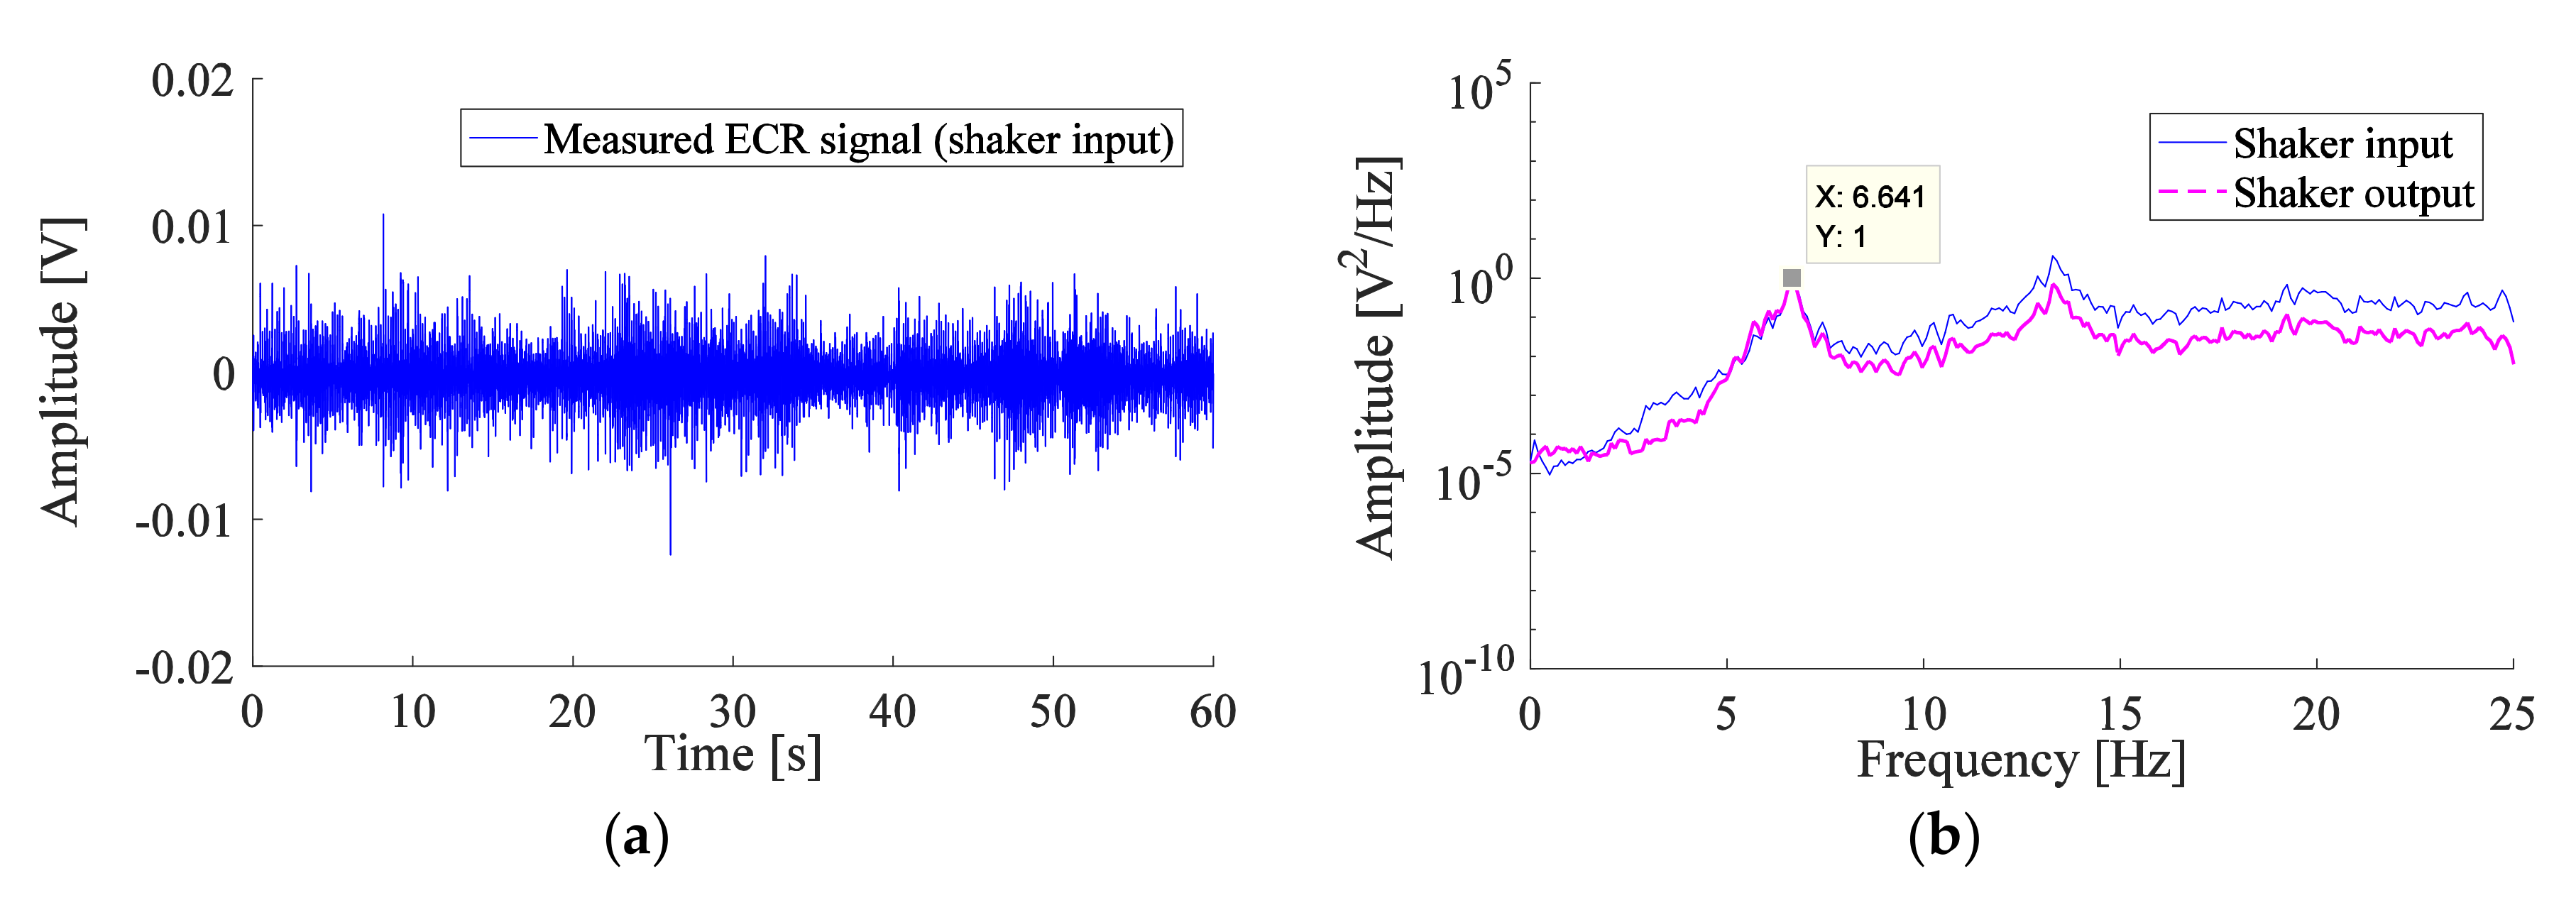
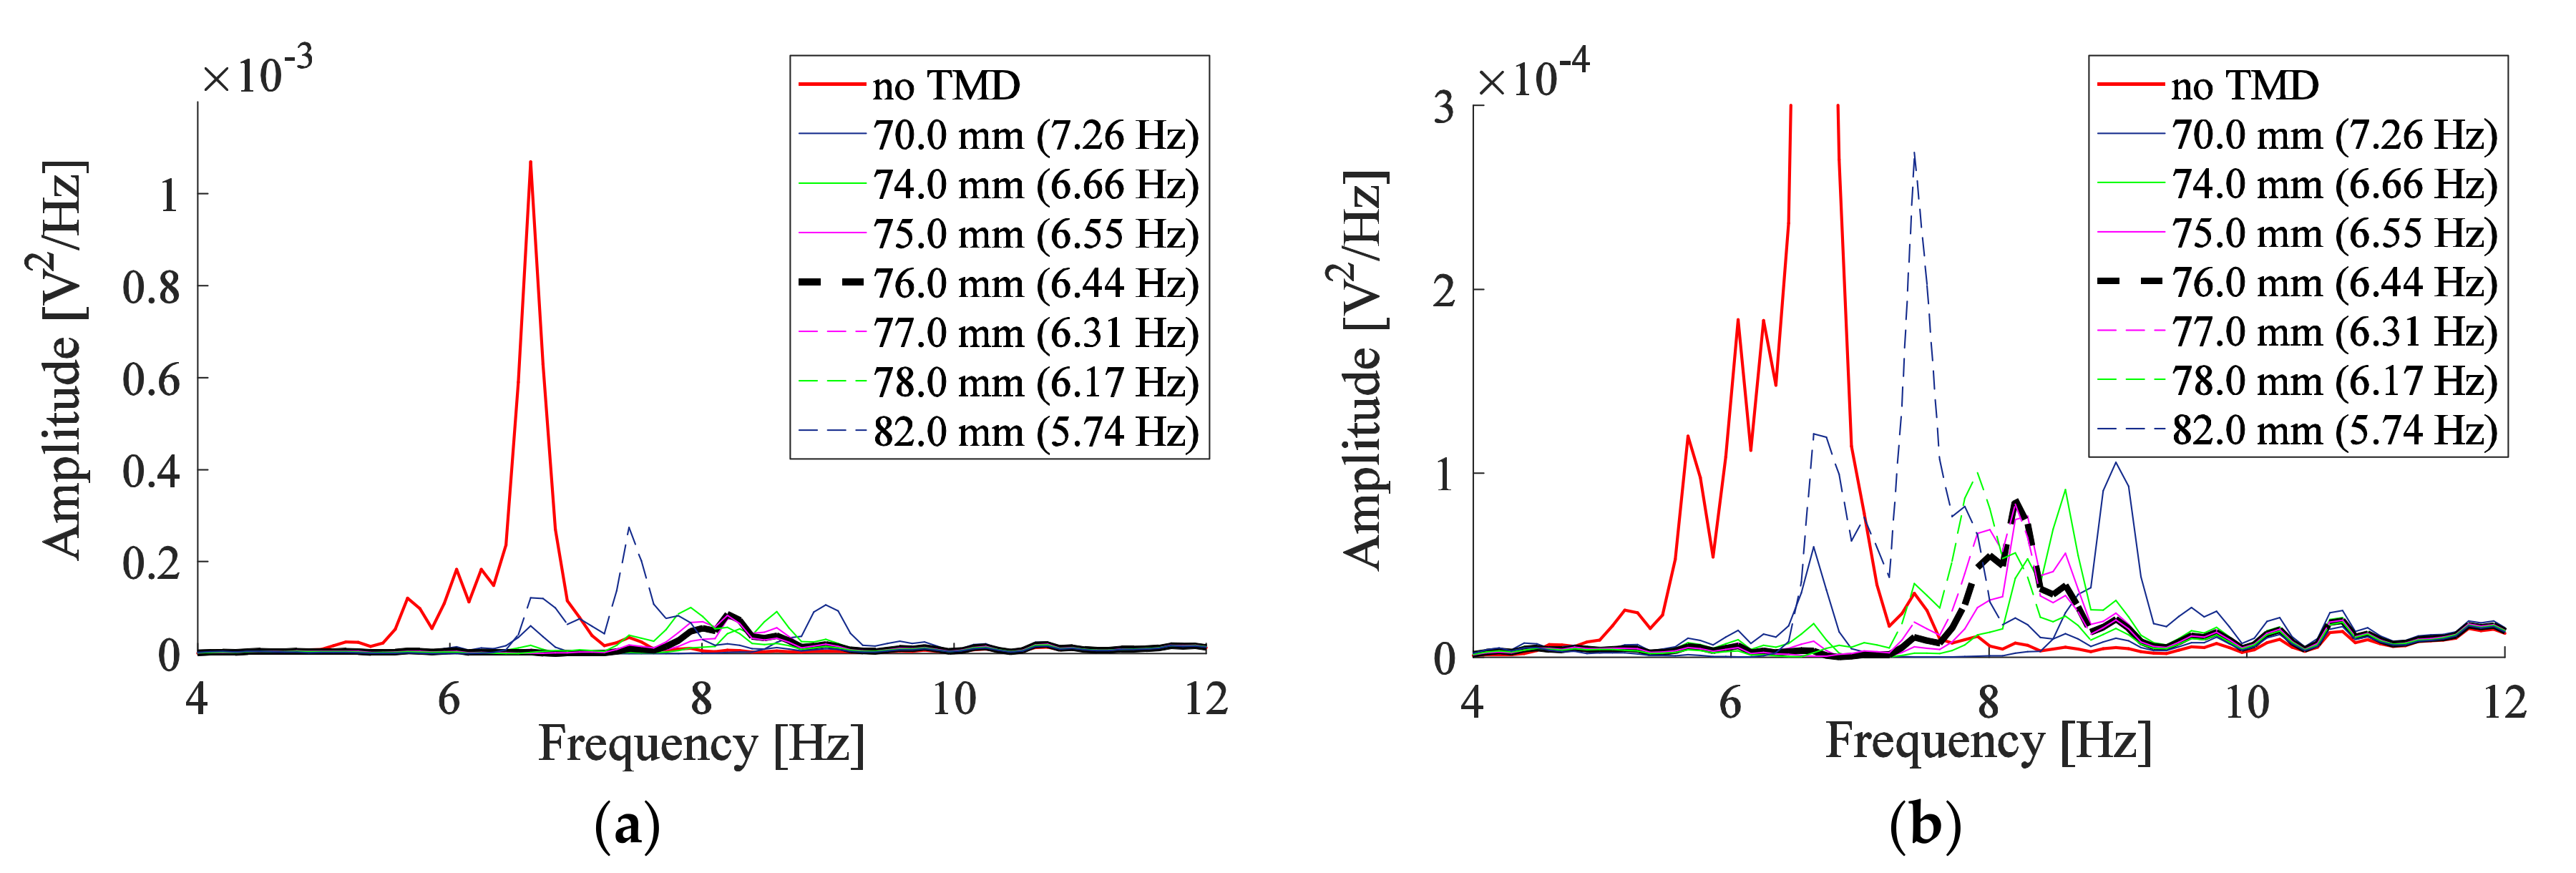
3.1. Measurements for the TMD

An experiment is conducted to measure the velocity signal of the TMD holding a 13.80 g screw, placed along a 91.0 mm long stainless steel beam with a cross-section diameter of 0.79 mm. The operating frequency of TMD ( f a m e a s ) and modal damping ratio ( ζ a m e a s ) obtained using the half-power bandwidth method and continuous wavelet method for each screw position, a , are listed in Table 1. The operational bandwidth of this TMD varies within 5.52–7.57 Hz for a position of the screw ( a ) between 68.0–84.0 mm. The corresponding range of modal damping ratio is 0.27–0.39% using the half-power bandwidth method and 0.20–0.23% using the continuous wavelets method. The position of the screw a changes the modal damping ratio with a mean ± SD of 0.33 ± 0.045% for the former and 0.21 ± 0.015% for the latter. The continuous wavelets method is more reliable and reflects the modal damping ratio of stainless steel [20,21]. The RMS error in the data obtained using the half-power bandwidth method (Table 1) is 0.125% compared with that of the continuous wavelet method.

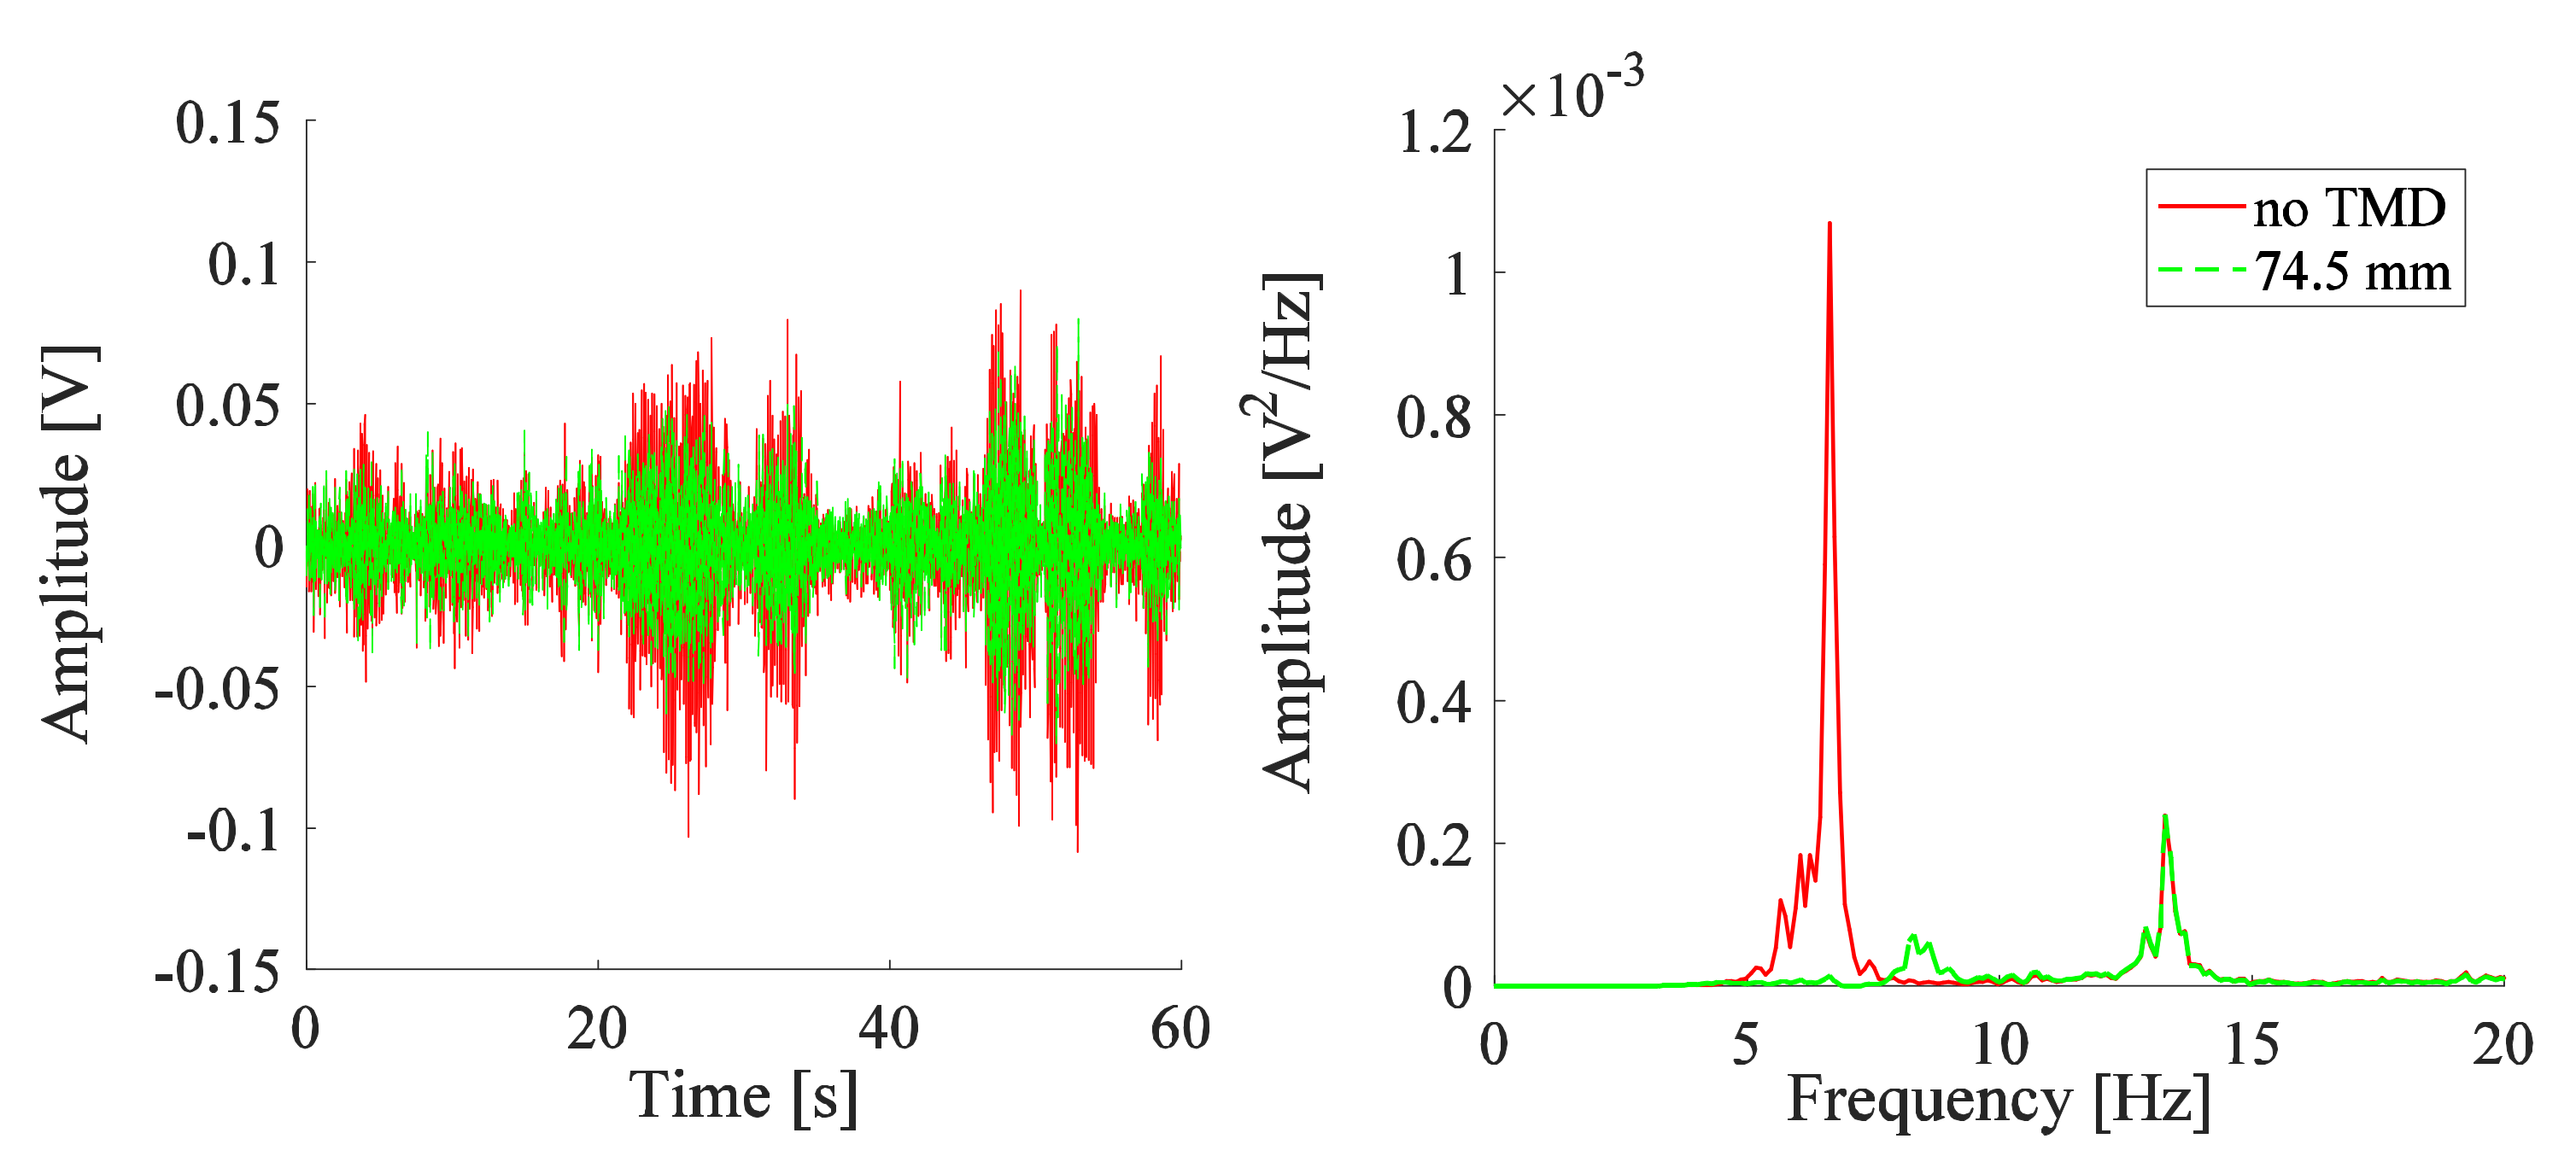
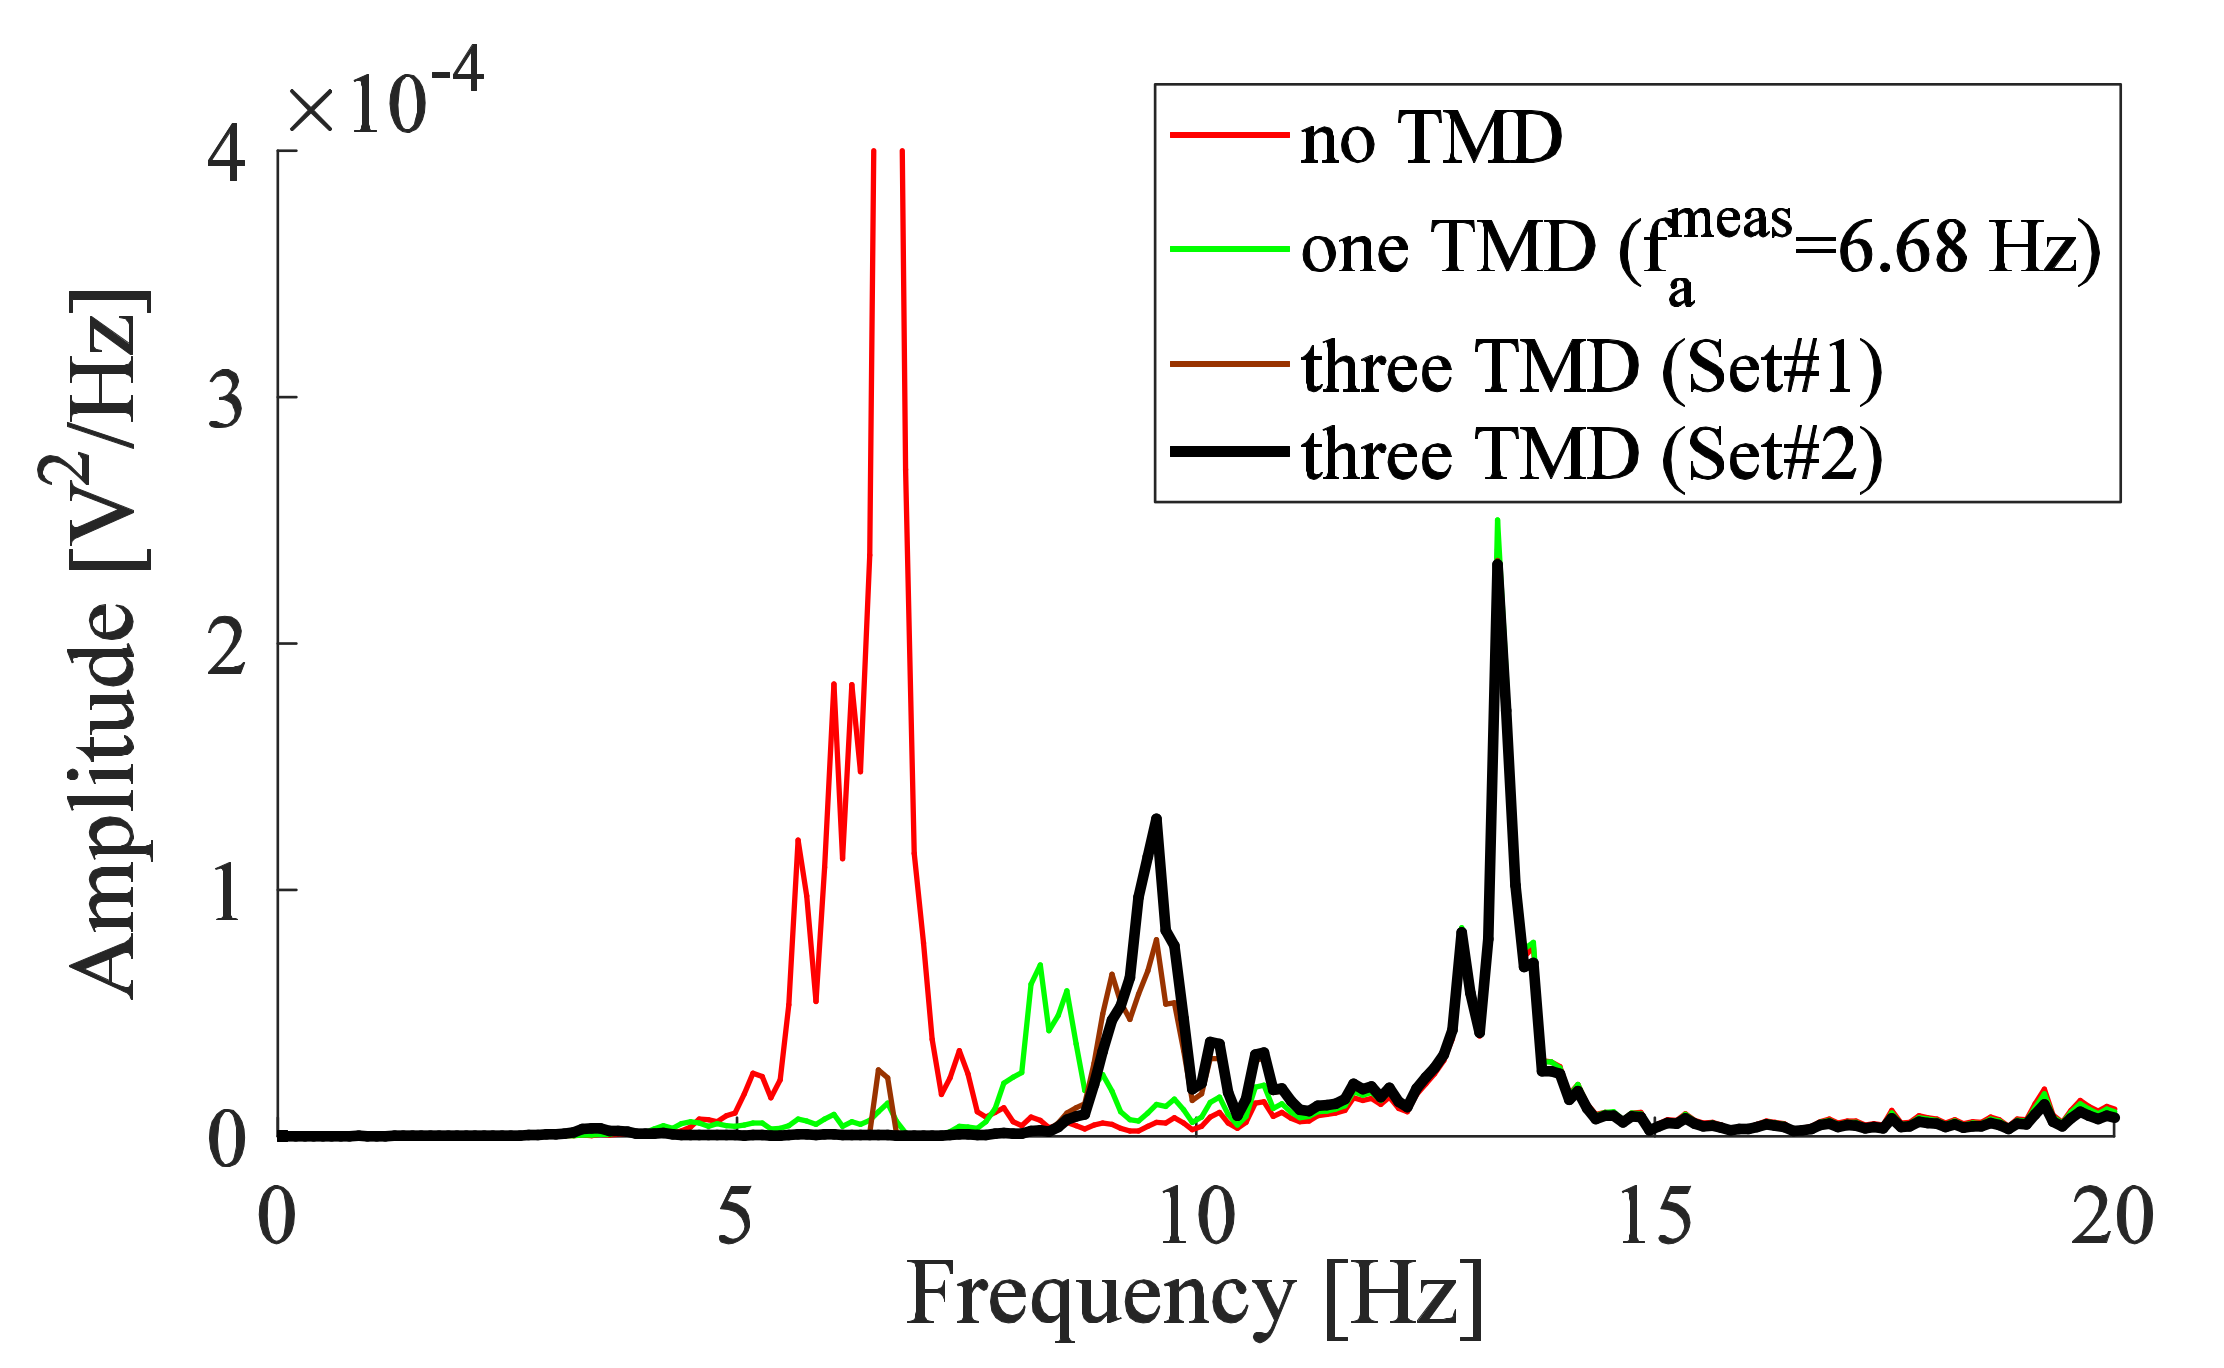
3.2. TMD Added to the System

Measured signals for the response of the experimental arm are presented in the time and frequency domains, before and after the addition of the TMDs. The capability of the TMDs in absorbing the system’s vibration is analyzed in terms of the reduction in the amplitude of the critical peak. The reduction is calculated as a percentage using:
Reduction   ( % ) = P e a k n o   T M D P e a k w i t h   T M D P e a k n o   T M D × 100 ,
where P e a k n o   T M D and P e a k w i t h   T M D are, respectively, the amplitude of the critical peak between 4–12 Hz, for the response of the system, without and with the TMD(s).
The time-domain signal of the experimental arm, excited by the PT signal, is oscillating between ±0.1 V as shown in Figure 5. In the frequency domain, the amplitude of the critical peak for the PSD of the signal is 1.069 × 10⁻³ V2/Hz for the principle system, which occurs at 6.64 Hz. The response of the system is analyzed due to the addition of one TMD designed at the tuning condition, i.e., the frequency of the TMD is chosen to be the critical frequency of the experimental arm (6.64 Hz). A frequency of 6.63 Hz is reached by one TMD system for the screw placed at a = 74.5 mm. The behavior of the system before and after the addition of this TMD is represented in Figure 5. The attenuation caused by the tuned absorber is clearly shown in the measured voltage signal (proportional to the linear velocity signal in the direction of motion) of the system in the time domain (Figure 5). The passive absorber shows its ability to operate in reducing the amplitude of the system excited by the PT signal. In the frequency domain (Figure 5), the amplitude at the critical frequency at 6.64 Hz is almost reduced, but the TMD also causes an amplification at a frequency of 8.30 Hz for the coupled system. The reduction is 93% between the critical amplitude of the system without TMD, at 6.64 Hz, and the amplified amplitude, at 8.30 Hz, after the addition of the TMD.
Measurements are repeated for the positions of the proof mass presented in Table 1 in order to search for the best position that causes the highest reduction in the amplitude. The responses in Figure 6a are analyzed in the bandwidth of 4 Hz to 12 Hz. No perfect response is obtained, however, a proof mass position can be chosen which allows us to compromise between reduced and amplified amplitudes. To facilitate the analysis, just responses that correspond to the screw placed around the best position are presented. The response of the system is improved as the position of the screw moves from a = 82.0 mm towards a = 76.0 mm. The highest reduction in the amplitude of the system is observed as the position of the mass is slightly decreased below a = 76.0 mm. A position below 74.0 mm deteriorates the response. Therefore, the best position of the mass is between 74.0–76.0 mm approaching 76.0 mm, which corresponds to an operating frequency approximately between 6.44–6.66 Hz. One TMD operating within this range causes the system to have substantially identical responses. The y-axis limit for the PSD plot of Figure 6a is changed from 12 × 10−4 V2/Hz to 3 × 10⁻⁴ V2/Hz to observe changes in system behavior more clearly; the corresponding plot is shown in Figure 6b. Similarly, the y-axis limit of other figures will be changed.
The response of the system is analyzed after the addition of one, two, and three TMDs shown in Figure 7. The position of the proof mass for these TMDs is based on a numerical study carried out by Gebai [22], where three identical cantilever-type TMDs were tested on a dynamic model of the upper limb excited by the same PT signal. The TMDs have a 91.0 mm long beam with a 0.79 mm cross-sectional diameter, holding a 14.13 g screw. The optimal screw position for each TMD obtained from the numerical study conducted in [22] is listed in Table 2, in addition to the measured frequencies of the TMDs corresponding to these positions. The optimal modal damping ratios obtained numerically are 0.99% for one TMD, 0.64% and 1.18% for two TMDs, and 1.26%, 0.13%, and 1.26% for three TMDs. These optimal modal damping ratios are higher than the modal damping ratios obtained with the stainless steel beams of the TMDs, having a mean value of 0.21%. The screw of the TMDs used in the current experiment is placed at the position that leads to a frequency, as close as possible, to the frequencies corresponding to the numerical study (Table 2). The values of the adjusted position of the screw and the corresponding measured frequency for each TMD are also provided in Table 2. The parameters corresponding to the three TMDs of the experimental work are referred to as Set#1. The one, two, and three TMDs in Figure 7 cause a reduction of 88% to 93% in the amplitude of the system. This reduction corresponds to TMDs having a mass ratio between 5.7% and 17.0%.

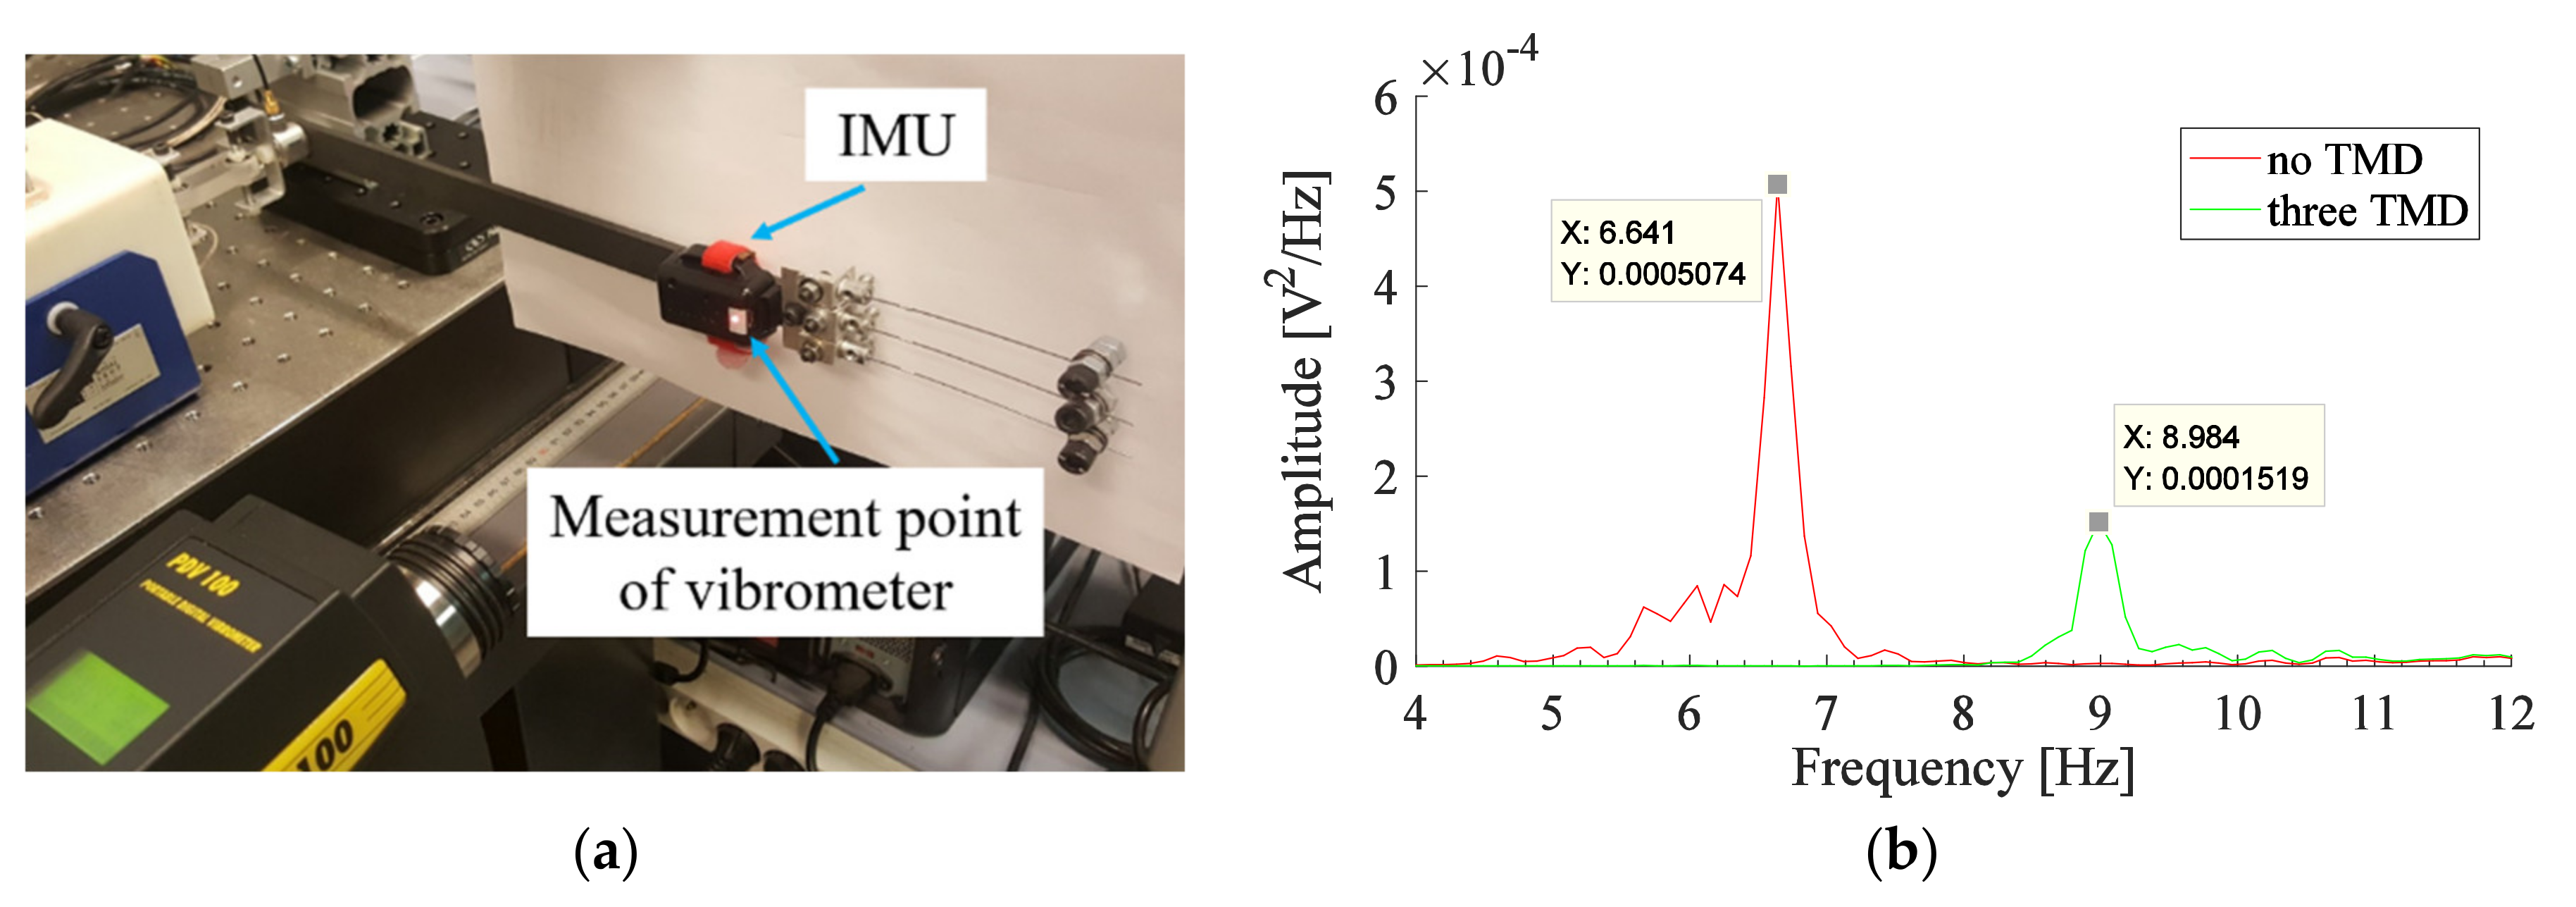
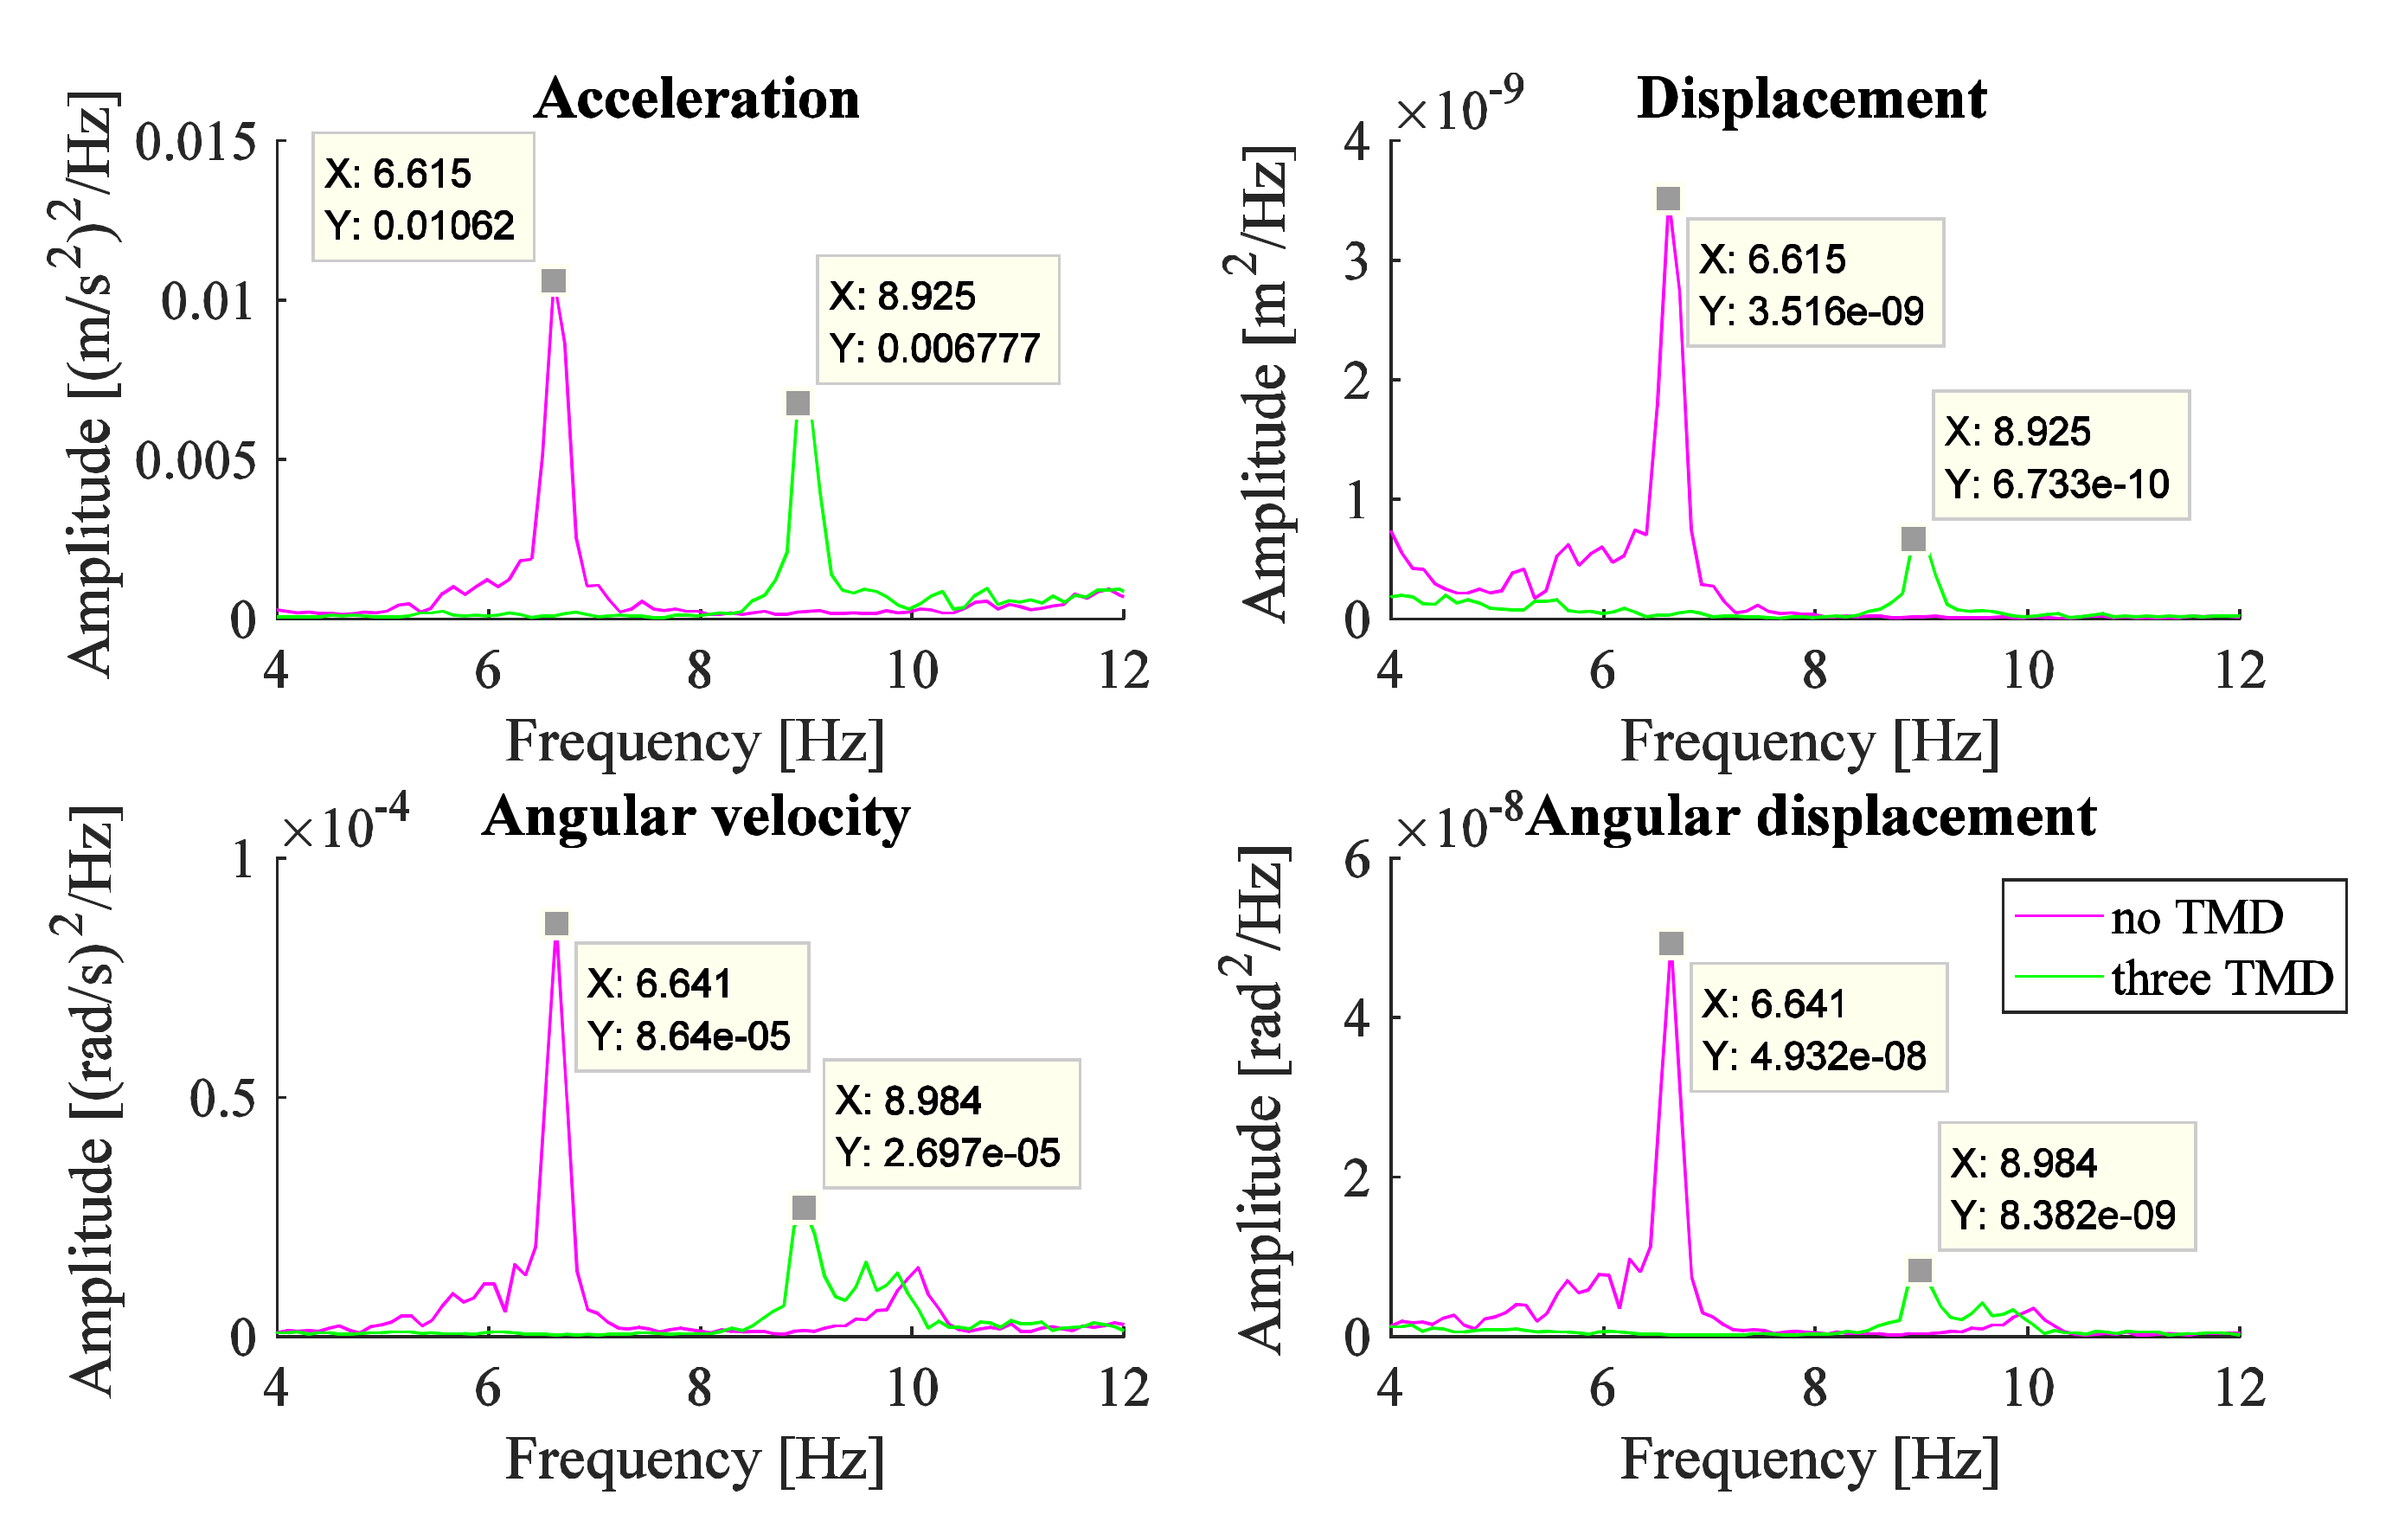
3.3. IMU Measurements

An IMU is added to the free end of the experimental arm. The vibrometer is also used to measure the response of the whole system consisting of the experimental arm and IMU. The total mass of the IMU is 21.0 g including the plastic cover and batteries. It leads to an increase in the total mass of the system to 263.3 g. The mass ratio corresponding to the three TMDs of Set#1 is now reduced to 15.7%. Measurements using the vibrometer are carried out before and after the addition of the three TMDs. The measurement point of the vibrometer is located on the IMU surface as shown in Figure 8a. The response of this system as obtained from the vibrometer measurements, before and after the addition of the three TMDs, is shown in Figure 8b. The peak observed after the addition of the TMDs, representing the frequency of the coupled system (experimental arm with three TMDs), is shifted from 8.60 Hz (without IMU as in Figure 7) to 8.98 Hz (with IMU as in Figure 8b). The percentage of reduction in the amplitude of the system including the IMU, before and after the addition of the TMDs of Set#1, is 69%.
The IMU is also used to provide measurements of the acceleration and angular velocity of the system in the direction of motion, before and after the addition of the three TMDs. The results due to the three TMDs of Set#1 are shown in Figure 9. It shows that the reduction is 29% for the acceleration signal, 79% for the displacement signal, 67% for the angular velocity signal, and 82% for the angular displacement signal. The passive TMDs system causes a significant level of reduction in the amplitude of the system, excited by the PT signal, especially in the angular displacement signal which represents the flexion-extension angular displacement motion of the hand.

4. Discussion

The addition of two and three TMDs did not show a remarkable improvement in the system response compared with the response obtained with one TMD in Figure 7, in contrast to what is expected by [23]. This can be explained by the low modal damping ratios (in comparison with that obtained in the numerical study) provided by the manufactured TMDs (of stainless beams), which are not high enough to lessen the amplitude of critical peaks. Despite this, the TMDs improved the response of the system and cause a minimum reduction of 88%; however, a considerable value of 5.7% minimum mass ratio was used for the testing. To find a compromise between the patient’s comfort due to the addition of masses to the hand and the reduction in the amplitude of the tremor caused by these TMDs, a study with a lower mass ratio can be performed while achieving a satisfying reduction.
The optimal damping ratios determined numerically are not reached in this study due to a low damping ratio provided by the strain rate of the stainless steel beam material, air damping provided by the beam and the screw, and frictional damping provided by the clamped end and the surface of contact with the attached screw, without the addition of an external damper. Due to this, the optimization of TMDs parameters obtained from the numerical study was not very useful for reflecting the best position of the TMD in the experimental study. Since the manufactured TMDs have low modal damping ratios, tuning these absorbers may be a good choice to obtain a better reduction for the system with three TMDs (Figure 7). The operating frequency of the three TMDs is chosen to be close to the critical frequency (6.64 Hz), and within the best frequency range (6.44–6.66 Hz) of the one TMD deduced from Figure 6. The three TMDs placed at positions ‘0’, ‘1’, and ‘2’ (Figure 4a) are adjusted to 6.61 Hz, 6.61 Hz, and 6.52 Hz, respectively, and referred to as Set#2.
The responses of the experimental arm (without IMU) due to the addition of the three TMDs of Set#1 (Figure 7) and Set#2 are shown in Figure 10 and compared with that obtained for one TMD corresponding to the numerical study (Figure 7). The three TMDs of Set#2 improved the response at the critical frequency in comparison with the other responses. It causes also a slight amplification in comparison with Set#1 at the frequency of 9.57 Hz, which is a frequency higher than the frequency of the critical peak, thus the 9.57 Hz will not lead to a critical effect on the signal of the system. However, a slightly higher level of damping is still interesting to further reduce the amplitudes at all peaks within the range of PT.
Encouraging results are obtained in this study, which motivates the development in the design of the passive type of tremor controllers, to be competitive to the work found in the literature. The 120 g controller used by Stone et al. [6] represents a PID controller which provides a 20–60% reduction in the displacement amplitude, although a higher level of reduction could be expected by an active type of controller. A TMD of 200–400 g (representing 18.3–36.7% mass ratio) was used by Teixeira et al. [7] and adjusted by the water level entering or leaving the piezoelectric micro-pump. It provided a 57% reduction in the amplitude of acceleration. The system was loaded with a high mass ratio that did not cause a high reduction. An efficient 280 g TMD used by Buki et al. [8] causes an 83% reduction in the pronation-supination amplitude of a system modeled as an inertial rod excited at resonance. An interesting design of the bracelet was provided in the study of Buki et al. [8] which can be comfortable and easily wearable by the patient. The 530 g passive TMDs (representing 31.4% mass ratio) manufactured by Rudraraju and Nguyen [9] cause a good reduction of 70–80% in the tremor amplitude. However, this TMD is considered heavy, and the effect of this mass on the amplitude of the system could be tested to quantify the reduction caused by the TMD. An innovative prototype of a gyroscope-based controller weighing 268 g used by Phan Van and Ngo [10], caused a 92.6% reduction in the simulated uniaxial tremor amplitude with low power consumption. Masoumi et al. [11] prove that a magnetic spring system could be added to the wearable gadget devices used to reduce the tremor of the hand. The effectiveness of the 120 g device used was not quantified.
The perfect design of the tremor controller is a competitive work that is still under study by several researchers. In our study, a good level of reduction is reached by a simple passive three TMD system representing a 15.7% mass ratio. It causes a 79% reduction in the displacement signal and a 67% reduction in the angular displacement signal of an experimental arm excited by a measured signal of the muscles generating the tremor.

5. Conclusions

An experimental arm is modeled to reflect the hand of a patient. It is excited by the ECR signal of a patient with PT. The mechanical shaker was able to precisely simulate the data of the PT signal. The TMD is modeled as a cantilever beam with a screw that can be fixed at different positions along the beam. Measurements are carried out to determine the new operation frequency of the TMD resulting from each screw position. The modal damping ratio for each position is determined using the half-power bandwidth method and the continuous wavelets method. The half-power bandwidth method could not provide a good estimation for the modal damping ratio of the designed TMD.
The effect of the designed TMDs on the response of the experimental arm is obtained. The passive TMD shows its effectiveness in reducing the vibration of the system excited by the PT signal of a real patient. Three TMDs with a total mass of 41.23 g, representing a mass ratio of 15.7%, reduced the angular displacement amplitude of the flexion-extension motion by 82%, measured using the IMU. The beam’s material used in the design of the TMD needs to be modified to provide a relatively higher level of damping. A 3D printer will be used to manufacture a TMD of precise dimension and less expensive material. Therefore, the stainless steel beam will be replaced by Acrylonitrile Butadiene Styrene (ABS) material.
The beam composing the TMD in this study has a circular cross-section to allow multi-directional operation of the TMD to be tested in further experiments. An experimental arm is prepared in the form of a tube to position the TMD(s) in orientations different from the excitation direction and thus test the ability of the TMD system for multidirectional excitations, which will occur in experimental tests to be applied for the patient. To anticipate the effect of the skin, an elastomer, representing the hand segment, will be placed between the tube and the TMD fixation to take into account the effect of the patient’s epidermis, dermis, and subcutaneous tissues. A passive lightweight bracelet will also be designed to keep the TMDs attached in different directions around the tube to attenuate the essential tremor.

Author Contributions

Conceptualization, S.G. and G.C.; methodology, all authors; software, S.G. and G.C.; validation, S.G., G.C., M.H. and G.F.; formal analysis, all authors; investigation, S.G.; data curation, S.G. and G.C.; writing—original draft preparation, S.G.; writing—review and editing, S.G., G.C., M.H. and G.F.; visualization, E.R. and E.H.; supervision, G.C., M.H. and G.F. All authors have read and agreed to the published version of the manuscript.

Funding

The APC was funded by the Lebanese International University LIU.

Institutional Review Board Statement

Not applicable.

Informed Consent Statement

Not applicable.

Data Availability Statement

Data sharing is not applicable.

Conflicts of Interest

The authors declare no conflict of interest.

References

  1. Louis, E.D. Clinical practice. Essential tremor. N. Engl. J. Med. 2001, 345, 887–891. [Google Scholar] [CrossRef] [PubMed]
  2. Rubchinsky, L.L.; Kuznetsov, A.S.; Wheelock, V.L.; Sigvardt, K.A. Tremor. Scholarpedia 2007, 2, 1379. [Google Scholar] [CrossRef]
  3. Bhidayasiri, R. Differential diagnosis of common tremor syndromes. Postgrad. Med. J. 2005, 81, 756–762. [Google Scholar] [CrossRef] [PubMed] [Green Version]
  4. Fromme, N.P.; Camenzind, M.; Riener, R.; Rossi, R.M. Need for mechanically and ergonomically enhanced tremor-suppression orthoses for the upper limb: A systematic review. J. Neuroeng. Rehabil. 2019, 16, 93. [Google Scholar] [CrossRef] [PubMed] [Green Version]
  5. Castrillo-Fraile, V.; Peña, E.C.; Gabriel y Galán, J.M.T.; Delgado-López, P.D.; Collazo, C.; Cubo, E. Tremor control devices for essential tremor: A systematic literature review. Tremor Other Hyperkinet. Mov. 2019, 9, 1–6. [Google Scholar] [CrossRef]
  6. Stone, N.; Kaiser, K.; White, R.D. Autotuning of A PID Controller for an Active Vibration Suppression Device for the Treatment of Essential Tremor. In Proceedings of the ASME 2006 International Mechanical Engineering Congress and Exposition, Dynamic Systems and Control, Parts A and B, Chicago, IL, USA, 5–10 November 2006; pp. 855–861. [Google Scholar]
  7. Teixeira, C.J.; Bicho, E.; Rocha, L.A.; Gago, M.F. A self-tunable dynamic vibration absorber: Parkinson’s Disease’s tremor suppression. In Proceedings of the 2013 IEEE 3rd Portuguese Meeting in Bioengineering, Braga, Portugal, 20–23 February 2013; pp. 1–6. [Google Scholar]
  8. Buki, E.; Katz, R.; Zacksenhouse, M.; Schlesinger, I. Vib-bracelet: A passive absorber for attenuating forearm tremor. Med. Biol. Eng. Comput. 2017, 56, 1–8. [Google Scholar] [CrossRef] [PubMed]
  9. Rudraraju, S.; Nguyen, T. Wearable Tremor Reduction Device (TRD) for Human Hands and Arms. In Proceedings of the 2018 Design of Medical Devices Conference, Minneapolis, MN, USA, 9–12 April 2018. [Google Scholar]
  10. Phan Van, H.; Ngo, H.Q.T. Developing an Assisting Device to Reduce the Vibration on the Hands of Elders. Appl. Sci. 2021, 11, 5026. [Google Scholar] [CrossRef]
  11. Masoumi, M.; Kmanzi, S.; Wang, H.; Mohammadi, H. Design and fabrication of a novel passive hand tremor attenuator. J. Med. Eng. Technol. 2021, 2021, 1936673. [Google Scholar] [CrossRef]
  12. Gagnon, D.; Arjmand, N.; Plamondon, A.; Shirazi-Adl, A.; Larivière, C. An improved multi-joint EMG-assisted optimization approach to estimate joint and muscle forces in a musculoskeletal model of the lumbar spine. J. Biomech. 2011, 44, 1521–1529. [Google Scholar] [CrossRef] [PubMed]
  13. Corie, T.H.; Charles, S.K. Simulated tremor propagation in the upper limb: From muscle activity to joint displacement. J. Biomech. Eng. 2019, 141, 11–117. [Google Scholar] [CrossRef] [PubMed] [Green Version]
  14. Inman, D.J. Engineering Vibration, 2nd ed.; CRC Press: Upper Saddle River, NJ, USA, 2014; pp. 377–419. [Google Scholar]
  15. Hess, C.W.; Pullman, S.L. Tremor: Clinical phenomenology and assessment techniques. Tremor Other Hyperkinet. Mov. 2012, 2, 1–15. [Google Scholar] [CrossRef]
  16. Timmer, J.; Häussler, S.; Lauk, M.; Lücking, C.H. Pathological tremors: Deterministic chaos or nonlinear stochastic oscillators? Chaos 2000, 10, 278–288. [Google Scholar] [CrossRef] [PubMed]
  17. Gresty, M.; Buckwell, D. Spectral analysis of tremor: Understanding the results. J. Neurol. Neurosurg. Psychiatry 1990, 53, 976–981. [Google Scholar] [CrossRef] [PubMed] [Green Version]
  18. Gebai, S.; Hammoud, M.; Hallal, A.; Khachfe, H. Tremor Reduction at the Palm of a Parkinson’s Patient Using Dynamic Vibration Absorber. Bioengineering 2016, 3, 18. [Google Scholar] [CrossRef] [PubMed] [Green Version]
  19. Wu, B. A correction of the half-power bandwidth method for estimating damping. Arch. Appl. Mech. 2014, 85, 315–320. [Google Scholar] [CrossRef]
  20. Argoul, P.; Le, T.P. Instantaneous indicators of structural behaviour based on the continuous Cauchy wavelet analysis. Mech. Syst. Signal Process. 2003, 17, 243–250. [Google Scholar] [CrossRef]
  21. Hirsch, G.; Bachmann, H. Vibration Problems in Structures, 2nd ed.; Birkhäuser Basel: Zürich, Switzerland, 1995; pp. 157–168. [Google Scholar]
  22. Gebai, S. Optimization of Passive Cantilever-Type Tuned Mass Damper to Reduce the Hand Postural Tremor. Ph.D. Thesis, Université Paris-Est, Paris, France, 8 July 2020. [Google Scholar]
  23. Zuo, L.; Nayfeh, S.A. Optimization of the Individual Stiffness and Damping Parameters in Multiple-Tuned-Mass-Damper Systems. J. Vib. Acoust. 2005, 127, 77–83. [Google Scholar] [CrossRef]
Figure 1. (a) Experimental setup used to test the behavior of the TMD system with realistic tremor signal; (b) connection between the mechanical shaker and the experimental arm.
Applsci 11 09809 g001
Figure 2. (a) Signal measured using the EMG for the ECR muscle of a patient suffering from PT, used as input signal of the shaker (b) Normalized PSD for the input and output signals of the mechanical shaker, the input signal corresponding to the measured ECR signal of the patient.
Applsci 11 09809 g002
Figure 3. Manufactured cantilever-type TMD.
Applsci 11 09809 g003
Figure 4. (a) TMD holding piece; (b) one, two, and three TMDs attached to the experimental arm.
Applsci 11 09809 g004
Figure 5. Responses measured by vibrometer for the system with one TMD for screw at a position reflecting the tuning frequency of the TMD.
Applsci 11 09809 g005
Figure 6. Responses measured by vibrometer for the system with one TMD for (a) screw at different positions along the beam; (b) same as (a) but with different y-axis limit.
Applsci 11 09809 g006
Figure 7. Responses measured by vibrometer for the system with one, two, and three TMDs with screw positions adjusted to obtain the frequencies corresponding to that of the numerical study.
Applsci 11 09809 g007
Figure 8. (a) IMU added to the end of the experimental arm; (b) PSD obtained from vibrometer measurement for the system with three TMDs (Set#1).
Applsci 11 09809 g008
Figure 9. PSD obtained from IMU measurements for the system with three TMDs (Set#1).
Applsci 11 09809 g009
Figure 10. PSD obtained from vibrometer measurements for the system with one TMD adjusted to the optimal frequency compared with that obtained with three TMDs.
Applsci 11 09809 g010
Table 1. Fundamental frequency of the TMD for each screw position and the corresponding modal damping ratio obtained using different methods.
a [mm] f a m e a s   [ Hz ] ζ a m e a s   [ % ]
MeasurementGraphicallyHalf-Power Bandwidth MethodContinuous Wavelet Method
66.07.570.320.20
68.07.420.380.20
70.07.260.390.22
72.06.950.360.21
73.06.800.320.21
74.06.660.380.22
75.06.550.380.21
76.06.440.270.20
77.06.310.340.20
78.06.170.260.17
79.06.060.360.23
80.05.960.330.23
81.05.830.260.20
82.05.740.320.21
83.05.670.290.22
84.05.520.270.20
Table 2. Frequencies of one, two, and three TMDs system for the optimal positions obtained from a numerical study carried out by Gebai [22] and their corresponding nearest frequencies used for the current experimental work.
Number of TMDsOne TMDTwo TMDThree TMD
Numerical study a [mm]74.976.875.679.177.075.9
f a m e a s [Hz]6.696.236.446.156.416.55
Experimental workPosition‘0’‘1’‘2’‘1’‘0’‘2’
a [mm]73.079.076.079.576.075.0
f a m e a s [Hz]6.686.216.416.186.416.52
Publisher’s Note: MDPI stays neutral with regard to jurisdictional claims in published maps and institutional affiliations.

