Article

Autonomous Service Drones for Multimodal Detection and Monitoring of Archaeological Sites

1
Department of Computer Science and IT, Abu Dhabi University, Abu Dhabi 59911, United Arab Emirates
2
Department of History, Cultural Heritage, Education and Society, University of Rome Tor Vergata, 00133 Roma, Italy
3
Institute of Archaeology, University College London, London WC1E 6BT, UK
4
Electrical and Computer Engineering Department, College of Engineering, Abu Dhabi University, Abu Dhabi 59911, United Arab Emirates
*
Author to whom correspondence should be addressed.
These authors contributed equally to this work.
Appl. Sci. 2021, 11(21), 10424; https://doi.org/10.3390/app112110424
Submission received: 5 September 2021 / Revised: 20 October 2021 / Accepted: 31 October 2021 / Published: 5 November 2021
(This article belongs to the Special Issue Smart Robots for Industrial Applications)

Abstract

:
Constant detection and monitoring of archaeological sites and objects have always been an important national goal for many countries. The early identification of changes is crucial to preventive conservation. Archaeologists have always considered using service drones to automate collecting data on and below the ground surface of archaeological sites, with cost and technical barriers being the main hurdles against the wide-scale deployment. Advances in thermal imaging, depth imaging, drones, and artificial intelligence have driven the cost down and improved the quality and volume of data collected and processed. This paper proposes an end-to-end framework for archaeological sites detection and monitoring using autonomous service drones. We mount RGB, depth, and thermal cameras on an autonomous drone for low-altitude data acquisition. To align and aggregate collected images, we propose two-stage multimodal depth-to-RGB and thermal-to-RGB mosaicking algorithms. We then apply detection algorithms to the stitched images to identify change regions and design a user interface to monitor these regions over time. Our results show we can create overlays of aligned thermal and depth data on RGB mosaics of archaeological sites. We tested our change detection algorithm and found it has a root mean square error of 0.04. To validate the proposed framework, we tested our thermal image stitching pipeline against state-of-the-art commercial software. We cost-effectively replicated its functionality while adding a new depth-based modality and created a user interface for temporally monitoring changes in multimodal views of archaeological sites.

1. Introduction

Experts in digital cultural heritage endeavor to use detection techniques to document the physical dimensions of sites and cultural objects. They seek to use and keep digital material documented so that they remain usable for wider research and documentation [1]. Digital detection of heritage and historical places in reference-scaled models has become crucial, as many heritage sites are threatened by different human and natural factors. Since the 1970s, archaeologists have known about the potential of infrared thermal images for identifying structures not visible on the surface, including concentrations of materials, or landscape elements, including ancient roads, boundaries of cultivated fields, paleoriver beds, etc. [2].
Thermal photography has evolved into a powerful nondestructive tool for cultural heritage conservation study [3,4,5]. Despite this long period, the excessive cost of the technologies used has greatly limited the possibilities of research. Now, a new phase of development is emerging throughout the expanding application of service drones in research. In particular, the recent advancements in drone technology and the development of commercial drones with thermal cameras are permitting, on the one hand, less expensive use costs and, on the other, accelerated reconnaissance [6,7,8,9]. Infrared thermography offers a method of visualization that is nondestructive and capable of revealing various types of archaeological anomaly. The advantages of remote and nondestructive examination of cultural heritage are two-fold: data may be obtained without damage to the historic site, and information may be collected that no other technique is capable of extracting.
The physical principle behind the analysis of thermal images is quite simple: the materials that are above and below the soil surface absorb, emit or reflect infrared rays in different ways, based on their composition, density and moisture content. Therefore, a large number of archaeological elements can theoretically be identified in thermal images as depicted in Figure 1 [10].
There are three essential factors for archaeological features to stand out in a thermal image, which can be summarized as follows:
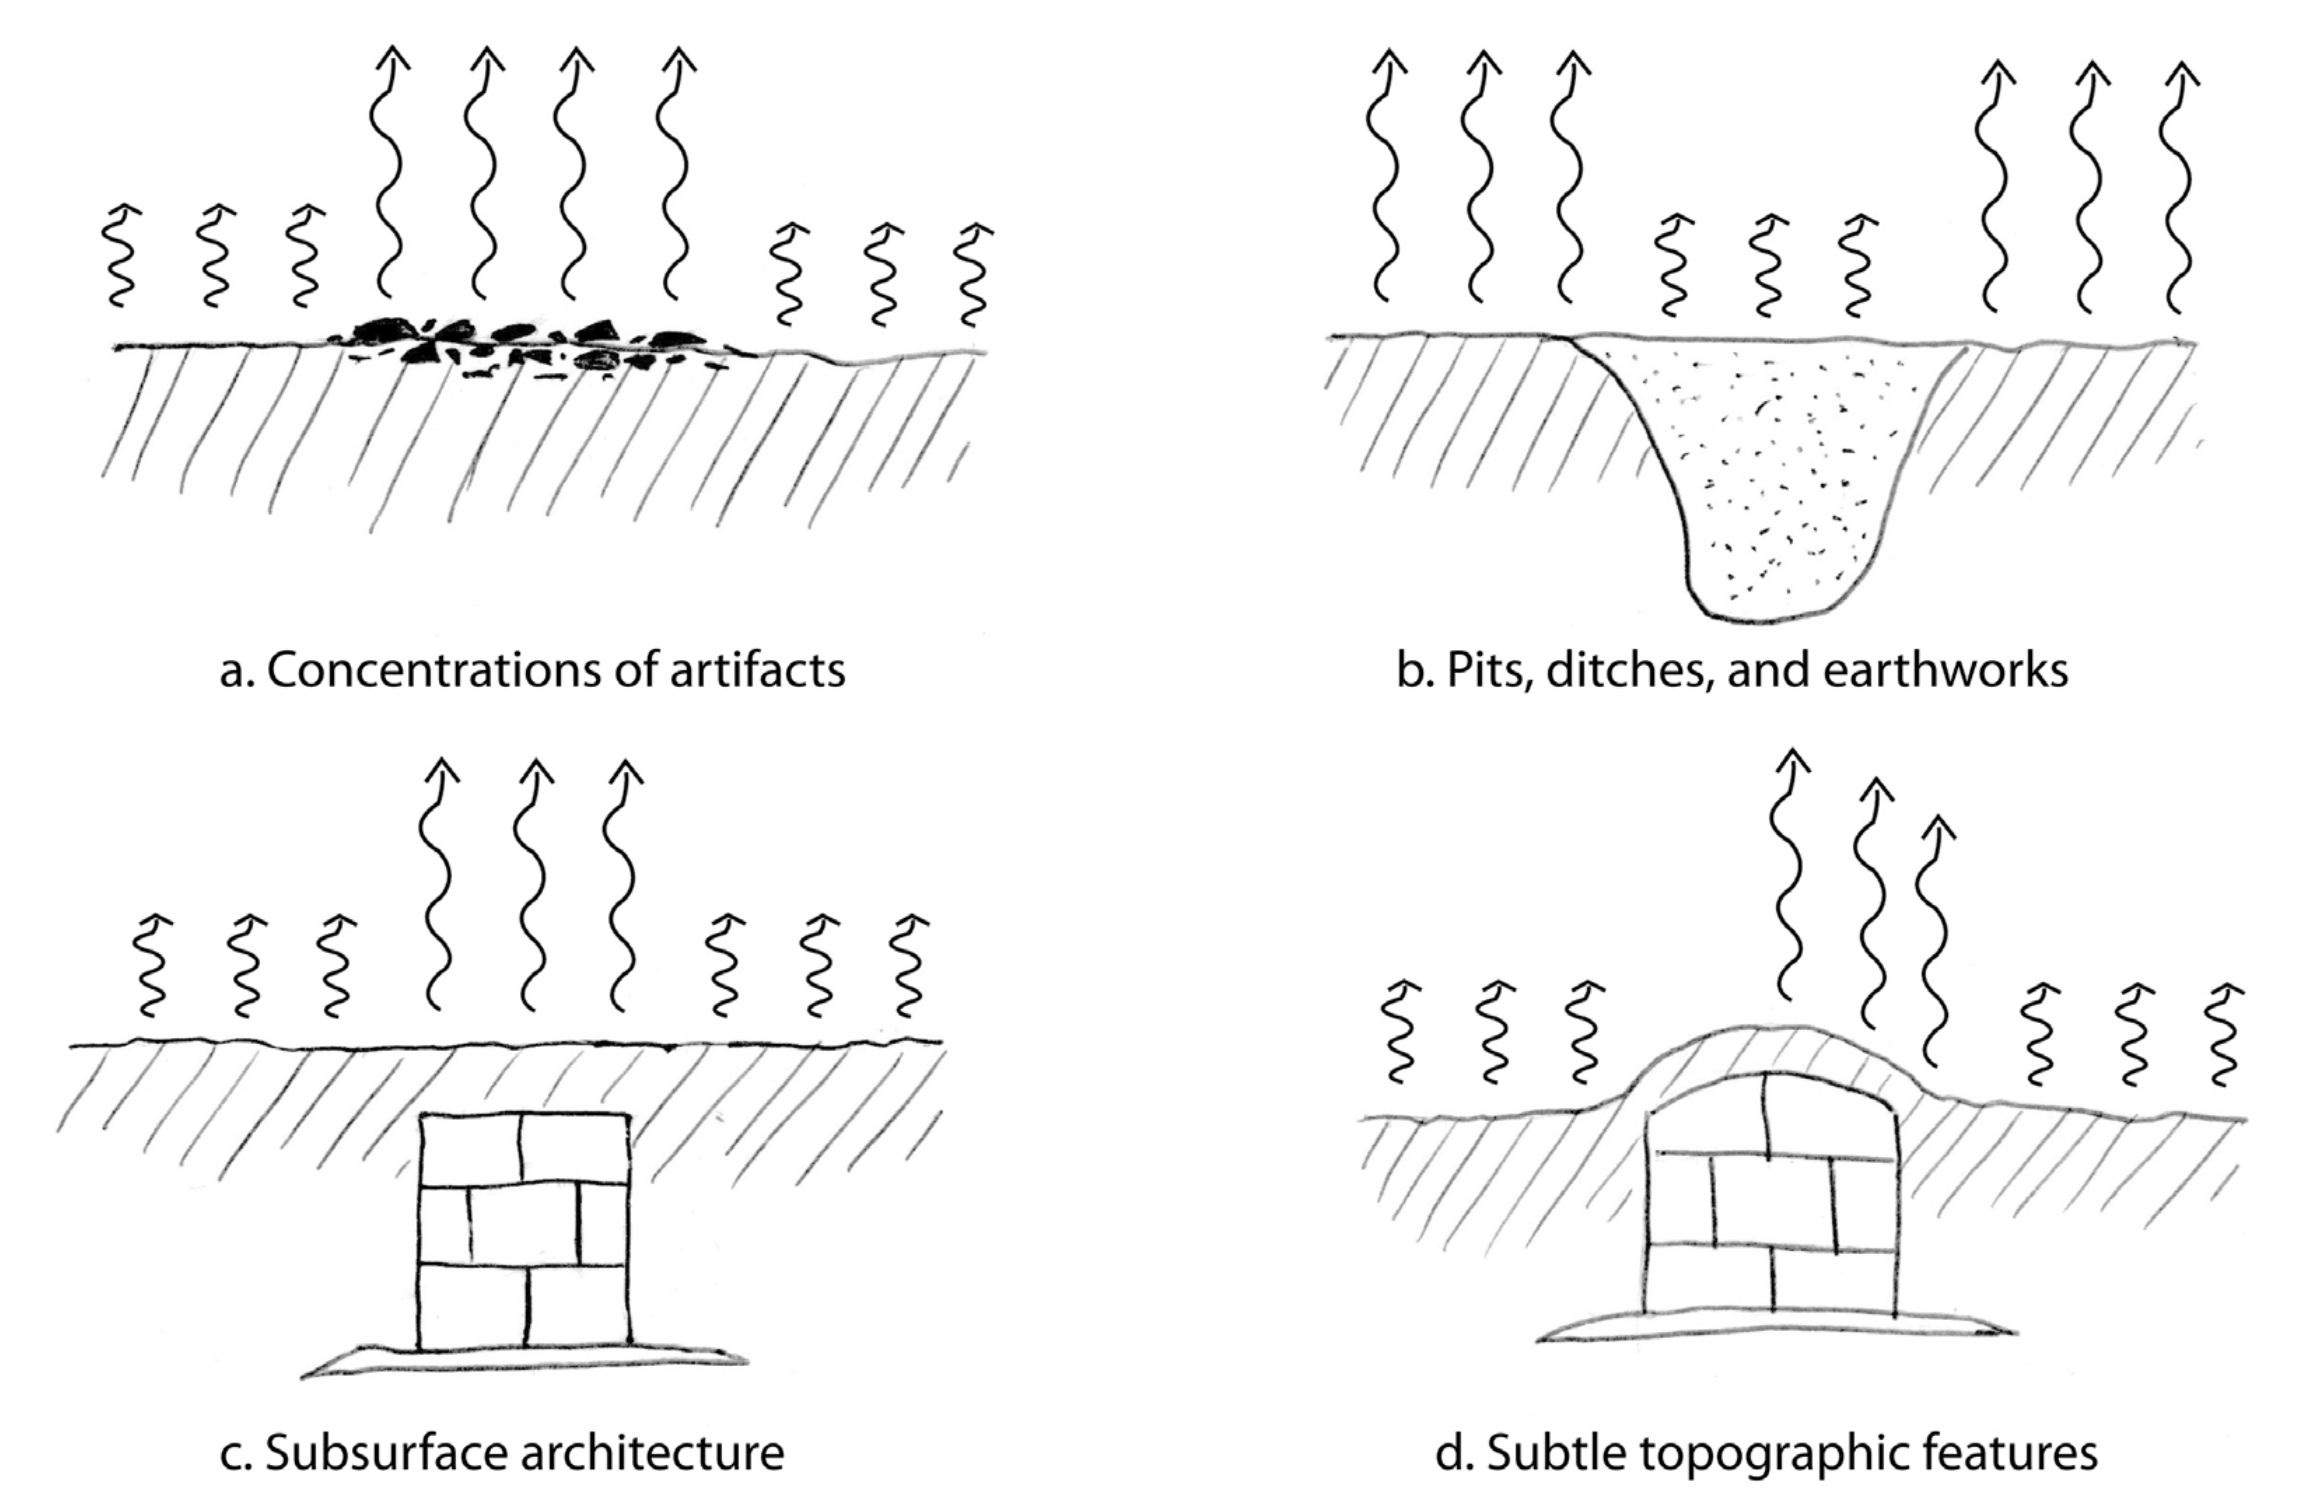
  • There must be a sufficient contrast between the thermal properties of the material of interest and those of the soil.
  • The archaeological material below the surface must be close enough to the surface to be affected by heat flux.
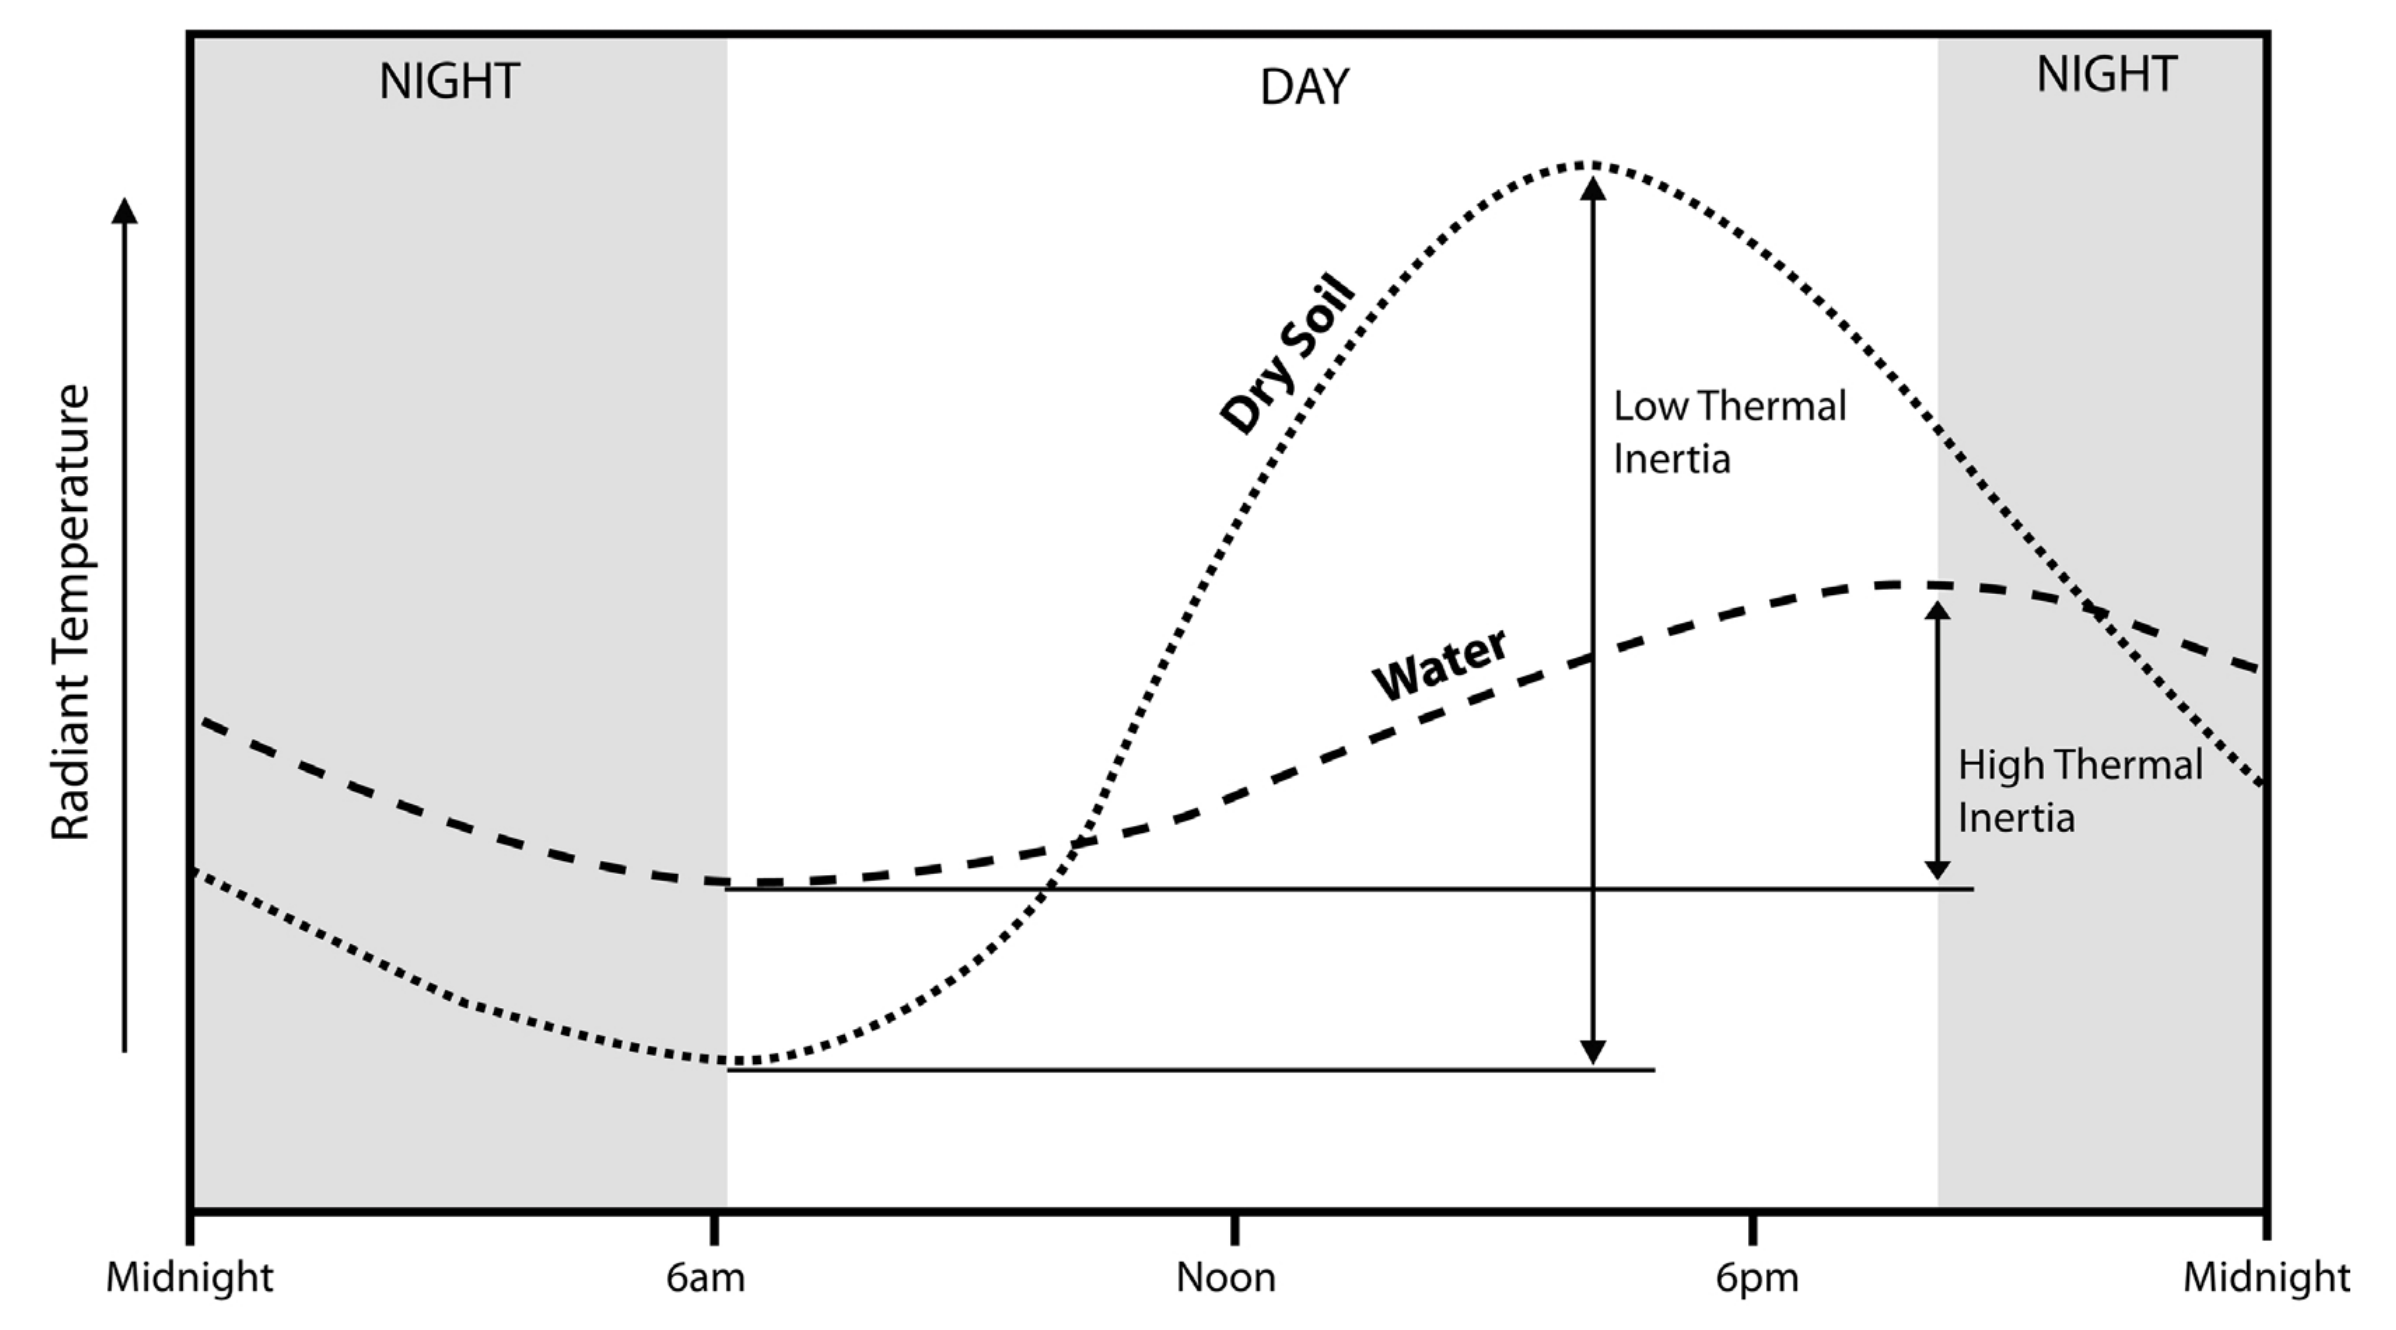
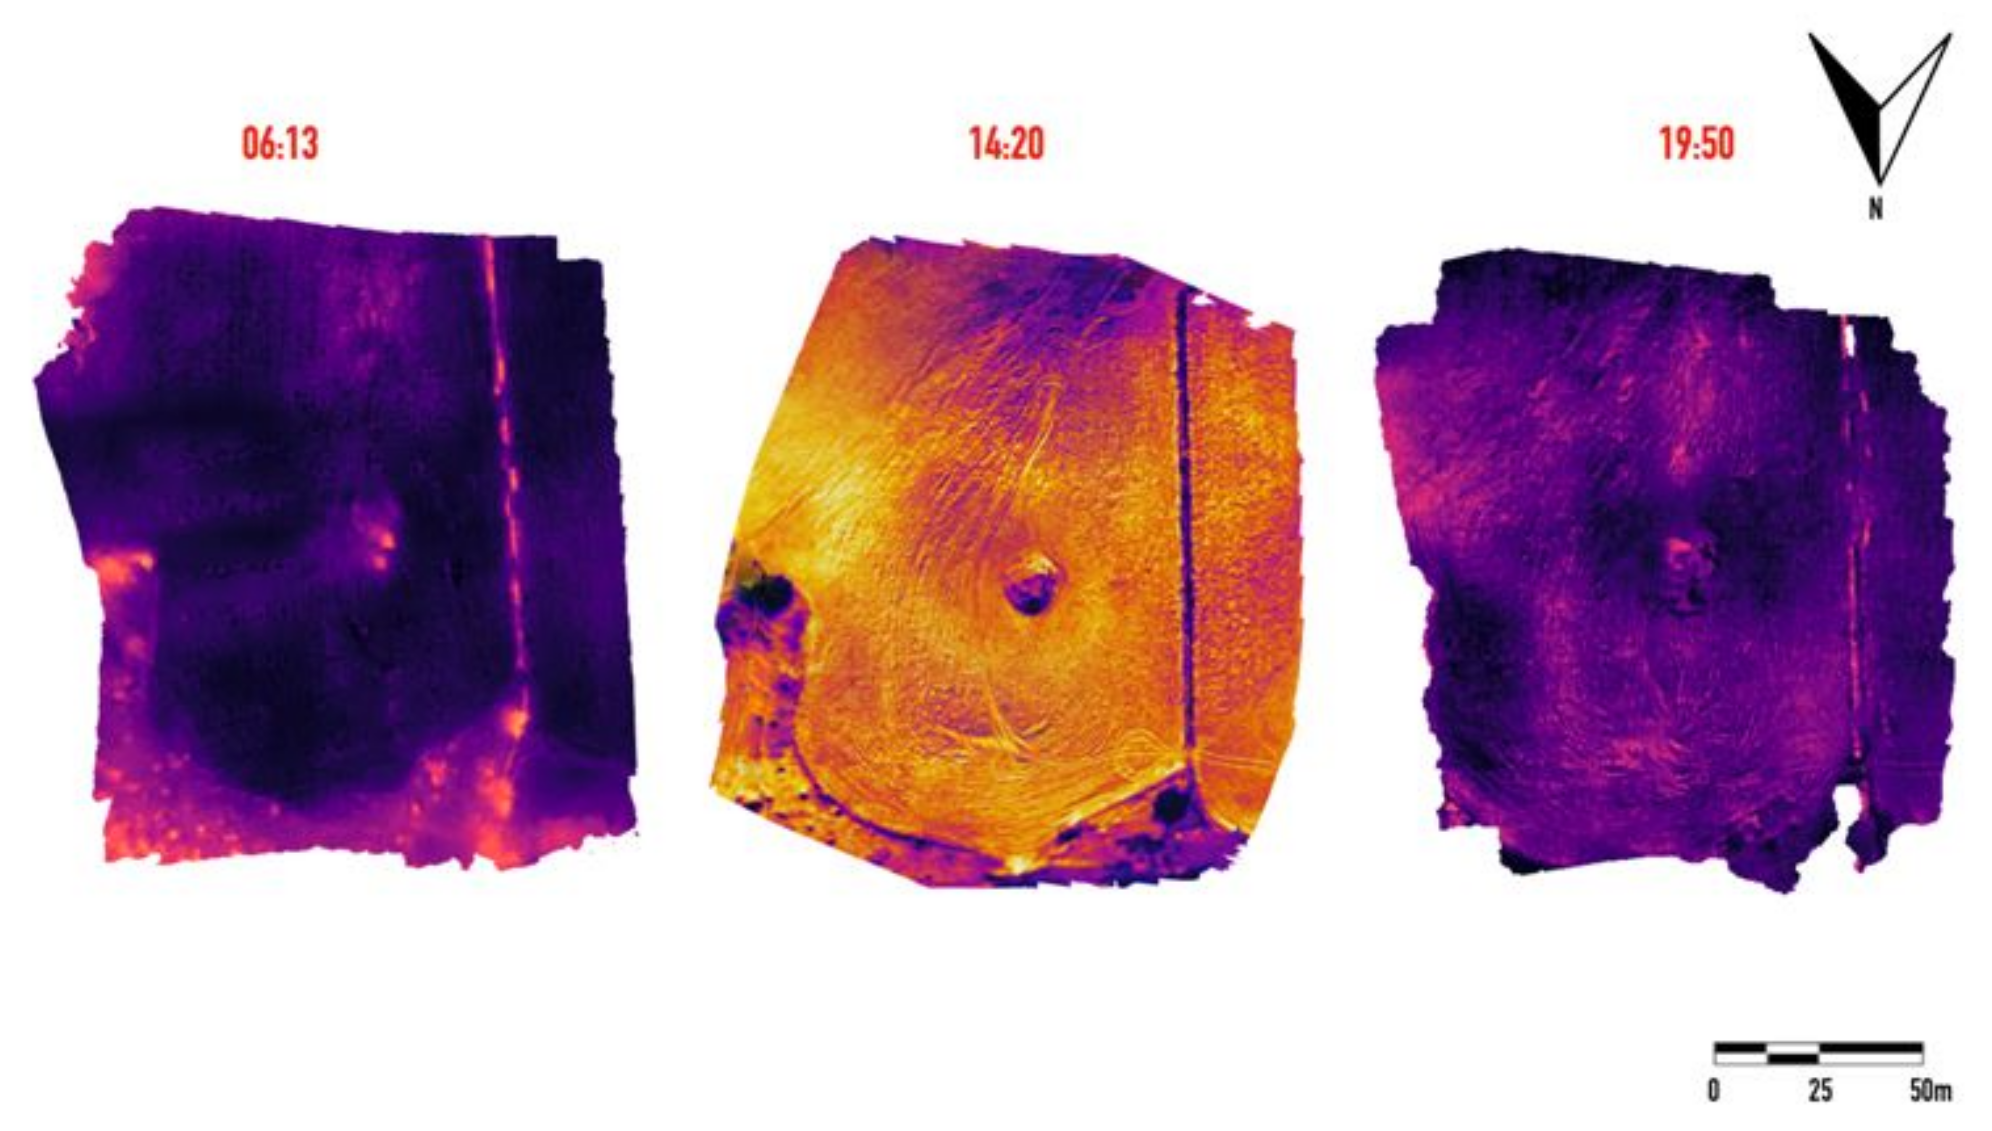
  • The thermal image must be acquired when the thermal differences are more pronounced as shown in Figure 2.
These three factors are the basis of our proposed archaeological sites detection and monitoring framework. In the following sections, we will begin with a brief literature review and proceed to discussing our methodology. We will then discuss our testing and validation results and present a general conclusion from the benefits of the methodology.
The main contribution of our work is an end-to-end framework for the detection and monitoring of archaeological sites. To achieve this goal, we also propose: (1) a two-stage multimodal depth-to-RGB and thermal-to-RGB mosaicking algorithm to align and aggregate collected images; (2) an AI-based detection algorithm to identify change regions in archaeological sites; (3) and a user interface for temporal tracking.

2. Literature Review

The term thermography indicates the recording and measurement of heat radiation using special sensors. In particular, the thermal cameras record the Thermal Radiation Infrared (TIR), which is a part of the electromagnetic spectrum included in the infrared range. Although the wavelength of visible light (i.e., perceptible to the naked eye) is between 0.4 and 0.78 μ m, that of the infrared is greater and ranges from 0.78 to 1000 μ m, as depicted in Figure 3.
In turn, this range is divided into near infrared (NIR; 0.78–2.5 μ m), mid-infrared (MIR; 2.5–10 μ m) and far infrared (FIR; 10–1000 μ m). The TIR spans over the last two categories, positioning itself between 8–15 μ m [11]; it has been determined that this is the range in which the temperature of a ground, in the form of thermal radiation, without any interference from the air temperature [12]. As Périsset and Tabbagh in [13] indicate, soil temperature depends on solar radiation and exchange with the atmosphere. The temperature that we measure on the ground derives both from infrared thermal radiation emitted by the sun (that managed to cross-unscathed, without being reflected back, the gases that form the atmosphere) and the infrared thermal radiation that is absorbed and reflected by both the materials present above or near the ground. Indeed, the different physical and chemical components of a non-homogeneous soil lead to a different absorption and consequent emission of solar radiation, which is highlighted in a different thermal radiation measured on the surface. It is precisely based on this phenomenon that the analysis of thermal images with archaeological purposes relies on the materials that are above and below the ground surface and how they absorb, emit or reflect infrared rays in different ways, based on their own composition, density and moisture content [11,14]. According to this principle, many archaeological elements can theoretically be identified in thermal images.
The problems that led to the scarce use of this technique, outside of satellite imagery, were mainly related to the high cost and the poor spatial and radiometric resolution offered. Between the 1970–80s, a large and cooled scanning radiometer was used with liquid nitrogen that recorded thermal images on long rolls of film [11,12,13]. Despite the difficulty, the methodological foundation for the use of thermography in archaeology was developed in those early years. In particular, Périsset and Tabbagh [13] and Périsset [15] conducted a series of controlled tests to quantify the thermal behavior of some archaeological elements with respect to the surrounding terrain. The work in [15] presents a summary and tests for soil thermodynamics, including abundant mathematical notation and physical properties used to understand the results, and how analysis can be applied to different archaeological contexts. This work is still considered the basis for archaeological thermography, where they demonstrate variations in thermal radiation between different elements or between parts of land with different composition, and contrast their thermal images to determine different physical properties that demonstrate substance origin. The four main physical properties that determine the variations of thermal radiation between different elements present on or in the ground are summarized as follows:
  • Thermal conductivity: A physical property that measures the ability of an element to transmit heat (or infrared heat energy) through thermal conduction. That property depends on the nature of the material and is measured in watts per meter-kelvin (W/mK).
  • Volumetric heat capacity: The property that defines the amount of heat energy that must be added to a unit of volume of a material to increase its temperature by one degree. This property depends on the density and composition of the material and is mostly, the reason, under the same light and temperature conditions, a stone will be warmer than the surrounding scattered ground.
  • Thermal inertia: The property that describes the ability of a material to vary its temperature more or less quickly because of changing external conditions. A high thermal inertia value corresponds to a material that is slower in cooling or heating up as external thermal conditions change. Water, for example, has a high value of thermal inertia, for this reason, a moist soil will maintain a more constant temperature than a dry soil as external conditions vary. This property is directly proportional to the volumetric heat capacity of a material and inversely proportional to its thermal conductivity.
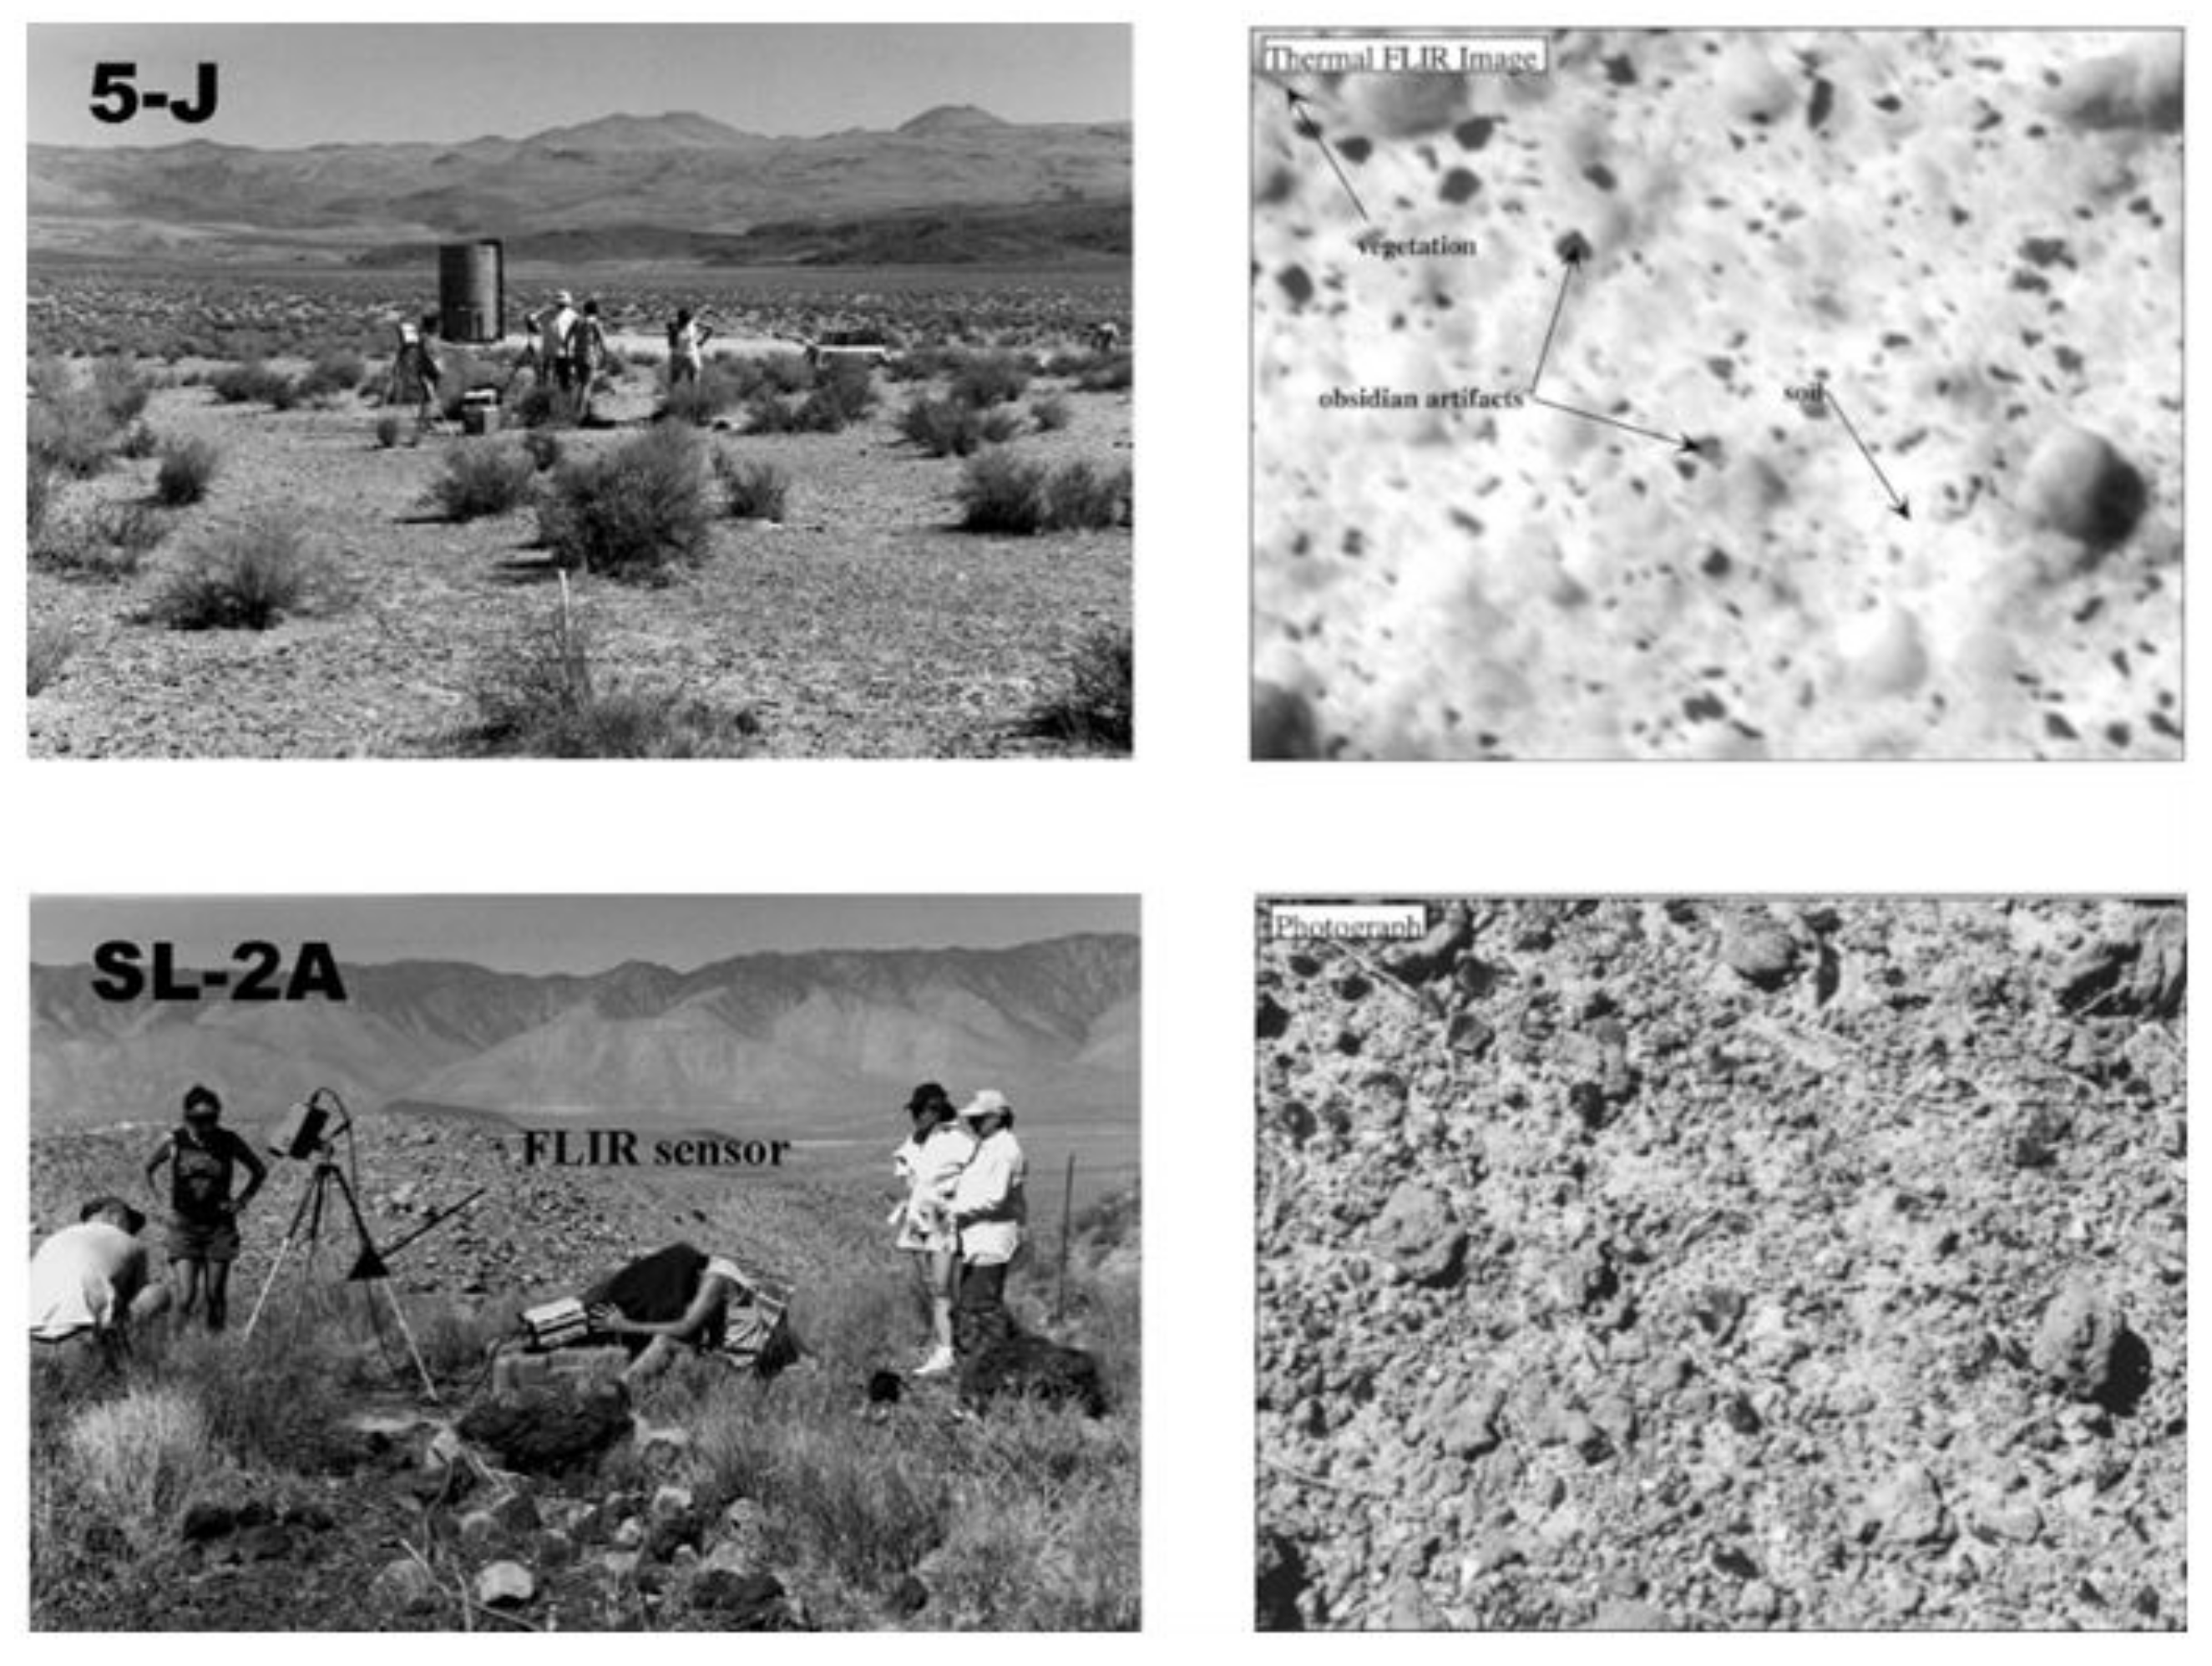
  • Thermal emissivity: A physical quantity that measures the efficiency of a material to emit or reflect thermal radiation. This property, if noticeably different between two elements, allows a visible distinction from the thermal camera. For example, an accumulation of ceramic on the surface could be very visible in a thermal image, thanks to the different emissivity of the ceramic with respect to the surrounding soil [2,13].
Principles explained by Périsset and Tabbagh in [13] refer to properties that can be found and analyzed on soils without vegetation, while in the presence of vegetation what a thermal camera can detect is not the temperature of the soil, but that of the vegetation which is determined by the transpiration of the plants. In the early 1990s, an important contribution to the use of thermography in the archaeological field came from Scollar et al. in [12], who wrote a complete review of all theories expressed in the previous two decades. Contrary to what Périsse and Tabbagh postulated, variations in the soil surface occurring over the course of a year due to vegetation growth, humidity, plowing, and other factors can hide or vary archaeological anomalies, this research demonstrated that variations in heat flow during the same day can be decisive in highlighting differences in thermal radiation due to buried archaeological elements.
Some approaches proposed installing thermal sensors on satellites and civil-use aircraft. The resolution of the sensors in these attempts was poor and insufficient to detect archaeological elements. The use of airborne platforms in other approaches, such as TIMS (Thermal Infrared Multispectral Scanner), with shots taken at a much lower altitude than satellites, had a resolution of only 5 m. Yet, it allowed a single identification of an ancient road network [16]. The few examples of aerial thermography using high-resolution sensors, nevertheless, required an equipment cost that was still beyond most researchers’ budgets [17].
A new development phase occurred in the early 2000s, when conventional handheld thermal cameras used by a helicopter [18] or mounted on a platform to analyze the different concentrations of artifacts scattered on the ground was introduced. This is depicted in Figure 4. Several scholars began to use the same thermal camera in different approaches. The authors in [19] mounted the camera under a kite, while authors in [20] mounted the camera under a helium balloon. The use of handheld cameras mounted on a ground-based or an aerial platform allowed a punctual use of thermography, focused at an intra-site level. The authors in [21] were the first to use these cameras and a manned motor parachute in investigating a major research area, which also included off-site areas at a local scale.
A large array of technological applications and scientific studies are supported by drones due to their ability in collecting high-resolution image data [23,24,25]. The recent technological advances in infrared imaging facilitated the development of high-resolution commercial thermal cameras with smaller size and weight. These cameras can now be mounted under drones to generate high-resolution thermal images, with a GSD of two centimeters flying at 40 m of altitude, while significantly reducing the cost of the missions carried out. The use of programmable drones guarantees performing flights in a precise time frame. The timing of an aerial thermal survey is one of the most crucial factors in determining its success, as imagery acquired just an hour apart typically shows archaeological elements in different ways [26,27]. Due to the numerous factors that might influence the thermal characteristics of certain features, identifying the best time for data collection, whether seasonally or during a given diurnal cycle, remains difficult and is considered to be one of the limitations of thermography. To date, the best examples in this field come from the aforementioned work carried out by the authors in [27,28]. In particular, the research carried out at the Blue J site in New Mexico made it possible to highlight the importance of making multiple flights during the same day to identify the best time slot for recording based on the variation in the daily thermal cycle. In this case, the researchers performed four flights with thermal camera between 20 and 21 June 2013 (9:58 p.m., 5:18 a.m., 6:18 a.m., 7:18 a.m.) and a flight with standard camera in RGB (5:45 a.m.). The results showed that only in the flight performed before dawn, at 5:18 a.m., the greatest number of character archaeological anomalies were evident. This was probably because stones of the collapsed walls and masonry structures absorb heat longer than the surrounding desert soil, making the stones more visible in the colder hours of the morning than at the beginning of the night when the ground still holds heat from daily solar radiation [27]. The work carried out by the same team at the Enfield Shaker Village site in New Hampshire also highlighted the importance of carrying out a multitemporal thermal recognition to have a complete thermographic analysis of the survey area. In this case, the flights were carried out at different times of the same day, but also in different months of the year (October 2016, May and June 2017, October 2017). The results obtained showed, for this area, the maximum visibility of the archaeological anomalies in the time span ranges from immediately after sunset to a few hours later, while the contrast (albeit still visible) decreased in flights carried out before dawn, only to disappear almost completely after sunrise [28].
Airborne and satellite photography remote sensing has become an important part of archaeological study and cultural resource management. Remote sensing, when combined with field research, allows for quick and high-resolution documentation of old sites [29,30,31]. It also makes it possible to document and monitor old sites that are unreachable to fieldwork, destroyed, or threatened [32,33]. Archaeologists have been experimenting with computational approaches in remote sensing-based archaeological prospection since the mid-2000s [34,35].
Convolutional neural networks (CNNs) are increasingly being used to solve difficult computer vision problems including face detection, self-driving automobiles, and medical diagnostics [36]. Although deep learning requires huge training datasets, transfer learning allowed pre-trained CNNs to be used in domains where training datasets were limited, such as archaeology [37,38]. Machine-learning techniques and algorithms have gradually been included into remote sensing-based archaeological research in recent years, allowing for the automatic discovery of sites and characteristics. Most of these applications have used high-resolution datasets such as LiDAR [39] or WorldView imagery [40,41] to detect small-scale characteristics. Others have attempted to monitor archaeological sites and human influence, such as urban sprawl and looting, using multitemporal data [42,43].
The remainder of the paper is organized as follows: Section 3 introduces the materials and methods. Section 4 discusses and compares the results of our proposed framework. Finally, conclusions are drawn in Section 5.

3. Materials and Methods

3.1. Drone-Based Archaeological Aerial Monitoring Challenges

As many heritage sites are currently threatened by anthropogenic and natural destruction, heritage detection and monitoring is essential for the preservation and integrity of cultural heritage structures. Although a long history of experimental data shows that depth imaging and aerial photogrammetry and thermography are powerful tools that can reveal a wide range of both surface and subsurface archaeological features, hurdles including the excessive deployment cost, and the spatial resolution of aircraft or satellite-acquired imagery have restrained the use of these tools in cultural heritage detection. Recent advances in the sophistication of vision-based sensors, artificial intelligence algorithms, and service drones are revolutionizing archaeologists’ ability to prospect for ancient cultural features across large areas at a low cost. These advances offer potentially transformative perspectives on the archaeological landscape and bridge the gap between satellite, low-altitude airborne, and terrestrial sensing of historical landscapes [27,28].
Due to the availability of several sensing devices with high precision and accuracy, data processing and storage capabilities using cloud computing, and affordable machine learning and big data analysis technologies, digitization of reconnaissance flights is ramping up. Digitization of flights improved the conventional practices of analyzing archaeological landscapes. It also allowed archaeologists to use real-time sensing data to detect and forecast possible changes and anomalies in often inaccessible built cultural heritage. Researchers have proposed using drone platforms with visible, infrared, multispectral, hyper-spectral, laser, and radar sensors to reveal archaeological features otherwise invisible to archaeologists with applied nondestructive techniques [44]. To improve the performance of mapping in archaeological applications, multiple photogrammetry software platforms were developed to capture imagery datasets and create digital models or orthoimages. These models are used to classify and analyze the mapping results [9].
In archaeology, materials on and below the ground surface absorb, emit, transmit, and reflect thermal infrared radiation at different rates due to differences in composition, density, and moisture content. Accordingly, aerial thermographic imaging is used for the detection of a wide range of archaeological features when (1) there is a sufficient contrast in the thermal properties of archaeological features and the ground cover; (2) the archaeological materials are close enough to the surface to be affected by heat flux; and (3) the image is acquired at a time when such differences are pronounced. Multiple pieces of proprietary software have been developed allowing almost automated mapping workflows, from acquisition to analysis of mapping results, for archaeological applications. Common issues that arise when using these pieces of software include the automated alignment of visual image frames captured out of specific timeframes, the alignment of small thermal images that lack sufficient variability, and the time-consuming 3D reconstruction for spatial analysis [45].
Aerial multimodal monitoring of cultural heritage provides a better understanding of long-term settlement patterns and historical change [46]. The early identification of changes in cultural heritage structure and the preventive conservation are critical for the preservation of cultural sites and monument. In this work, we propose a framework for the detection and monitoring of archaeological sites, and a user interface to assess and track changes and deterioration over time. Our proposed framework is intended to combine multiple imaging datasets to improve archaeological feature visibility. We compare the proposed framework to the procedure carried out using proprietary software and discuss the results.

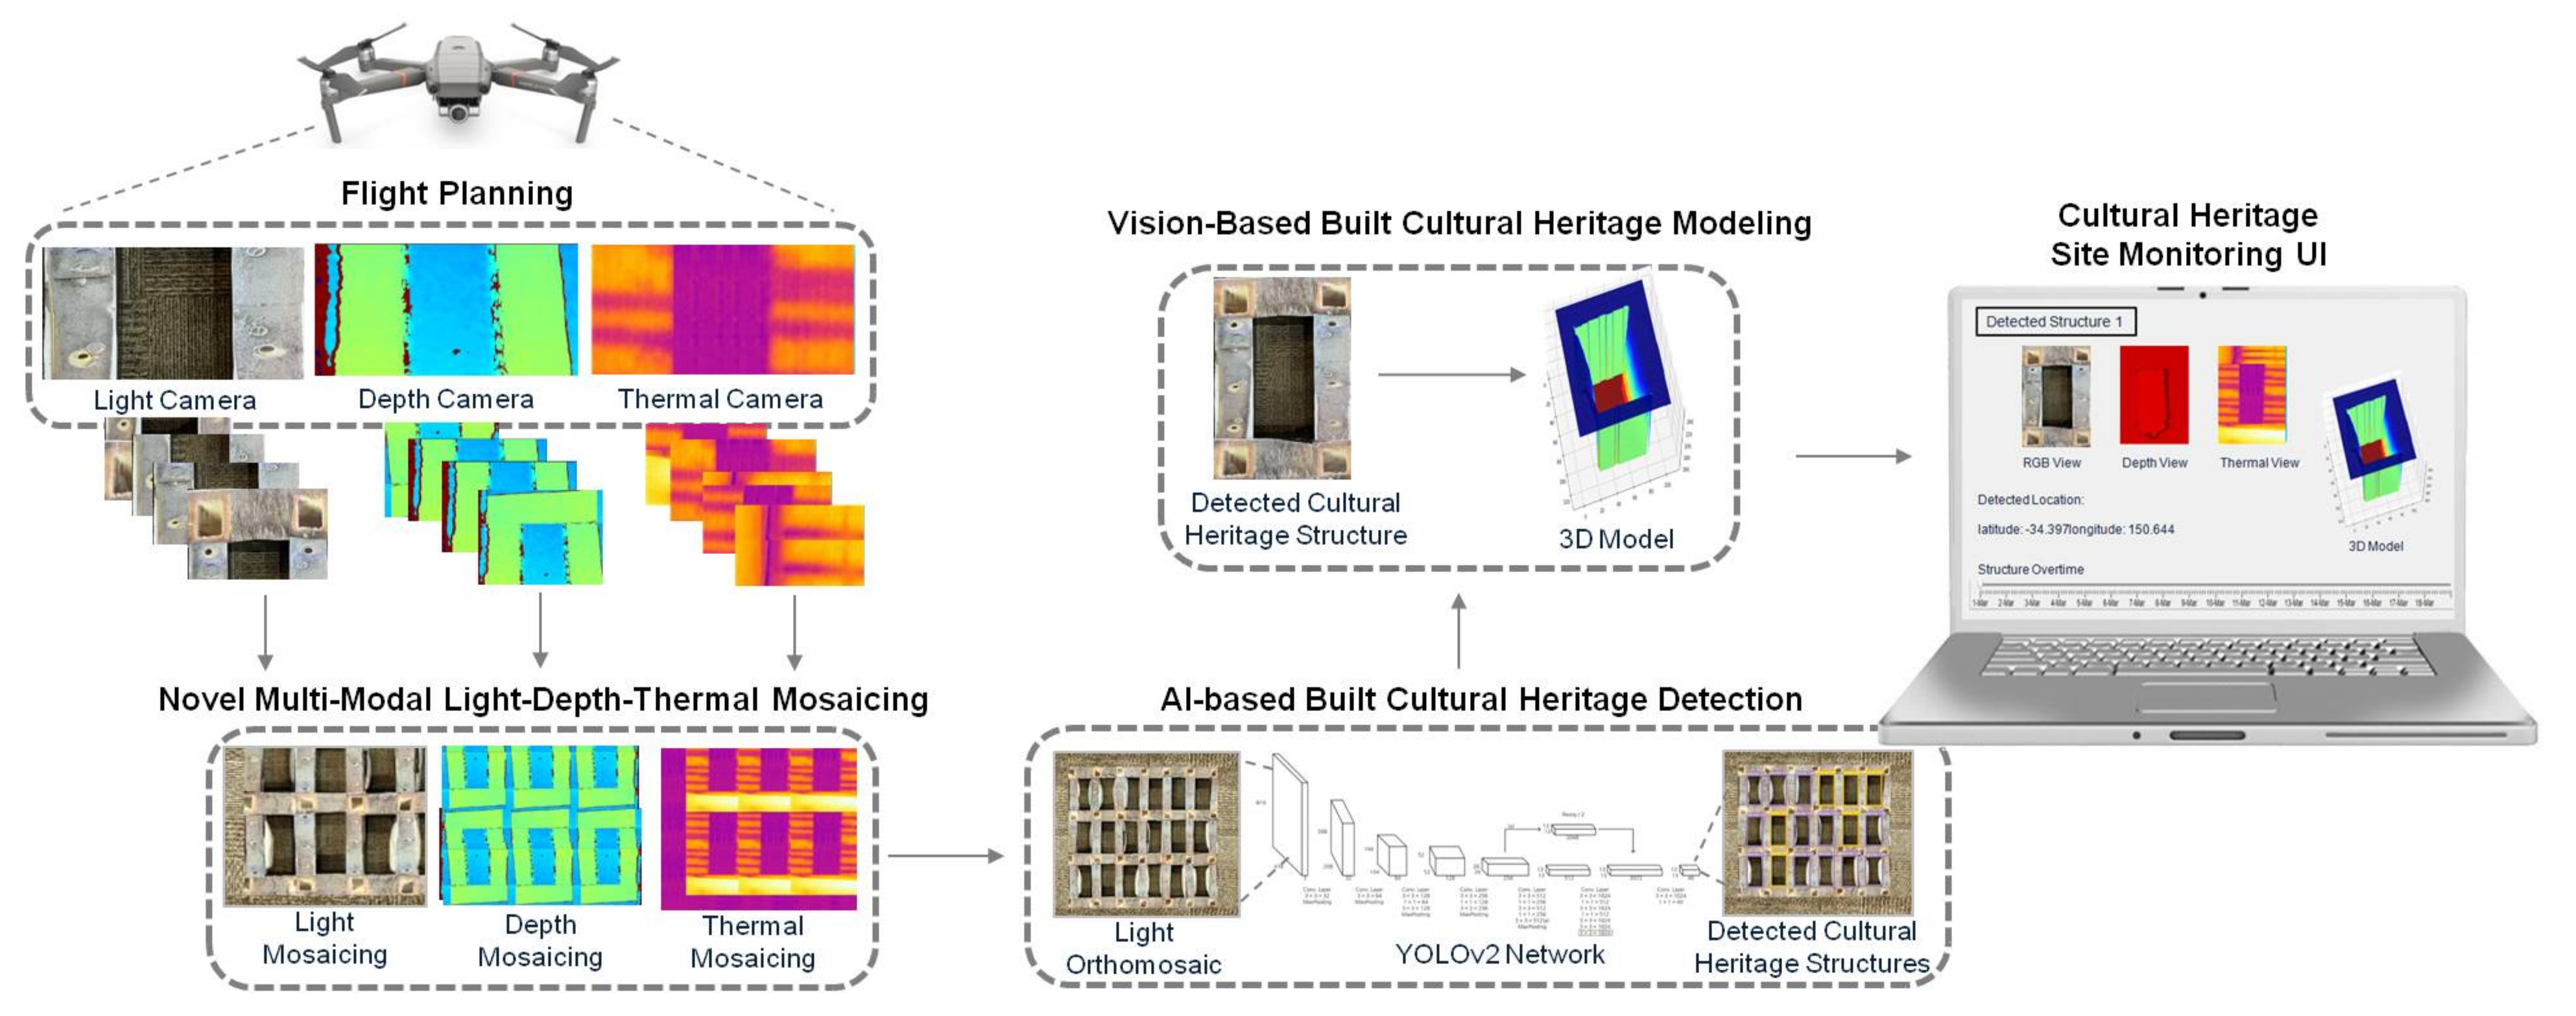
3.2. Proposed Framework for Archaeological Aerial Monitoring

The central unit of the proposed framework is a DJI Mavic Dual Enterprise drone controlled using a GCS (Ground Control Station) to inspect an archaeological landscape and monitor architectural cultural heritage sites. The drone integrates an on-board RGB and thermal cameras and an external depth camera for low-altitude data acquisition. The on-board cameras are a visual 4K Ultra HD sensor with a bitrate of 100 Mbps and a thermal sensor with a resolution of 160 × 120. The external depth camera is an Intel RealSense Depth Camera D435 with a resolution of up to 1280 × 720, connected to a controlling unit and fixed to the bottom of the drone. As depicted in Figure 5, the framework begins with flight planning where a set of waypoints is assigned using a mission planning software on the GCS to control the flight path. During the scheduled flights, the drone captures calibrated RGB, depth, and thermal videos for the inspected area. After the completion of an inspection flight, recorded videos are uploaded to a cloud server for further processing and analysis. We retrieve the videos recorded and apply a multimodal two-stage depth-to-RGB and thermal-to-RGB mosaicking algorithm to generate three orthomosaics. We use the generated mosaics for built cultural heritage detection, 3D modeling, temporal tracking, and anomalies reporting. Analysis reports are accessible to the end user through a user interface, as explained in Section 4.3.

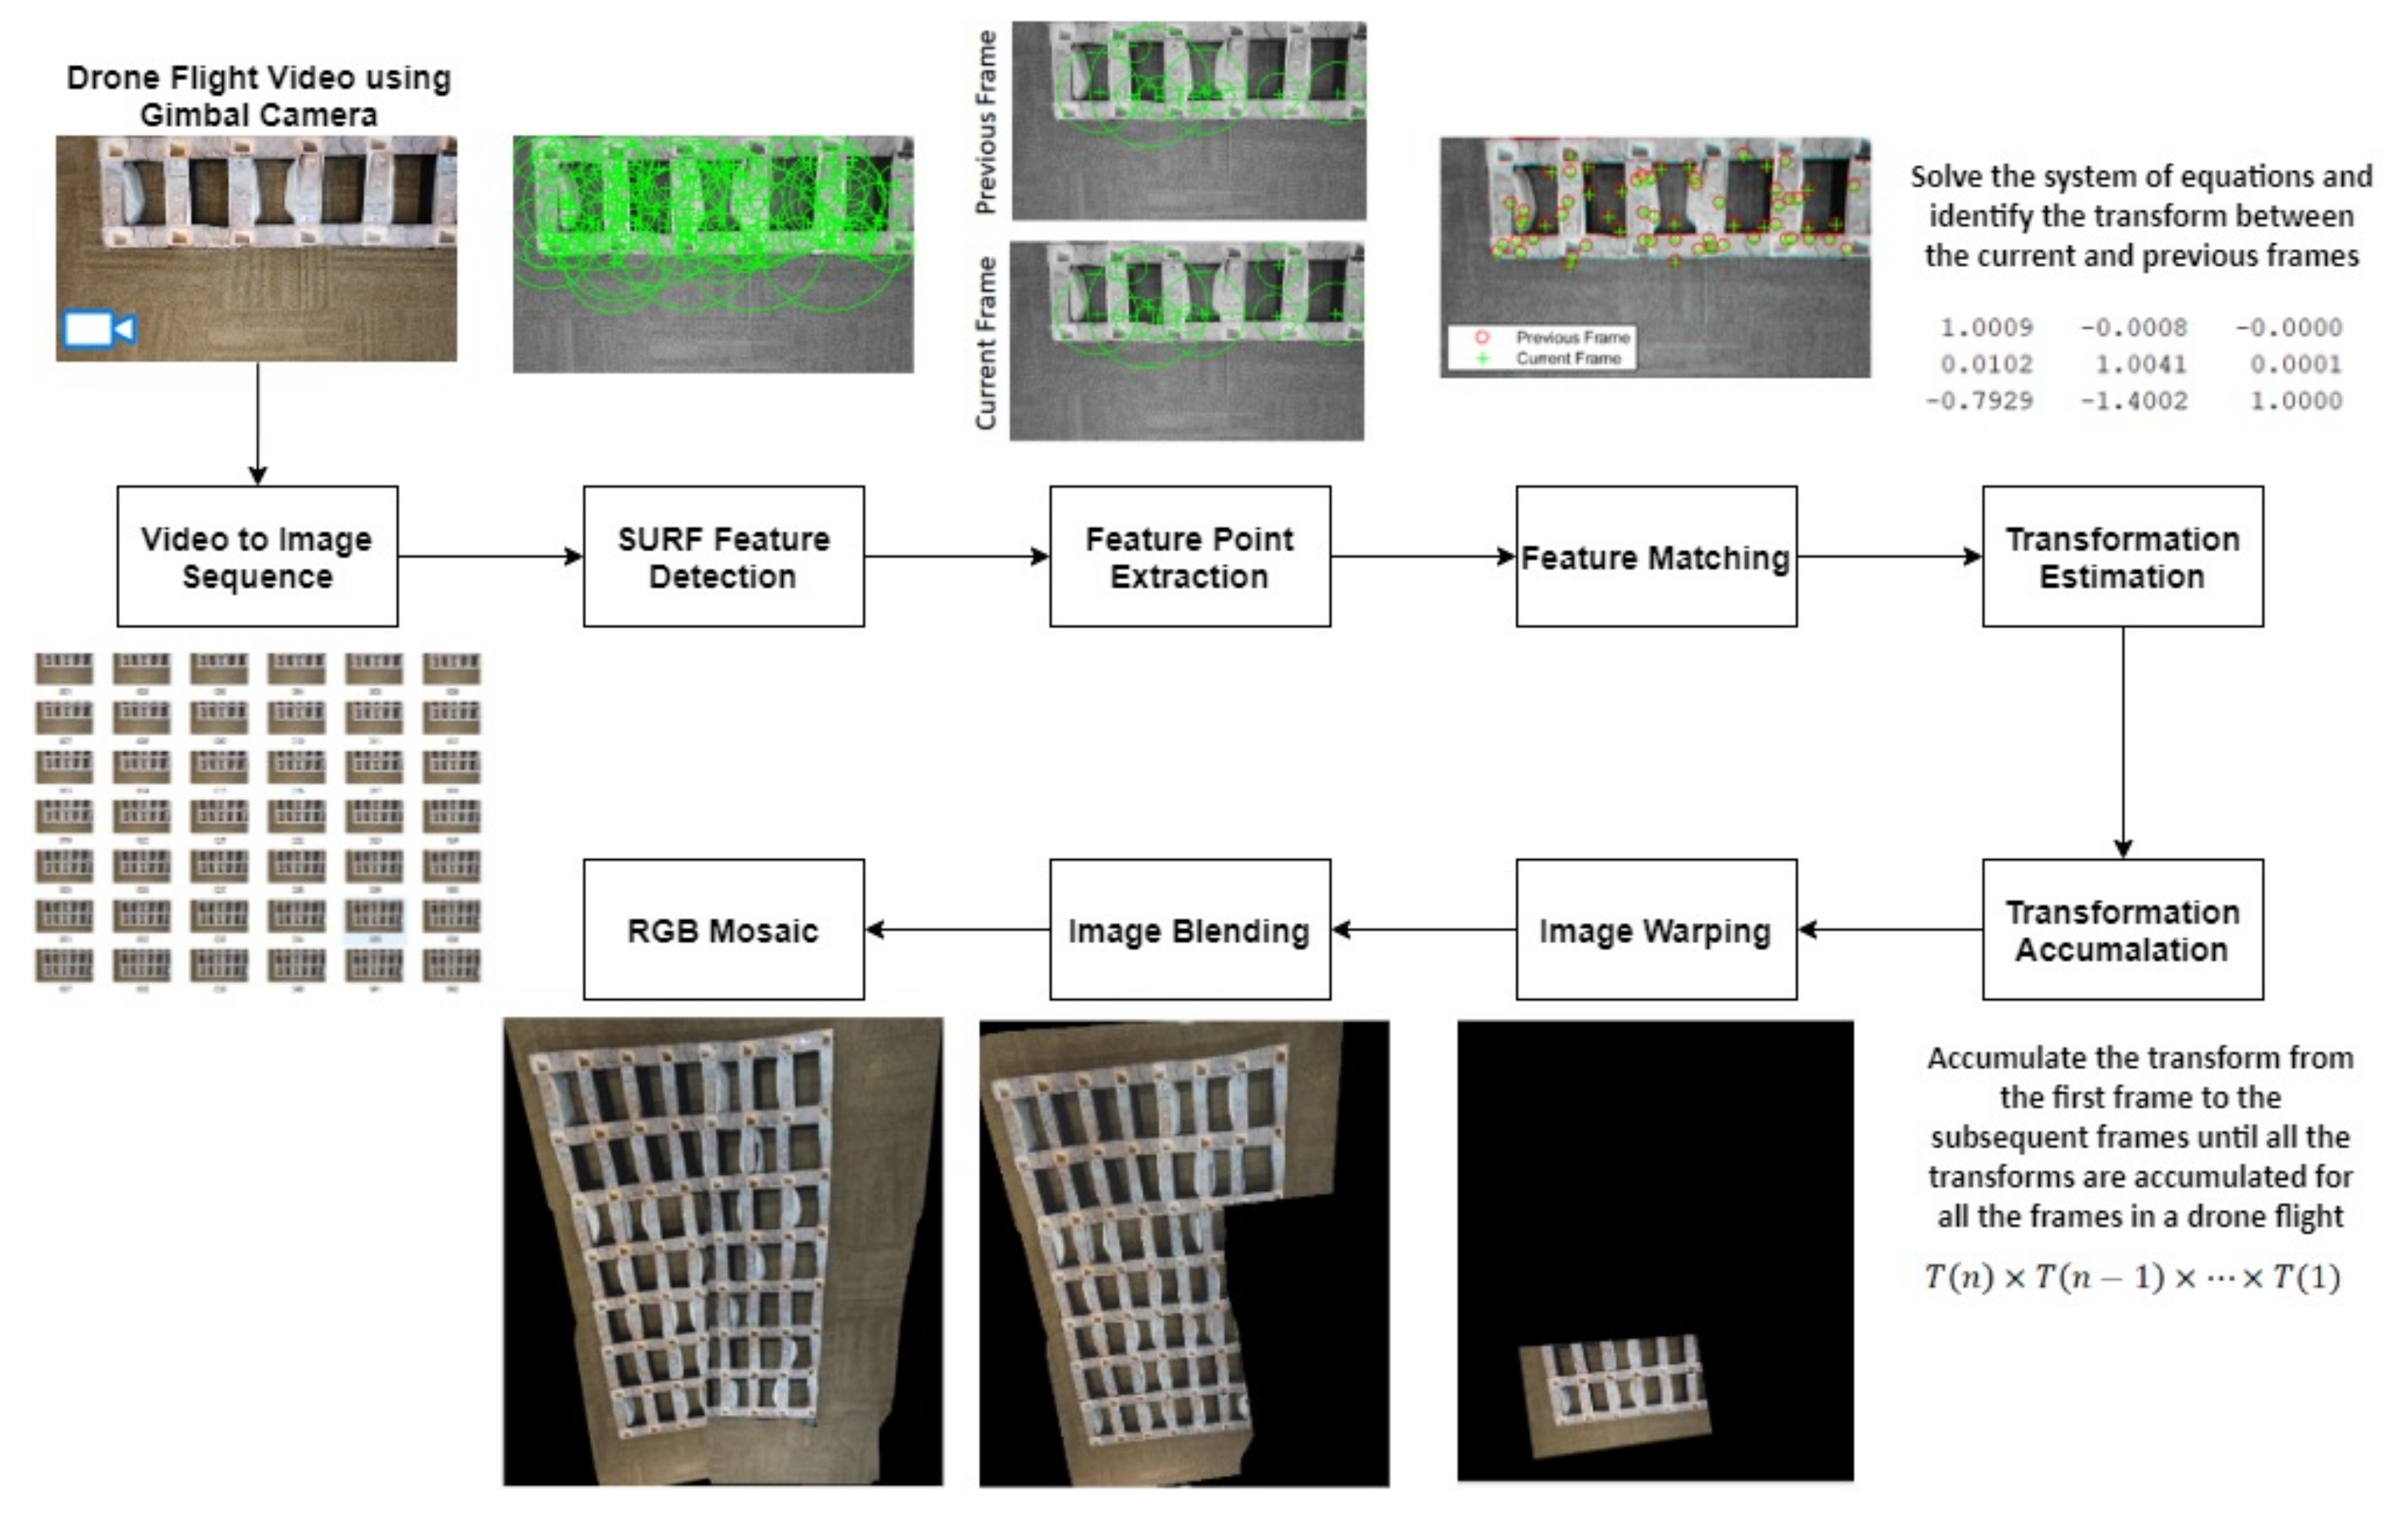
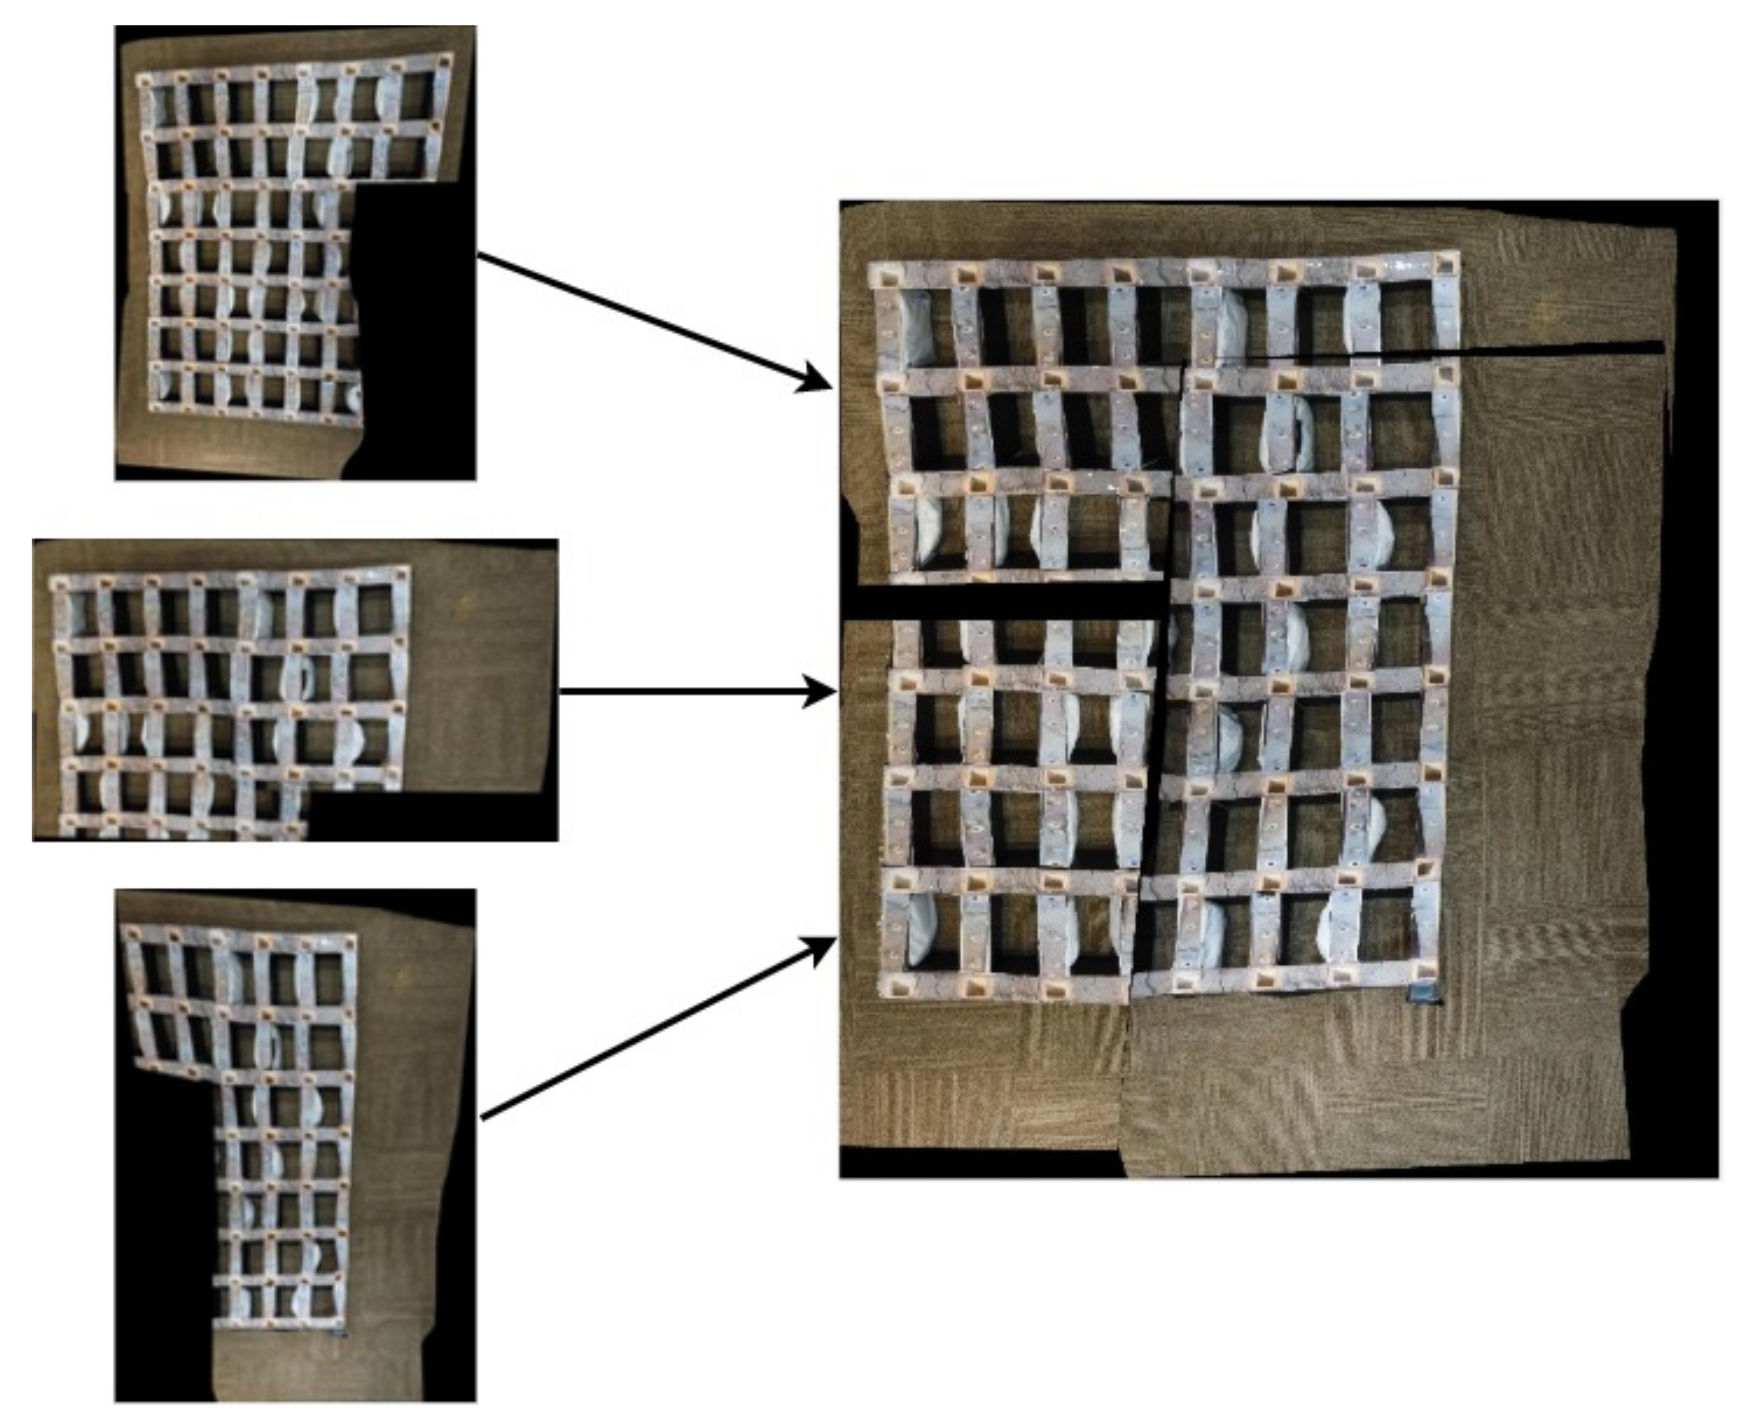
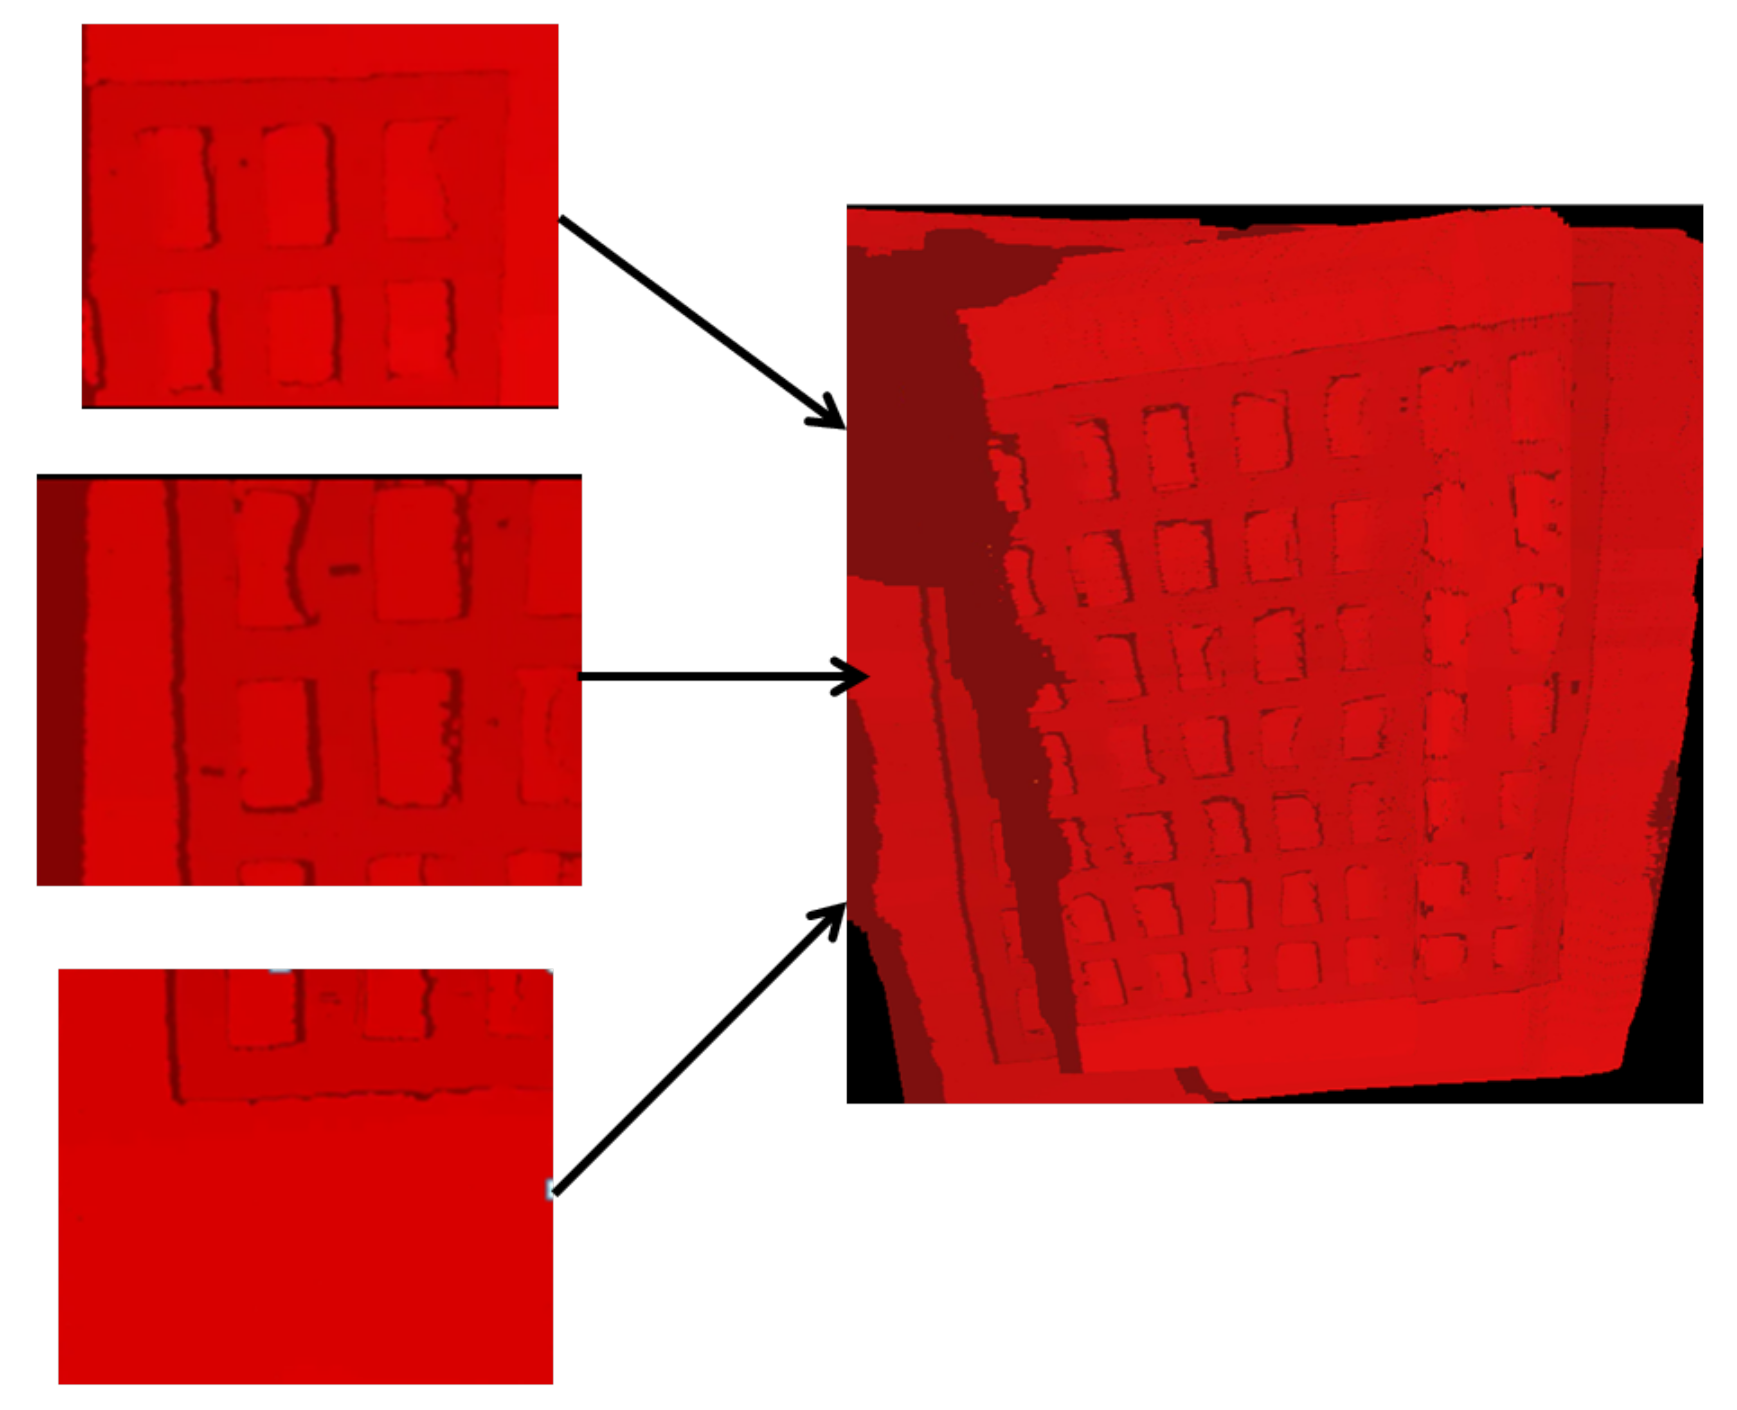
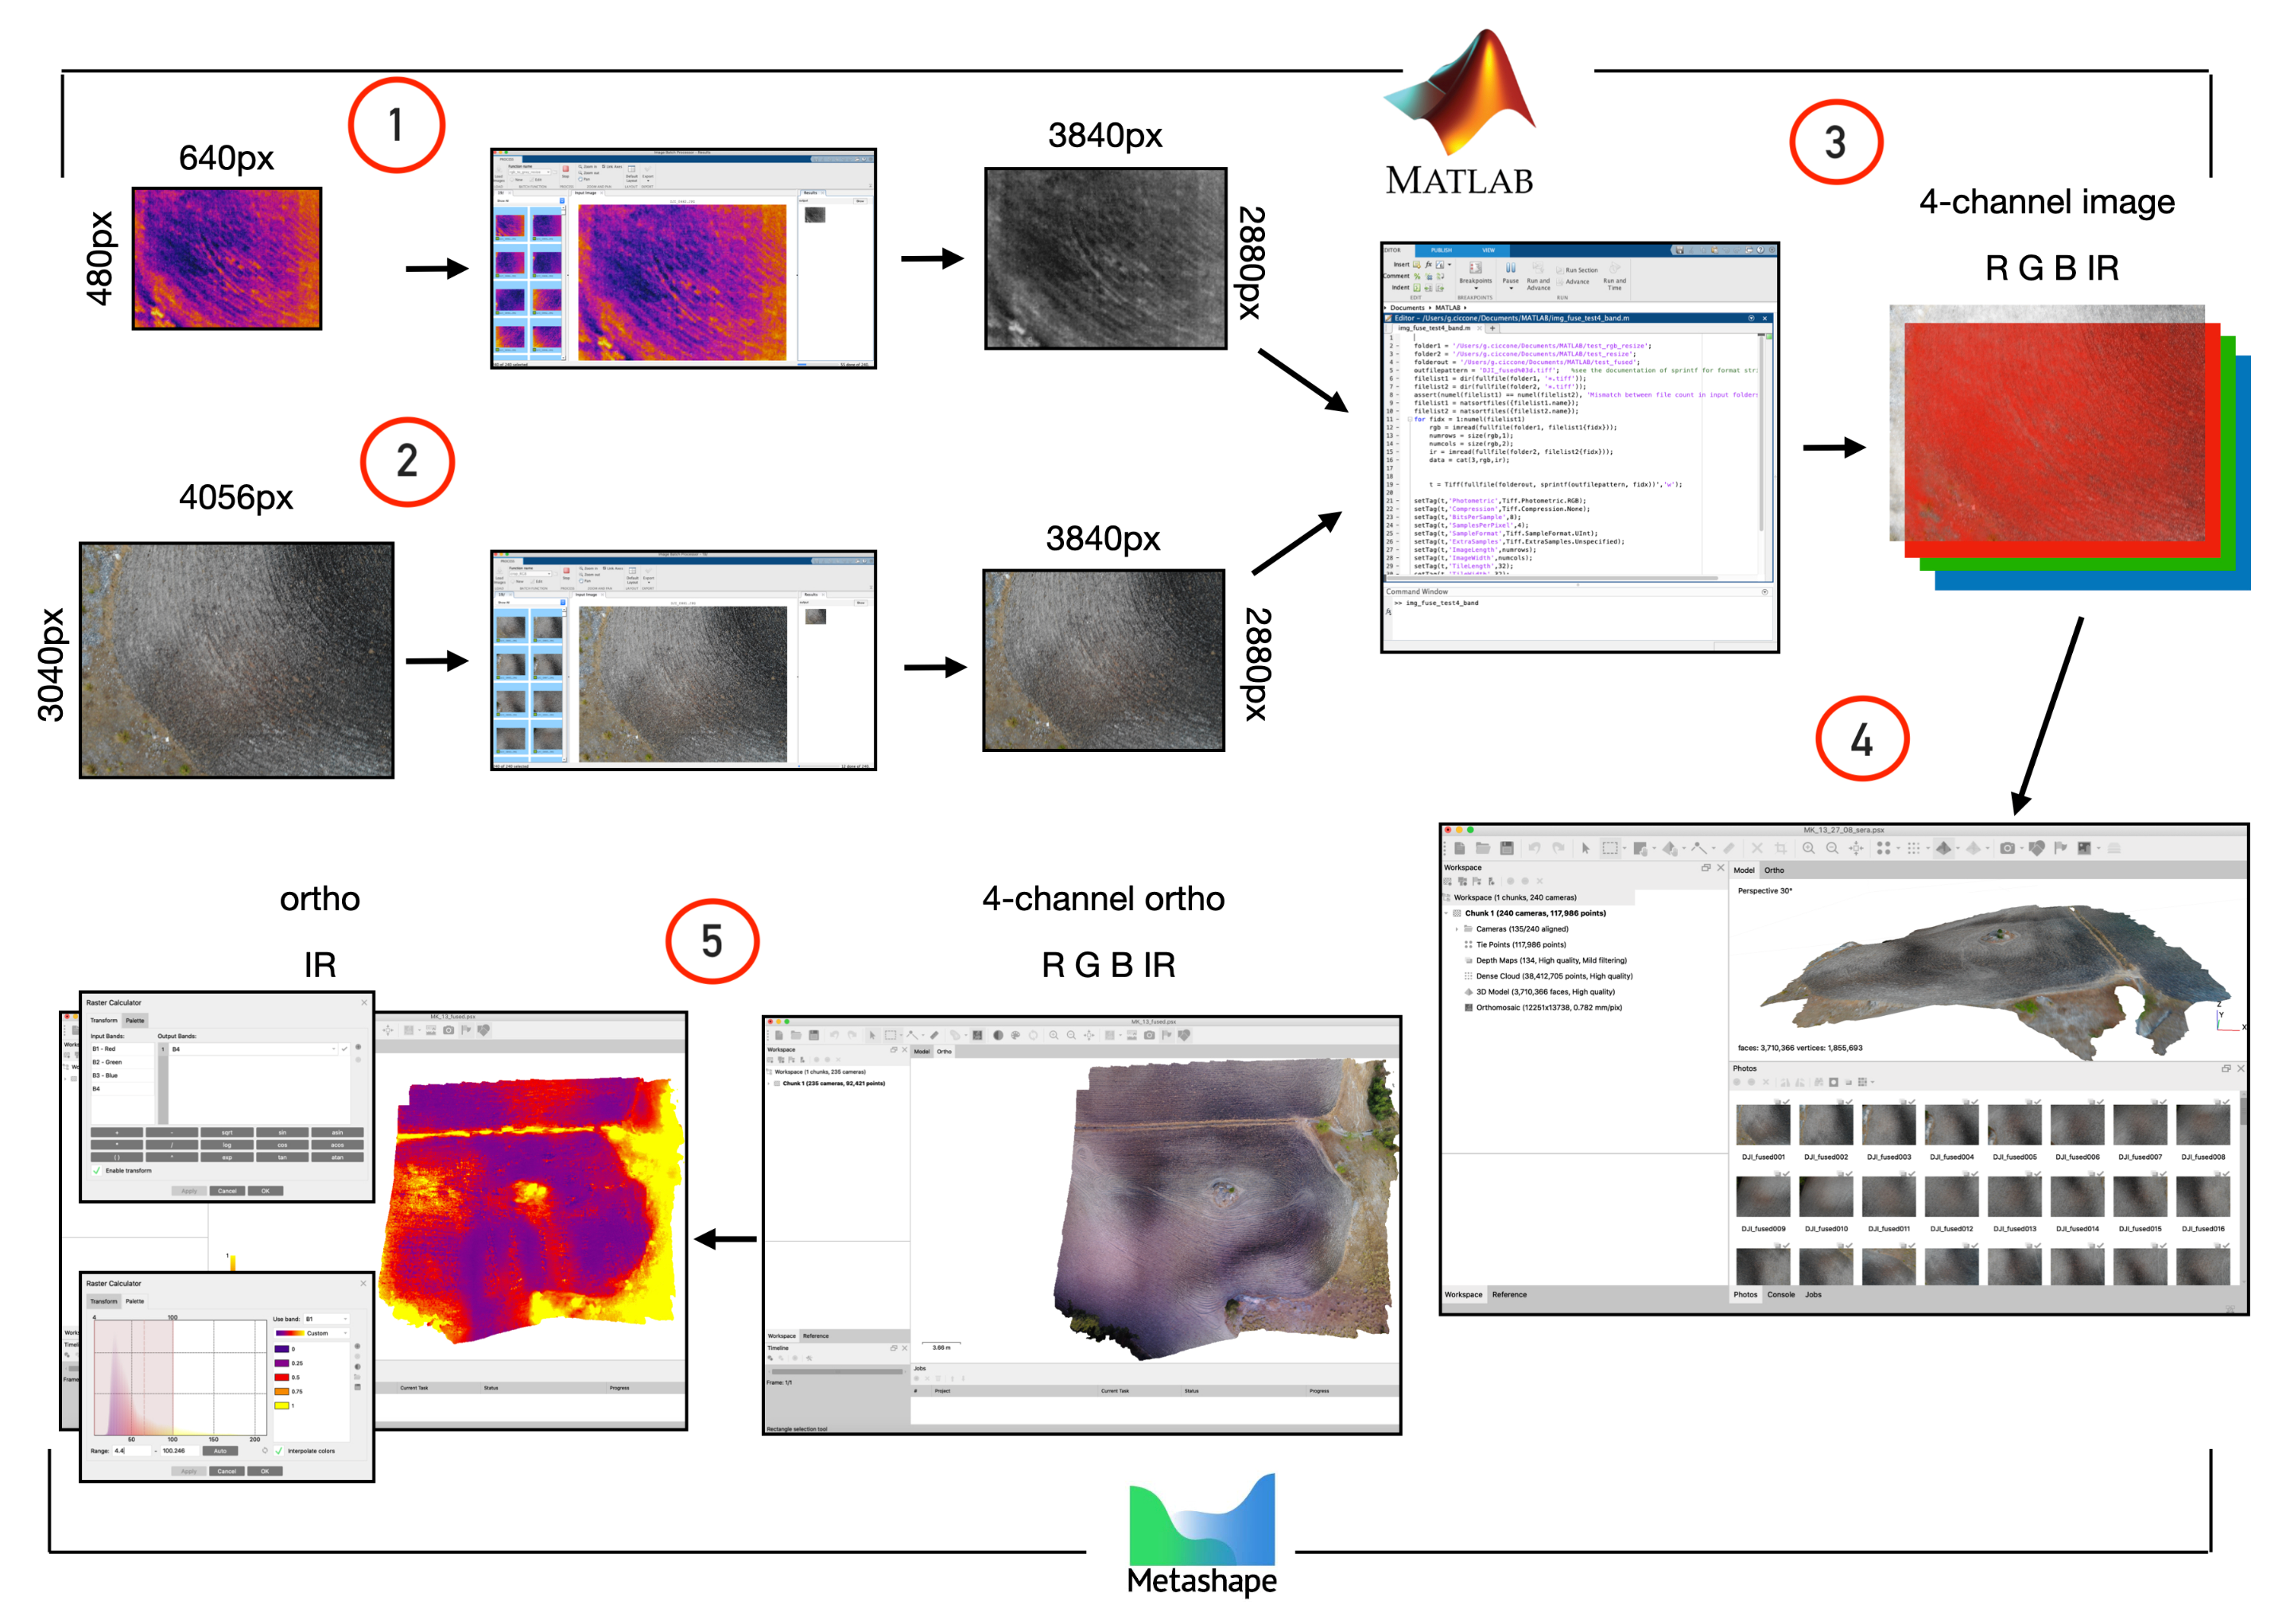
3.3. Proposed Multimodal Depth-RGB and Thermal-RGB Mosaicking Algorithm

The deployment of service drones in archaeological aerial monitoring while controlling the altitude produces images with an improved quality compared to the ones produced using the conventional methods and at a lower cost. Despite the advantages obtained, the drone-based approach creates a higher number of images to cover the same area of one satellite or aerial photograph. This creates a need for a stitching algorithm that forms a comprehensive view of the scene. Accordingly, we develop an algorithm that uses the drone flight recordings to provide three orthomosaics of the entire examined area in RGB, depth, and thermal scales. The algorithm begins with creating image sequences from the recorded RGB, depth, or thermal flight footage. Each image frame goes through a preprocessing stage that reduces the computational speed of the mosaic process by resizing the frame. Motion estimation is followed by panorama construction through image warping and blending in our proposed approach.
We first detect the Speeded-UP Robust Features (SURF) for the current and prior greyscale frame sequences in the motion estimation. The blob features, which are candidate points of interest in a frame, are detected through this approach. Then, for each pair of successive frames, we extract the SURF features to determine the corresponding points between them. To estimate the motion of the unique points between the frames, one-to-one matching between the points on the current frame and the preceding one is required. We use transformation estimation to estimate the transform between the current and prior frames after retrieving the locations of the matched points in the frames.
Based on the matched pair of points, this algorithm produces a transformation matrix that defines the motion from one frame to the next.
t 11 t 12 t 13 t 21 t 22 t 23 t 31 t 32 1
The more matched pairings with higher confidence, the more accurate the estimated transformation will be at the cost of additional computations. We then use Equation (2), where “n” represents the current frame and “T” represents the transformation matrix between two successive frames, to accumulate the transform from the first frame to the subsequent frames until all transforms for all frames in a flight video are accumulated.
T ( n ) × T ( n 1 ) × × T ( 1 )
We use image warping to create the panorama of the full flight video, which applies a geometric change to the image based on the estimated transformation matrix. Each frame can then be relocated to its corresponding position in the panorama, resulting in a fully aligned orthomosaic. The binary mask is then used to apply image blending. The same transformation matrices used for the RGB frame sequences are used to estimate motion on depth, and thermal frames. Figure 6 depicts the whole mosaic pipeline, including intermediate outputs, for an RGB flight video.

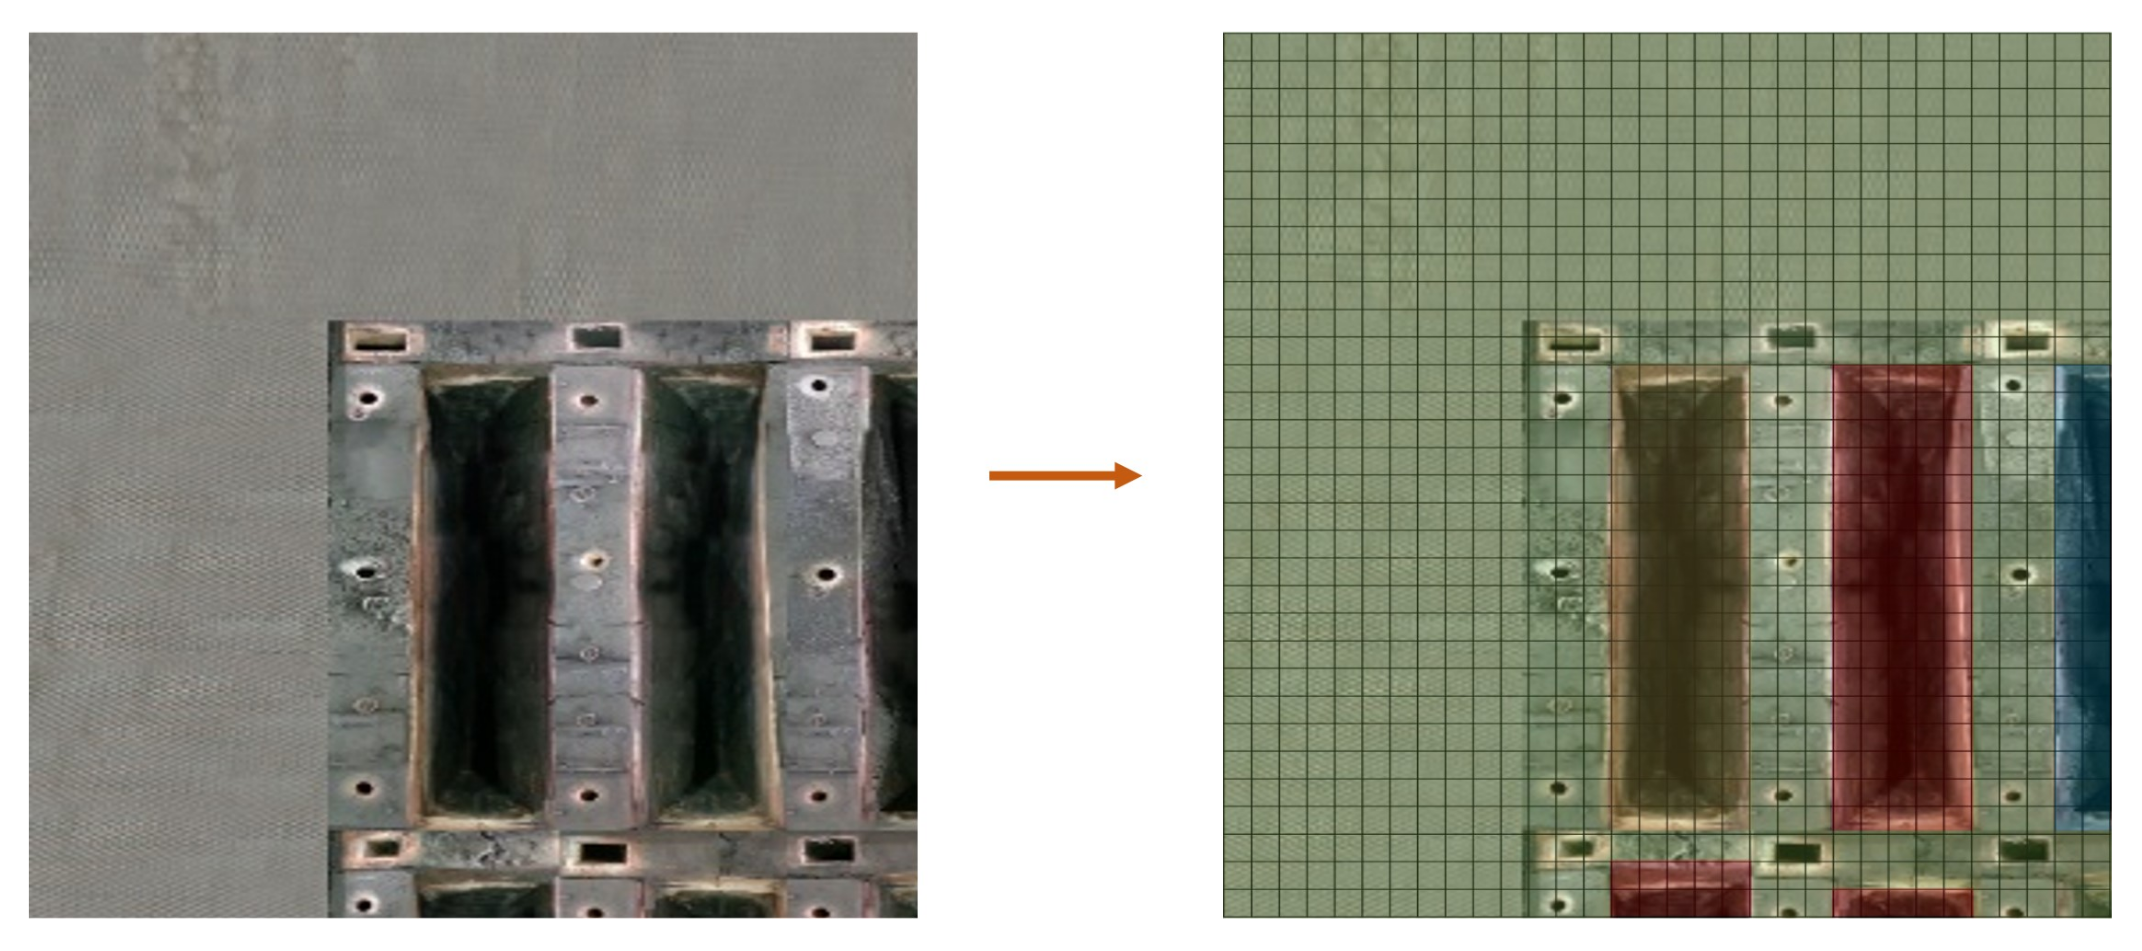
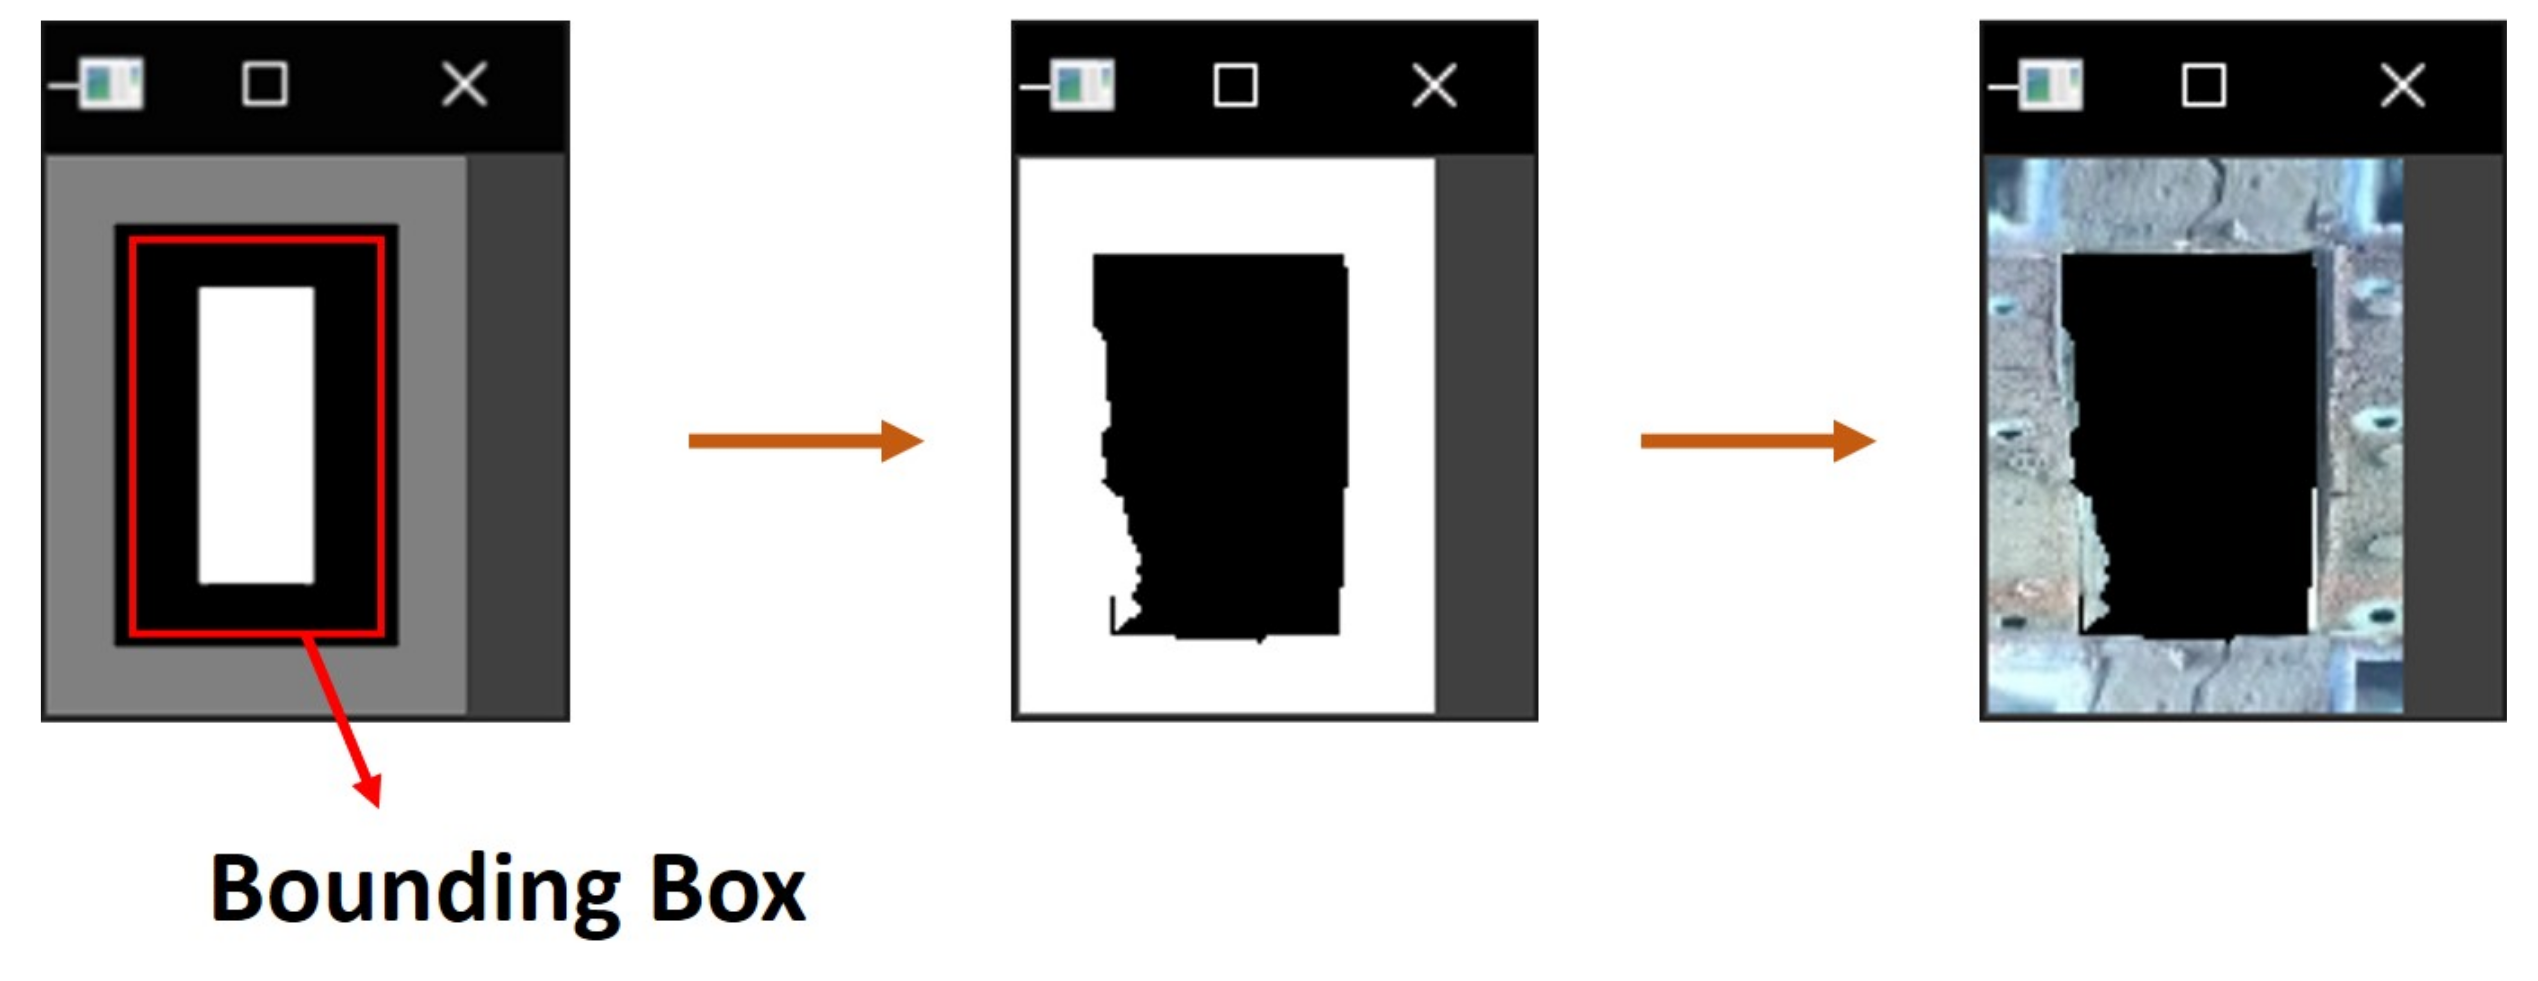
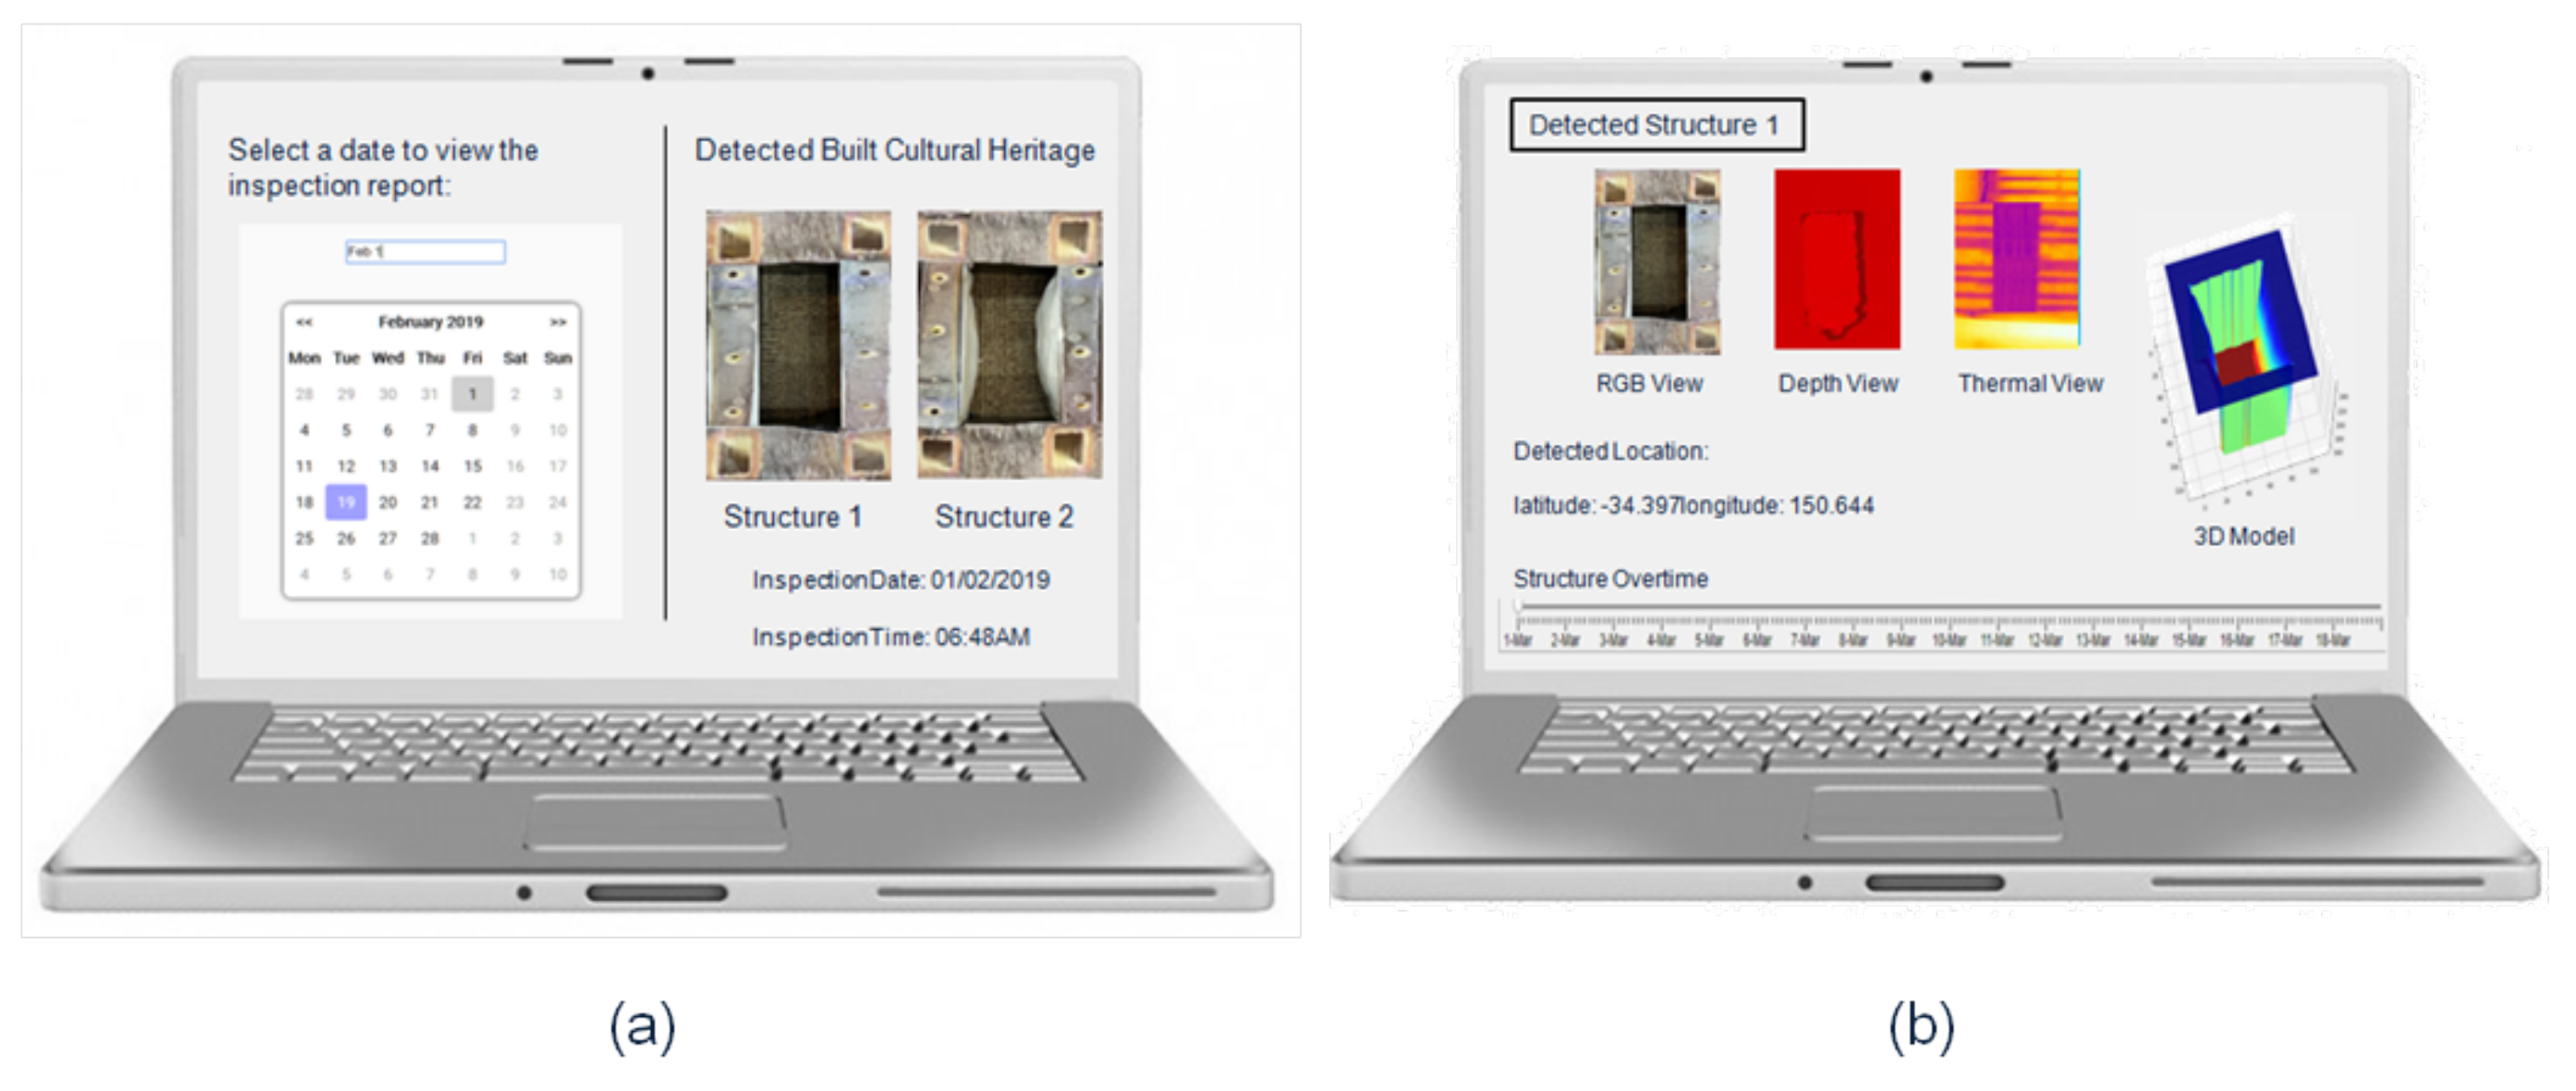
3.4. Proposed Built Cultural Heritage Detection Algorithm

We develop a neural network-based detection framework to handle the orthomosaics produced through the video mosaicking algorithm. The proposed framework uses a pre-trained YOLO model that detects built cultural heritage within an orthomosaic. The detected bounding boxes of the cultural heritage structures are then handed a segmentation tool for post-processing. We used a YOLOv2 network trained for a 512 × 736 input sample images. Each sample is associated with a file containing the class and the bounding box information for each area in the sample. Input samples are automatically resized to the specified size in the network parameters.
The YOLO architecture involves a convolutional neural network used to extract visual features from the input samples. Assuming multi-level grid shaped cultural heritage area, each sample is divided into multi-level grid with S × S , ( S [ 8 , 16 , 32 ] ) cells, and the network predict whether a heritage structure exists in each cell in addition to four float parameters defining the bounding box of the structure. The prediction target for each pit is stored in a tensor with the following format:
S × S × [ C x , C y , w, h], S = 32 for the output probability map as in Figure 7. where:
-
C x = x-axis centroid of the bounding box.
-
C y = y-axis centroid of the bounding box.
-
w = Width of the bounding box.
-
h = Height of the bounding box.

Data Generation

To create a reliable network for architectural cultural heritage detection, an unbiased data set of a large size is essential. The input to the network requires an orthomosaic for various heritage structures captured using drones. To facilitate the process of data acquisition, we built a physical model in the lab environment simulating a grid of cultural heritage structures. We used tissue boxes to simulate the depth and placed heated metal bars on top of each box to cater for the thermal difference expected between the floor and the structure of interest. We simulated deformation over time using newspapers of different volumes. We used this model to generate most of the data by artificially creating samples of different orthomosaics using images of individual structures for the purpose of training and testing our proposed algorithms. For that, we programmed a data generation tool that arranges the raw site images from a given data source with randomized order and orientation to generate different orthomosaic samples. The generated samples are also submitted for randomizing grid size and visual shift. Figure 8 shows samples of the raw heritage structure images we used.
The generated data set is processed through a data augmentation tool to increase the data set size by 600%. We designed the augmenter to generate copies of each original sample while randomly applying horizontal and vertical shifting, zooming, individual manipulation of RGB channels, brightness adjustment, and perspective transformation.

3.5. Cultural Heritage Structure Modeling

The segmentation tool we use receives detected heritage structure images from the YOLO detector then visually isolates two layers from the structure image containing its surface and base. We use the segmentation tool to create a 3D representation for the detected built heritage.
The segmentation algorithm targets the top and bottom layers of the heritage structure, so they can be used for further analysis. We use the graph-cut segmentation technique to separate the layers, which is a semi-automatic segmentation method that requires some pixels in the target image to be labeled as definite background and others as definite foreground (seed pixels). The algorithm then assigns large labeled weights to the corresponding pixels and estimates the weights for the rest of the pixels based on their color and adjacency properties [47]. The dimensions of detected structure’s bounding box are used to create the temporary foreground and background labels for each layer which are defined as a small filled rectangle inside the bounding box and a thick empty one outside it as shown in Figure 9.

4. Validation and Results

In this section, we validate our proposed aerial monitoring framework by discussing the end-to-end deployment results of our system.

4.1. Multimodal Depth-RGB and Thermal-RGB Mosaicking Algorithm Testing Results

Validation of the proposed system requires above surface large-scale archaeological site, so we built a replica of one in the lab and flew the drone indoors. This allowed us to validate the collected measurements and functionality under different lighting conditions and through multiple low-altitude flight patterns. The proposed algorithm was successfully able to generate the orthomosaics in all flights. A current drawback we are working on solving is the accumulation of transformation estimations, which leads to a deterioration in the performance with time. To mitigate this drawback, we deploy an AI-based detection using YOLO in the subsequent steps of the processing pipeline. Figure 10 illustrates the results of an indoor flight. Figure 11 and Figure 12 show the RGB and depth mosaicking results, respectively, in our lab environment.

4.2. Built Cultural Heritage Detection Algorithm Testing

We generated 2000 synthetic orthomosaics for training and testing our detection algorithm using our data generation tool and our physical model. 60% of the generated mosaics were used for training, 20% for validating, and 20% for testing. The structure detector model was trained on 15 epochs, with a mini-batch size of 16. The detector was able to recognize 90% of the structures in the testing set. We use Piecewise learning rate scheduling to decay the learning rate over time, set to an initial value of 0.001. A mini-batch RMSE of 0.04 and a mini-batch loss value of 5.1 × 10 3 were achieved.

4.3. End-to-End Integration Testing and Validation

We performed end-to-end integration testing using the physical model we developed in the lab. We used a software planner to plan multiple flights over a month following a Z pattern. Our service drone completed its lab flight at a height of 3 m then uploaded the light, depth, and thermal videos to the cloud server. Uploaded videos were processed by a computing server powered by MATLAB where our proposed novel multimodal depth-RGB and thermal-RGB mosaicking algorithm was applied to produce orthomosaics of the inspected area. The output mosaics were then processed using YOLO and the structures in our physical model were detected using all three imaging models. The inspection report was then displayed on our user interface allowing the user to analyze the detected structures and visualize the changes in these structures over time. The temporal tracking ability facilitates the process of built cultural heritage preservation. Our Proposed user interface is shown in Figure 13.
The user can select between the RGB, depth, and thermal views to analyze and visualize the thermal and depth anomalies of a detected structure. The interface also provides the user with an interactive 3D model of the structure and records the data to facilitate the process of temporal tracking and heritage preservation.

4.4. Built Cultural Heritage Detection Using Photogrammetry Software

To validate our framework results, we used state-of-the-art commercial photogrammetry software to develop a workflow for the detection of built cultural heritage in line with the scientific literature on thermal photography outside the archaeological world [48]. In the preprocessing stage, the developed workflow converts the collected thermal frames into the grayscale and resizes them using Algorithm A1. The RGB frames are also cropped using Algorithm A2 to match the size of the thermal frames, then merged with them to produce single 4-band TIFF images. Merging thermal and RGB frames is implemented using Algorithm A3. Matlab (R2019B) is used at this stage. The images are then processed using a proprietary photogrammetry software (Agisoft Metashape 1.3.0), from the stitching and 3D reconstruction to the extraction of single thermal orthophoto. The workflow developed is illustrated in Figure 14.
By comparing the results obtained from both approaches, it is evident that we managed to cost-effectively replicate the mosaicking and alignment functionalities of state-of-the-art commercial photogrammetry software while adding a new depth-based modality and providing a more convenient user interface for temporally monitoring changes in multimodal views of archaeological sites.
The framework proposed is transferable and applicable for other research applications. It facilitates the process of obtaining and comparing RGB, depth, and thermal orthomosaics from flight missions carried out throughout the day, specifically after sunset and before sunrise, in each survey area. It can be also used to evaluate the thermal variations occurring when varying the recording time within a day to identify the best time frame in which the thermal anomalies of the soil are most evident. We have tested our proposed approach in Mount Kassar site (Castronovo di Sicilia, PA). Results showed that during the short period before sunrise, the variations in thermal radiance are greater, and consequently the anomalies of the ground are more evident as shown in Figure 15.

5. Conclusions and Future Work

In this paper, we propose a drone-based framework for multimodal detection and modeling of built cultural heritage. We control the service drone using a GCS to inspect an archaeological landscape and monitor architectural cultural heritage sites. We mount RGB, depth, and thermal sensors on the drone for low-altitude data acquisition. After the completion of an inspection flight, recorded videos are uploaded to a cloud server for further processing and analysis. We use a proposed two-stage multimodal depth-to-RGB and thermal-to-RGB mosaicking algorithm to generate orthomosaics of the monitored area. The generated mosaics are passed to our detection algorithm to detect cultural heritage sites within the inspected area with an accuracy of 90% and a root mean squared error of 0.4. End-users receive detailed reports after each inspection flight, including 3D models of the detected cultural heritage sites. The proposed user interface accumulates the reports of detected sites for temporal tracking. We tested our proposed framework in an indoor lab environment where we built a replica of a large-scale archaeological site, and concluded it efficiently detects and documents cultural heritage structures and facilitates the process of preservation. We compared our framework with a workflow we developed for the detection of built cultural heritage using state-of-the-art commercial photogrammetry software. The results showed that we managed to cost-effectively replicate, to some extent, the mosaicking and alignment functionalities of commercial photogrammetry software while adding a new depth-based modality and increasing flexibility. We also proved that our proposed framework can be used to identify the best time in which thermal anomalies in the ground are chromatically more evident on the images. Our framework’s main limitation is the accumulation of transformation estimations in the mosaicking algorithm, which leads to deterioration in the performance with time. We have addressed this limitation by deploying the AI-based detection in the subsequent steps of the proposed framework. Further research on mosaicking techniques is needed to address this limitation better.

Author Contributions

Conceptualization, A.K., G.C., T.B. and M.G.; data curation, A.K., G.C., T.B. and M.G.; formal analysis, A.K., G.C., T.B. and M.G; funding acquisition, A.K., G.C., T.B. and M.G.; investigation, A.K., G.C., T.B. and M.G.; methodology, A.K., G.C., T.B. and M.G.; project administration, A.K., G.C., M.A., T.B. and M.G.; resources, A.K., G.C., T.B. and M.G.; software, A.K., G.C., T.B. and M.G.; supervision, A.K., G.C., M.A., T.B. and M.G.; validation, A.K., G.C., T.B. and M.G.; visualization, A.K., G.C., T.B. and M.G.; writing—original draft, A.K., G.C., M.A., T.B. and M.G.; writing—review and editing, A.K., G.C., M.A., T.B. and M.G.. All authors have read and agreed to the published version of the manuscript.

Funding

The research was funded by Abu Dhabi University, Faculty Research Incentive Grant (19300483—Adel Khelifi), United Arab Emirates. Link to Sponsor website: https://www.adu.ac.ae/research/research-at-adu/overview (accessed on 30 October 2021).

Data Availability Statement

Not available.

Conflicts of Interest

The authors declare no conflict of interest.

Appendix A

Algorithm A1: Function to convert and resize the infrared images in Matlab
f u n c t i o n r e s u l t s m y i m f c n ( i m )
i m g r a y r g b 2 g r a y ( i m )
r e s u l t s i m r e s i z e ( i m g r a y , 6 )
Algorithm A2: Function to crop the RGB images in Matlab
f u n c t i o n r e s u l t s m y i m f c n ( i m )
t a r g e t S i z e [2880 3840]
r c e n t e r C r o p W i n d o w 2 d ( s i z e ( i m ) , t a r g e t S i z e )
r e s u l t s i m c r o p ( i m , r )
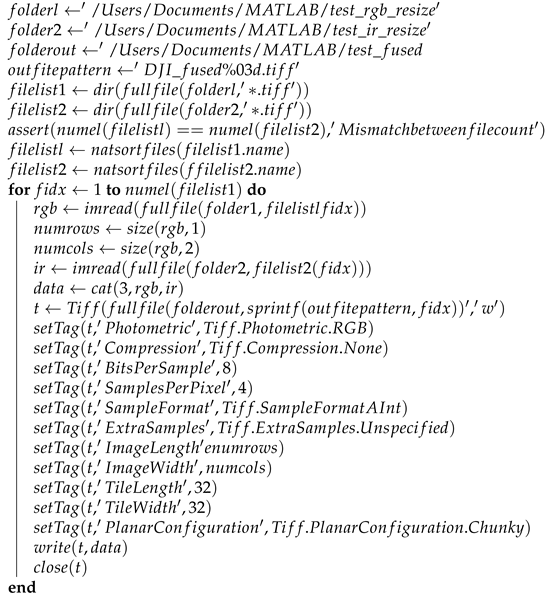
Algorithm A3. Merging IR and RGB images using Matlab
Applsci 11 10424 i001

References

  1. Fritsch, D.; Klein, M. Design of 3D and 4D Apps for Cultural Heritage Preservation. In Digital Cultural Heritage; Ioannides, M., Ed.; Lecture Notes in Computer Science; Springer: Cham, Switzerland, 2018; Volume 10605. [Google Scholar] [CrossRef]
  2. Tabbagh, A. Essai surles conditions d’application des mesures thermiques à la prospection archeologique. Ann. Gkophys. 1973, 29, 179–188. [Google Scholar]
  3. Mercuri, F.; Zammit, U.; Orazi, N.; Paoloni, S.; Marinelli, M.; Scudieri, F. Active infrared thermography applied to the investigation of art and historic artefacts. J. Therm. Anal. Calorim. 2011, 104, 475–485. [Google Scholar] [CrossRef]
  4. Fernandes, H.; Summa, J.; Daudre, J.; Rabe, U.; Fell, J.; Sfarra, S.; Gargiulo, G.; Herrmann, H.G. Characterization of Ancient Marquetry Using Different Non-Destructive Testing Technique. Appl. Sci. 2021, 11, 7979. [Google Scholar] [CrossRef]
  5. Moropoulou, A.; Avdelidis, N.P.; Karoglou, M.; Delegou, E.T.; Alexakis, E.; Keramidas, V. Multispectral Applications of Infrared Thermography in the Diagnosis and Protection of Built Cultural Heritage. Appl. Sci. 2018, 8, 284. [Google Scholar] [CrossRef]
  6. Jarząbek-Rychard, M.; Lin, D.; Maas, H.-G. Supervised Detection of Faç ade Openings in 3D Point Clouds with Thermal Attributes. Remote Sens. 2020, 12, 543. [Google Scholar] [CrossRef] [Green Version]
  7. Pisz, M.; Tomas, A.; Hegyi, A. Non-destructive research in the surroundings of the Roman Fort Tibiscum (today Romania). Archaeol. Prospect. 2020, 27, 219–238. [Google Scholar] [CrossRef] [Green Version]
  8. Kelly, J.; Kljun, N.; Olsson, P.-O.; Mihai, L.; Liljeblad, B.; Weslien, P.; Klemedtsson, L.; Eklundh, L. Challenges and Best Practices for Deriving Temperature Data from an Uncalibrated UAV Thermal Infrared Camera. Remote Sens. 2020, 11, 567. [Google Scholar] [CrossRef] [Green Version]
  9. Parisi, E.I.; Suma, M.; Güleç Korumaz, A.; Rosina, E.; Tucci, G. Aerial platforms (uav) surveys in the vis and tir range. Applications on archaeology and agriculture. Int. Arch. Photogramm. Remote Sens. Spat. Inf. Sci. 2020, XLII-2/W11, 945–952. [Google Scholar] [CrossRef] [Green Version]
  10. Casana, J.; Wiewel, A.; Cool, A.; Hill, A.; Fisher, K.; Laugier, E. Archaeological Aerial Thermography in Theory and Practice. Adv. Archaeol. Pract. 2017, 5, 310–327. [Google Scholar] [CrossRef] [Green Version]
  11. Cool, A.C. Aerial Thermography in Archaeological Prospection: Applications & Processing. Master’s Thesis, Department of Anthropology, University of Arkansas, Fayetteville, NC, USA, 2015. [Google Scholar]
  12. Scollar, I.; Tabbagh, A.; Hessse, A.; Herzog, I. Archaeological Prospecting and Remote Sensing; Topics in Remote Sensing; Cambridge University Press: Cambridge, UK, 1990. [Google Scholar]
  13. Périsset, M.; Tabbagh, A. Interpretation of Thermal Prospection on Bare Soils. Archaeometry 1981, 23, 169–187. [Google Scholar] [CrossRef]
  14. Poirier, N.; Hautefeuille, F.; Calastrenc, C. Low Altitude Thermal Survey by Means of an Automated Unmanned Aerial Vehicle for the Detection of Archaeological Buried Structures. Archaeol. Prospect. 2013, 20, 303–307. [Google Scholar] [CrossRef] [Green Version]
  15. Périsset, M. Prospection Thermique de Subsurfaces: Application á l’Archéologie. Ph.D. Thesis, L’Université Pierre et Marie Curie, Paris, France, 1980. [Google Scholar]
  16. Sever, T.L.; Wagner, D.W. Analysis of prehistoric roadways in Chaco Canyon using remotely sensed digital data. In Ancient Road Networks and Settlement Hierarchies in the New World; Trombold, C.D., Ed.; Cambridge University Press: Cambridge, UK, 1991; pp. 42–52. [Google Scholar]
  17. Challis, K.; Kincey, M.; Howard, A.J. Airborne Remote Sensing of Valley Floor Geoarchaeology Using Daedalus ATM and CASI. Archaeol. Prospect. 2009, 16, 17–33. [Google Scholar] [CrossRef]
  18. Ben-Dor, E.; Kochavi, M.; Vinizki, L.; Shionim, M.; Portugali, J. Detection of buried ancient walls using airborne thermal video radiometry. Int. J. Remote Sens. 2001, 22, 3689–3702. [Google Scholar] [CrossRef]
  19. Wells, J. Kite aerial thermography. Int. Soc. Archaeol. 2011, 29, 9–10. [Google Scholar]
  20. Giardino, M.; Haley, B. Airborne remote sensing and geospatial analysis. In Remote Sensing in Archaeology: An Explicitly North American Perspective; University of Alabama Press: Tuscaloosa, AL, USA, 2006; pp. 47–77. [Google Scholar]
  21. Kvamme, K.L. Archaeological prospecting at the double ditch state historic site, North Dakota, USA. Archaeol. Prospect. 2008, 15, 62–79. [Google Scholar] [CrossRef]
  22. Buck, P.E.; Sabol, D.E.; Gillespie, A.R. Sub-pixel artifact detection using remote sensing. J. Archaeol. Sci. 2003, 30, 3689–3702. [Google Scholar] [CrossRef]
  23. Manfreda, S.; McCabe, M.; Miller, P.; Lucas, R.; Madrigal, V.P.; Mallinis, G.; Ben Dor, E.; Helman, D.; Estes, L.; Ciraolo, G.; et al. On the Use of Unmanned Aerial Systems for Environmental Monitoring. Remote Sens. 2018, 10, 641. [Google Scholar] [CrossRef] [Green Version]
  24. Barbedo, J.G.A. A Review on the Use of Unmanned Aerial Vehicles and Imaging Sensors for Monitoring and Assessing Plant Stresses. Drones 2019, 3, 40. [Google Scholar] [CrossRef] [Green Version]
  25. Evers, R.; Masters, P. The Application of Low-Altitude near Infrared Aerial Photography for Detecting Clandestine Burials Using a UAV and Low-Cost Unmodified Digital Camera. Forensic Sci. Int. 2018, 289, 408–418. [Google Scholar] [CrossRef] [PubMed] [Green Version]
  26. Witczuk, J.; Pagacz, S.; Zmarz, A.; Cypel, M. Exploring the feasibility of unmanned aerial vehicles and thermal imaging for ungulate surveys in forests—Preliminary results. Int. J. Remote Sens. 2018, 39, 5503–5520. [Google Scholar] [CrossRef]
  27. Casana, J.; Kantner, J.; Wiewel, A.; Cothren, J. Archaeological aerial thermography: A case study at the Chaco-era Blue J community. J. Archaeol. Sci. 2014, 45, 207–219. [Google Scholar] [CrossRef]
  28. Hill, A.C.; Laugier, E.J.; Casana, J. Archaeological Remote Sensing Using Multi-Temporal, Drone-Acquired Thermal and Near Infrared (NIR) Imagery: A Case Study at the Enfield Shaker Village, New Hampshire. Remote Sens. 2020, 12, 690. [Google Scholar] [CrossRef] [Green Version]
  29. Wiseman, J.R.; El-Baz, F. Remote Sensing in Archaeology; Springer Science & Business Media: Berlin/Heidelberg, Germany, 2007. [Google Scholar]
  30. Lasaponara, R.; Masini, N. Satellite Remote Sensing: A New Tool for Archaeology. In Remote Sensing and Digital Image Processing; Springer: Berlin/Heidelberg, Germany, 2012; Volume 16. [Google Scholar]
  31. Leisz, S.J. An Overview of the Application of Remote Sensing to Archaeology During the Twentieth Century. In Mapping Archaeological Landscapes from Space; Douglas: Singapore; Springer: Berlin/Heidelberg, Germany, 2013. [Google Scholar]
  32. Bewley, B.; Bradbury, J. The Endangered Archaeology in the Middle East and North Africa Project: Origins, Development and Future Directions. Bull. Counc. Br. Res. Levant 2017, 12, 15–20. [Google Scholar] [CrossRef]
  33. Hammer, E.; Seifried, R.; Franklin, K.; Lauricella, A. Remote Assessments of the Archaeological Heritage Situation in Afghanistan. J. Cult. Herit. 2018, 33, 125–144. [Google Scholar] [CrossRef] [Green Version]
  34. Lambers, K.; Traviglia, A. Automated Detection in Remote Sensing Archaeology: A Reading List. AARGnews 2016, 53, 25–29. [Google Scholar]
  35. Lambers, K. Airborne and Spaceborne Remote Sensing and Digital Image Analysis in Archaeology. In Digital Geoarchaeology: New Techniques for Interdisciplinary Human-Environmental Research; Springer: Berlin/Heidelberg, Germany, 2018; pp. 109–122. [Google Scholar]
  36. Pengfei, Z.B.; Longyin, W.; Dawei, D.; Xiao, B.; Haibin, L.; Qinghua, H.; Qinqin, N.; Hao, C.; Chenfeng, L.; Xiaoyu, L.; et al. VisDrone-DET2018: The Vision Meets Drone Object Detection in Image Challenge Results; Springer: Berlin/Heidelberg, Germany, 2019; Volume 1. [Google Scholar] [CrossRef]
  37. Lambers, K.; Verschoof, W.; Bourgeois, Q. Integrating Remote Sensing, Machine Learning, and Citizen Science in Dutch Archaeological Prospection. Remote Sens. 2019, 11, 794. [Google Scholar] [CrossRef] [Green Version]
  38. Trier, O.D.; Salberg, A.B.; Pilo, L.H. Semi-Automatic Detection of Charcoal Kilns from Airborne Laser Scanning Data. In CAA2016: Oceans of Data, Proceedings of the 44th Conference on Computer Applications and Quantitative Methods in Archaeology; Archaeopress: Oxford, UK, 2016; pp. 219–231. [Google Scholar]
  39. Guyot, A.; Hubert-Moy, L.; Lorho, T. Detecting Neolithic burial mounds from LiDARderived elevation data using a multi-scale approach and machine learning techniques. Remote Sens. 2018, 10, 225. [Google Scholar] [CrossRef] [Green Version]
  40. Biagetti, S. High and medium resolution satellite imagery to evaluate late holocene human-environment interactions in arid lands: A case study from the Central Sahara. Remote Sens. 2017, 9, 351. [Google Scholar] [CrossRef] [Green Version]
  41. Thabeng, O.L.; Merlo, S.; Adam, E. High-resolution remote sensing and advanced classification techniques for the prospection of archaeological sites’ markers: The case of dung deposits in the Shashi-Limpopo Confluence area (southern Africa). J. Archaeol. Sci. 2019, 102, 48–60. [Google Scholar] [CrossRef]
  42. Agapiou, A. Remote sensing heritage in a petabyte-scale: Satellite data and heritage earth Engine© applications. Int. J. Digit. Earth 2017, 10, 85–102. [Google Scholar] [CrossRef] [Green Version]
  43. Cigna, F.; Tapete, D. Tracking human-induced landscape disturbance at the nasca lines UNESCO world heritage site in Peru with COSMO-SkyMed InSAR. Remote Sens. 2018, 10, 572. [Google Scholar] [CrossRef] [Green Version]
  44. Adamopoulos, E.; Rinaudo, F. UAS-Based Archaeological Remote Sensing: Review, Meta-Analysis and State-of-the-Art. Drones 2020, 4, 46. [Google Scholar] [CrossRef]
  45. Gavryushkina, M. The potential and problems of volumetric 3D modeling in archaeological stratigraphic analysis: A case study from Chlorakas-Palloures, Cyprus. Digit. Appl. Archaeol. Cult. Herit. 2021, 21, e00184. [Google Scholar] [CrossRef]
  46. Orengo, H.A.; Garcia-Molsosa, A. A brave new world for archaeological survey: Automated machine learning-based potsherd detection using high-resolution drone imagery. J. Archaeol. Sci. 2019, 112, 105013. [Google Scholar] [CrossRef]
  47. Boykov, Y.; Gareth, F. Graph Cuts and Efficient N-D Image Segmentation. Int. J. Comput. Vision 2006, 70, 109–131. [Google Scholar] [CrossRef] [Green Version]
  48. Yang, Y.; Lee, X. Four-Band Thermal Mosaicking: A New Method to Process Infrared Thermal Imagery of Urban Landscapes from UAV Flights. Remote Sens. 2019, 11, 1365. [Google Scholar] [CrossRef] [Green Version]
Figure 1. Thermal image identification of archaeological elements, introduced by the authors in [10].
Applsci 11 10424 g001
Figure 2. Diurnal thermal variation in different soil, introduced by the authors in [9].
Applsci 11 10424 g002
Figure 3. Representation of the Electromagnetic Spectrum.
Applsci 11 10424 g003
Figure 4. Use of a manual thermal camera for the analysis of different concentration of artifacts scattered on the ground as introduced by the authors in [22].
Applsci 11 10424 g004
Figure 5. Proposed archaeological aerial monitoring system framework.
Applsci 11 10424 g005
Figure 6. Full pipeline for the proposed mosaicking algorithm using RGB flight video.
Applsci 11 10424 g006
Figure 7. Prediction class probability map.
Applsci 11 10424 g007
Figure 8. Raw heritage site data collected using the physical model.
Applsci 11 10424 g008
Figure 9. Labeling the foreground and background pixels automatically for the top layer.
Applsci 11 10424 g009
Figure 10. The multimodal depth-RGB mosaicking algorithm results in the lab environment: (a) shows the drone flying from a third person view. (b) shows the RGB view of the drone while (c) shows the depth view of the drone. (d) shows the development of the RGB orthomosaic.
Applsci 11 10424 g010
Figure 11. Stitching the drone’s RGB footage recorded in the lab environment.
Applsci 11 10424 g011
Figure 12. Stitching the drone’s depth footage recorded in the lab environment.
Applsci 11 10424 g012
Figure 13. Proposed user interface displaying the detected built cultural heritage during a selected inspection flight and providing the ability to switch between the different views to be able to analyze anomalies in RGB, depth, and thermal scales: (a) displays the main view for inspection selection and shows the detected built cultural heritage while (b) shows the analysis report of the selected structure over time.
Applsci 11 10424 g013
Figure 14. Graphic representation of the workflow developed for the processing of aerial thermal images with proprietary software: (1) Convert and resize the thermal images; (2) Crop the RGB images; (3) Merge thermal and RGB images; (4) Photogrammetric phase; (5) Extract thermal orthophoto in Metashape.
Applsci 11 10424 g014
Figure 15. Comparison of thermal orthophotos obtained from missions carried out at different times of the day (Monte Kassar, Castronovo di Sicilia, PA, USA).
Applsci 11 10424 g015
Publisher’s Note: MDPI stays neutral with regard to jurisdictional claims in published maps and institutional affiliations.

