Article

Comparative Study of Modified Mueller Matrix Transformation and Polar Decomposition Parameters for Transmission and Backscattering Tissue Polarimetries

1
Guangdong Research Center of Polarization Imaging and Measurement Engineering Technology, Shenzhen Key Laboratory for Minimal Invasive Medical Technologies, Institute of Optical Imaging and Sensing, Tsinghua Shenzhen International Graduate School, Tsinghua University, Shenzhen 518055, China
2
Department of Biomedical Engineering, Tsinghua University, Beijing 100084, China
3
Department of Gastroenterology, Zhujiang Hospital, Southern Medical University, Guangzhou 510515, China
4
Institute of Biopharmaceutical and Health Engineering, Tsinghua Shenzhen International Graduate School, Tsinghua University, Shenzhen 518055, China
5
Tsinghua-Berkeley Shenzhen Institute, Tsinghua University, Shenzhen 518071, China
6
Department of Physics, Tsinghua University, Beijing 100084, China
*
Authors to whom correspondence should be addressed.
These authors contributed equally to this work.
Appl. Sci. 2021, 11(21), 10416; https://doi.org/10.3390/app112110416
Submission received: 22 September 2021 / Revised: 27 October 2021 / Accepted: 28 October 2021 / Published: 5 November 2021
(This article belongs to the Special Issue Novel Biophotonics Technologies and Applications)

Abstract

:
Mueller matrix polarimetry is widely used in biomedical studies and applications, for it can provide abundant microstructural information about tissues. Recently, several methods have been proposed to decompose the Mueller matrix into groups of parameters related to specific optical properties which can be used to reveal the microstructural information of tissue samples more clearly and quantitatively. In this study, we thoroughly compare the differences among the parameters derived from the Mueller matrix polar decomposition (MMPD) and Mueller matrix transformation (MMT), which are two popular methods in tissue polarimetry studies and applications, while applying them on different tissue samples for both backscattering and transmission imaging. Based on the Mueller matrix data obtained using the setups, we carry out a comparative analysis of the parameters derived from both methods representing the same polarization properties, namely depolarization, linear retardance, fast axis orientation and diattenuation. IN particular, we propose several modified MMT parameters, whose abilities are also analyzed for revealing the information about the specific type of tissue samples. The results presented in this study evaluate the applicability of the original and modified MMT parameters, then give the suggestions for appropriate parameter selection in tissue polarimetry, which can be helpful for future biomedical and clinical applications.

1. Introduction

As a non-invasive, non-contact and label-free tool, Mueller matrix polarimetry is widely used in biomedical studies and clinical applications, for it can provide abundant microstructural information about tissues and cells [1,2,3,4]. Specifically, the Mueller matrix measurement system can be used for abnormal tissue detection for both backward imaging of bulk tissue samples and forward imaging of thin tissue slices [5,6,7]. However, although a Mueller matrix contains a comprehensive description of the polarization-related structural and optical properties of the medium, it is often difficult to obtain intrinsic polarimetric characteristics such as diattenuation, retardance and depolarization encoded in the Mueller matrix elements directly. To solve this problem, in the past decades several methods have been proposed to decompose the Mueller matrix into groups of parameters related to specific optical properties which can be used to reveal the microstructural information of tissue samples more clearly and quantitatively [8,9,10,11,12,13,14].
Until now, the Mueller matrix polar decomposition (MMPD) and Mueller matrix transformation (MMT) are two popular methods in tissue polarimetry studies and applications. Nevertheless, unlike the MMPD method, which decomposes the Mueller matrix into three sub-matrices with clear physical meanings of depolarization, retardance, and diattenuation [12,13], the MMT method directly combines groups of Mueller matrix elements to derive parameters related to certain characteristics of tissue-like media with an advantage of fast calculation speed [14]. Both the MMPD and MMT methods have demonstrated the diagnostic potential in various cancerous tissue detection, including breast cancer, liver cancer, inflammatory bowel diseases and cervical cancer [15,16,17,18,19,20]. However, it is worth noting that the parameters derived from the MMPD and MMT methods are based on specific deduction models and calculation assumptions. Therefore, for accurate diagnostic purposes, their applicability and interpretability regarding different types of samples requires further discussion and analysis. Recently, some efforts have been made in this area, and some useful conclusions have been drawn by Ahmad and us [21,22,23,24].
In this study, to compare the difference among the parameters derived from the MMPD and MMT methods more comprehensively while applying them on different types of tissue samples measured by both backscattering and transmission imaging setups, we prepare seven kinds of thin tissue samples for forward measurement and five kinds of bulk tissue samples for backward measurement. Based on the Mueller matrix data obtained using the setups, we carry out thoroughly comparative analysis of the parameters derived from both methods representing the same polarization properties, namely depolarization, retardance, fast axis orientation and diattenuation. Specifically, according to tissue structures, we further proposed several modified MMT parameters, whose abilities were also analyzed for revealing information with regard to specific types of tissue samples. We discuss the applicability of the original and modified MMT parameters based on the comparisons, and then give suggestions for appropriate parameter selection in tissue polarimetry.

2. Materials and Methods

2.1. Mueller Matrix Polar Decomposition (MMPD)

The Mueller matrix polar decomposition method proposed by Lu and Chipman describes the process of interaction between light and medium by decomposing a Mueller matrix into three sub-matrices with clear physical meanings: diattenuation (MD), retardance (MR) and depolarization (MΔ), as shown as Equation (1) [12].
M = M Δ M R M D
Based on Equation (1), a group of MMPD parameters D, R and Δ can be calculated by Equations (2)–(4), representing diattenuation, retardance and depolarization properties of the samples, respectively. It should be noted that the lower case mij (i,j = 1, 2, 3, 4) in Equation (2) represents the corresponding Mueller matrix elements before performing any decomposition, while the lower case mΔ in Equation (4) is the 3 × 3 depolarization sub-matrix from MΔ.
D = 1 m 11 m 12 2 + m 13 2 + m 14 2
R = cos 1 [ t r ( M Δ ) 2 1 ]
Δ = 1 | t r ( m Δ ) 1 | 3
The parameters δ and θ derived from the retardance matrix MR are usually used to describe the value and fast axis orientation of linear birefringence induced by fibrous tissue structures [13]. Since the birefringent fibrous structures including collagen, elastics, and muscle fibers that are prevalent in tissues, these two MMPD parameters can provide important information of the distribution behaviors of fibrous structures during many pathological processes [15,16,17,18,19,20,25,26,27,28]. It should be noted that compared with the original orientation parameters θ, a modified MMPD parameter θe proposed in our recent study has been demonstrated as a more suitable indicator for describing the orientation of complicated tissue samples containing layered fibrous structures [26]. The parameters δ and θe can be calculated according to Equations (5)–(8) [13,26]. The MR(i,j) (i,j = 2, 3) in Equation (5) represents the corresponding elements of the 4 × 4 retardance matrix MR, while R is the total retardance, εijk is the Levi-Cività permutation symbol, δij is the Kronecker delta, and mR is the 3 × 3 retardance sub-matrix striking out the first row and the first column of MR.
δ = cos 1 { [ M R ( 2 , 2 ) + M R ( 3 , 3 ) ] 2 + [ M R ( 3 , 2 ) M R ( 2 , 3 ) ] 2 1 }
θ e = 1 2 tan 1 ( a 2 a 1 )
( m R ) i j = δ i j cos R + a i a j ( 1 cos R ) + k = 1 3 ε i j k a k sin R ( i , j = 1 , 2 , 3 )
a i = 1 2 sin R i , j = 1 3 ε i j k ( m R ) j k

2.2. Mueller Matrix Transformation (MMT) Parameters

The Mueller matrix transformation method was proposed to derive groups of quantitative parameters for describing the microstructural features of biomedical tissue samples by fitting the Mueller matrix elements to the trigonometric functions [14]. Several MMT parameters such as t2, t3, x3 and 1 − b were introduced in our previous studies [14,29], where t2 (also denoted as t1213 shown in Equation (9)) reveals the linear diattenuation property, t3 (also denoted as t2434 and t4243 shown in Equations (10) and (11)) is related to the linear retardance of the tissue samples, while x3 (also denoted as ϕ2434 and ϕ4243 shown in Equations (12) and (13)) can characterize the orientation of the birefringence structure and 1 − b (shown in Equation (14)) represents the linear depolarization of the tissue samples.
t 1213 = m 12 2 + m 13 2
t 2434 = m 24 2 + m 34 2
t 4243 = m 42 2 + m 43 2
ϕ 2434 = 1 2 tan 1 ( m 24 m 34 )
ϕ 4243 = 1 2 tan 1 ( m 42 m 43 )
1 b = 1 m 22 + m 33 2
However, as these parameters are derived based on specific models [14], when we apply these parameters on complex tissue samples, their applicability needs further discussion. Our previous studies showed that there is a deviation between the values of t2434 and t4243 when multiple crossing linear birefringence effects coexist, as the information of linear retardance are distributed among the m24, m34, m42 and m43 elements [14,26,30]. Such deviation also occurs in the birefringence orientation parameters ϕ2434 and ϕ4243. Here, according to tissue structures, we propose two modified MMT parameters tqr and ϕqr (shown in Equations (15) and (16)), which take m24, m34, m42 and m43 elements into account, to calculate the linear retardance and birefringence orientation of the layered tissue sample more accurately. Besides, we also propose another two MMT parameters t121314 and 1 − bm (Equations (17) and (18)) to describe the overall diattenuation and depolarization properties of the tissue samples by taking the elements m14 and m44 into account, which contain the information of circular diattenuation and circular depolarization.
t q r = t 2434 2 + t 4243 2 2 = m 24 2 + m 42 2 + m 34 2 + m 43 2 2
ϕ q r = 1 2 tan 1 ( m 42 m 24 m 34 m 43 )
t 121314 = m 12 2 + m 13 2 + m 14 2
1 b m = 1 m 22 + m 33 + | m 44 | 3
Among the available Mueller matrix analyzing methods, the calculation speed of MMT is relatively fast, which is advantageous for clinical applications [5,24]. However, the principle of MMT calculations is based on the fitting parameters obtained by experiments and simulations, and its accuracy needs to be further studied when applied to quantitative characterization of specific tissues and cells. On the other hand, the MMPD parameters are widely used in the field of biomedical and pre-clinical detection. The applicability of the MMPD method on tissue samples has been proven in various ex vivo and in vivo measurements [5,6].

2.3. Materials and Measurement Setup

In previous studies, we have developed the transmission Mueller matrix microscope for measuring thin tissue slices and backscattering Mueller matrix imaging set-ups for measuring bulk tissue samples [19,31,32,33,34,35]. The measurement schemes are based on the dual-rotating retarder method. For this method, the PSG (polarization state generator) and PSA (polarization state analyzer) consist of a pair of polarizers fixed in the horizontal direction, which is also parallel to the source-sample-camera triangle plane for the backscattering imaging, and two retarders rotating with a fixed ratio of angles. It should be noted that the source, sample and camera are colinear in transmission imaging geometry. Then the 16 Mueller matrix elements can be calculated by using the Fourier coefficients αn and βn shown as Equation (19) [36].
I = α 0 + n = 1 12 ( α n cos 2 n θ 1 + β n sin 2 n θ 1 )
where I is the intensity, θ1 is the rotation angle of the retarder 1 for the PSG. The two retarders (retarder 1 for PSG, retarder 2 for PSA) rotate with a fixed rate θ1 = 5θ2. The Mueller matrix measurement setups used in this study were calibrated to ensure that the maximum errors of the measured Mueller matrix elements are less than 1%. More details on this Mueller matrix imaging method and calibration process can be found in [32,37,38].
Here, we prepared two types of tissue samples (n = 149) for the comparative analysis: thin pathological tissue slices for transmission measurement and bulk tissue samples for backscattering measurement. The unstained thin tissue samples include human colorectal, intestinal tuberculosis (ITB), liver, Crohn’s disease (CD), bladder, breast, adenoma tissue slices whose thickness are 12 μm, while the bulk tissue samples include human breast, rat-skin, porcine intestine, porcine stomach, and porcine liver tissues. The H-E stained 4-µm-thick tissue slices of the samples were also prepared for pathological observations. More details of the samples used in this study are shown in Table 1. It should be noted that the signal-to-noise ratio for the camera is related to the energy obtained from the source, which depends on both the power of LED and the exposure of the camera. As the power of LED for our Mueller matrix imaging is commonly within 1–3 W [24,25,34], we have selected an appropriate exposure time for the camera to achieve a good signal-to-noise ratio. Our previous studies showed that the LED with the power of 1 W did not generate a lot of heat to the thick sample when an appropriate exposure time was selected [24,25,34]. In this work, the human tissue samples are provided by the Department of Gastroenterology, Zhujiang Hospital, Southern Medical University, and Shenzhen Sixth People’s (Nanshan) Hospital. This work was approved by the Ethics Committee of the Shenzhen International Graduate School, Tsinghua University.

2.4. Quantitative Indicators for MMT and MMPD Parameters Comparison

Here, we evaluate the difference between MMT and MMPD parameters in two aspects: how their linear relationship is and whether there exits statistical significance. For the linear relationship comparison, we take the square of the Pearson correlation coefficient (R2 or r2) as a measure between two sets of parameters, as it can provide a quantitative value for their linear relationship evaluation (range 0–1). For a correlation between variables x and y, the formula for calculating the sample Pearson’s correlation coefficient (R of r) is given by Equation (20) [39,40].
R = r x y = i = 1 n ( x i x ¯ ) ( y i y ¯ ) i = 1 n ( x i x ¯ ) 2 i = 1 n ( y i y ¯ ) 2
where xi and yi are the values of x and y for the ith individual. It is also worth mentioning that the larger the value is, the more similar the changing trends of MMT and MMPD parameters are. Based on the correlation analysis, we conduct the statistical analysis between MMT and MMPD with p-value, which can assess whether both parameters are interchangeable without linear fitting according to their statistical differences [41].

3. Results and Discussion

To compare the MMT and MMPD parameters more comprehensively, in the following sections we analyze the three main polarization properties (diattenuation, retardance, and depolarization) of both the transmission imaging results of thin tissue samples, and backscattering imaging results of bulk tissue samples.

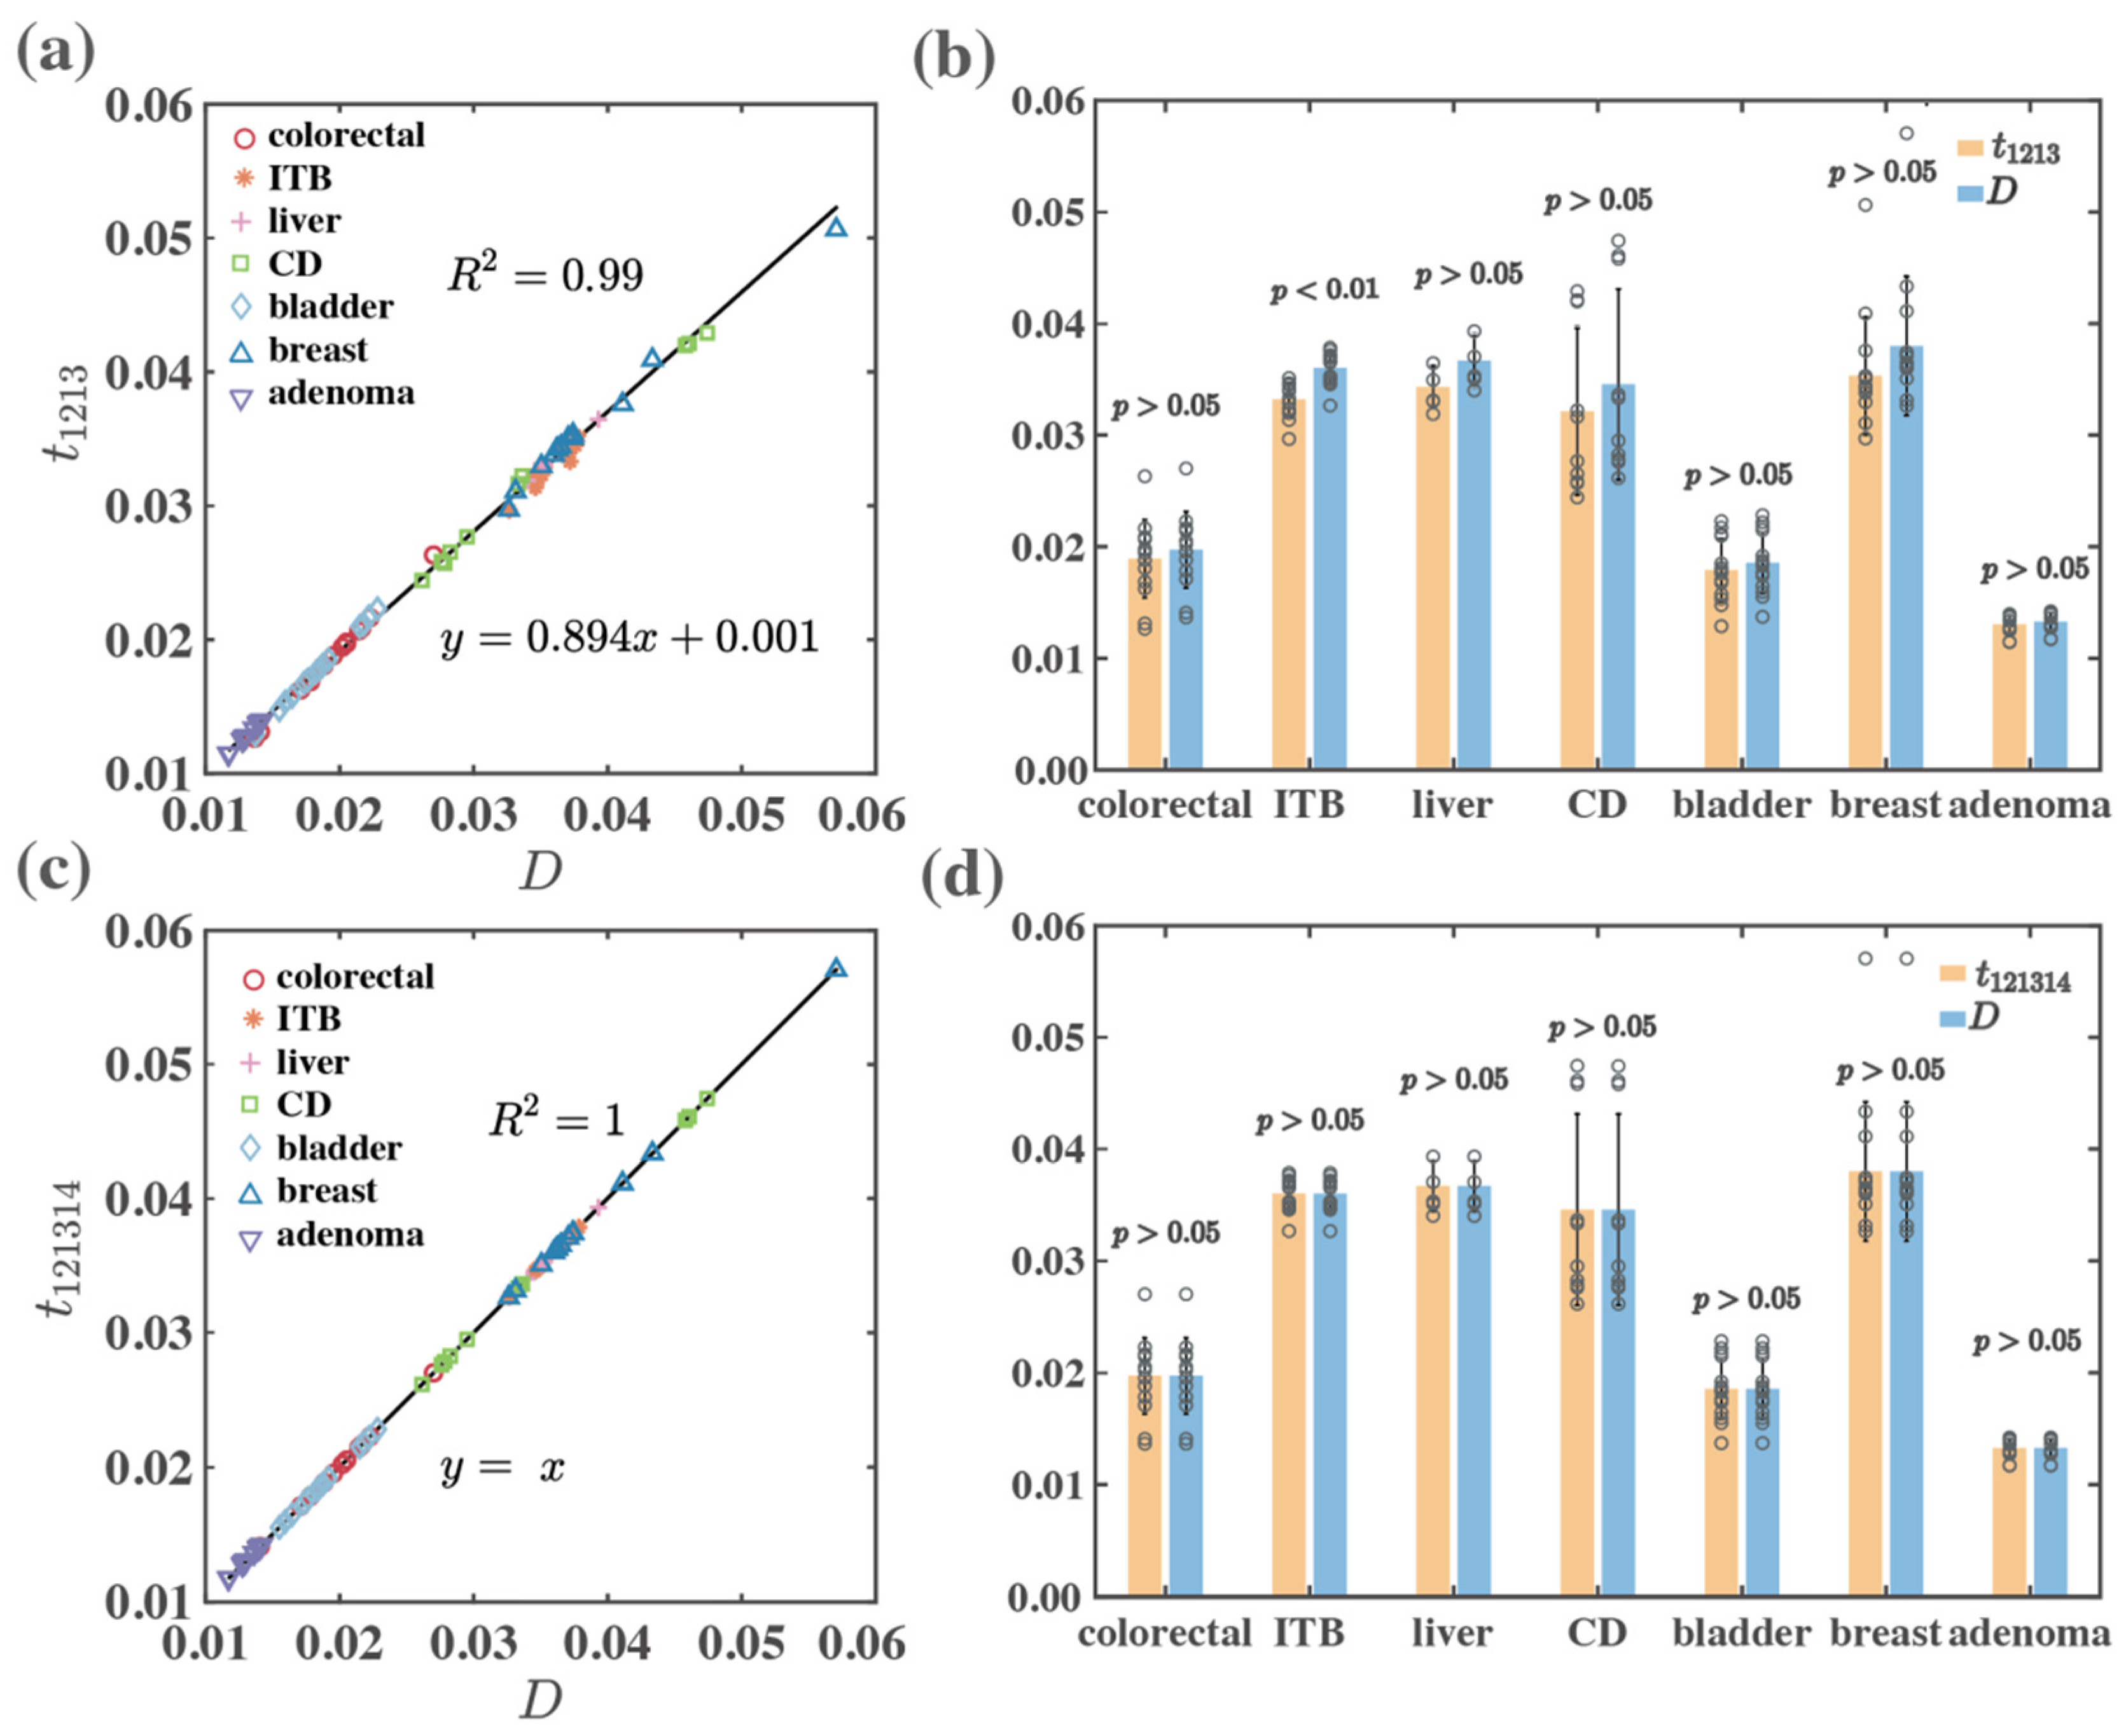
3.1. Quantitative Comparison of Diattenuation Related MMPD and MMT Parameters for Transmission Imaging of Thin Tissue Samples

We measured all seven different kinds of thin pathological tissue slices (86 in total) using the forward transmission Mueller matrix microscope. Then, for each kind of tissue sample, we calculated the diattenuation related MMT and MMPD parameters according to Equations (2), (9) and (17). Specifically, to find out whether the modified MMT parameters can be used to accurately obtain the structural properties of tissue samples, the quantitative analyses were conducted to show the correlations and differences between the MMT and the corresponding MMPD parameters.
The correlation coefficient R2 and statistical analysis p values of each kind of thin tissue slice samples are presented in Table 2. The comparison of the MMPD and MMT diattenuation parameters was performed in two groups: (D, t1213) and (D, t121314). As we can see from Table 2, for the correlation analysis, compared with the group of (D, t1213), the group (D, t121314), for each kind of sample has a higher correlation coefficient value of 1. More thorough and intuitive comparisons are illustrated in Figure 1a, c by plotting out all the sample data, which confirm that the modified MMT diattenuation parameter t121314 has a good accordance with the MMPD parameter D in the transmission measurement. On the other hand, as can be noticed from Table 2 and Figure 1b, the ITB tissue samples show statistically significant differences, with p < 0.01 between the parameters D and t1213. While for the modified parameter t121314, the p-values of all kinds of tissue samples are above 0.05, meaning that the modified MMT parameter t121314 can be used as a precise indicator for the diattenuation property of thin tissue samples.

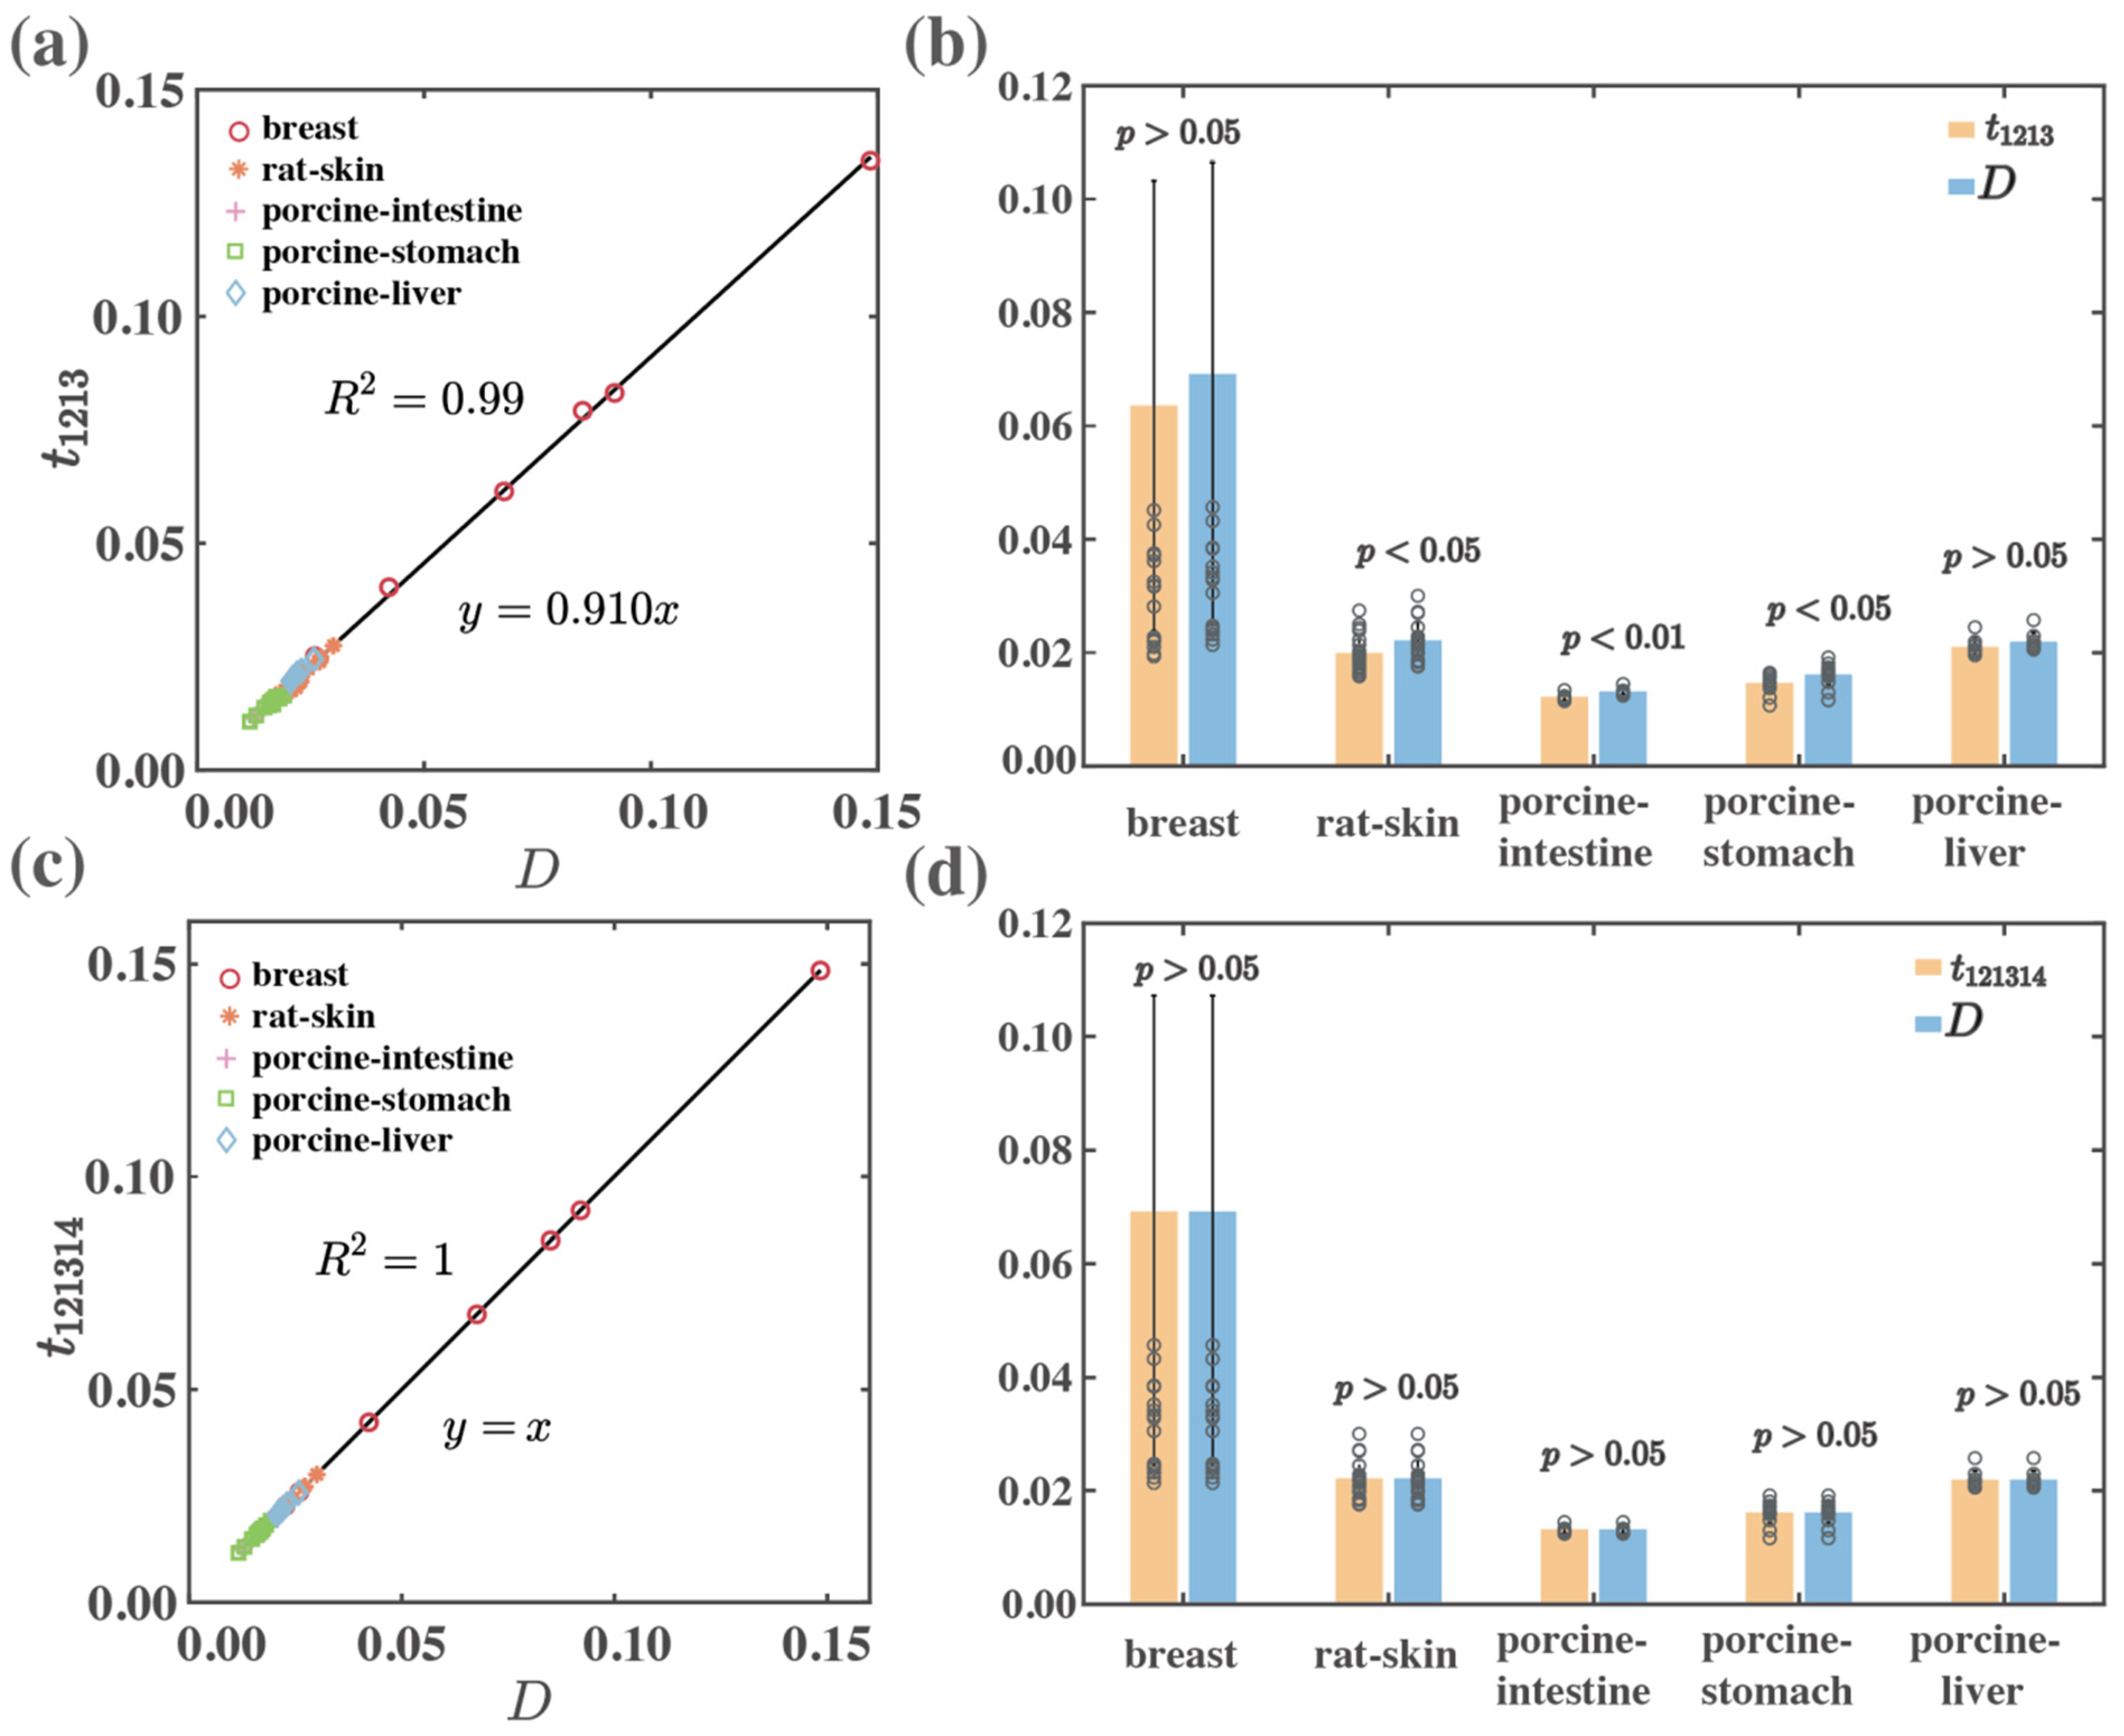
3.2. Quantitative Comparison of Diattenuation Related MMPD and MMT Parameters for Backscattering Imaging of Bulk Tissue Samples

To study the relationship between the diattenuation related MMPD and MMT parameters for backscattering polarimetric measurement, we prepared five different kinds of bulk tissue samples (63 in total) to attain their backscattering Mueller matrix data. Then, for each kind of tissue sample, we also calculated the diattenuation-related parameters in Section 3.1 for the correlation and statistical analysis whose results are shown in Table 3 and Figure 2.
We can observe from Table 3 that, for the backscattering measurement results, the correlation coefficient values of parameters (D, t121314) for each kind of bulk samples also have higher values of 1 compared with that of parameters (D, t1213), meaning that the modified MMT diattenuation parameter t121314 also has a good accordance with the MMPD parameter D in backscattering measurement. Meanwhile, for the statistical analysis of each kind of sample, it can be seen from Table 3 and Figure 2b that the rat-skin, porcine-intestine, porcine-stomach and liver tissue samples show statistically significant differences with p < 0.05 between the parameters D and t1213. However, the p-values of all kinds of tissue samples are larger than 0.05 for parameters (D, t121314) shown in Table 3 and Figure 2d, which also confirms that the modified MMT parameter t121314 can be used to accurately characterize the diattenuation property of the bulk tissue samples measured by backscattering polarimetry.
In summary, we can see from the comparative analyzing results presented in Section 3.1 and Section 3.2 that the modified MMT parameter t121314 shows a better accordance with the MMPD parameter D in both the transmission and backscattering measurements than the original parameter t1213, which only reflects the linear diattenuation of the samples. Though the circular diattenuation effects of the tissue samples are often very limited, taking the element m14 (encoded the circular diattenuation property) [42] into account for tissue polarimetric calculations can produce more accurate results.

3.3. Quantitative Comparison of Linear Retardance Related MMPD and MMT Parameters for Transmission Imaging of Thin Tissue Samples

Linear retardance is viewed as one of the most important polarization properties of tissue samples in terms of revealing the location and density of the birefringent fibrous structures [15,16,17,18,19,20]. Our previous studies showed that the MMT parameters t2434 and t4243 can be used to reflect the linear retardance of the tissues [14,29]. However, both of the parameters may slightly deviate from each other when measuring complicated tissue samples containing layered anisotropic structures, reducing the accuracy of Mueller matrix polarimetry for quantitative tissue evaluation. To deal with this problem, we proposed a modified MMT parameter tqr based on the elements from both the fourth column and fourth row shown in Equation (15) to describe the linear retardance property. To verify its effectiveness, we conducted the comparisons among the linear retardance related MMPD and MMT parameters in three groups: (δ, t2434), (δ, t4243), and (δ, tqr). The correlation and statistical analysis values of MMT and MMPD parameters groups for each kind of thin tissue samples are shown in Table 4 and Figure 3. For more intuitive comparisons, all the parameters are normalized to the [0, 1] value range.
For the correlation analysis, Figure 3a,c,e show that, compared with the parameter groups (δ, t2434) and (δ, t4243), the group (δ, tqr) for all the samples have higher correlation coefficient values. We can also see the differences more clearly in Table 4, where the correlation coefficient values of (δ, t2434) and (δ, t4243) deviate from each other ranging between 0.90 to 0.99, while the correlation coefficients of (δ, tqr) are more stable with higher values for all the samples. Moreover, for the statistical analysis, all kinds of thin tissue samples show statistically significant differences with p < 0.01 among the parameter groups according to Table 4 and Figure 3b,d,f, meaning that the MMT linear retardance parameters cannot be substituted for MMPD parameter δ directly without linear fitting. However, the modified MMT linear retardance parameter tqr shows a good accordance with the MMPD parameter δ, indicating that it can be used to well present linear retardance distributions of tissues by linear fitting with MMPD parameter δ.

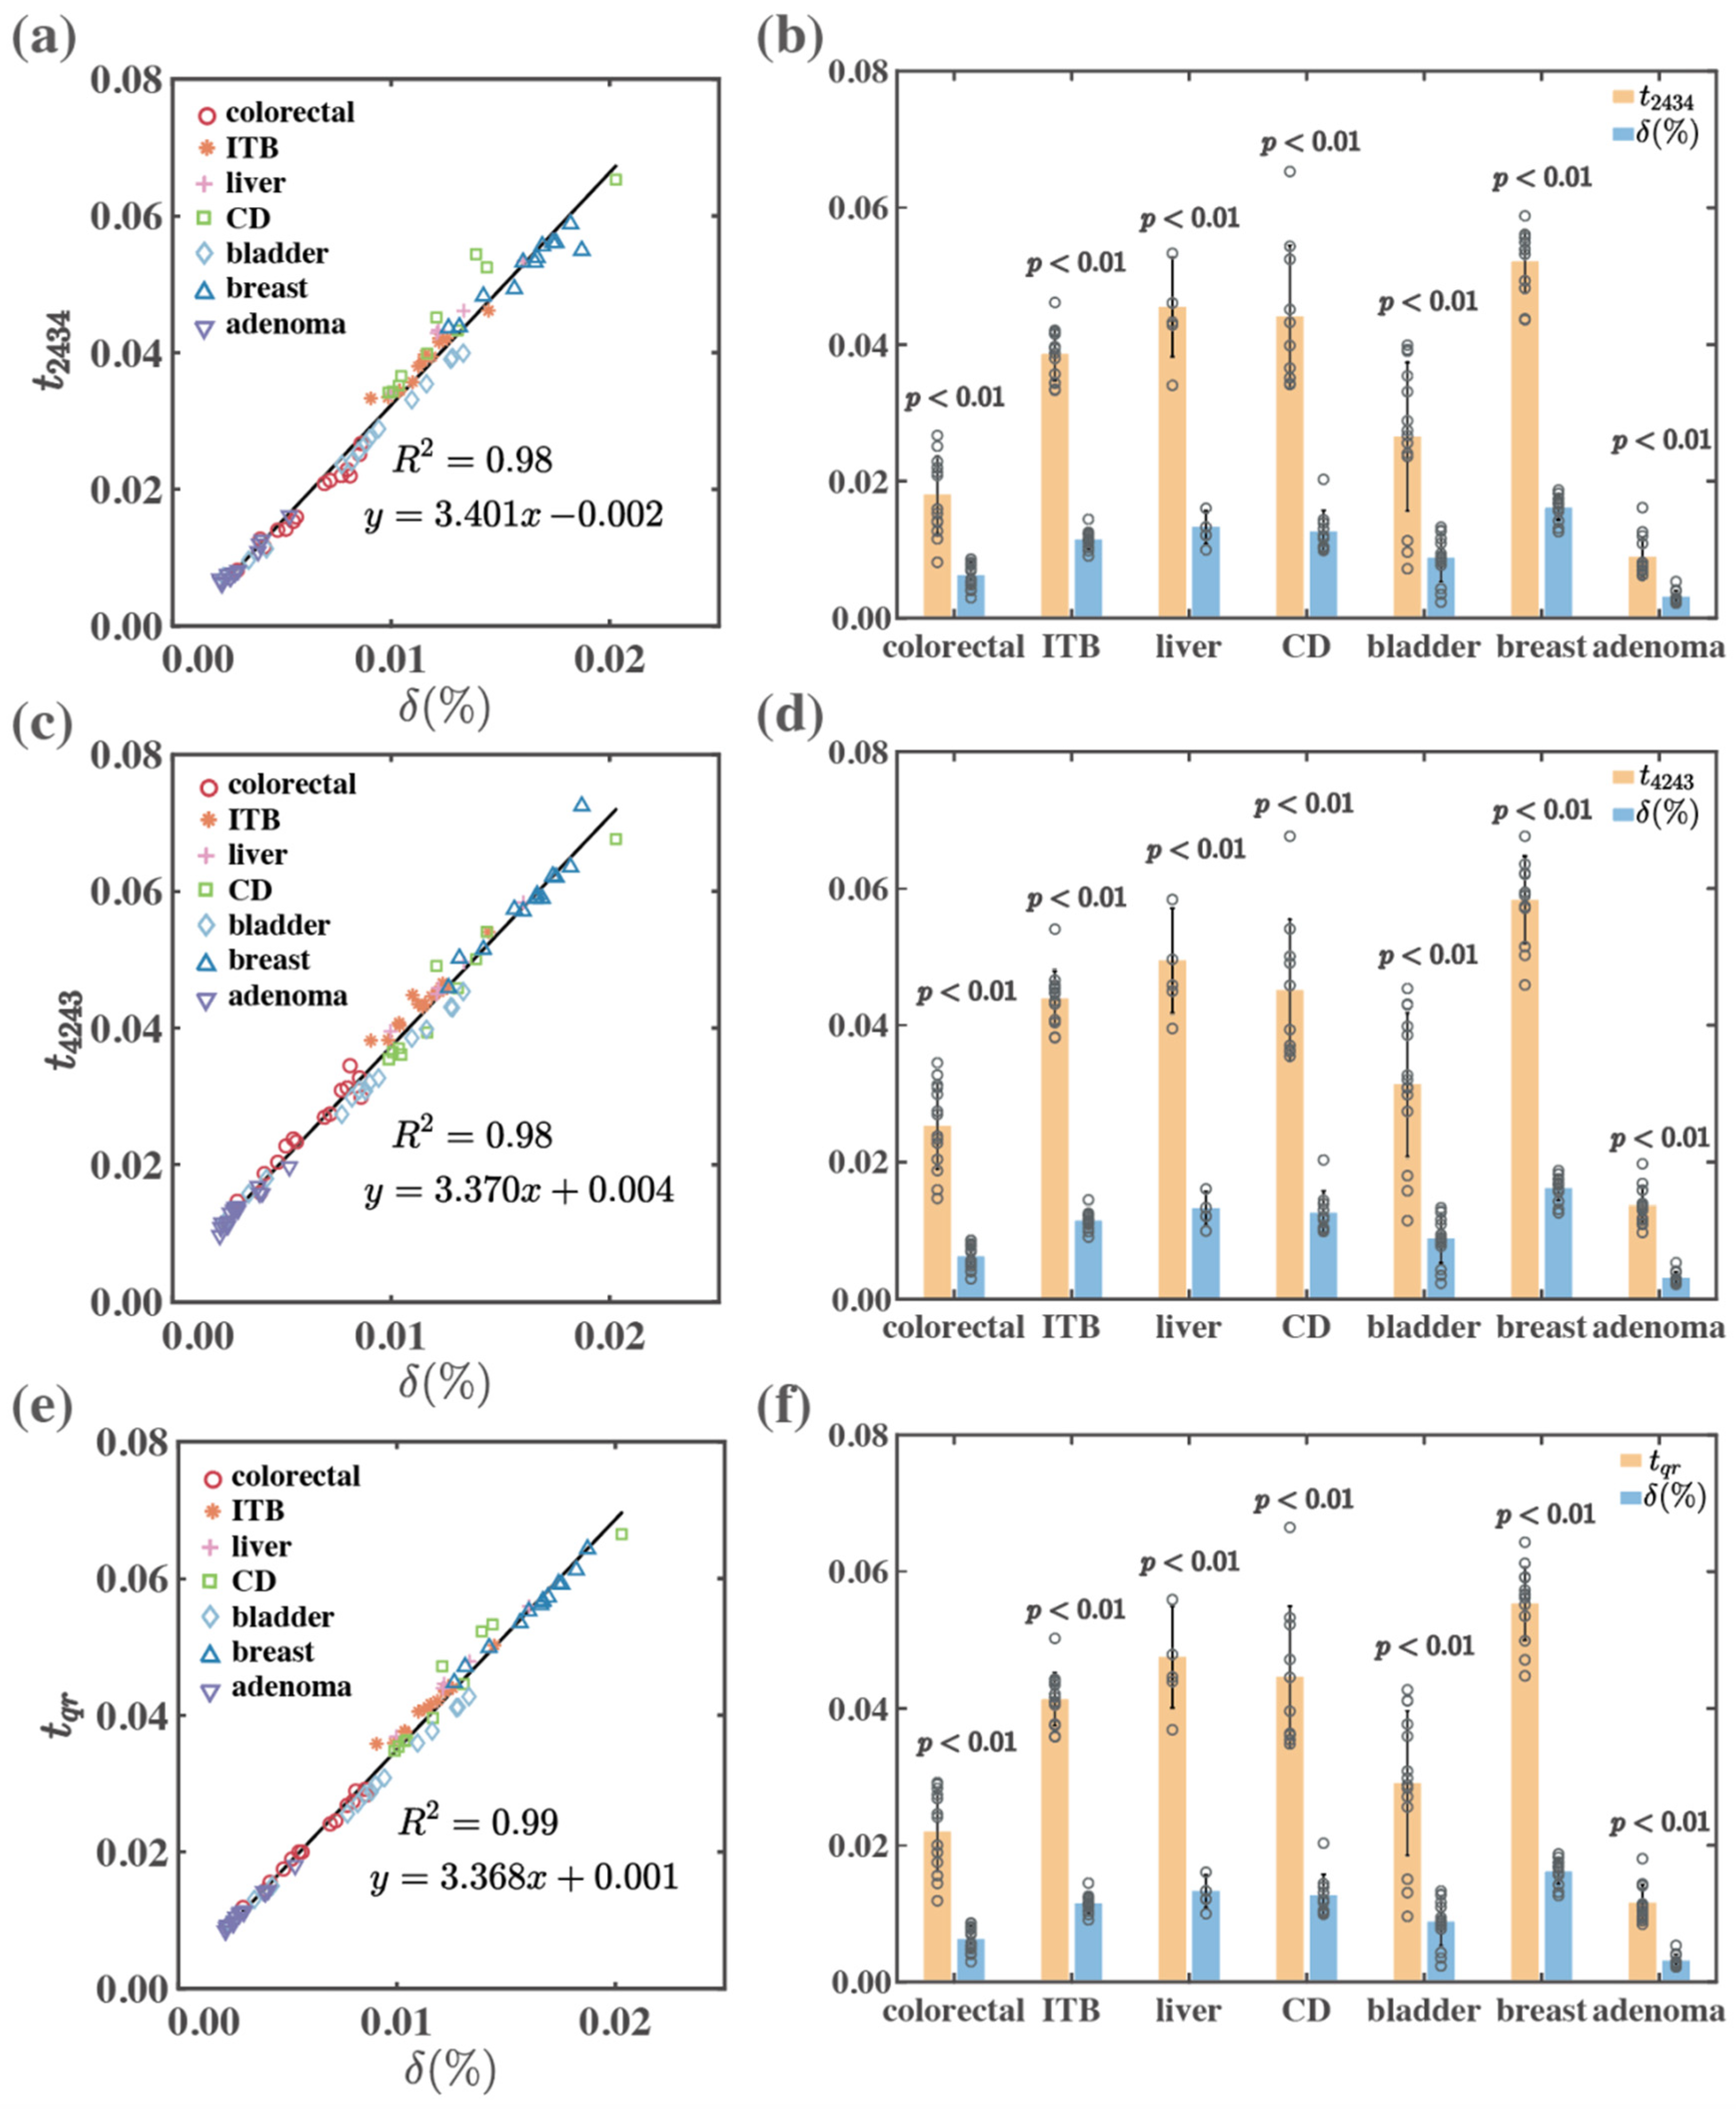
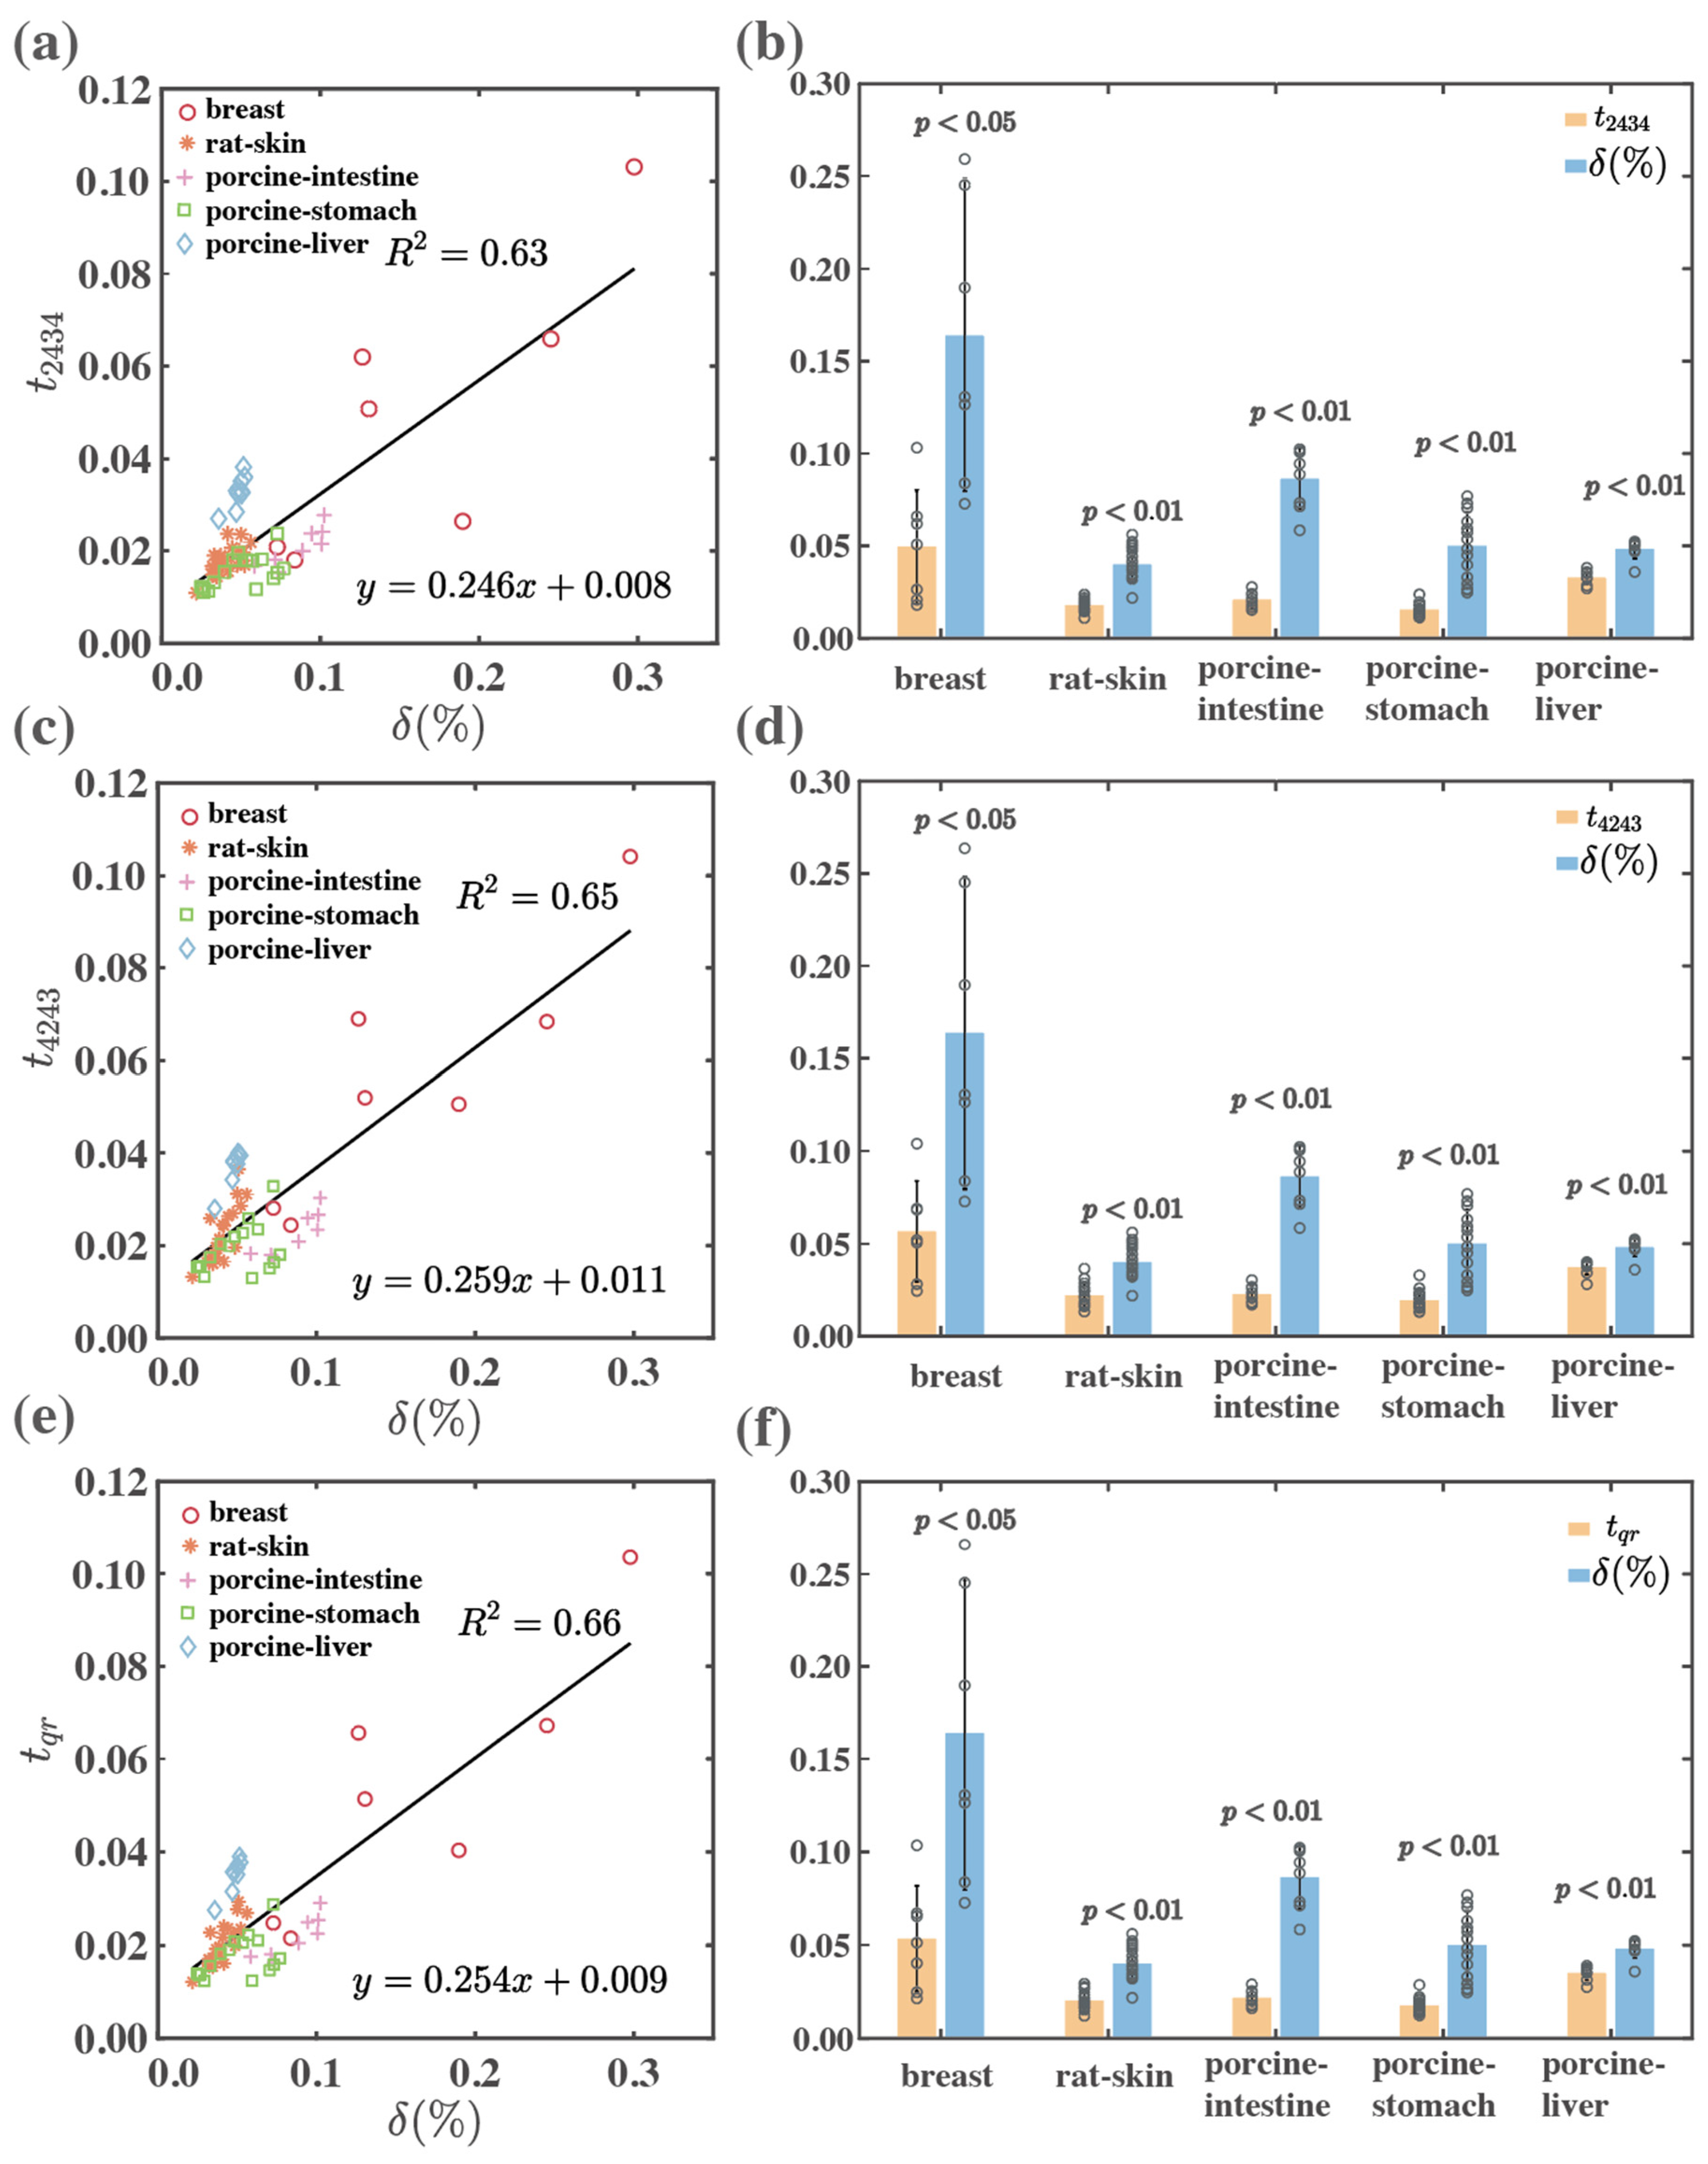
3.4. Quantitative Comparison of Linear Retardance Related MMPD and MMT Parameters for Backscattering Imaging of Bulk Tissue Samples

As shown in Table 5, for the backscattering measurement results of bulk tissue samples, the linear retardance related parameters derived from MMT and MMPD methods do not show a good correlation. The correlation coefficient values of each kind of bulk tissue samples for parameter groups (δ, t2434), (δ, t4243) and (δ, tqr) are between 0.16 and 0.89, and we can also see the data points of the tissue samples distribute randomly in Figure 4a,c,e. Besides, Figure 4b,d,f show that the MMPD linear retardance parameters are larger than the MMT linear retardance parameters, and they all have statistically significant differences with the p-value smaller than 0.05. Therefore, it is worth mentioning that when we try to measure linear retardance property of bulk tissues sample using backscattering polarimetry, the MMPD parameter δ will provide the information more accurately, while the MMT linear retardance parameters can be suitable for quickly evaluating the existence and location of birefringent structures.

3.5. Quantitative Comparison of Linear Birefringence Orientation Related MMPD and MMT Parameters for Transmission Imaging of Thin Tissue Samples

Besides the linear retardance value, the fast axis orientation of linear birefringence is another important indicator to reveal the structural features of tissue, such as the distribution behaviors of collagen and elastic fibers in pathological tissue samples, which is helpful for clinical diagnosis. In our previous study, considering that the layered fibrous structures can result in deviations of MMPD linear birefringence orientation parameters, we proposed a modified MMPD parameter θe to more accurately represent the fast axis orientation of the complicated linear birefringent structures in tissue samples [26]. Meanwhile, it was also found that while applying the MMT parameters ϕ2434, ϕ4243 to the fibrous tissue samples, they exist with positive or negative deviations from the ideal values. Hence, according to the experimental results, we proposed a modified MMT parameter, ϕqr shown in Equation (16), for layered linear birefringent structures. To verify its effectiveness, the correlation and statistical analysis are conducted with the variance of parameters groups (θe, ϕ2434), (θe, ϕ4243) and (θe, ϕqr), whose results are shown in Table 6 and Figure 5.
For the correlation analysis, Figure 5a,c,e show that compared with the parameter groups (θe, ϕ2434), (θe, ϕ4243) and (θe, ϕqr), the correlation coefficient values of (θe, ϕqr) for all the samples are larger. We can also find the difference more clearly in Table 6, where the correlation coefficient values of (θe, ϕ2434) and (θe, ϕ4243) deviate with each other ranging between 0.44 to 0.98, while for (θe, ϕqr) the values are more stable and closer to 1 for all kinds of thin tissue samples. For the statistical analysis, the group (θe, ϕqr) shows no statistically significant difference with p > 0.05 according to Table 6 and Figure 5b,d,f, which means that the modified MMT parameters ϕqr has the similar ability as the MMPD parameter θe for revealing the linear birefringence orientation information of complicated thin tissue samples.

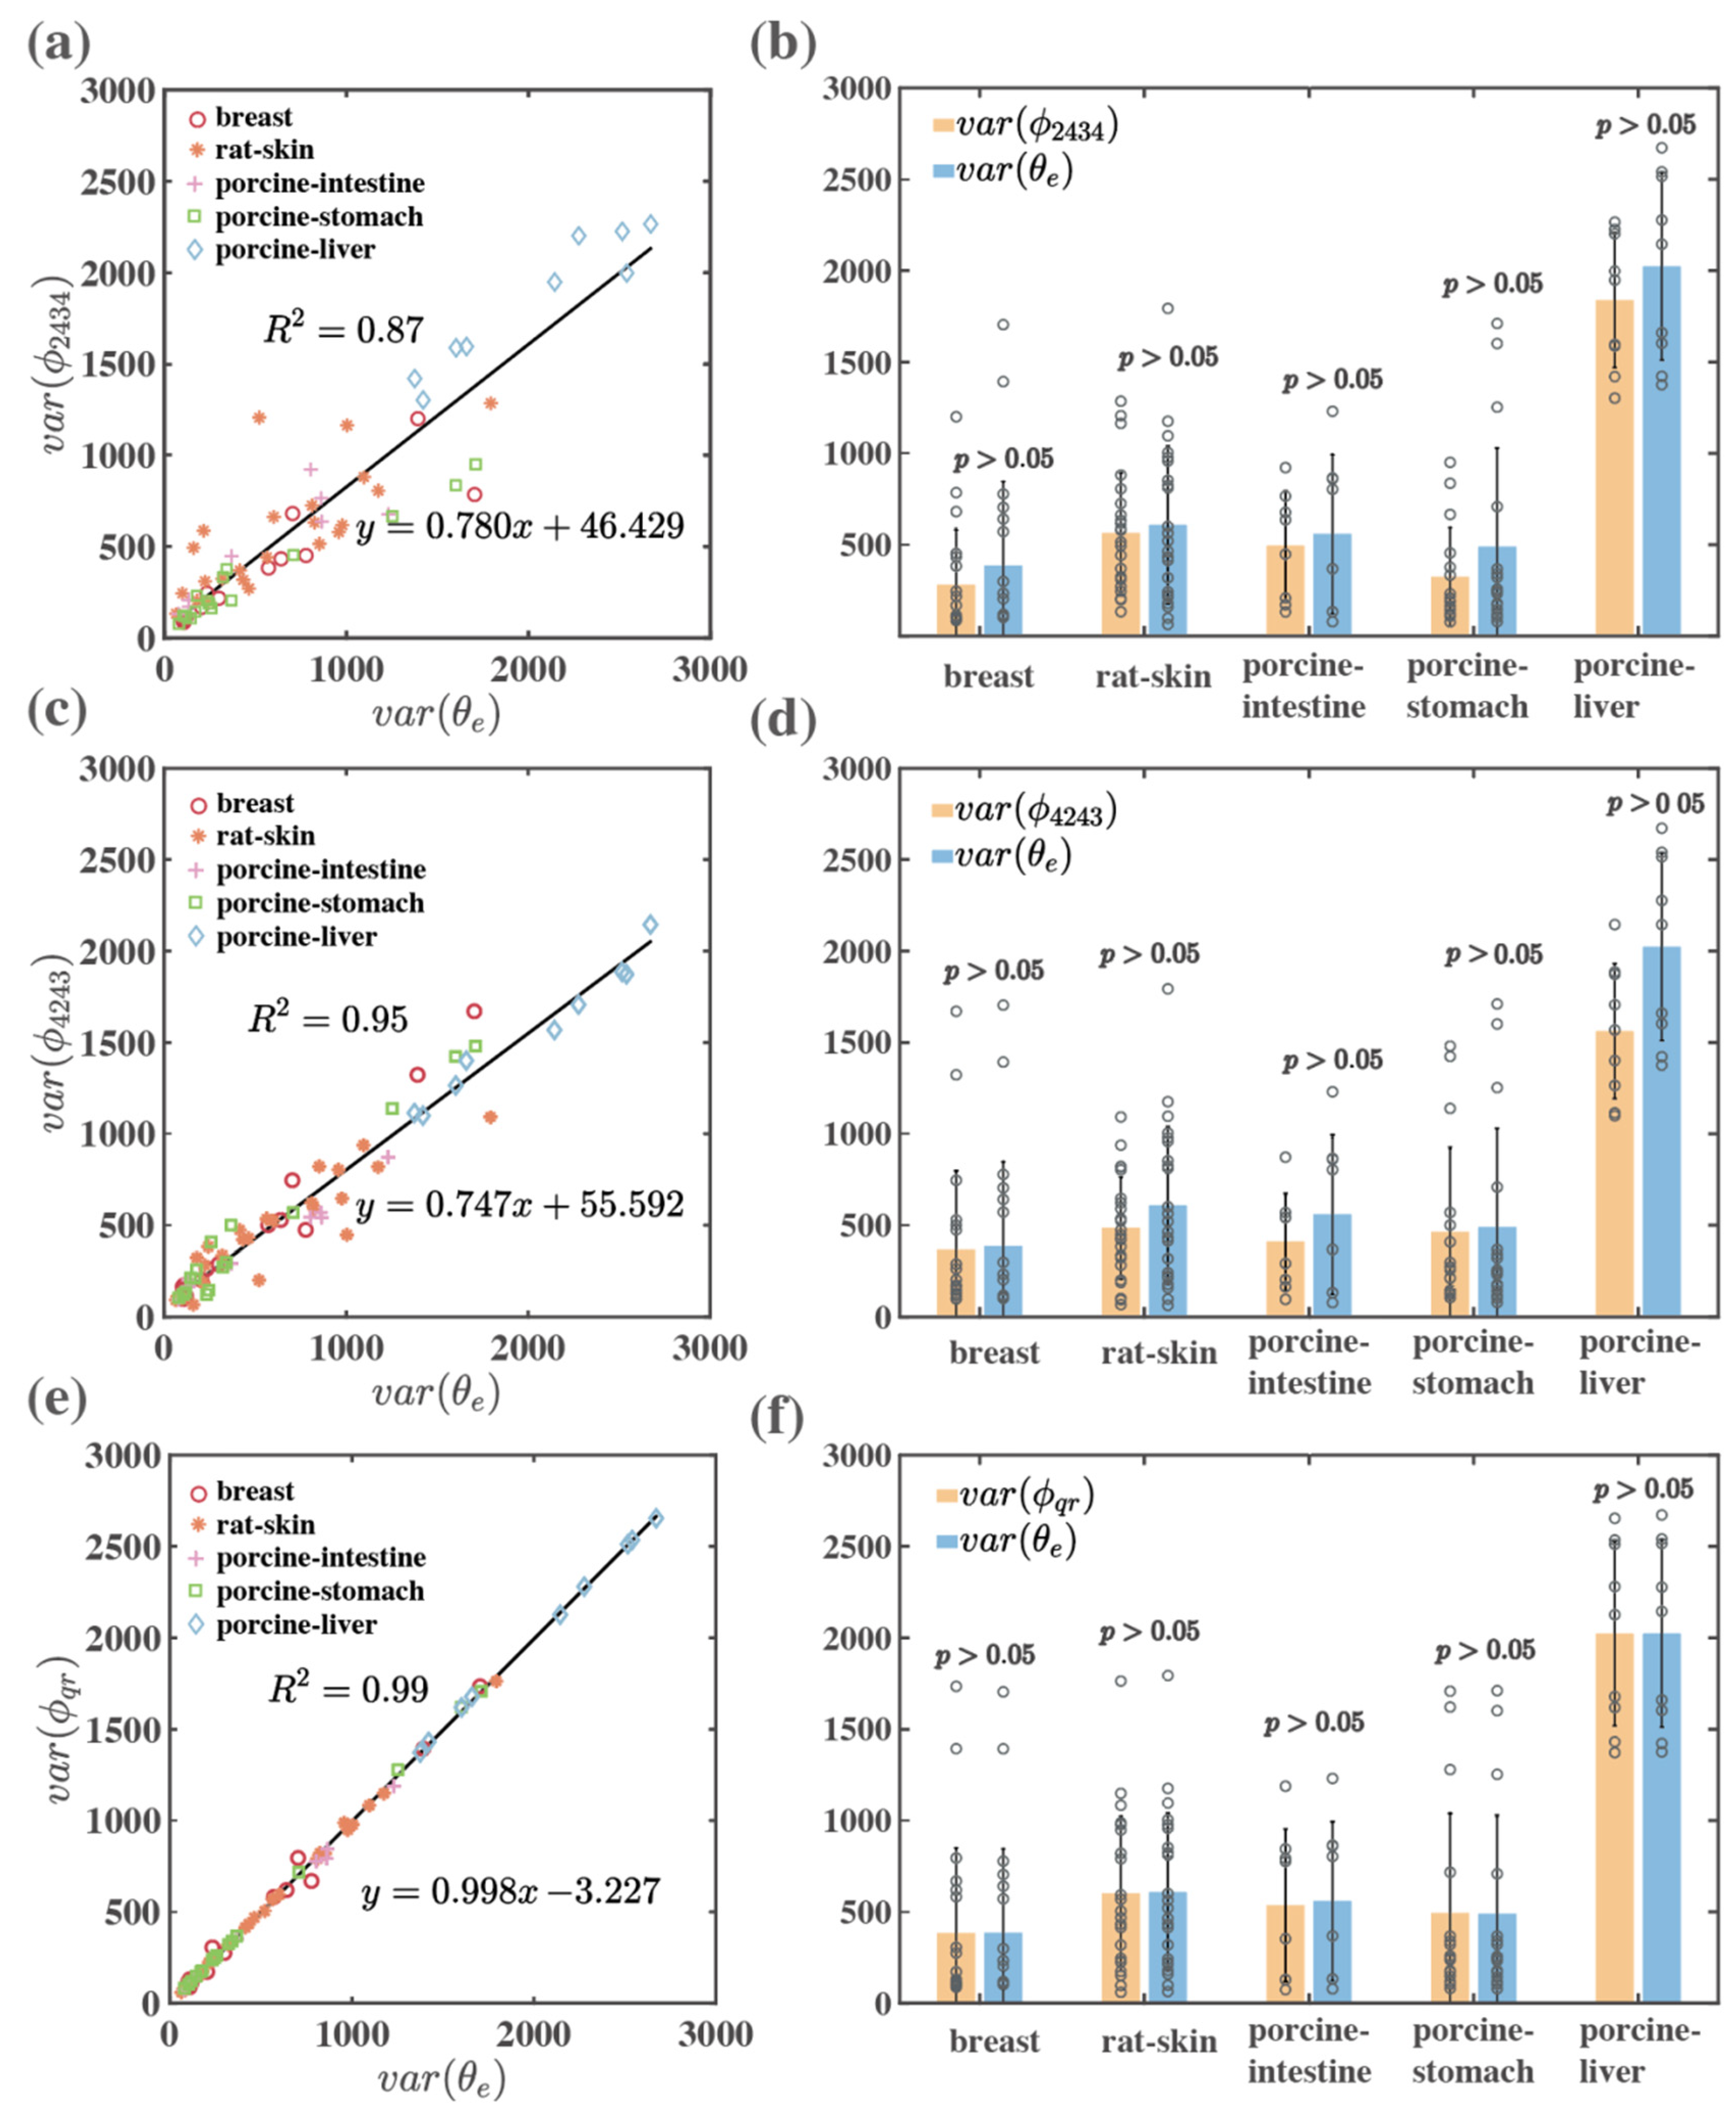
3.6. Quantitative Comparison of Linear Birefringence Orientation Related MMPD and MMT Parameters for Backscattering Imaging of Bulk Tissue Samples

For the backscattering measurement results of bulk tissue samples, the modified linear birefringence orientation MMT parameter ϕqr also shows a good fit with the MMPD parameter θe. As shown in Table 7, the correlation coefficient values of each kind of bulk tissue samples for the parameters group (θe, ϕqr) are all equal to 0.99, while those for (θe, ϕ2434), (θe, ϕ4243) range between 0.58 and 0.97. We can also see that the data points of all tissue samples are evenly distributed along a straight line in Figure 6e. Particularly, Table 7 and Figure 6f also confirm that the parameters (θe, ϕqr) show no statistically significant differences with the p > 0.05. Therefore, when measuring linear birefringence orientation of bulk tissue samples using backscattering polarimetry, both the parameters ϕqr and θe can provide quantitatively similar information, and ϕqr can be calculated faster.
In summary, the results shown in Section 3.5 and Section 3.6 demonstrate that among the available MMT linear birefringence orientation parameters, ϕqr shows the best accordance with the MMPD parameter θe. The parameters ϕ2434 and ϕ4243 only contain partial linear birefringence orientation information of tissue samples with layered fibrous structures. Thus, when taking the elements m24, m34, m42, and m43 from both the fourth column and fourth row of the Mueller matrix into account, the modified parameter ϕqr can well present the linear birefringence orientation information more thoroughly.

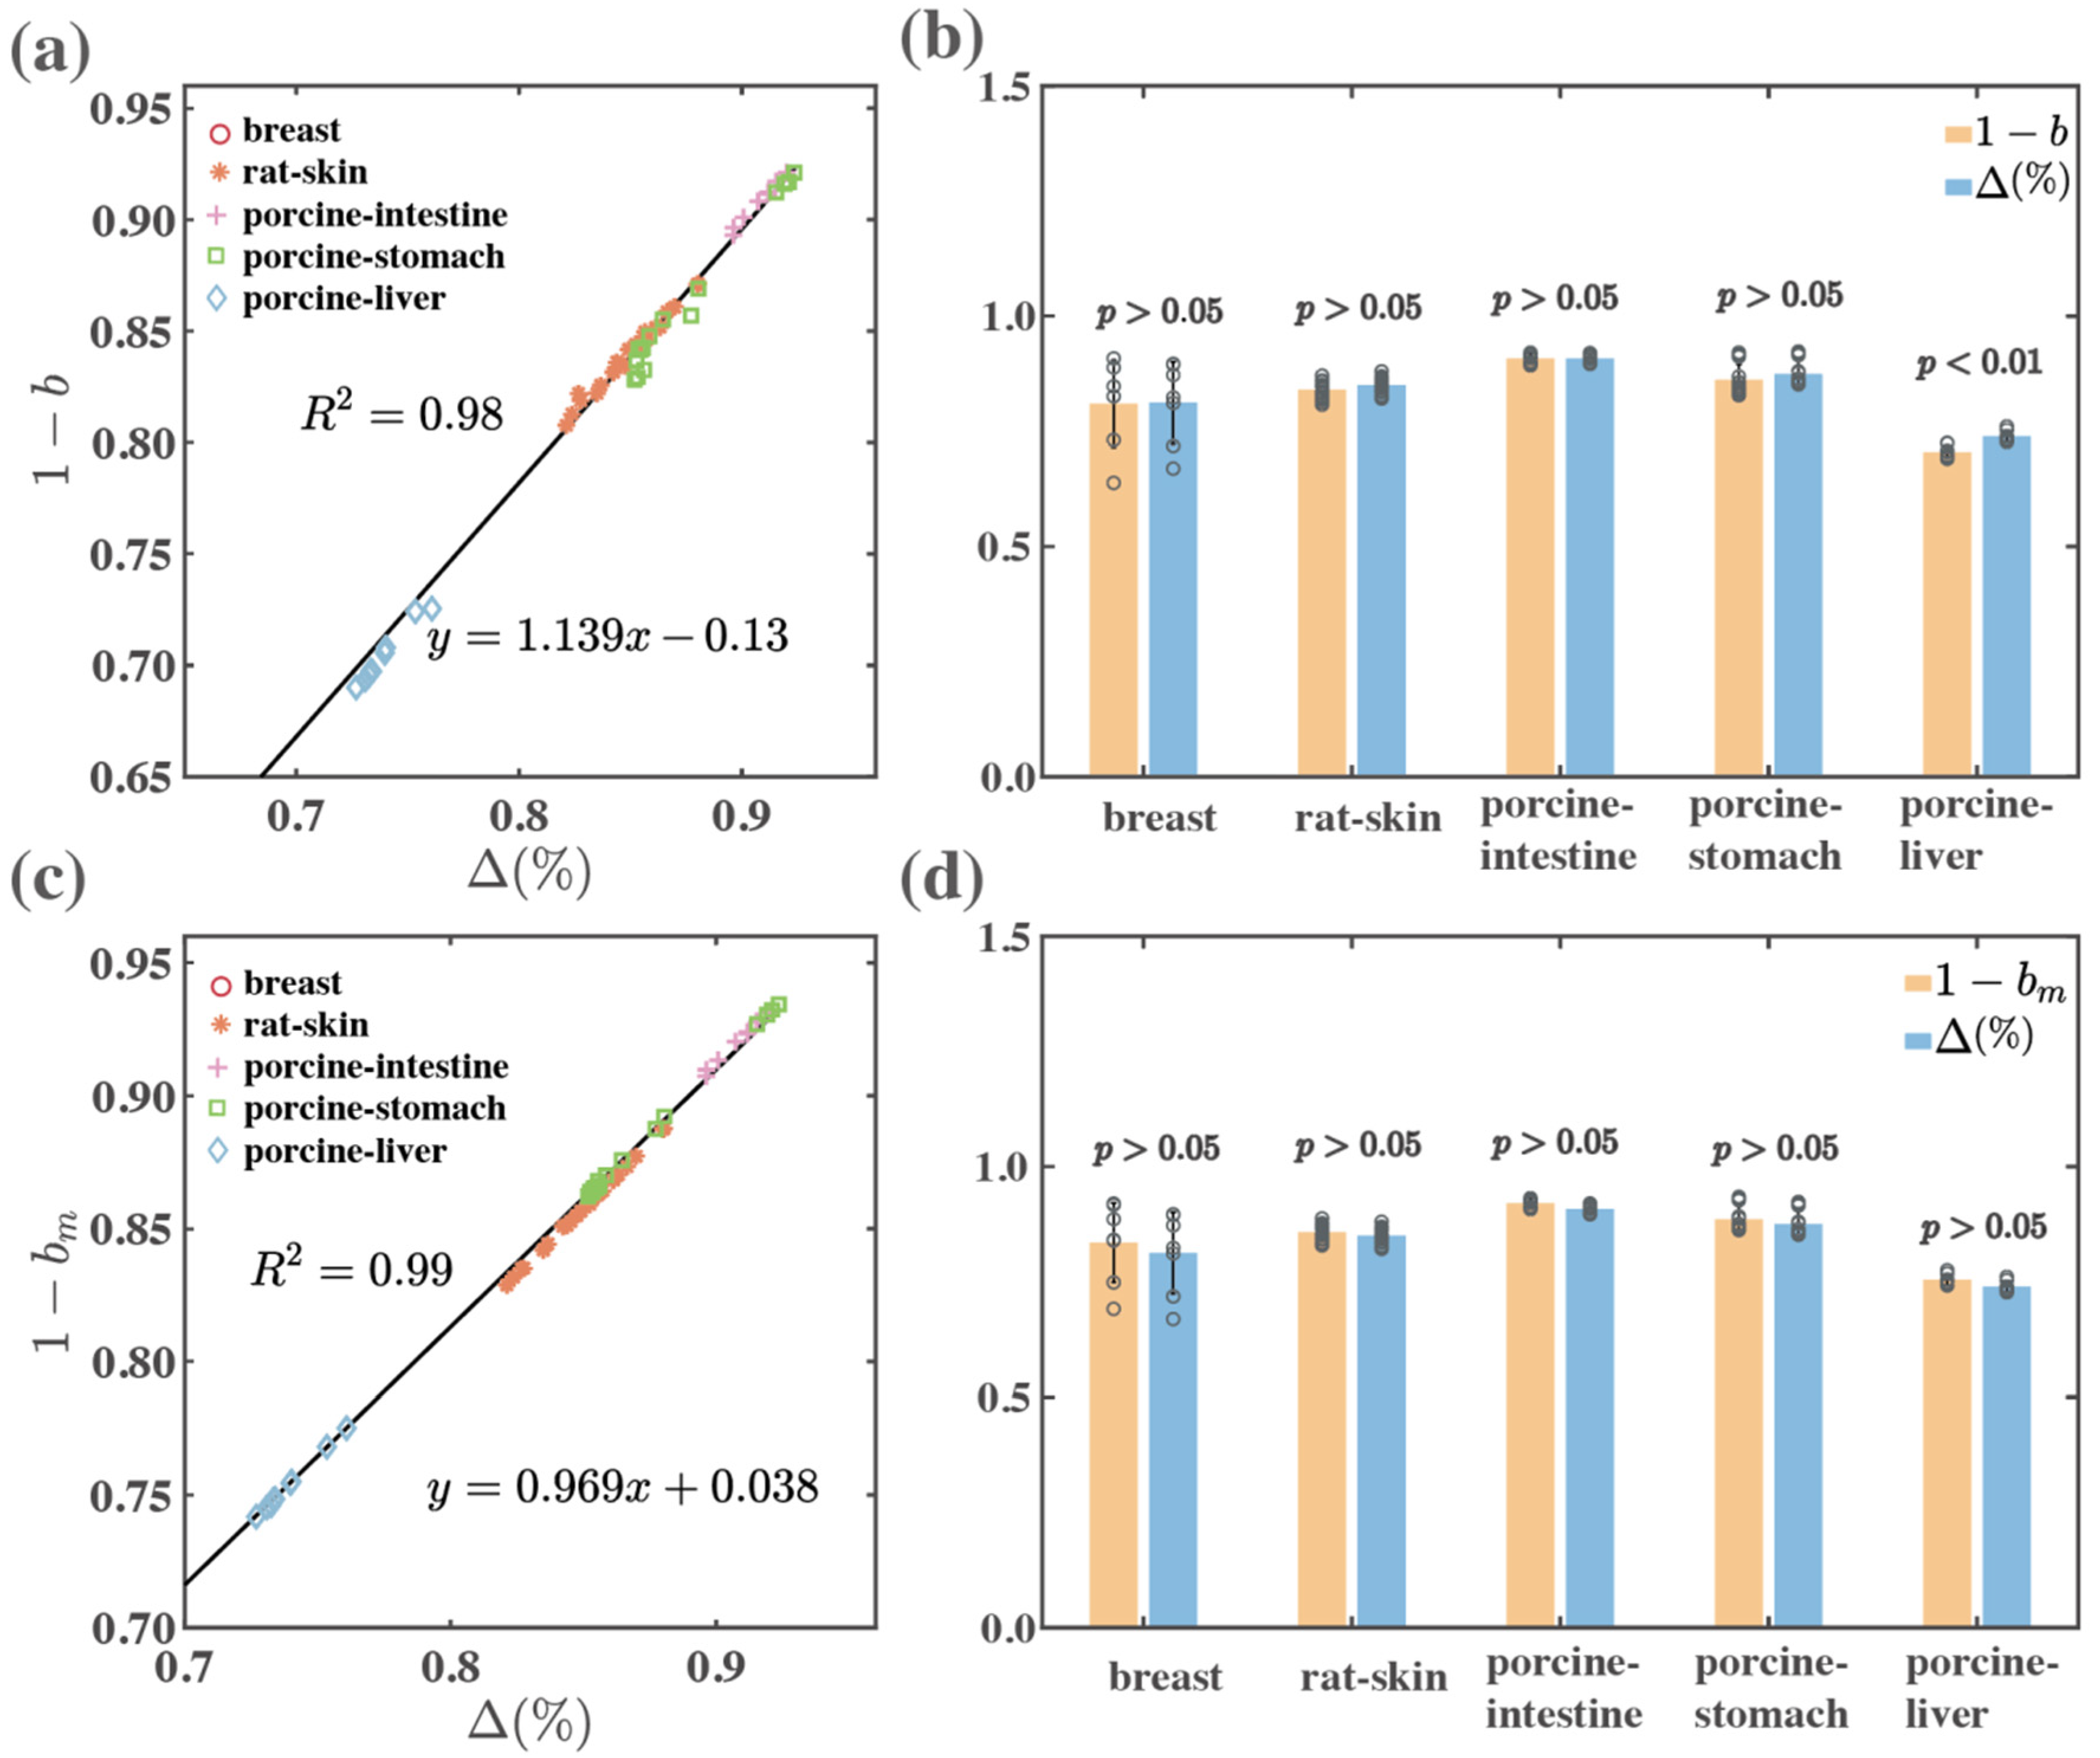
3.7. Quantitative Comparison of Depolarization MMPD and MMT Parameters for Transmission Imaging of Thin Tissue Samples

In previous studies, both the MMT parameter 1 − b shown in Equation (14) and MMPD parameter Δ shown in Equation (4) have been used to represent the depolarization property of tissue samples [5]. However, there would be a deviation between these two parameters when the medium contains a circular depolarization property encoded in the element m44, which the parameter 1-b does not take into account. To more accurately represent the overall depolarization of tissues, we proposed a modified parameter 1 − bm as Equation (18) shows. The comparison results of the MMT and MMPD depolarization parameters for 7 kinds of thin tissue samples are shown in Table 8 and Figure 7.
For the correlation analysis, the values of parameters groups of (Δ, 1 − b) and (Δ, 1 − bm) are close and much smaller than 1 for most of the tissue samples indicated in Table 8, which means both groups of parameters hardly exist in a linear relationship. More intuitive comparisons illustrated in Figure 7a,c confirm that all the sample data points distribute randomly. For the statistical analysis, most of the samples show statistically significant differences with p < 0.01 for the parameters groups (Δ, 1 − b) and (Δ, 1 − bm) shown in Table 8. From Figure 7b,d, we can find that the MMPD and MMT depolarization parameters values of thin tissue samples are smaller than 0.02. This is the reason why the parameters (Δ, 1 − b) and (Δ, 1 − bm) show no significant difference in correlation analysis for the thin tissue samples with a limited thickness.

3.8. Quantitative Comparison of Linear Birefringence Orientation Related MMPD and MMT Parameters for Backscattering Imaging of Bulk Tissue Samples

For the bulk tissue samples, both the MMT parameters 1 − b and 1 − bm show a good accordance with the MMPD parameter Δ. As shown in Table 9, the correlation coefficient values of all kinds of bulk tissue samples for parameters group (Δ, 1 − bm) are equal to 0.99, which differ from that for the group (Δ, 1 − b) ranging between 0.96 and 0.98. Moreover, we can also see that the data points of the tissue samples evenly distributed along a straight line in Figure 8a,c. Besides, Figure 8b,d indicate that the MMPD depolarization parameter Δ is approximately equal to the MMT parameters. Specifically, the parameters group (Δ, 1 − bm) shows no statistically significant difference with p > 0.05. Therefore, it is worth noting that when bulk tissue samples are measured using backscattering equipment, the parameter 1 − bm can be used to extract the depolarization information quickly and accurately.

4. Conclusions

In this study we compared the parameters derived from the MMT and MMPD methods thoroughly by measuring two types of tissue samples: seven kinds of thin tissue slices and five kinds of bulk tissue samples, with a transmission Mueller matrix microscope and backscattering Mueller matrix measurement setup. After grouping the parameters with the same polarization properties, namely diattenuation, linear retardance, linear birefringence fast axis orientation and depolarization, we performed both correlation and statistical analysis. Our preliminary experimental results showed that: (1) for obtaining the diattenuation property of complex tissues, we can calculate it through the modified MMT parameter t121314, with a fast speed and a high correlation with the MMPD parameter D; (2) for revealing the linear retardance value related to the density of birefringent structures like layered fibers of thin tissues, the modified MMT parameter tqr can reach a high linear correlation with the MMPD parameter δ. While for the bulk tissue samples, it is more reasonable to use the MMPD parameter δ to extract the linear retardance value accurately; (3) for characterizing the orientation distribution of the birefringent structures, the modified MMT parameter ϕqr and MMPD parameter θe can both reach similar accurate results for thin and thick tissues; (4) the modified MMT parameter 1 − bm shows a high degree of consistency with the MMPD parameter Δ for the bulk tissue samples with strong depolarization, so it can be used to quickly evaluate the tissue depolarization property. In summary, based on the analysis and discussion regarding the applicability of the MMPD and MMT parameters, this study gave suggestions for the appropriate selection of parameters in Mueller matrix imaging for different types of tissue samples, which can be useful for biomedical and clinical polarimetry.

Author Contributions

Conceptualization, B.C. and Y.L.; Data curation, B.C. and Y.L.; Formal analysis, B.C.; investigation, B.C., H.Z. and L.D.; Funding acquisition, H.H.; Methodology, B.C. and Y.L.; Project administration, H.H.; Software, B.C., H.Z. and L.D.; Supervision, H.H. and H.M. (Hua Mao); Writing—original draft, B.C.; Writing—review and editing, H.H., H.M. (Hua Mao) and H.M. (Hui Ma). All authors have read and agreed to the published version of the manuscript.

Funding

National Natural Science Foundation of China (NSFC) (No. 61527826), Shenzhen Fundamental Research and Discipline Layout Project (No. JCYJ20170412170814624), and Overseas Research Cooperation Project of Tsinghua Shenzhen International Graduate School (No. HW2018005).

Institutional Review Board Statement

The study was conducted according to the guidelines of the Declaration of Helsinki, and approved by the Ethics Committee of the Shenzhen International Graduate School, Tsinghua University (protocol code 2021–29, date of approval 16 March 2021, and protocol code 2021-40, date of approval 31 May 2021).

Informed Consent Statement

Informed consent was obtained from all subjects involved in the study.

Data Availability Statement

The data presented in this study are available on request from the corresponding author.

Conflicts of Interest

The authors declare no conflict of interest.

References

  1. Ghosh, N.; Vitkin, A.I. Tissue polarimetry: Concepts, challenges, applications, and outlook. J. Biomed. Opt. 2011, 16, 110801. [Google Scholar] [CrossRef] [PubMed] [Green Version]
  2. He, C.; He, H.; Chang, J.; Chen, B.; Ma, H.; Booth, M.J. Polarisation optics for biomedical and clinical applications: A review. Light Sci. Appl. 2021, 10, 194. [Google Scholar] [CrossRef] [PubMed]
  3. Ramella-Roman, J.; Saytashev, I.; Piccini, M. A review of polarization-based imaging technologies for clinical and pre-clinical applications. J. Opt. 2020, 22, 123001. [Google Scholar] [CrossRef]
  4. Tuchin, V.V. Polarized light interaction with tissues. J. Biomed. Opt. 2016, 21, 071114. [Google Scholar] [CrossRef] [Green Version]
  5. He, H.; Liao, R.; Zeng, N.; Li, P.; Chen, Z.; Liu, X.; Ma, H. Mueller matrix polarimetry—An emerging new tool for characterizing the microstructural feature of complex biological specimen. J. Lightwave Technol. 2019, 37, 2534–2548. [Google Scholar] [CrossRef]
  6. Qi, J.; Elson, D.S. Mueller polarimetric imaging for surgical and diagnostic applications: A review. J. Biophotonics 2017, 10, 950–982. [Google Scholar] [CrossRef] [Green Version]
  7. Alali, S.; Vitkin, I.A. Polarized light imaging in biomedicine: Emerging Mueller matrix methodologies for bulk tissue assessment. J. Biomed. Opt. 2015, 20, 061104. [Google Scholar] [CrossRef]
  8. Ossikovski, R. Analysis of depolarizing Mueller matrices through a symmetric decomposition. J. Opt. Soc. Am. A 2009, 26, 1109–1118. [Google Scholar] [CrossRef] [PubMed]
  9. Vizet, J.; Ossikovski, R. Symmetric decomposition of experimental depolarizing Mueller matrices in the degenerate case. Appl. Opt. 2018, 57, 1159–1167. [Google Scholar] [CrossRef]
  10. Ortega-Quijano, N.; Arce-Diego, J.L. Depolarizing differential Mueller matrices. Opt. Lett. 2011, 36, 2429–2431. [Google Scholar] [CrossRef] [Green Version]
  11. Ossikovski, R. Differential matrix formalism for depolarizing anisotropic media. Opt. Lett. 2011, 36, 2330–2332. [Google Scholar] [CrossRef] [PubMed]
  12. Lu, S.Y.; Chipman, R.A. Interpretation of Mueller matrices based on polar decomposition. J. Opt. Soc. Am. A. 1996, 13, 1106–1113. [Google Scholar] [CrossRef]
  13. Ghosh, N.; Wood, M.F.G.; Vitkin, I.A. Mueller matrix decomposition for extraction of individual polarization parameters from complex turbid media exhibiting multiple scattering, optical activity, and linear birefringence. J. Biomed. Opt. 2008, 13, 044036. [Google Scholar] [CrossRef] [PubMed]
  14. He, H.; Zeng, N.; Du, E.; Guo, Y.; Li, D.; Liao, R.; Ma, H. A possible quantitative Mueller matrix transformation technique for anisotropic scattering media. Photonics Lasers Med. 2013, 2, 129–137. [Google Scholar] [CrossRef]
  15. Dong, Y.; Qi, J.; He, H.; He, C.; Liu, S.; Wu, J.; Elson, D.S.; Ma, H. Quantitatively characterizing the microstructural features of breast ductal carcinoma tissues in different progression stages by Mueller matrix microscope. Biomed. Opt. Express 2017, 8, 3643–3655. [Google Scholar] [CrossRef] [Green Version]
  16. Dong, Y.; Liu, S.; Shen, Y.; He, H.; Ma, H. Probing variations of fibrous structures during the development of breast ductal carcinoma tissues via Mueller matrix imaging. Biomed. Opt. Express 2020, 11, 4960–4975. [Google Scholar] [CrossRef] [PubMed]
  17. Wang, Y.; He, H.; Chang, J.; He, C.; Liu, S.; Li, M.; Zeng, N.; Wu, J.; Ma, H. Mueller matrix microscope: A quantitative tool to facilitate detections and fibrosis scorings of liver cirrhosis and cancer tissues. J. Biomed. Opt. 2016, 21, 071112. [Google Scholar] [CrossRef] [PubMed] [Green Version]
  18. Liu, T.; Lu, M.; Chen, B.; Zhong, Q.; Li, J.; He, H.; Ma, H. Distinguishing structural features between Crohn’s disease and gastrointestinal luminal tuberculosis using Mueller matrix derived parameters. J. Biophotonics 2019, 12, e201900151. [Google Scholar] [CrossRef]
  19. Pierangelo, A.; Nazac, A.; Benali, A.; Validire, P.; Cohen, H.; Novikova, T.; Ibrahim, B.H.; Manhas, S.; Fallet, C.; Antonelli, M.; et al. Polarimetric imaging of uterine cervix: A case study. Opt. Express 2013, 21, 14120–14130. [Google Scholar] [CrossRef]
  20. Wang, Y.; He, H.; Chang, J.; Zeng, N.; Liu, S.; Li, M.; Ma, H. Differentiating characteristic microstructural features of cancerous tissues using Mueller matrix microscope. Micron 2015, 79, 8–15. [Google Scholar] [CrossRef]
  21. Iqbal, M.; Ahmad, I.; Khaliq, A.; Khan, S. Comparative study of Mueller matrix transformation and polar decomposition for optical characterization of turbid media. Optik 2020, 224, 165508. [Google Scholar] [CrossRef]
  22. Khaliq, A.; Ashraf, S.; Gul, B.; Ahmad, I. Comparative study of 3 × 3 Mueller matrix transformation and polar decomposition. Opt. Commun. 2021, 485, 126756. [Google Scholar] [CrossRef]
  23. Iqbal, M.; Gul, B.; Khan, S.; Ashraf, S.; Ahmad, I. Isolating individual polarization effects from the Mueller matrix: Comparison of two non-decomposition techniques. Biomed. Opt. Express 2021, 12, 3743–3759. [Google Scholar] [CrossRef]
  24. Sheng, W.; Li, W.; Qi, J.; Liu, T.; Dong, Y.; Liu, S.; Wu, J.; Ma, H.; He, H.; Elson, D.S. Quantitative analysis of 4 × 4 Mueller matrix transformation parameters for biomedical imaging. Photonics 2019, 6, 34. [Google Scholar] [CrossRef] [Green Version]
  25. Sun, T.; Liu, T.; He, H.; Wu, J.; Ma, H. Distinguishing anisotropy orientations originated from scattering and birefringence of turbid media using Mueller matrix derived parameters. Opt. Lett. 2018, 43, 4092–4095. [Google Scholar] [CrossRef]
  26. Chen, B.; Li, W.; He, H.; He, C.; Guo, J.; Shen, Y.; Liu, S.; Sun, T.; Wu, J.; Ma, H. Analysis and calibration of linear birefringence orientation parameters derived from Mueller matrix for multi-layered tissues. Opt. Lasers Eng. 2021, 146, 106690. [Google Scholar] [CrossRef]
  27. Shen, Y.; Huang, R.; He, H.; Liu, S.; Dong, Y.; Wu, J.; Ma, H. Comparative study of the influence of imaging resolution on linear retardance parameters derived from the Mueller matrix. Biomed. Opt. Express 2021, 12, 211–225. [Google Scholar] [CrossRef] [PubMed]
  28. He, C.; Chang, J.; Hu, Q.; Wang, J.; Antonello, J.; He, H.; Liu, S.; Lin, J.; Dai, B.; Elson, D.S.; et al. Complex vectorial optics through gradient index lens cascades. Nat. Commun. 2019, 10, 1–8. [Google Scholar] [CrossRef] [PubMed] [Green Version]
  29. He, H.; Chang, J.; He, C.; Ma, H. Transformation of full 4 × 4 Mueller matrices: A quantitative technique for biomedical diagnosis. Proc. SPIE 2016, 9707, 97070K. [Google Scholar]
  30. Li, P.; Lv, D.; He, H.; Ma, H. Separating azimuthal orientation dependence in polarization measurements of anisotropic media. Opt. Express 2018, 26, 3791–3800. [Google Scholar] [CrossRef] [PubMed]
  31. Huang, T.; Meng, R.; Qi, J.; Liu, Y.; Wang, X.; Chen, Y.; Liao, R.; Ma, H. Fast Mueller matrix microscope based on dual DoFP polarimeters. Opt. Lett. 2021, 46, 1676–1679. [Google Scholar] [CrossRef]
  32. Zhou, J.; He, H.; Chen, Z.; Wang, Y.; Ma, H. Modulus design multiwavelength polarization microscope for transmission Mueller matrix imaging. J. Biomed. Opt. 2018, 23, 016007. [Google Scholar] [CrossRef] [Green Version]
  33. Chang, J.; He, H.; Wang, Y.; Huang, Y.; Li, X.; He, C.; Liao, R.; Zeng, N.; Liu, S.; Ma, H. Division of focal plane polarimeter-based 3 × 4 Mueller matrix microscope: A potential tool for quick diagnosis of human carcinoma tissues. J. Biomed. Opt. 2016, 21, 056002. [Google Scholar] [CrossRef] [PubMed] [Green Version]
  34. He, H.; Zeng, N.; Du, E.; Guo, Y.; Li, D.; Liao, R.; He, Y.; Ma, H. Two-dimensional and surface backscattering Mueller matrices of anisotropic sphere-cylinder scattering media: A quantitative study of influence from fibrous scatterers. J. Biomed. Opt. 2013, 18, 046002. [Google Scholar] [CrossRef]
  35. Chen, Z.; Meng, R.; Zhu, Y.; Ma, H. A collinear reflection Mueller matrix microscope for backscattering Mueller matrix imaging. Opt. Lasers Eng. 2020, 129, 106055. [Google Scholar] [CrossRef]
  36. Azzam, R.M.A. Photopolarimetric measurement of the Mueller matrix by Fourier analysis of a single detected signal. Opt. Lett. 1978, 2, 148–150. [Google Scholar] [CrossRef] [PubMed]
  37. De Martino, A.; Garcia-Caurel, E.; Laude, B.; Drévillon, B. General methods for optimized design and calibration of Mueller polarimeters. Thin Solid Films 2004, 455, 112–119. [Google Scholar] [CrossRef]
  38. Yu, J.; Cheng, X.; Li, M. Error analysis and calibration improvement of the imaging section in a Mueller matrix microscope. Appl. Sci. 2020, 10, 4422. [Google Scholar] [CrossRef]
  39. Sedgwick, P. Pearson’s correlation coefficient. BMJ 2012, 345, e4483. [Google Scholar] [CrossRef] [Green Version]
  40. Mukaka, M.M. A guide to appropriate use of correlation coefficient in medical research. Malawi Med. J. 2012, 24, 69–71. [Google Scholar]
  41. Krzywinski, M.; Altman, N. Significance, P values and t-tests. Nat. Methods 2013, 10, 1041–1042. [Google Scholar] [CrossRef] [PubMed] [Green Version]
  42. Goldstein, D.H.; Collett, E. Polarized Light; CRC Press: Boca Raton, FL, USA, 2003. [Google Scholar]
Figure 1. Comparison of forward measured MMT and MMPD diattenuation parameters of thin tissue samples. (a) MMPD parameter D plotted against its counterpart MMT parameter t1213 for correlation analysis with all 7 kinds of thin tissue samples. (b) Statistical analysis bar chart of MMPD parameter D and MMT parameter t1213 for each kind of thin tissue samples. (c) MMPD parameter D plotted against its counterpart modified MMT parameter t121314 for correlation analysis with all 7 kinds of thin tissue samples. (d) Statistical analysis bar chart of MMPD parameter D and modified MMT parameter t121314 for each kind of thin tissue samples.
Applsci 11 10416 g001
Figure 2. Comparison of backward measured MMT and MMPD diattenuation parameters of bulk tissue samples. (a) MMPD parameter D plotted against its counterpart MMT parameter t1213 for correlation analysis with all five kinds of bulk tissue samples. (b) Statistical analysis bar chart of MMPD parameter D and MMT parameter t1213 for each kind of bulk tissue samples. (c) MMPD parameter D plotted against its counterpart modified MMT parameter t121314 for correlation analysis with all five kinds of bulk tissue samples. (d) Statistical analysis bar chart of MMPD parameter D and modified MMT parameter t121314 for each kind of bulk tissue samples.
Applsci 11 10416 g002
Figure 3. Comparison of MMT and MMPD linear retardance parameters of thin tissue samples. (a) Linear retardance MMPD parameter δ plotted against its counterpart MMT parameter t2434 for correlation analysis with all seven kinds of thin tissue samples. (b) Statistical analysis bar chart of linear retardance MMPD parameter δ and MMT parameter t2434 for each kind of thin tissue samples. (c) Linear retardance MMPD parameter δ plotted against its counterpart MMT parameter t4243 for correlation analysis with all seven kinds of thin tissue samples. (d) Statistical analysis bar chart of linear retardance MMPD parameter δ and MMT parameter t4243 for each kind of thin tissue samples. (e) Linear retardance MMPD parameter δ plotted against its counterpart MMT parameter tqr for correlation analysis with all seven kinds of thin tissue samples. (f) Statistical analysis bar chart of linear retardance MMPD parameter δ and MMT parameter tqr for each kind of thin tissue sample.
Applsci 11 10416 g003
Figure 4. Comparison of MMT and MMPD linear retardance parameters of bulk tissue samples. (a) Linear retardance MMPD parameter δ plotted against its counterpart MMT parameter t2434 for correlation analysis with all five kinds of bulk tissue samples. (b) Statistical analysis bar chart of linear retardance related MMPD parameter δ and MMT parameter t2434 for each kind of bulk tissue samples. (c) Linear retardance MMPD parameter δ plotted against its counterpart MMT parameter t4243 for correlation analysis with all five kinds of bulk tissue samples. (d) Statistical analysis bar chart of linear retardance MMPD parameter δ and MMT parameter t4243 for each kind of bulk tissue samples. (e) Linear retardance MMPD parameter δ plotted against its counterpart MMT parameter tqr for correlation analysis with all five kinds of bulk tissue samples. (f) Statistical analysis bar chart of linear retardance MMPD parameter δ and MMT parameter tqr for each kind of bulk tissue sample.
Applsci 11 10416 g004
Figure 5. Comparison of linear birefringence fast axis orientation MMT and MMPD parameters of thin tissue samples. (a) Variance of linear birefringence orientation MMPD parameter θe plotted against its counterpart MMT parameter ϕ2434 for correlation analysis with all seven kinds of thin tissue samples. (b) Statistical analysis bar chart of linear birefringence orientation MMPD parameter θe and MMT parameter ϕ2434 for each kind of thin tissue samples. (c) Variance of linear birefringence orientation MMPD parameter θe plotted against its counterpart MMT parameter ϕ4243 for correlation analysis with all seven kinds of thin tissue samples. (d) Statistical analysis bar chart of linear birefringence orientation MMPD parameter θe and MMT parameter ϕ4243 for each kind of thin tissue samples. (e) Variance of linear birefringence orientation MMPD parameters θe plotted against its counterpart MMT parameter ϕqr for correlation analysis with all seven kinds of thin tissue samples. (f) Statistical analysis bar chart of linear birefringence orientation MMPD parameter θe and MMT parameter ϕqr for each kind of thin tissue sample.
Applsci 11 10416 g005
Figure 6. Comparison of linear birefringence fast axis orientation MMT and MMPD parameters of bulk tissue samples. (a) Variance of linear birefringence orientation MMPD parameters θe plotted against its counterpart MMT parameter ϕ2434 for correlation analysis with all five kinds of bulk tissue samples. (b) Statistical analysis bar chart of linear birefringence orientation MMPD parameter θe and MMT parameter ϕ2434 for each kind of bulk tissue samples. (c) Variance of linear birefringence orientation MMPD parameters θe plotted against its counterpart MMT parameter ϕ4243 for correlation analysis with all five kinds of bulk tissue samples. (d) Statistical analysis bar chart of linear birefringence orientation MMPD parameter θe and MMT parameter ϕ4243 for each kind of bulk tissue samples. (e) Variance of linear birefringence orientation MMPD parameter θe plotted against its counterpart MMT parameter ϕqr for correlation analysis with all five kinds of bulk tissue samples. (f) Statistical analysis bar chart of linear birefringence orientation MMPD parameter θe and MMT parameter ϕqr for each kind of bulk tissue sample.
Applsci 11 10416 g006
Figure 7. Comparison of MMT and MMPD depolarization parameters of thin tissue samples. (a) Depolarization MMPD parameter Δ plotted against its counterpart MMT parameter 1 − b for correlation analysis with all seven kinds of thin tissue samples. (b) Statistical analysis bar chart of depolarization MMPD parameter Δ and MMT parameter 1 − b for each kind of thin tissue samples. (c) Depolarization MMPD parameter Δ plotted against its counterpart MMT parameter 1 − bm for correlation analysis with all seven kinds of thin tissue samples. (d) Statistical analysis bar chart of depolarization MMPD parameter Δ and MMT parameter 1 − bm for each kind of thin tissue sample.
Applsci 11 10416 g007
Figure 8. Comparison of MMT and MMPD depolarization parameters of bulk tissue samples. (a) Depolarization MMPD parameter Δ plotted against its counterpart MMT parameter 1 − b for correlation analysis with all five kinds of bulk tissue samples. (b) Statistical analysis bar chart of depolarization MMPD parameter Δ and MMT parameter 1 − b for each kind of bulk tissue samples. (c) Depolarization MMPD parameter Δ plotted against its counterpart MMT parameter 1 − bm for correlation analysis with all five kinds of bulk tissue samples. (d) Statistical analysis bar chart of depolarization MMPD parameter Δ and MMT parameter 1 − bm for each kind of bulk tissue sample.
Applsci 11 10416 g008
Table 1. Description of the tissue samples (n = 149) and the experimental setup of the Mueller matrix polarimetry systems.
TypeSample DescriptionExperimental SetupTotal
SampleThickness (μm)NumberLight Source λ   ( nm ) Power (W)Geometry
Thincolorectal1214LED6331Forward86
ITB1214LED6331
liver126LED6331
CD1210LED6331
bladder1214LED6331
breast1214LED6331
adenoma1214LED6331
Bulkbreast-7LED6331Backward63
rat-skin-23LED6331
porcine-intestine-8LED6331
porcine-stomach-16LED6331
porcine-liver-9LED6331
Table 2. Correlation and statistical analysis comparison results between forward measured MMT and MMPD diattenuation parameters for each kind of thin tissue samples.
TypeTissuesDiattenuation
R2p
Dt1213Dt121314Dt1213Dt121314
Forwardcolorectal0.991.00>0.05>0.05
ITB0.901.00<0.01>0.05
liver0.991.00>0.05>0.05
CD0.991.00>0.05>0.05
bladder0.991.00>0.05>0.05
breast0.981.00>0.05>0.05
adenoma0.991.00>0.05>0.05
Total0.991.00>0.05>0.05
Table 3. Correlation and statistical analysis comparison results between backward measured MMT and MMPD diattenuation parameters for each kind of bulk tissue samples.
TypeTissuesDiattenuation
R2p
Dt1213Dt121314Dt1213Dt121314
Backwardbreast0.991.00>0.05>0.05
rat-skin0.941.00<0.05>0.05
porcine-intestine0.991.00<0.01>0.05
porcine-stomach0.921.00<0.05>0.05
porcine-liver0.991.00>0.05>0.05
Total0.991.00<0.05>0.05
Table 4. Correlation and statistical analysis comparison results between forward measured MMT and MMPD linear retardance parameters for each kind of thin tissue sample.
TypeTissuesLinear Retardance
R2p
δt2434δt4243δtqrδt2434δt4243δtqr
Forwardcolorectal0.970.940.99<0.01<0.01<0.01
ITB0.930.930.97<0.01<0.01<0.01
liver0.980.990.99<0.01<0.01<0.01
CD0.910.930.93<0.01<0.01<0.01
bladder0.990.990.99<0.01<0.01<0.01
breast0.900.910.99<0.01<0.01<0.01
adenoma0.970.940.99<0.01<0.01<0.01
Total0.980.980.99<0.01<0.01<0.01
Table 5. Correlation and statistical analysis comparison results between backscattering measured MMT and MMPD linear retardance parameters for each kind of bulk tissue samples.
TypeTissuesLinear Retardance
R2p
δt2434δt4243δtqrδt2434δt4243δtqr
Backwardbreast0.650.760.73<0.05<0.05<0.05
rat-skin0.460.650.68<0.01<0.01<0.01
porcine-intestine0.730.740.74<0.01<0.01<0.01
porcine-stomach0.330.160.22<0.01<0.01<0.01
porcine-liver0.650.890.84<0.01<0.01<0.01
Total0.630.650.66<0.01<0.01<0.01
Table 6. Correlation and statistical analysis comparison results between forward measured MMT and MMPD linear birefringence orientation parameters for each kind of thin tissue samples.
TypeTissuesLinear Birefringence Fast Axis Orientation
R2p
θeϕ2434θeϕ4243θeϕqrθeϕ2434θeϕ4243θeϕqr
Forwardcolorectal0.970.971.00>0.05>0.05>0.05
ITB0.940.820.99>0.05<0.01>0.05
liver0.950.440.99<0.01>0.05>0.05
CD0.970.950.99>0.05>0.05>0.05
bladder0.970.930.99>0.05>0.05>0.05
breast0.940.980.99>0.05>0.05>0.05
adenoma0.980.971.00>0.05>0.05>0.05
Total0.880.920.99>0.05>0.05>0.05
Table 7. Correlation and statistical analysis comparison results between backward measured MMT and MMPD linear birefringence orientation parameters for each kind of bulk tissue samples.
TypeTissuesLinear Birefringence Fast Axis Orientation
R2p
θeϕ2434θeϕ4243θeϕqrθeϕ2434θeϕ4243θeϕqr
Backwardbreast0.970.970.99>0.05>0.05>0.05
rat-skin0.580.820.99>0.05>0.05>0.05
porcine-intestine0.750.970.99>0.05>0.05>0.05
porcine-stomach0.960.970.99>0.05>0.05>0.05
porcine-liver0.910.960.99>0.05>0.05>0.05
Total0.870.950.99>0.05>0.05>0.05
Table 8. Correlation and statistical analysis comparison results between forward measured MMT and MMPD depolarization parameters for each kind of thin tissue samples.
TypeTissuesDepolarization
R2p
Δ—1 − bΔ—1 − bmΔ—1 − bΔ—1 − bm
Forwardcolorectal0.530.50<0.01<0.01
ITB0.230.26<0.01<0.01
liver0.730.70<0.01<0.01
CD0.090.05>0.05<0.01
bladder0.430.44<0.01<0.05
breast0.490.70>0.05<0.01
adenoma0.170.11<0.01<0.05
Total0.490.49<0.01<0.01
Table 9. Correlation and statistical analysis comparison results between backward measured MMT and MMPD depolarization parameters for each kind of bulk tissue samples.
TypeTissuesDepolarization
R2p
Δ—1 − bΔ—1 − bmΔ—1 − bΔ—1 − bm
Backwardbreast0.960.99>0.05>0.05
rat-skin0.980.99>0.05>0.05
porcine-intestine0.980.99>0.05>0.05
porcine-stomach0.980.99>0.05>0.05
porcine-liver0.970.99<0.01>0.05
Total0.980.99>0.05>0.05
Publisher’s Note: MDPI stays neutral with regard to jurisdictional claims in published maps and institutional affiliations.

