Featured Application
This paper carries out the basic researches on the icing characteristics of a cylinder rotating around a vertical axis, which provides a foundation for exploring icing characteristics of the straight-bladed vertical axis wind turbine.
Abstract
Rotating machinery in cold and humid regions is prone to icing. For exploring the characteristics of icing on objects rotating around a vertical axis, such as vertical axis wind turbines (VAWT), a cylinder rotating around the vertical axis was selected as the research object in this study. Three cylinders with different diameters were selected, and icing tests carried out under different tip speed ratios (TSR) in a self-built icing wind tunnel. The icing characteristics were quantitatively analyzed using characteristic parameters, including the icing area, the dimensionless icing area, the stagnation point thickness and the dimensionless stagnation point thickness. The dimensionless stagnation point thickness decreased with increases in the diameter of the cylinder. The icing limit decreased with an increase in the rotational speed of the cylinder, and reached 50% under the high TSR condition. Various icing characteristics were also analyzed for two rotation modes: rotation around the vertical axis and around the horizontal axis. The research findings in the present study lay the theoretical and experimental foundations for exploring VAWT icing in depth.
1. Introduction
Extreme conditions, such as low temperatures, a humid environment, sandstorms and so on, have significant effects on rotating machinery, such as wind turbines and helicopters [1,2,3]. When wind turbines are working in cold and humid conditions, the blade surfaces are prone to icing. This changes the aerodynamic profile of the blade and reduces the output power of the wind turbine. As shown in Figure 1, icing accretions occur on the blade surfaces of horizontal axis wind turbines (HAWTs) and VAWTs, leading to increases in weight.
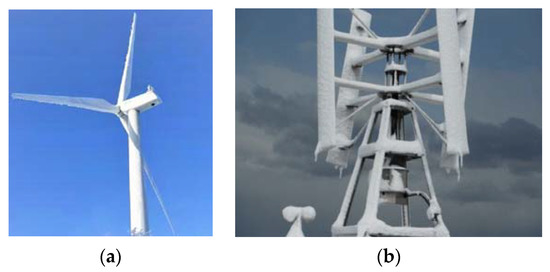
Figure 1.
Icing on wind turbines. (a) Icing on a HAWT; (b) icing on a VAWT.
Moreover, icing also changes the distribution of the load of the rotor wheel, which leads to the collapse of the wind turbine. In addition, ice shedding may occur, which threatens nearby persons and buildings [4,5,6]. Therefore, researching the characteristics of icing on rotating objects, such as the rotating blades of wind turbines and helicopters, is necessary.
At present, two types of methods are widely used to research icing on the surfaces of objects. These are the numerical simulation method and the icing wind tunnel test method [7,8,9,10]. Yi Xian conducted a three-dimensional numerical simulation on the shape and the process of icing on a 1.5 MW HAWT, and summarized the icing characteristics [11,12]. Lu Tian examined the characteristics of icing on a three-dimensional aircraft wing surface [13]. Jin studied the characteristics of the ice accretion occurring on a large wind turbine blade surface and the effect of the ice formation on the performance of the wind turbine, using an icing wind tunnel test and numerical simulation [14]. Ismail H. predicted the sizes, the shapes and the types of icing at several cross sections along the blade span using a blade element momentum tool, and the power loss due to icing was also evaluated. The calculation results showed good agreement with the AERTS results [15]. Alberto Guardone computed the ice shapes along the blade span using a two-dimensional ice accretion simulation and established the shedding time and location using a robust and efficient numerical multi-step icing simulation tool [16]. Jin Jiayi comparatively analyzed the simulation results for the flow behaviors and the resultant ice accretion for 2D and 3D numerical approaches [17]. The author also carried out experimental research on the ice accretion on S826 and S832 airfoil blades and calculated the degradation of the aerodynamic performance using computational fluid dynamics (CFD) [18]. Han implemented the Ruff scaling method to scale the atmospheric icing conditions and studied the icing shape of a scaled-down model of the blade. The experimental results showed good agreement with simulation results using LEWICE [19]. Li Yan carried out experiments on the icing of a rotating blade with an NACA0018 airfoil [20,21]. Hu Hui carried out a field study of ice accretion on a realistic wind turbine blade and predicted the ice thickness distribution using the icing similarity concept and blade element momentum theory [22,23]. However, there are many different types of airfoil blades in HAWTs, and they have complex curved surfaces. This raises a difficulty in exploring the mechanism of icing on wind turbines. Therefore, empirical ice accretion models have been developed by some scholars and cited by IEA Wind TCP Task 19, which simplify the HAWT blade to a cylinder [24]. In this way, the empirical ice accretion model can simulate the growth of ice on structures under different atmospheric conditions. It provides results in a much shorter period of time for theory and experiments and uses empirical relationships to solve the flow field rather than using the more expensive CFD models. It is a practical method of carrying out basic research on wind turbine blade icing. Launiainen J. examined the process and the shape of icing on a non-rotating cylinder surface and quantitatively analyzed the characteristics of icing via heat transfer [25,26]. Lozowski E. P. established a simulation model for icing on a non-rotating cylinder and carried out icing tests in an icing wind tunnel [27,28]. Li Yan examined and parametrically analyzed the characteristics of icing on a cylinder rotating around a horizontal axis using the icing wind tunnel method [29].
In these studies, the research object was still based on the HAWT. In contrast, research on the characteristics of icing on straight-bladed vertical axis wind turbines (SB-VAWT) is scarce. Apart from the difference in the direction of the rotation axis, there are also other differences in characteristics between the HAWT and the SB-VAWT. For the HAWT, the linear velocity increases along the blade span from the hub to the tip. For the SB-VAWT, the linear velocity along the blade span is constant. In addition, the angle of attack (AOA) of the HAWT blade is constant under given working conditions. However, that of the SB-VAWT blade changes all the time under given working conditions. Therefore, it is necessary to study the characteristics of icing on SB-VAWTs. Baizhuma used a moving reference frame (MRF) to predict the ice type and the ice accretion shapes on a static VAWT using FENSAP-ICE [30]. Chankyu Son combined a multiple reference frame (MRF) and the sliding mesh technique (SMT) to predict the ice shape on a rotating VAWT using FENSAP-ICE [31]. The simulation results showed good agreement with the experimental results. Yan Li researched the characteristics of icing the blade with airfoil NACA0018 rotating around a vertical axis by a wind tunnel test and initially explored the distribution of icing on the blade surface [32].
Similarly, there are also many kinds of airfoil blades for SB-VAWTs, and the ice accretion mainly occurs on the leading edge. It is difficult to propose a norm for assessing the characteristics of icing on all types of wind turbine blades. For this reason, the blade also can be simplified to a cylinder, as in the research method for HAWTs, as shown in Figure 2.
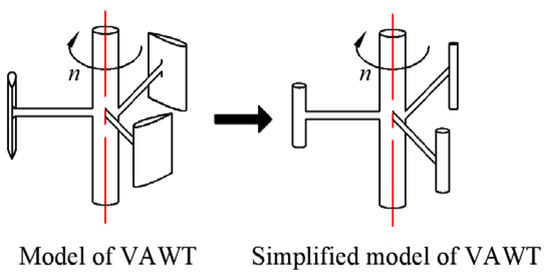
Figure 2.
Simplified model of a VAWT.
In this study, in order to conduct basic research on the characteristics of icing on VAWTs, the rotating cylinder was selected as the research object, instead of a wind turbine blade. An icing wind tunnel system was built based on a conventional tunnel that could be used at low natural winter temperatures, and the icing tests were carried out in this experimental system. The characteristics of icing on rotating cylinders with different diameters were explored under different rotational speeds and icing times, and the changing laws of icing were parametrically analyzed. The experimental results were compared with those for a cylinder rotating around the horizontal axis in previous work, and the factors leading to the differences in the two rotation modes were analyzed. The research findings provide a foundation for exploring the icing mechanism of a rotating object.
2. Experiments
2.1. Model Sample
The cylinder samples used in the icing tests were made of aluminum material. Three sizes of cylinders were selected as the research objects in this study, with diameters of d1 = 20 mm, d2 = 30 mm and d3 = 40 mm. The heights were all 20 mm.
2.2. Experimental System
In the present study, the icing tests were carried out in an icing wind tunnel system, which was designed and built as a combination of a conventional wind tunnel and a cold natural environment. The computer model and a picture of the experimental system are shown in Figure 3.
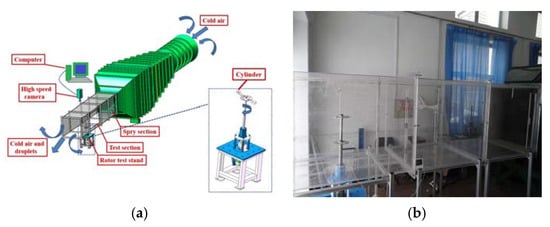
Figure 3.
Icing wind tunnel experimental system. (a) Experimental system; (b) picture of the test section.
As shown in Figure 3, the icing wind tunnel system is different from the conventional icing wind tunnels referred to in the literature. It is composed of a wind tunnel and a test section segment. The test section segment includes a spray section, a mix section, a rotor section and a water vapor exhaust section. The cooling system is omitted in this experimental system because the laboratory was located in the north-east of China. The average temperature is in the range of −21~−11 °C in winter. Outside low-temperature air is pulled into the wind tunnel and the test section. A low-speed, open-loop conventional tunnel, was modified to form the icing wind tunnel. The outlet size was 1 × 1 m2. An array of five spraying nozzles, which were movable, was located in the spray section in front of the outlet of the wind tunnel, providing the icing conditions for the test. As the experimental temperature was stable after precooling, the array of spraying nozzles was inserted into the mix section. The cross sections of the spray section, the mixing section and the test section were all 1 × 1 m2. When the icing wind tunnel system is operating, cold air is pulled into the wind tunnel and ejected into the test section. In the spray section and the mix section, the cold air is fully mixed with water droplets ejected from the spraying nozzles. Then, the water droplets are cooled and transformed into super-cooled water droplets, which flow with the cold air into the rotor section. In the rotor section, the super-cooled water droplets impinge on the rotating cylinder surface, and the ice accretion occurs. The icing shape occurring on the model sample surface was captured by a Phantom v5.1 high-speed camera. The resolution ratio was 1024 × 1024 pixels.
2.3. Experimental Scheme
In each test, two cylinders were mounted symmetrically on the rotor test stand, and the model samples rotated clockwise. The computer models are shown in Figure 4. In the present study, the radius of the rotor test stand was designed as 0.3 m, which was determined according to the outlet size of the wind tunnel and previous calibrations of the icing wind tunnel [26]. The rotor test stand is driven by a three-phase asynchronous motor, and the rotational speed was accurately modulated by a variable-frequency drive (VFD).
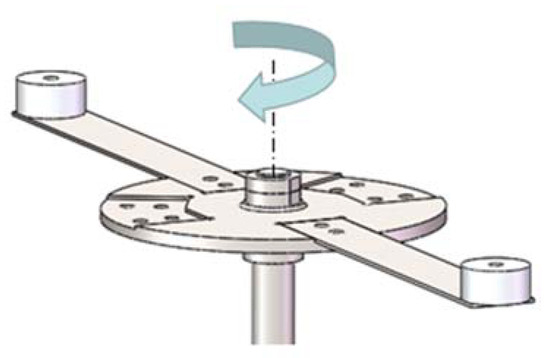
Figure 4.
Three-dimensional model of the rotor test stand.
The experimental conditions in the icing wind tunnel system were measured according to previous work [26]. In the present study, the wind speed for the icing tests was 4 m/s. The liquid water content (LWC) was 0.58 g/m3. The average medium volume diameter (MVD) was 50 μm. The experimental temperature in the test section was −12 °C. For exploring the effect of the rotational speed on the characteristics of icing on the rotating cylinder, the tip speed ratio (TSR) λ, which is the ratio of the linear velocity of the rotor to the wind speed, was used in this paper to characterize the rotational state of the rotor. The TSR is also an important parameter for characterizing the working state of a wind turbine, as expressed by Equation (1).
where λ is the tip speed ratio, R is the radius of the rotor (m), ω is the angular velocity of the rotor (rad/s), U is the wind speed (m/s), D is the diameter of the rotor (m) and n is the rotational speed of the rotor (rpm).
In this study, six values of TSR were selected: 0.2, 0.6, 1, 1.5, 2.5 and 3.5. The experimental scheme and key experimental conditions are listed in Table 1.

Table 1.
Experimental scheme and conditions.
3. Results and Discussion
3.1. Experimental Results
In the present study, the ice layer was assumed to be distributed evenly along the cylinder axis, due to the short cylinder height of only 20 mm. Therefore, at any cross section of the icing cylinder perpendicular to the axis, the profile of the icing shape can be selected as the icing shape on the cylinder surface. For convenience in recording the icing shape, the profile of the icing shape at the end face of the cylinder was used to explore and analyze the icing characteristics. Pictures of the icing on the rotating cylinder surfaces taken from the end face of the cylinder are shown in Figure 5.
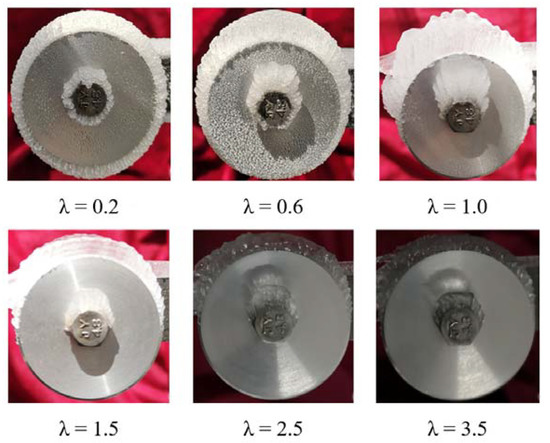
Figure 5.
Icing on the cylinder with a diameter of 40 mm.
Figure 5 shows the distributions of icing on the cylinder with a diameter of 40 mm under different TSR conditions. When the TSR is low, e.g., 0.2 or 0.6, the type of icing is rime, and the whole cylinder surface is covered by the ice layer. In contrast, when the TSR is high, e.g., 2.5 or 3.5, the type of icing is glaze, and only part of the cylinder surface is covered by the ice layer. The reasons for these results are discussed in later sections. Similarly, icing distributions on the other sizes of cylinders were also captured in the present study. After each icing test, the pictures showing the sectional icing shapes were imported into CAD software, and the size of the cylinder in the picture was adjusted to the same size as the sample. Then, the icing shape could be extracted using the SPLINE command in the CAD software, as shown in Figure 6.
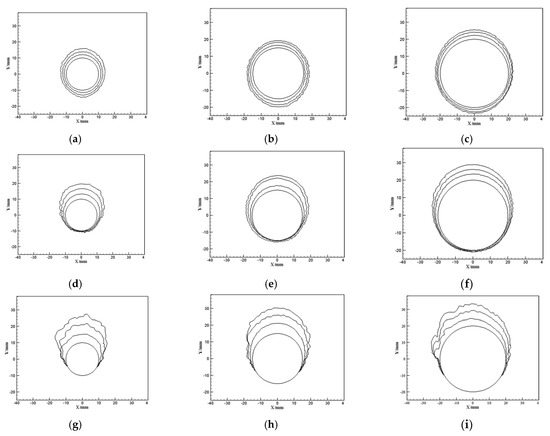
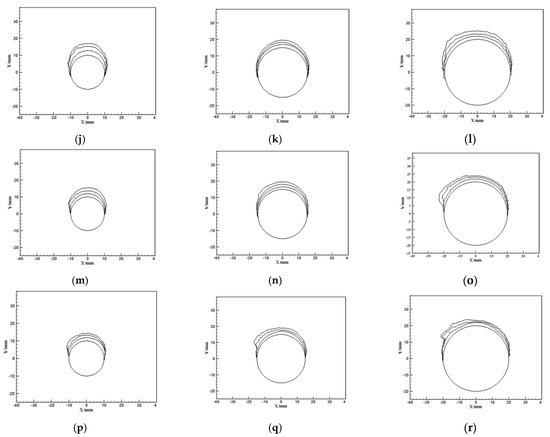
Figure 6.
Test results of icing on the rotating cylinder surface under different TSRs: (a) λ = 0.2, d = 20 mm; (b) λ = 0.2, d = 30 mm; (c) λ = 0.2, d = 40 mm; (d) λ = 0.6, d = 20 mm; (e) λ = 0.6, d = 30 mm; (f) λ = 0.6, d = 40 mm; (g) λ = 1.0, d = 20 mm; (h) λ = 1.0, d = 30 mm; (i) λ = 1.0, d = 40 mm; (j) λ = 1.5, d = 20 mm; (k) λ = 1.5, d = 30 mm; (l) λ = 1.5, d = 40 mm; (m) λ = 2.5, d = 20 mm; (n) λ = 2.5, d = 30 mm; (o) λ = 2.5, d = 40 mm; (p) λ = 3.5, d = 20 mm; (q) λ = 3.5, d = 30 mm; (r) λ = 3.5, d = 40 mm.
The surface of the cylinder can be classified into two regions, i.e., the front surface and the back surface, as shown in Figure 7.
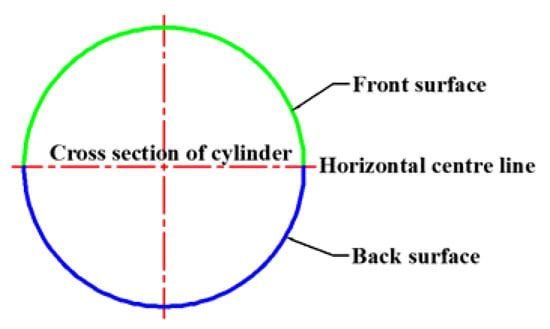
Figure 7.
Sketch map of the cylinder surface regions.
When the cylinder is rotating, the front surface is the windward side, and the back surface is the leeward side. When the TSR was 0.2, the ice layer covered the whole cylinder surface, and the icing shape was approximately circular. The ice shape was symmetrically distributed between the left part of the surface and the right part of the surface. With an increase in the rotational speed or the TSR, the icing shape became irregular, and the thickness of the ice layer on the front surface clearly increased. In contrast, the thickness of the ice layer on the back surface decreased and gradually disappeared. As the TSR reached 1, the icing shape became irregular and coarse, and the cylinder surface was not completely covered by the ice layer. The icing region contracted towards the horizontal center line, which is the demarcation between the front surface and the back surface, from the back surface. When the TSR was higher than 1, the ice layer on the cylinder surface was distributed more regularly and evenly in comparison with the case for a TSR of 1. In addition, with a further increase in the rotational speed or the TSR, the thickness of the ice layer on the left surface of the cylinder became larger than that on the right surface, and a bulge occurred on the left surface of the ice layer. The icing region on the cylinder surface contracted towards the front surface of the cylinder. Moreover, the icing time also affected the process of icing. With the other conditions held constant, it was found that the amount of icing on the rotating cylinder increased. However, the profile of the ice layer showed no significant change under each icing condition, and the ice layer just grew, layer by layer. Similarly, the cylinder diameter also had an effect on the icing characteristics. The distribution laws of icing on rotating cylinder surfaces with different diameters are the same, and the icing shapes are similar. The diameter only affects the development trends of the icing shape, such as the thickness and the curvature of the ice layer.
In summary, the rotational speed or the TSR of the rotor had a significant effect on the distribution and the shape of icing on the rotating cylinder. The icing time only determined the amount of icing on the cylinder surface, and the diameter of the cylinder only affected the curvature of the ice layer covering the surface.
3.2. Analysis of Icing Characteristics
For quantitatively characterizing the icing shape and the distribution of icing on the cylinder surface, several parameters are defined for the icing shape and the icing area. The evaluation method in the present study was based on previous studies that quantitatively analyzed the characteristics of icing on a cylinder rotating around a horizontal axis [25]. The parameters characterizing the features of icing on a rotating cylinder are shown in Figure 8.
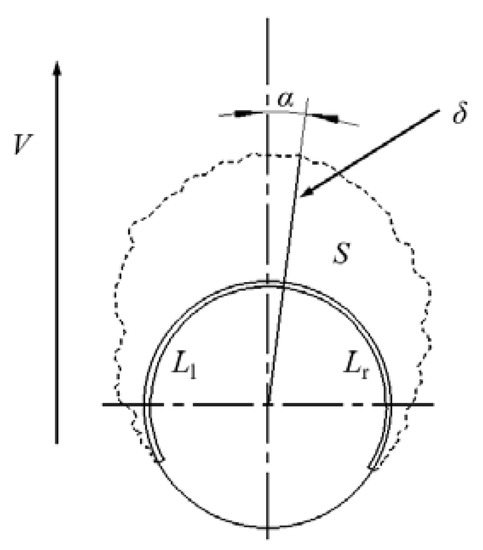
Figure 8.
Typical parameters characterizing features of icing on a rotating cylinder.
As shown in Figure 8, typical parameters include the icing area S, the stagnation point thickness δ, the stagnation point deflection angle α, the left icing limit Ll and the right icing limit Lr. The icing area S characterizes the area of the ice layer covering on the cylinder surface. The stagnation point thickness δ is the vertical distance from the highest point on the ice layer to the cylinder surface. The stagnation point deflection angle α is the included angle between the vertical center line and the straight line distance from the stagnation point to the center point of the cylinder. The rotation direction of the cylinder is the same as the deflection direction of the stagnation point deflection angle, and the linear velocity V is shown in Figure 8. With regard to the circumferential velocity of the cylinder, the clockwise direction is positive and the counterclockwise direction is negative. The parameter L1 is the left icing limit, which is the arc length covered by the ice layer on the left half. Similarly, the parameter Lr is the right icing limit.
For comparatively analyzing the characteristics of icing on rotating cylinders with different diameters, the characteristic parameters defined above are nondimensionalized based on previous work [25]. The new sets of dimensionless parameters are defined in the following equations.
where ηS is the dimensionless icing area, ηδ is the dimensionless stagnation point thickness, ηLl is the dimensionless left icing limit, ηLr is the dimensionless right icing limit and d is the diameter of the cylinder.
The icing areas and the dimensionless icing areas covering the cylinders with different diameters are shown in Figure 9 and Figure 10.

Figure 9.
Icing areas covering the cylinder surfaces with different diameters: (a) d = 20 mm; (b) d = 30 mm; (c) d = 40 mm.

Figure 10.
Dimensionless icing areas of the rotating cylinders with different diameters: (a) d = 20 mm; (b) d = 30 mm; (c) d = 40 mm.
As shown in Figure 9 and Figure 10, the icing areas and the dimensionless icing areas all increased with icing time. The experimental data show that the amount of icing on the rotating cylinder surface increased with the TSR or the rotational speed of the rotor. The reason for these results is that more super-cooled water droplets can be captured by the rotating cylinder per unit time with an increase in the TSR or the rotational speed. As shown in Figure 9, with the icing conditions held constant, the larger the diameter of the cylinder, the more water droplets are captured by the cylinder. The reason for this is that a cylinder with a larger diameter has a larger frontal area as it rotates. From Figure 10, it can be seen that the dimensionless icing area on the cylinder surface decreased with an increase in the cylinder diameter. The curvature of the profile of the ice layer decreased with an increase in the cylinder diameter. This shows that the diameter or the curvature of the cylinder has an effect on the dimensionless icing area. It indicates that a small cylinder with a large curvature is more easily affected by ice accretion. The relative amount of icing, i.e., the dimensionless icing area, is larger than that on the cylinder with a larger diameter. This means that small-scale VAWTs are more affected by icing accretion than large-scale ones, because the small-scale blade has a large curvature profile.
The variations of the stagnation point thicknesses and the dimensionless stagnation point thicknesses with icing time under the different TSRs are shown in Figure 11 and Figure 12.

Figure 11.
Variations of the stagnation point thickness with the icing time: (a) d = 20 mm; (b) d = 30 mm; (c) d = 40 mm.

Figure 12.
Variations of the dimensionless stagnation point thickness with the icing time: (a) d = 20 mm; (b) d = 30 mm; (c) d = 40 mm.
As shown in Figure 11, when the diameter of the cylinder is constant, the stagnation point thickness increases with the rotational speed or the TSR. Similarly, when the TSR or the rotational speed is constant, the stagnation point thickness also increases with the icing time. However, the diameter of the cylinder has little effect on the stagnation point thickness. The stagnation point thicknesses are approximately the same for different diameters. The reason for this result is that the diameter has little effect on the quantity of super-cooled droplets captured by the unit arc length on the cylinder surface. It only significantly affects the icing area, because a cylinder with a large diameter or small curvature has a long arc length at the cross section, which can capture more super-cooled water droplets.
As shown in Figure 12, it was found that the dimensionless stagnation point thicknesses also increased with the rotational speed and the icing time. However, when the rotational speed or the TSR was constant, the dimensionless stagnation point thickness decreased with an increase in the diameter of the cylinder. This also indicates that icing on a cylinder with a large diameter or a small curvature has little effect on the profile of the cylinder.
The variations in the left icing limit and the right icing limit on the cylinder surfaces are shown in Figure 13 and Figure 14.

Figure 13.
Left icing limit: (a) d = 20 mm; (b) d = 30 mm; (c) d = 40 mm.

Figure 14.
Right icing limit: (a) d = 20 mm; (b) d = 30 mm; (c) d = 40 mm.
As shown in Figure 13 and Figure 14, the limits of icing on the left and the right sides of the cylinder reached 100% for low rotational speeds. This means that the surface of the cylinder was completely covered by the ice layer. As the rotational speed increased, both the icing limits gradually decreased and approached approximately 50%. This showed that the diameter of the cylinder and the icing time both had small effects on the icing limit. According to these data, it was found that the icing limits for each size of cylinder rapidly reached the maximum values in a short time from the beginning of the icing time. Then, they changed only a little with icing time.
For quantitatively analyzing the distribution of the ice layer thickness on the cylinder surface, the profile of the cylinder surface was divided into 200 parts and unfolded. A coordinate system for the cylinder surface was established, and a sketch map of this is shown in Figure 15.
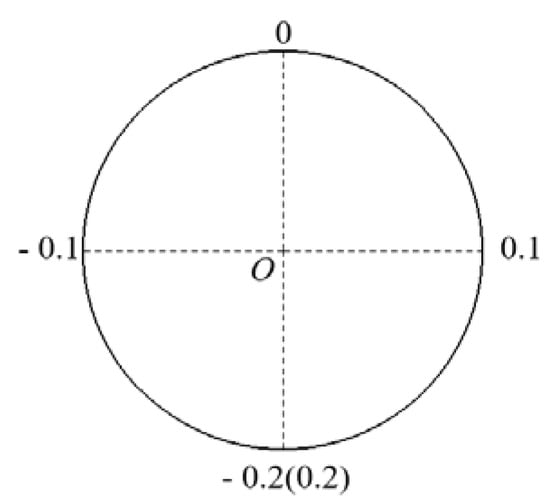
Figure 15.
Coordinate system for the cylinder surface.
As shown in Figure 15, the origin of the coordinate system is located at the highest point in the figure, which is the forefront point of the cylinder against the wind. The positive direction of the coordinate system is clockwise and the negative direction is counterclockwise. The range of coordinate values characterizing the relative positions of the points on the cylinder surface is from −0.2 to 0.2. The thickness of the ice layer at each point along the cylinder surface was characterized using the coordinate system, as shown in Figure 16.
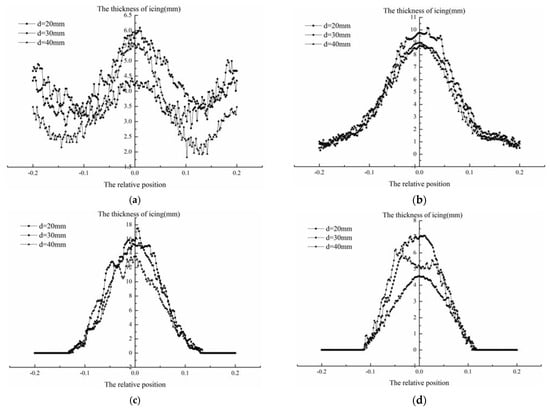
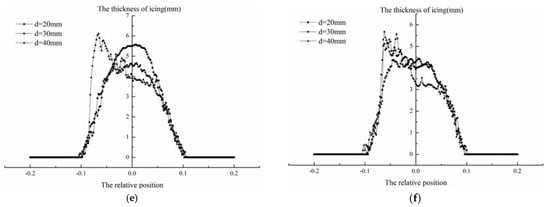
Figure 16.
Variation of the thickness of ice layer along the cylinder surface: (a) λ = 0.2; (b) λ = 0.6; (c) λ = 1.0; (d) λ = 1.5; (e) λ = 2.5; (f) λ = 3.5.
As shown in Figure 16, the main icing region was near the origin position on the cylinder surface. When the rotational speed or the TSR was low, e.g., 0.2, the ice layer symmetrically covered the whole cylinder surface. With an increase in the rotational speed or the TSR, the icing regions in the ranges of −0.2 to −0.1 and 0.1 to 0.2 gradually decreased until they disappeared. As a result, the range of the icing region was from −0.1 to 0.1, representing the left icing limit and the right icing limit. From these figures, it is concluded that the thickness of the ice layer on the cylinder with a diameter of 20 mm was largest at the origin point. This indicates that icing on a cylinder with a small radius or large curvature has a significant effect on the profile of the icing body. In addition, with an increase in the rotational speed or the TSR, the effect of the rotational speed on the stagnation point deflection angle increased, especially for the cylinder with a large diameter. As shown in these figures, when the diameter was 40 mm and the TSR was 2.5 or 3.5, the stagnation point was located at the left limit position of −0.1.
4. Contrast Analyses between Different Rotation Modes
In previous studies [25], the characteristics of icing on a cylinder rotating around the horizontal axis were studied, and the icing results are shown in Figure 17. In this section, icing events occurring on the cylinders are analyzed for two rotation modes.

Figure 17.
Icing on a cylinder rotating around the horizontal axis: (a) 100 rpm; (b) 200 rpm; (c) 400 rpm; (d) 600 rpm; (e) 800 rpm.
In the rotation mode of Figure 17, the relative wind speed, which is the vector difference between the wind speed and the linear speed of the cylinder, and its direction vary with the rotational speed of the cylinder, as shown in Figure 18 [25].
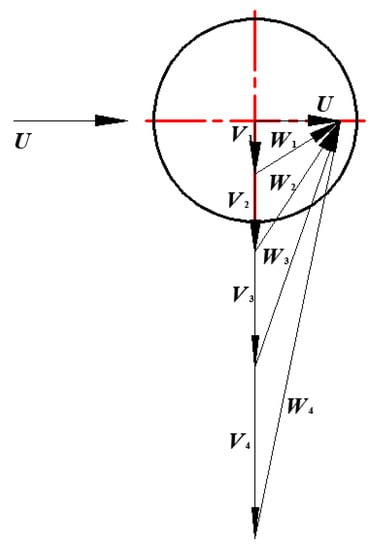
Figure 18.
Sketch map of the direction of relative wind speed.
As shown in Figure 18, when the wind speed is constant, the relative wind speed Wi and its direction vary with the linear speed of the cylinder Vi. When the rotational speed increases, the relative wind speed also increases. Then, the included angle between the relative wind speed and the linear speed of the cylinder decreases. The variation of the direction of the relative wind speed W with the rotational speed of the cylinder is shown in Figure 19.
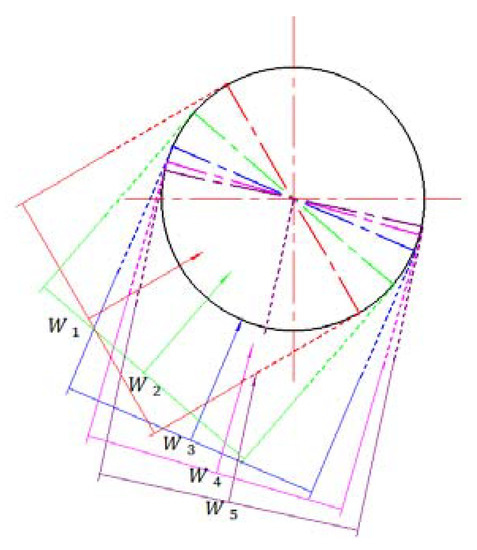
Figure 19.
Variation of the direction of the relative wind speed at different rotation speeds [29].
The reason for the variation shown in Figure 19 is that the linear velocity of the cylinder is perpendicular to the wind speed at all times. When the rotational speed of the cylinder increases, the direction of the relative wind speed changes. However, no matter how the rotational speed changes, the frontal area of the cylinder toward the relative wind speed remains constant. For this reason, the icing region on the rotating cylinder surface is always concentrated on half the surface of the cylinder, as shown in Figure 17, and the icing region changes with the direction of the relative wind speed.
In contrast, the rotation state of the cylinder rotating around the vertical axis is different from that of the cylinder rotating around the horizontal axis. When the cylinder rotates around the horizontal axis, the trajectory plane of the cylinder is vertical to the wind direction. However, when the cylinder rotates around the vertical axis, the trajectory plane of the cylinder is parallel to the wind direction. It is found that the relative position of the cylinder and the incoming flow varies all the time in a circle, as shown in Figure 20.
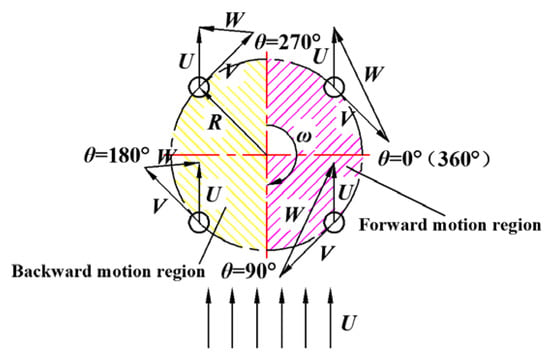
Figure 20.
Schematic diagram of the relative positions of the cylinder and the incoming flow.
In Figure 20, U is the wind speed, V is the linear velocity of the cylinder and W is the relative wind speed. The region enclosed by the trajectory of the cylinder, can be divided into two regions, i.e., the forward motion region and the backward motion region. In this rotation mode, the whole cylinder surface is covered by the ice layer at a low tip speed ratio (TSR), e.g., a TSR lower than 1. The reason for this result is that when the cylinder rotates into the forward motion region, the front surface of the cylinder captures the super-cooled water droplets. Then the ice layer occurs on the front surface. Similarly, as the cylinder rotates into the backward motion region, the super-cooled water droplets impinge on the back surface of the cylinder, because the linear speed of the cylinder is lower than the wind speed. Hence, the whole cylinder surface is covered by the ice layer.
When the tip speed ratio (TSR) is high, e.g., a TSR higher than 1, only the front surface of cylinder is covered by the ice layer, as shown in Figure 6. The reason for this result is that when the cylinder rotates into the forward motion region, the front surface captures the super-cooled water droplets and is covered by the ice layer, which is similar to the result under the low TSR condition. However, as the cylinder rotates into the backward motion region, the water droplets cannot impinge on the back surface of the cylinder because the linear speed of the cylinder is higher than the wind speed. The front surface can also capture the water droplets in the backward motion region. Therefore, the ice layer converges on the front surface of the cylinder and becomes thicker than the layer under the low TSR condition.
It can also be seen from Figure 6 that the coverage area of the ice layer reduced with an increase in the TSR. The reason for this result is that the range of the inflow angle, which is the included angle between the relative wind speed and the linear velocity of the cylinder, decreases with an increase in the TSR. According to Figure 20, when the linear velocity of the cylinder is constant, the magnitude and direction of the relative wind speed changes at different positions in the circle. In contrast, when the cylinder rotates around the horizontal axis, the magnitude and the direction of the relative wind speed do not change, as shown in Figure 18. Based on the relative positions of the cylinder and the incoming flow, as shown in Figure 20, the ranges of the inflow angle under high TSRs were analyzed and are shown in Figure 21.
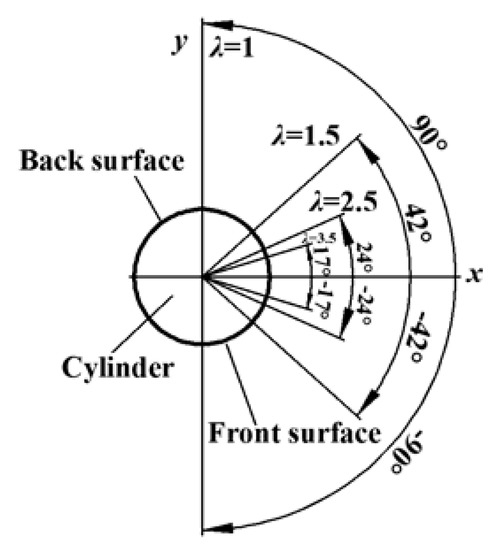
Figure 21.
Ranges of the inflow angle under high TSR conditions.
It is assumed that the vector of the linear velocity of the cylinder coincides with the x-axis, and the range of the inflow angle decreases with an increase in the TSR. Under the low rotational speed condition, the linear velocity of the cylinder is lower than the wind speed. The direction of the relative wind speed approximately coincides with the direction of the wind speed. In this condition, the range of the inflow angle is 360°. Therefore, in one circle of the cylinder trajectory, the whole cylinder surface can be in contact with the incoming flow, and ice accretion occurs on the whole cylinder surface. When the TSR is higher than 1, the range of the inflow angle gradually decreases, and the relative wind speed only acts on the front surface of the cylinder. The range of the inflow angle narrows towards the linear velocity of the cylinder when the TSRs are 1, 1.5, 2.5 and 3.5. The ranges of the inflow angle are −90~90°, −42~42°, −24~24° and −17~17°, respectively. Therefore, the decrease in the inflow angle is the key factor leading to the reduction of the icing region on the blade surface in the high TSR condition. Hence, the icing area ratio on the cylinder surface is approximately 50% in the high TSR condition.
5. Conclusions
In this paper, the characteristics of icing on a cylinder rotating around a vertical axis were studied, and some conclusions are summarized as follows.
- The amount of icing in unit time and the stagnation point thickness both increase with the rotational speed. The rotational speed has a significant effect on the icing limit of the cylinder. The icing limit reduces to 50% as the rotational speed increases.
- The factor of icing time has significant effects on the icing area and the stagnation point thickness but little effect on the icing limit.
- With an increase in the diameter of the cylinder, the amount of icing on the cylinder surface clearly increases, but the dimensionless icing area decreases. The diameter of the cylinder has little effect on the stagnation point thickness and the icing limit, but it has a significant effect on the dimensionless stagnation point thickness. When the diameter increases, the dimensionless stagnation point thickness decreases. This indicates that the icing event has a minor effect on the profile of a model with a small curvature.
- When the rotational speed of the cylinder is constant, the inflow angle of the cylinder rotating around the vertical axis changes all the time in one trajectory circle, in contrast to the case for the rotation mode around the horizontal axis. The range of the angle decreases with an increase in the rotational speed. This is the key factor in the shrinking of the surface area covered by the ice layer with an increase in the rotational speed.
6. Prospect
In the present study, the characteristics of icing on a cylinder rotating around the vertical axis were studied. The cylinder was used to simulate the leading edge of a vertical axis wind turbine blade. The icing test explored the effects of the rotational speed and the curvature of the cylinder on the icing shape and the icing distribution. In future work, the effects of other experimental conditions, such as the wind speed, the temperature and the liquid water content (LWC) on the characteristics of icing on the cylinder will be studied. In addition, the characteristics of icing on the cylinder were studied using an experimental method in the present work. In future work, a combination of the simulation method and the experimental method will be used.
Author Contributions
Conceptualization, Y.L. and K.T.; methodology, W.G. and Y.L.; software, Y.Z. and B.Z.; validation, W.G. and Y.Z.; formal analysis, W.G. and Y.L.; investigation, W.G. and Y.Z.; resources, Y.L. and W.G.; data curation, Y.Z.; writing—original draft preparation, W.G.; writing—review and editing, Y.L. and K.T.; visualization, Y.Z.; supervision, Y.L.; project administration, Y.L.; funding acquisition, Y.L. and W.G. All authors have read and agreed to the published version of the manuscript.
Funding
This research was funded by the National Natural Science Foundation of China (NSFC), grant number 51976029 and the Young Talents Project of Northeast Agricultural University, grant number 17QC32.
Institutional Review Board Statement
Not applicable.
Informed Consent Statement
Not applicable.
Data Availability Statement
Not applicable.
Conflicts of Interest
The authors declare no conflict of interest.
References
- Lamraoui, F.; Fortin, G.; Benoit, R.; Perron, J.; Masson, C. Atmospheric icing impact on wind turbine production. Cold Reg. Sci. Technol. 2014, 100, 36–49. [Google Scholar] [CrossRef]
- Jing, Z.; Bingliang, S. Research on experiment and numerical simulation of ultrasonic de-icing for wind turbine blades. Renew. Energy 2017, 113, 706–712. [Google Scholar]
- Wang, Z.; Zhu, C.; Zhao, N. Experimental Study on the Effect of Different Parameters on Rotor Blade Icing in a Cold Chamber. Appl. Sci. 2020, 10, 5884. [Google Scholar] [CrossRef]
- Alessandro, Z.; Michele, D.G.; Helmut, K. Wind Energy Harnessing of the NREL 5 MW Reference Wind Turbine in Icing Conditions under Different Operational Strategies. Renew. Energy 2018, 115, 760–772. [Google Scholar]
- Dalili, N.; Edrisy, A.; Carriveau, R. A review of surface engineering issues critical to wind turbine performance. Renew. Sust. Energy Rev. 2009, 13, 428–438. [Google Scholar] [CrossRef]
- Cao, Y.; Tan, W.; Wu, Z. Aircraft icing: An ongoing threat to aviation safety. Aerosp. Sci. Technol. 2018, 75, 353–385. [Google Scholar] [CrossRef]
- Gao, L.; Liu, Y.; Hu, H. An Experimental Investigation of Dynamic Ice Accretion Process on a Wind Turbine Blade Model Considering Various Icing Conditions. Int. J. Heat Mass Transf. 2019, 133, 930–939. [Google Scholar] [CrossRef]
- Ibrahim, G.M.; Pope, K.; Muzychka, Y.S. Effects of blade design on ice accretion for horizontal axis wind turbines. J. Wind Eng. Ind. Aerodyn. 2017, 173, 39–52. [Google Scholar] [CrossRef]
- Hu, L.; Zhu, X.; Hu, C.; Chen, J.; Du, Z. Wind turbines ice distribution and load response under icing conditions. Renew. Energy 2017, 113, 608–619. [Google Scholar] [CrossRef]
- Li, Y.; Sun, C.; Jiang, Y.; Yi, X.; Xu, Z.; Guo, W. Temperature effect on icing distribution near blade tip of large-scale horizontal-axis wind turbine by numerical simulation. Adv. Mech. Eng. 2018, 10, 1–13. [Google Scholar] [CrossRef]
- Yi, X.; Wang, K.C.; Ma, H.L.; Zhu, G. Computation of icing and its effect of horizontal axis wind turbine. Acta Energ. Sol. Sin. 2014, 35, 1052–1058. (In Chinese) [Google Scholar]
- Yi, X.; Wang, K.C.; Ma, H.L.; Zhu, G. 3-D numerical simulation of droplet collection efficiency in large-scale wind turbine icing. Acta Aerodyn. Sin. 2013, 31, 745–751. (In Chinese) [Google Scholar]
- Lu, T.; Sang, W.; Liu, X.; Xi, C. Numerical simulation of icing accretion and influence on three-dimensional wing configuration. J. Aerosp. Power 2014, 29, 1339–1345. (In Chinese) [Google Scholar]
- Jin, J.Y.; Virk, M.S. Study of Ice Accretion and Icing Effects on Aerodynamic Characteristics of DU96 Wind Turbine Blade Profile. Cold Reg. Sci. Technol. 2019, 160, 119–127. [Google Scholar] [CrossRef]
- Yirtici, O.; Ozgen, S.; Tuncer, I.H. Predictions of ice formations on wind turbine blades and power production losses due to icing. Wind Energy 2019, 22, 945–958. [Google Scholar] [CrossRef]
- Rausa, A.; Morelli, M.; Guardone, A. A novel method for robust and efficient prediction of ice shedding from rotorcraft blades—ScienceDirect. J. Comput. Appl. Math. 2021, 391, 113452. [Google Scholar] [CrossRef]
- Jin, J.Y.; Virk, M.S.; Hu, Q.; Jiang, X. Study of Ice Accretion on Horizontal Axis Wind Turbine Blade Using 2D and 3D Numerical Approach. IEEE Access 2020, 8, 166236–166245. [Google Scholar] [CrossRef]
- Jin, J.Y.; Virk, M.S. Experimental study of ice accretion on S826 & S832 wind turbine blade profiles. Cold Reg. Sci. Technol. 2020, 169, 102913. [Google Scholar]
- Han, Y.; Palacios, J.; Schmitz, S. Scaled ice accretion experiments on rotating wind turbine blade. J. Wind Eng. Ind. Aerodyn. 2012, 109, 55–67. [Google Scholar] [CrossRef]
- Wang, S.; Li, Y.; Tagawa, K.; Feng, F. A Wind Tunnel Experimental Study on Icing Distribution of Rotating Blade. J. Eng. Thermophys. 2017, 38, 1229–1236. (In Chinese) [Google Scholar]
- Guo, W.; Shen, H.; Li, Y.; Feng, F.; Tagawa, K. Wind tunnel tests of the rime icing characteristics of a straight-bladed vertical axis wind turbine. Renew. Energy 2021, 179, 116–132. [Google Scholar] [CrossRef]
- Gao, L.; Tao, T.; Liu, Y.; Hu, H. A field study of ice accretion and its effects on the power production of utility-scale wind turbines. Renew. Energy 2020, 167, 917–928. [Google Scholar] [CrossRef]
- Gao, L.; Hu, H. Wind turbine icing characteristics and icing-induced power losses to utility-scale wind turbines. Engineering 2021, 118, 1–3. [Google Scholar]
- Lehtomäki, V.; Krenn, A. IEA Wind TCP Task 19: Available Technologies for Wind Energy in Cold Climate. 2018, pp. 34–35. Available online: https://www.seai.ie/publications/IEA_Wind_Annual_Report_2015.pdf (accessed on 27 September 2021).
- Launiainen, J.; Lyyra, M. Icing on a Non-Rotating Cylinder under Conditions of High Liquid Water Content in the Air: I. Form and Size of Ice Deposits. J. Glaciol. 1986, 32, 6–11. [Google Scholar] [CrossRef][Green Version]
- Launiainen, J.; Lyyra, M. Icing on a Non-Rotating Cylinder under Conditions of High Liquid Water Content in the Air: II. Heat Transfer and Rate of Ice Growth. J. Glaciol. 1986, 32, 12–19. [Google Scholar] [CrossRef][Green Version]
- Lozowski, E.P.; Stallabrass, J.R.; Hearty, P. The Icing of an Unheated, Nonrotating Cylinder. Part I: A Simulation Model. J. Appl. Meteorol. 1983, 22, 2053–2062. [Google Scholar] [CrossRef]
- Lozowski, E.P.; Stallabrass, J.R.; Hearty, P.F. The Icing of an Unheated, Nonrotating Cylinder. Part II. Icing Wind Tunnel Experiments. J. Appl. Meteorol. 2010, 22, 2063–2074. [Google Scholar] [CrossRef]
- Li, Y.; Wang, S.; Yi, X.; Zhou, Z.; Guo, L. An icing wind tunnel test on icing characteristics of cylinder rotating around a shaft. Acta Aeronaut. Astronaut. Sin. 2017, 38, 1–11. (In Chinese) [Google Scholar]
- Manatbayev, R.; Baizhuma, Z.; Bolegenova, S.; Georgiev, A. Numerical simulations on static Vertical Axis Wind Turbine blade icing. Renew. Energy 2021, 170, 997–1007. [Google Scholar] [CrossRef]
- Baizhuma, Z.; Kim, T.; Son, C. Numerical method to predict ice accretion shapes and performance penalties for rotating vertical axis wind turbines under icing conditions. J. Wind Eng. Ind. Aerodyn. 2021, 216, 104708. [Google Scholar] [CrossRef]
- Li, Y.; Shi, L.; Guo, W.; Sun, C.; Jiang, Y. Wind Tunnel Test of the Icing Characteristics of Airfoil Rotating around a Vertical Axis. Int. J. Rotating Mach. 2020, 2020, 8841076. [Google Scholar] [CrossRef]
Publisher’s Note: MDPI stays neutral with regard to jurisdictional claims in published maps and institutional affiliations. |
© 2021 by the authors. Licensee MDPI, Basel, Switzerland. This article is an open access article distributed under the terms and conditions of the Creative Commons Attribution (CC BY) license (https://creativecommons.org/licenses/by/4.0/).