1. Introduction
The noise control of a compressor has always been a hot spot in the field of industrial application. Researchers have carried out comprehensive studies on the noise problem of compressor from various aspects, such as the cause of air compressor noise, noise transmission path [
1], noise control method, and so on. In order to solve the noise problem of compressors, many scholars have conducted extensive theoretical and experimental research on the mechanism of noise induction. Fujiwara et al. [
2] comprehensively measured the vibration and noise of a screw compressor. Gavric [
3], Sangfors [
4], and Tanttari [
5] conducted theoretical and experimental analysis of the noise and vibration caused by pressure oscillations in the suction and discharge chambers caused by intermittent gas flowing through the suction and discharge ports of a compressor. Subsequently, Song et al. [
6] measured the sound intensity of the main noise sources of a compressor and determined that the motor and inlet air pulsation were the main noise sources. In addition, Elvedin et al. found that the amplitude of discharge airflow pulsation of a screw compressor was related to the shape of the discharge cavity [
7,
8].
After determining the causes of air compressor noise, many scholars have also studied and analyzed the noise caused by pressure pulsation in a compressor. Wu et al. [
9] investigated the airflow pulsation produced by the discharge process of screw compression and conducted an in-depth study on the mechanism of airflow pulsation noise, which provided a theoretical analysis for reducing the airflow pulsation noise of screw air compressor and important guidance for the improvement of noise reduction measures in engineering application. Zhou et al. [
10,
11,
12] analyzed vibration and noise induced by unsteady flow inside a centrifugal compressor. A weakly coupled fluid–structure–sound method and extrapolation techniques were combined to simulate the multi-physics fields of internal flow, structural vibration, and external noise. In addition, Yang et al. [
13] conducted experimental research on the pressure pulsation of a twin-screw refrigeration compressor and tested the pressure pulsation energy at different radial positions of the screw shell, the pressure pulsation energy in exhaust chamber, and the energy transmitted to downstream components during operation. At the same time, in order to reveal its influence on the pressure pulse kinetic energy of a twin-screw refrigeration compressor, the effects of different oil parameters on the pressure pulse kinetic energy of the twin-screw refrigeration compressor were studied. The results showed that the flow and injection position had a great influence on the pressure pulsation.
The noise emitted by the noise source in an air compressor propagates through the medium, resulting in noise pollution. Many scholars have studied the effect of noise reduction through vibration reduction. The principle is to reduce the vibration amplitude of the compressor through some vibration control methods, thereby reducing the vibration and noise [
14]. Fujiwara et al. investigated the noise of a fuel injection screw compressor [
15], and the method of synthetic wave was used to study the meshing between screws. Donald found that the natural frequency of the muffler itself affected the noise suppression effect by studying the muffler of a dry air compressor [
16]. The effects of inlet geometry on performance, surge margin, and noise emission of an automotive turbocharger compressor were also investigated [
17]. Ji et al. [
18] proposed a typical passive noise reduction method for screw compressor noise with prominent low-frequency components. This method uses the damping vibration reduction and noise reduction mechanism to attach the damping material between the outer steel plate and the inner sound-absorbing material of the sound insulation cover to form a structure of a sound insulation layer, damping layer, and sound-absorbing layer, thereby improving the control ability of low-frequency noise. The results showed that the noise level of the testing machine was improved about 5–10 dB(A) in each frequency band below 200 Hz center frequency, and the noise sound pressure level in the whole frequency band was reduced by 4.5 dB(A).
Subsequently, Zhao et al. studied the correlation between rotor blade vibration and acoustic vibration of a multistage high-pressure compressor and analyzed the generation mechanism of blade vibration [
19]. Shen et al. proposed two noise reduction methods for semi-enclosed frequency conversion twin-screw refrigeration compressors: end face attenuation passage and discharge pipe damping [
20]. In addition, the vibration and noise characteristics of the two-stage centrifugal compressor were experimentally researched in a refrigeration system [
21]. Multilayer micro-orifice plate absorbers fixed on the outlet pipe were introduced to attenuate the compressor noise. The above research has important guiding significance for the causes and control of compressor noise, but the specific noise control means are many. For a certain compressor unit, the layout of noise reduction measures is difficult, the universality is not strong, and it is not suitable for large industrial compressor production units.
In this paper, a sound insulation hood of an air compressor unit is proposed, and the influence of different air inlet structures of the sound insulation hood on the noise reduction effect of the unit noise is researched. First, an acoustic finite element numerical simulation analysis is carried out on the sound insulation hood model by acoustic simulation software to improve and optimize the air inlet structure of sound insulation hood according to the simulation results. In addition, the sound insulation effect and sound pressure distribution of the sound insulation hood are analyzed in this paper. Lastly, the different air inlet structures are compared to optimize the performance of the sound insulation hood. A theoretical reference for the noise reduction of the air compressor unit is provided by analyzing the performance of the sound insulation hood.
2. Methods
2.1. Acoustics Theory
As we all know, sound is produced by vibration. The basis of acoustics reveal that the physical characteristics of sound field can be described by density ρ, velocity , sound pressure p, time t, and sound speed c. First, the following basic assumptions were made in addressing the research problem:
- (1)
The propagation medium is air;
- (2)
The propagation process of sound in the medium is an isentropic adiabatic process, and there is no heat flow between the media;
- (3)
Tiny vibration occurs, and the vibration amplitude of the particle is very small when sound propagates in the medium;
- (4)
The sound source can be regarded as the point sound source and the sound wave radiates uniformly from the sound source point to the surrounding area.
The basic law of sound wave propagation in an ideal medium can be expressed by three equations: continuity equation, state equation, and motion equation, as shown in the equations below.
The acoustic wave equation for small amplitude waves propagating in an ideal fluid medium is as follows:
2.2. Finite Element Model
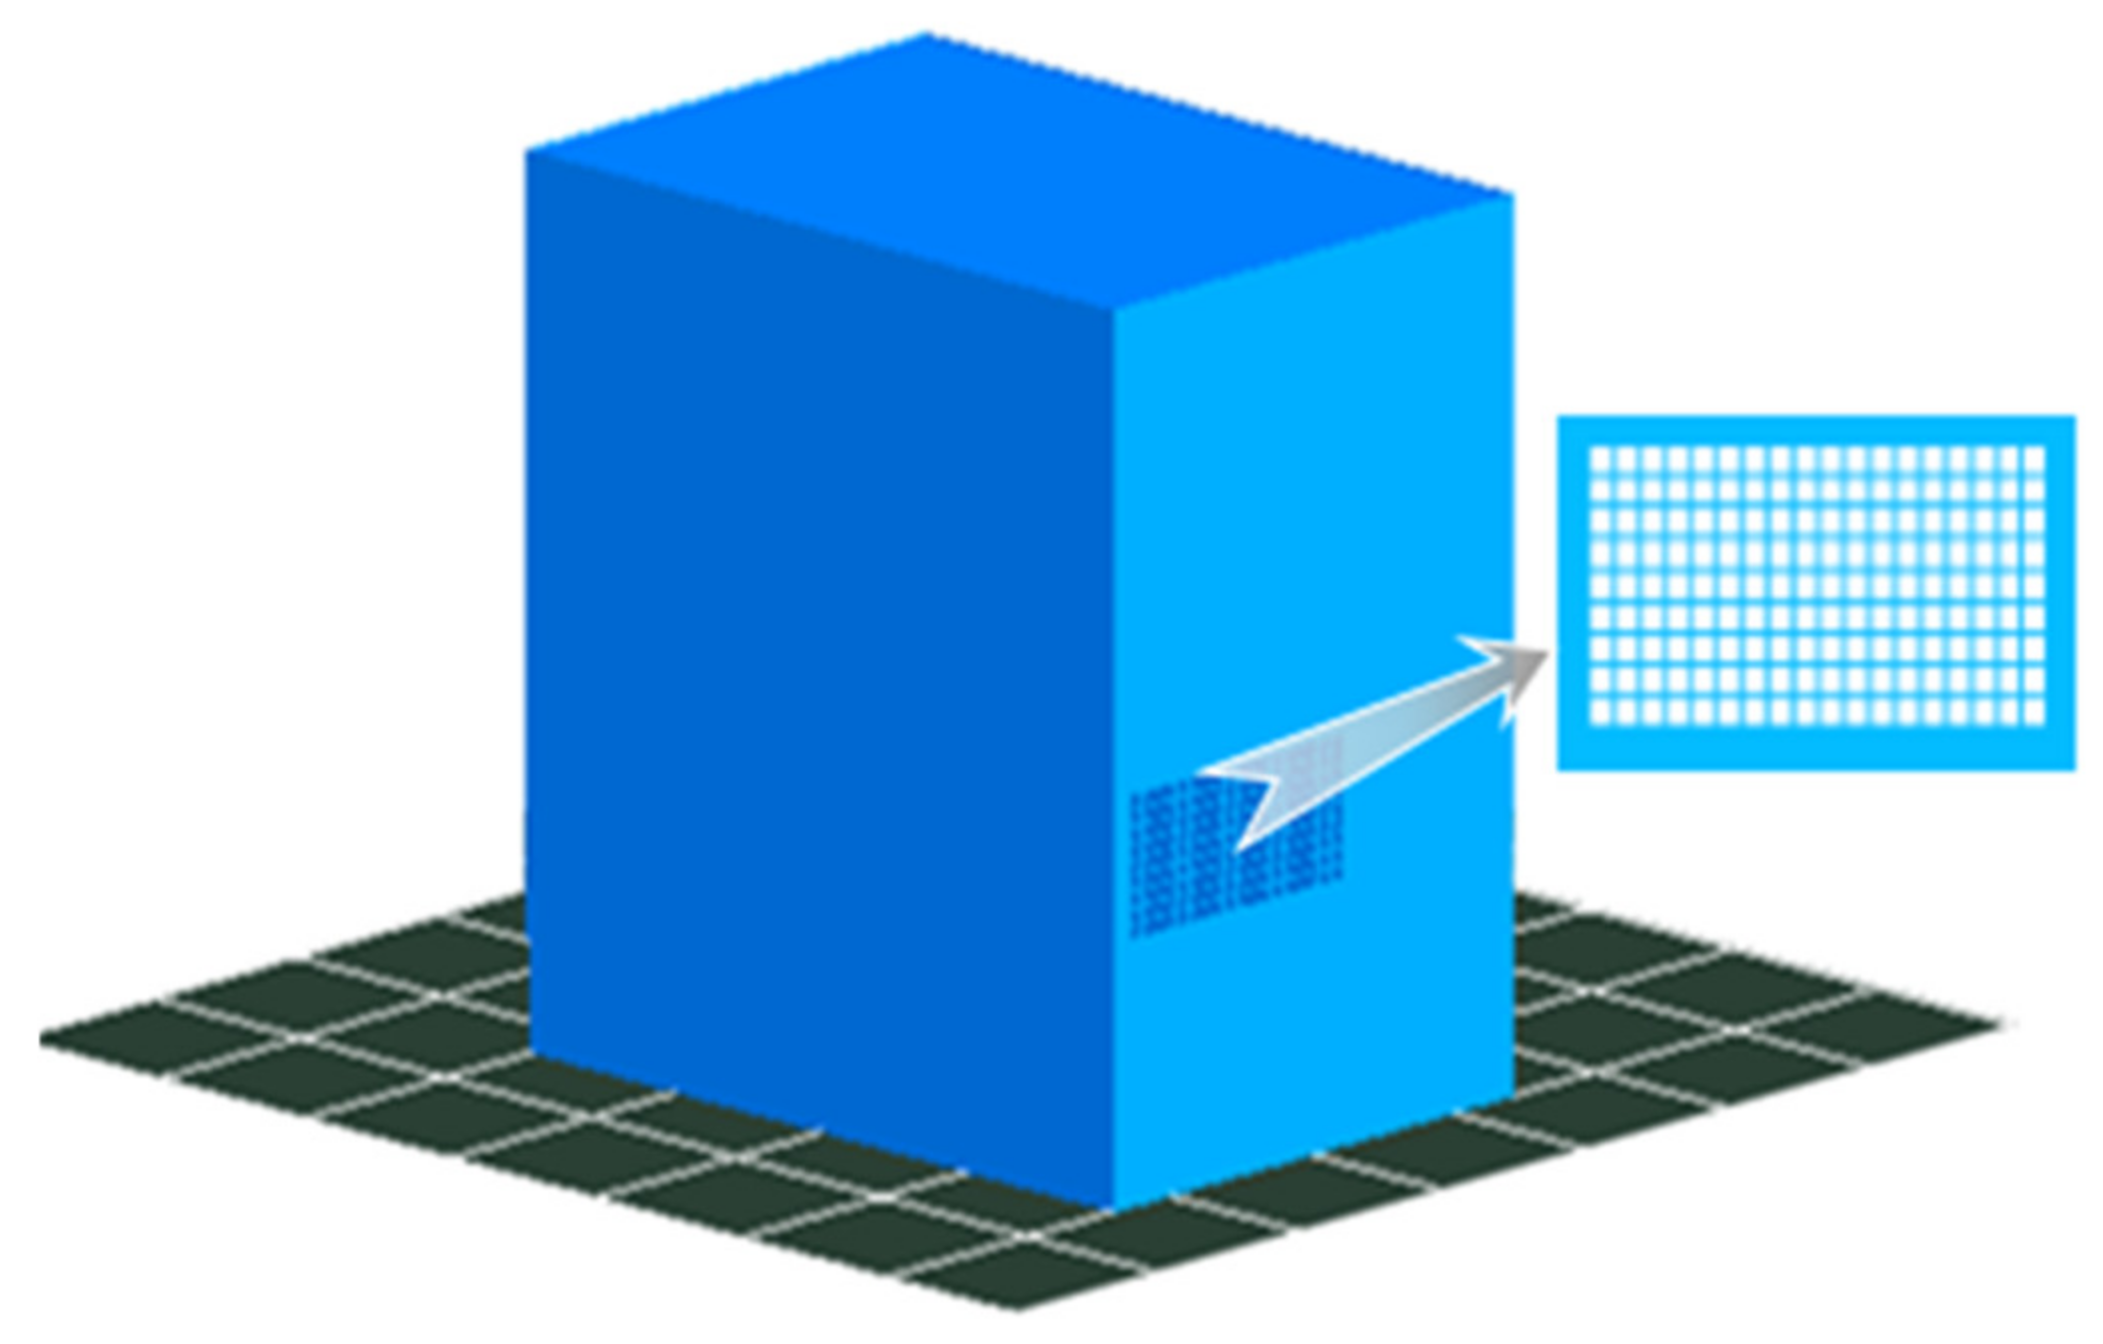
In this paper, the acoustic simulation software LMS Virtual Lab Acoustic was used to simulate the propagation of point sound source, and the influence of sound insulation hood on the radiated sound field was studied. In addition, the acoustic finite element method combined with automatically match layer (AML) technology was expected to solve the problem of external sound field. The internal structure of the sound insulation hood could be ignored in order to control the number of grids and save calculation time when studying the sound insulation performance of the sound insulation hood. Instead, the sound insulation hood was regarded as a simple cube, and the material structure of the sound insulation hood was considered. Moreover, a grille vent was arranged on the sound insulation hood, as shown in
Figure 1.
Figure 2 describes a discrete grid used for numerical simulation. There existed a point sound source inside the enclosure to simulate internal noise. The outermost layer of the acoustic enveloping surface grid was set as the AML grid to calculate the external sound field.
In addition, the noise signal of a certain type of compressor was introduced as the input sound source to simulate the internal noise of the compressor, as shown in
Figure 3.
According to the Noise and Vibration Control Engineering Manual [
22], the location and number of measuring points depend on the external dimensions of the mechanical equipment when measuring the noise of mechanical equipment. The distance from the measuring point to the equipment surface is set to 100 cm when the length of the equipment is greater than 100 cm. For the convenience of description, each signal monitoring point was named, as shown in
Figure 4. The model in this paper set up measuring points on the three central axes of
XYZ, divided into five monitoring points in the front, back, left, right, and upper directions. Moreover, the distance from each point to the surface of the sound insulation hood was 1000 mm. The narratives in this paper follow the naming and direction shown in
Figure 4.
2.3. Experiment Setup
In
Section 2.2, the finite element model of the sound insulation hood of the air compressor was established. In order to verify the correctness of the model, a noise test bench for the air compressor was built in a professional semi-anechoic room, as shown in
Figure 5. The material of the sound insulation hood was a steel plate with a thickness of 2 mm, and the overall dimensions were designed to be 1350 × 940 × 1680 mm. The air compressor as the noise source was placed in the center of the test chamber. The noise digital acquisition device used in this experiment was the LMS SCADAS XS portable data acquisition device from the Siemens Company (Berlin and Munich, Germany). As the front-end equipment of data acquisition, the device can use USB, WLAN, and LAN data transmission lines to connect with computers and sensors to convert the collected analog input signals into recognizable digital signals through processing. The Siemens LMS SCADAS XS data acquisition device is precise, compact, rechargeable, and easy to use. It has 12 input channels to collect noise, vibration, and speed signals. In this paper, this type of data acquisition device was used in the noise data acquisition of the near and far field of the experimental unit, which greatly reduced the required test time and improved the work efficiency.
The noise signal acquisition microphone used in the experiment adopted a piezo-lectric ICP sensor. When the piezoelectric material is subjected to load, it generates electric charge in the piezoelectric material, which generates voltage that allows the connected digital equipment to receive an electrical signal. The medium voltage ICP sensor is often used for vibration and noise testing because of its working characteristics. This type of sensor has low impedance and can convert the charge into the low-impedance voltage signal suitable for transmission, which realizes long-distance transmission.
Figure 6 shows the experimental circuit diagram of the piezoelectric sensor.
In order to further verify the location of noise sources and determine the impact of the sound insulation hood structure on noise radiation, Siemens acoustic camera test equipment was used in this chapter. The Siemens LMS acoustic camera is a precision acoustic positioning test instrument. It is a high-definition, testable, and adjustable acou-tic camera, which is mainly used to realize the accurate positioning of near-field and fa-field noise sources. The principle is to collect the noise generated by the measured m-chanical equipment through the camera with a wide-angle lens and a short-arm structure with dozens of microphones around it and process and output the noise to the corresponding software to achieve accurate location of the noise source. The locator connects the data port with the POE power supply and data adapter through a data transmission line, and then connects the adapter with a computer through an RJ45 Ethernet cable for data transmission. The specific structure of the test equipment is shown in
Figure 7.
In addition to the necessary test hardware equipment required for experimental measurement, the corresponding noise testing and processing software was the supporting acoustic testing software Simcenter Testlab 2019 of Siemens (Berlin and Munich, Germany), in which the noise signal acquisition and processing module is Testlab Signature Testing. The module was used together with a data acquisition device and microphone, mainly including Channel Setuo, Calibration, Tracking Setup, Acquisition Setup, and Online Processing. It also included frequency-domain and time-domain signal post-processing after noise acquisition.
For the noise source positioning experiment, in addition to the acoustic camera equipment described above, the test software used with the experimental equipment introduced the HD Acoustic Camera module for sound source positioning under Simcenter Testlab designed and developed by Siemens in Germany. The software can immediately process and obtain the data, record the obtained data into the system memory, and adjust the parameters at any time when it transmits the collected noise signal from the digital array to the LMS acoustic camera module. The module has two modes: preview and playback. In addition, it can not only realize real-time noise acquisition, but also import the collected data into the data analysis module for post-processing of noise data, such as spectrum analysis and power spectrum analysis. The main page and test case of the software are shown in
Figure 8, where the red area is the location of the noise source.
In addition, this experiment used the sensor measurement method for noise measurement and the sound source localization method for testing the location of the noise source inside the sound insulation hood in order to compare and verify the simulation results.
3. Simulation Research
3.1. Analysis of Sound Insulation Hood
The sound pressure cloud image of the sound insulation hood at different frequencies was simulated in Virtual Lab, and the sound insulation effect of the air compressor unit with the sound insulation hood was analyzed according to the input internal analog sound source signal. In order to better observe the sound insulation effect and sound pressure distribution of the sound insulation hood, the horizontal surface field points, vertical surface field points, and spherical field points were set artificially. The noise of the head and motor was mainly concentrated in the frequency band of 630–3150 Hz through the air compressor noise test. Furthermore, the noise was more obvious at 2500 Hz, which was representative. Therefore, the central frequency of 2500 Hz in finite element analysis was beneficial to realize the overall noise reduction of the air compressor and provide theoretical guidance for the experiment.
As shown in
Figure 9, the sound pressure cloud image on the horizontal plane of the central frequency 2500 Hz demonstrates that the energy emitted by the internal point source propagated from the central point to all sides, and the noise leakage in this direction was particularly obvious due to the influence of the opening at the air inlet.
Figure 10 describes the sound pressure cloud image in the vertical direction in the 2500 Hz band. The sound pressure cloud image in the vertical direction was not completely symmetrical and showed different with the change of the frequency band due to the asymmetry of the model and the difference of internal reverberation. In addition, the specific locations of the five measuring points are also described in the figures.
Figure 11 indicates the sound pressure cloud picture on the spherical field point with the center of the box as the spherical center and the radius 1500 mm. The distance between the field point and the surface of the box was about 1 m, and the viewing angle was the top view shown in the
Figure 11. Above all, the sound propagated from the inside of the enclosure to the outside space, and the noise leakage was the largest while the sound pressure was the highest in the direction of the air inlet.
From the above sound pressure cloud image, it can be found that the sound insulation hood had a better blocking effect on the noise, which could produce the sound insulation effect from 10 dB to 30 dB when the noise inside the sound insulation hood radiated outward. However, the noise radiation at the position of the air inlet was still large; thus, it was necessary to further study the influence of the structure of the air inlet and improve the structure of the air inlet.
3.2. Effect of Air Inlet
The sound pressure cloud image of the acoustic grid on the surface of the sound insulation hood with vents is considered in
Figure 12, where the red area is the part with a higher sound pressure level. The internal sound energy was mainly concentrated in the opening part of the vent, and the sound pressure was obviously higher than that of the rest of the surface in the process of outward radiation. The air inlet of the sound insulation hood was an important propagation channel for the noise to spread outward. The air inlet of the original structure was in the form of a grille. After flowing through the grid, part of the air was sucked in by the air compressor, and the other part was circulated in the box. The noise generated in the unit could radiate directly from the grille. The sound insulation hood was installed outside the air compressor unit as a set, and its air inlet had large air volume and a high flow rate. The air inlet noise can be greatly improved if the air inlet type is adjusted or the air inlet of the unit is rectified.
According to the above analysis, this paper adopted two approaches to improve the air inlet: one was to install a 120° sound insulation board, and the other was to install a 90° sound insulation board, which played the role of blocking noise and reducing noise by rectification. There was sound-absorbing cotton on the inner wall of the sound insulation hood to reduce noise in the actual air compressor unit. In order to make the calculation model restore the unit characteristics more accurately, the sound absorption characteristics of sound-absorbing cotton were also taken into account and a thickness of 30 mm was introduced in the simulation calculation.
3.3. Air Inlet Structure
The air inlet volume and air inlet area of the sound insulation hood vary as a function of the motor power of the air compressor unit. The air inlet area of the unit is about 127,000 mm2 when the motor power of the unit is 45 kW according to the technical parameter standard of the air compressor and other related data. The air inlet area of the two structures improved in this paper matched that of the structure under this power, whereas different structural partitions were installed on the inner wall and all kinds of structures were equipped with 30 mm sound-absorbing cotton on the inner wall.
The traditional air inlet of the sound insulation hood of an air compressor unit is a grille structure, as indicated in
Figure 1.
3.3.1. 120° Diaphragm Structure
The 120° sound insulation board structure was installed in the compressor unit to reduce the internal noise of the unit and adjust the structure of the air inlet, and the distribution of the diaphragm structure is shown in
Figure 13. The thickness of sound-absorbing material added to the diaphragm and frame was set to 30 mm, the distance between each diaphragm was specified as 108 mm, and the length of the diaphragm was 180 mm. The six 120° diaphragm structures were installed on the inner wall when the power of the motor was 45 kW.
3.3.2. 90° Diaphragm Structure
A right-angle diaphragm structure was installed inside the air inlet in order to compare the noise reduction effect of different air inlet structures on the unit, and the distribution of the sound insulation board is shown in
Figure 14. Too many diaphragms could lead to insufficient air inlet volume and increased cost since the 90° diaphragm structure needs to add 30 mm sound-absorbing cotton. Thus, three right angle diaphragms were added, and the distance of each diaphragm was different to ensure the air intake.
Figure 15 shows the distance and distribution of each partition under motor power of 45 kW (unit: mm).
4. Simulation Results
The sound pressure level of the five measuring points selected above was calculated by Virtual Lab simulation software when the motor power was 45 kW. The sound pressure level of each measuring point installed with the 120° diaphragm structure and the original structure is displayed in
Figure 16, where it can be analyzed that the overall sound pressure level of the 120° diaphragm structure decreased compared with the original structure. Refer to
Appendix A for specific data in
Figure 16. Among them, the sound pressure level at measuring point 1 was reduced by 3.64 dB(A), at measuring point 2 was reduced by 11.16 dB(A), at measuring point 3 was reduced by 1.57 dB(A), at measuring point 4 was reduced by 1.16 dB(A), and at measuring point 5 was reduced by 6.88 dB(A). This demonstrates that the 120° diaphragm structure installed at the air inlet could effectively prevent the internal noise of the shell from transmitting radiated noise through the position of the air inlet and reduce the upward radiated noise to a certain extent. Furthermore, the experimental data of each measurement point showed good agreement with the simulated data, further confirming the reliability of the simulation results.
Figure 17 illustrates the sound pressure cloud image of the inner and outer surfaces of the sound insulation hood with a 120° diaphragm structure, showing that the sound pressure level inside the sound insulation hood was obviously higher than that outside. The sound pressure on the outer surface of the sound insulation hood decreased significantly after the blocking effect of the cover body, indicating that the sound insulation hood with a 120° diaphragm structure had a better sound insulation effect on the internal noise radiation.
The sound pressure level of the sound insulation hood with a 90° diaphragm structure was calculated using the simulation software at five measuring points. Furthermore, the sound pressure level of this structure was compared with that of the original structure, as shown in the
Figure 18, when the motor power was 45 kW. The overall noise of the sound insulation hood with a 90° diaphragm structure was significantly lower than that of the original structure. Decreases of 10.13 dB(A) at measuring point 1, 11.39 dB(A) at measuring point 2, 6.57 dB(A) at measuring point 3, 4.23 dB(A) at measuring point 4, and 6.95 dB(A) at measuring point 5 were observed. The main source of unit noise leakage was outward radiation through the air inlet. The leakage of internal noise could be blocked, and the sound insulation effect could be enhanced by installing the sound insulation hood near the air inlet. In addition, the simulation data of the 90° diaphragm structure and the original structure had the same trend, showing good agreement with the experimental data.
Figure 19 describes the sound pressure cloud image of the inner and outer surfaces of the sound insulation hood with a 90° diaphragm structure, showing that the sound pressure level inside the sound insulation hood was obviously higher than that outside. The sound insulation hood structure had an obvious blocking effect on the internal noise radiation of the unit. The noise reduction effect of the sound insulation hood with a 90° diaphragm structure was better than that of the sound insulation hood with a 120° diaphragm structure since its external sound pressure level was significantly lower than the external sound pressure level shown in
Figure 17.
The overall noise of the two structures was compared with the original structure to analyze the noise reduction effect of each structure, as shown in
Table 1. The sound pressure level at monitoring point 1 was largest due to a direct connection with the outside at the air inlet position. Each measuring point of the two new structures had a lower sound pressure level compared with the original structure. This indicates that the two structures had a better absorption and blocking effect on the internal noise radiation of the unit.
In addition, the average sound pressure level of the 120° diaphragm structure was reduced by 3.64 dB(A) and that of the 90° diaphragm structure was reduced by 9.96 dB(A) compared with the original structure, which means that the structure with a 90° diaphragm had a better noise reduction effect, and the average noise of the structure was lower than that of the 120° diaphragm structure by 6.32 dB(A) when the motor power was 45 kW. Above all, the air inlet structure of the sound insulation hood of the air compressor unit improved in this paper had an obvious effect on reducing the noise of the whole unit.


