Article

Sensing of Transition Metals by Top-Down Carbon Dots

by
Federico Bruno
1,
Alice Sciortino
1,
Gianpiero Buscarino
1,2,
Marco Cannas
1,
Franco Mario Gelardi
1,
Fabrizio Messina
1,2,* and
Simonpietro Agnello
1,2
1
Department of Physics and Chemistry Emilio Segré, University of Palermo, Via Archirafi 36, 90143 Palermo, Italy
2
Aten Center, University of Palermo, Viale delle Scienze, Edificio 18, 90128 Palermo, Italy
*
Author to whom correspondence should be addressed.
Appl. Sci. 2021, 11(21), 10360; https://doi.org/10.3390/app112110360
Submission received: 17 September 2021 / Revised: 26 October 2021 / Accepted: 2 November 2021 / Published: 4 November 2021
(This article belongs to the Special Issue Applications of Graphene Family Materials for Environmental Sensing)

Abstract

:
Carbon quantum dots (CQDs) are a new class of carbon-rich materials with a range of unique optical and structural properties. They can be defined as carbon nanoparticles, with sizes in the range of 1–10 nm, displaying absorption and emission activities in the UV-VIS range. Depending on the structure, CQDs display a wide variability of properties, which provides the possibility of finely tuning them for several applications. The great advantages of CQDs are certainly the ease of synthesis, non-toxicity, and the strong interactions with the surrounding environment. Based on this, CQDs are especially promising as selective chemosensors. The present study reports on carbon quantum dots synthesized with a top-down (TD) approach, and characterized by different optical, spectroscopic, and morphological techniques to identify the selectivity for metal ions belonging to the first transition series. In particular, the study focuses on the interaction between two samples, namely TD and TDA, featuring different surface functionalization, and heavy metal ions. Their sensing towards Co2+, Cu2+, Fe3+, Zn2+, and Ni2+ has been tested by fluorescence (PL), steady state absorption spectroscopy, and time-resolved PL spectroscopy, in order to determine the fluorescence quenching. We found a PL quenching in the presence of concentrations of metal salts starting from 0.5 µM, and a selectivity towards the interacting ions, depending on CQDs’ surface features paving the way for their use for sensing.

1. Introduction

Carbon quantum dots (CQDs) are nanoparticles composed of a rich carbon core, with dimensions of less than ≈10 nm. Their most important characteristic is powerful luminescence, which is combined with many other advantages, such as low cost and ease of synthesis, high solubility in water, biocompatibility, high sensitivity to the external environment, and a marked ability to donate and accept electrons [1,2,3,4]. The combination of all these features ensures that CQDs can be used in a very wide range of applications, including many different fields such as imaging, optoelectronics, and sensing [5,6,7,8,9,10].
The CQDs optical absorption covers the UV-visible range, and this allows their photoexcitation in a very wide spectral range, causing emission tuning, that is, the position of the emission peak in the visible range changes with the excitation wavelength [2,11,12]. This gives a multi-coloured emission from blue to green, and sometimes to red, although absorption and emission efficiencies usually decrease at longer wavelengths [13,14,15]. This emission is often combined with a high quantum yield which, however, strongly depends on the synthesis conditions [16,17,18]. The origin of the optical properties of CQDs are still much debated in the literature, where at least two types of emission mechanisms are presumed, one originating exclusively from core-surface interactions, and another depending on the chromophores present on the surface [2,5,14,18].
As far as the synthesis of CQDs is concerned, there are mainly two approaches: bottom-up, and top-down [19,20,21,22]. Bottom-up synthesis makes it possible to use small molecular precursors, and through controlled pyrolysis it is possible to synthesise various types of carbon dots with very different structural properties, from crystalline to amorphous [22,23,24]. Regarding top-down synthesis, the precursors are larger and more extensive carbon allotropes [25,26], such as graphite, carbon nanotubes, and fullerene. Top-down synthesis can be carried out by chemical oxidation [14,15,25] or laser ablation [26,27,28]. This plethora of synthesis methods makes it possible to design and construct different types of CQDs, with surfaces rich in heteroatoms, such as oxygen and nitrogen, enabling the exploitation of the presence of different surface chromophores, and to change the functional and emissive properties of the nanoparticles in a controlled manner [23,28,29,30].
Due to the powerful sensitivity of the fluorescence to the external environment, and the ability of CQDs to behave as efficient electron donors [1,24,31,32,33], CQDs are often proposed as detectors of various harmful substances, e.g., heavy metals such as copper [34,35], cobalt [36,37], and iron [38,39,40]. Therefore, new CQDs design methodologies consistently aim to increase the sensitivity and selectivity of CQDs to one or more of these analytes. However, the interaction pathways between metal ions and CQDs are still barely understood, due to the lack of dedicated studies on the fundamental interaction mechanisms. A better understanding of these phenomena would greatly help not only to achieve better sensing, but also as a way for probing the fluorescent groups of CQDs, and learning or optimizing the emission mechanisms.
In this paper, we present a study of sensing application of two different families of CQDs synthesised using a top-down approach. After characterising the structure and the optical features of the two types of prepared CQDs, we tested their interaction with heavy metal ions such as nickel, copper, cobalt, iron, and zinc through the combined use of steady-state and time-resolved optical spectroscopy. We found that the interactions of these metals with the two CQDs are different, resulting in different detection, sensitivity, and selectivity features. In particular, we found that one can have both a quenching or an enhancement of the emission of CQDs, as mediated by different interaction pathways of the CQDs with the ions, and both of these interactions can be used to sense micromolar concentration of the ions. The results therefore show different information on the type of interaction with these two families of CQDs, especially in the interactive process with zinc and cobalt ions, to which our CQDs display a strong and selective response. Overall, our results provide detailed information on the interaction mechanisms of CQDs with transition metal ions, and highlight the possibility of selective CQD-based detection of heavy metals.

2. Materials and Methods

Synthesis of CQDs: The synthesis of CQDs was conducted by adding 500 mg of carbon nanopowder (Sigma Aldrich-nanoparticles with a nominal average size < 100 nm) in a reaction flask to a mixture of H2SO4 (Sigma Aldrich, 96%, Munich, Germany) and HNO3 (Sigma Aldrich, 65%, Munich, Germany) in a 3:1 ratio (total volume 50 mL), under continuous stirring and maintaining the temperature at 140° for 48 h. At the end of the reaction, a fraction of about 10 mL was taken, and 10 mL of acetone was added in a still acidic environment in order to dope the surface with oxygen-rich groups, and obtain the TDA sample. The other fraction was not passivated to extract the TD sample. The two resulting solutions were finally buffered with a saturated sodium carbonate solution, and then purified by dialysis.
Steady-State Spectroscopy: All absorption measurements were carried out under ambient conditions using the Star Line spectrophotometer ULS2048CL-EVO (Avantes, Apeldoorn, The Netherlands), which has a wide spectral range (200–1200 nm), and measurements were conducted in 1 cm quartz cuvettes, diluting the CQDs solutions appropriately to obtain 0.3 optical density (OD). Fluorescence measurements were conducted with the FP6500 spectrofluorometer (JASCO Corporation, Tokyo, Japan), which features a 150 W Xenon source.
Time-resolved Spectroscopy: Fluorescence decay kinetics for the samples examined, TD and TDA, were acquired under excitation with the tunable VIBRANT laser (Opotek, Carlsbad, CA, USA), which has a Nd:YAG crystal providing 5 ns pulses and a signal amplification on CCD (Princeton Instruments, Trenton, NJ, USA). The lifetimes were acquired in the absence and presence of metal ions using an excitation wavelength of 440 nm.
Raman Spectroscopy: Raman measurements were obtained with a LabRam HR Evolution microRaman spectrometer (Horiba, Kyoto, Japan), using the excitation length in the UV of 325 nm in order to avoid competition with fluorescence. Measurements were acquired after an average of 10 spectra per sample at different positions, using an integration time of 5–10 s.
Fourier-Transform Infrared Spectroscopy (FT-IR): FT-IR measurements were carried out with a FT/IR 7600–JASCO spectrometer (JASCO Corporation, Tokyo, Japan) in an inert nitrogen atmosphere, depositing CQDs droplets on a silica support evaporated for 2 h, before conducting the acquisition of spectra in the range 1000–4000 cm1.
Sensing tests: Sensing tests were conducted by preparing the TD and TDA solutions using the same dilutions, after which the metal ions (Fe3+, Co2+, Cu2+, Ni2+, and Zn2+, introduced as sulphates or chloride salts–Sigma Aldrich) were added to the concentration range 0–40 µM by exciting the samples at a wavelength of 440 nm, and monitoring their PL. The contact time of CQDs in solution to analytes in solution is approximately four minutes, and two minutes more are required for the changes of the PL to be analysed.

3. Results

The aim of this work is to compare two CQDs, synthesised using a top-down approach. The samples examined are called TD and TDA. The main difference between these two CQDs is the surface, since they have been treated in two different ways. Indeed, while TD is the as-obtained sample from the synthesis, TDA is passivated post-synthesis in an acidic environment with acetone, in order to enrich the surface with highly oxygenated groups [39,41,42]. TD and TDA were purified and characterised using the same techniques, in order to guarantee maximum homogeneity of their structural and chemical properties, and maximize the process of interaction between the two samples (TD and TDA) with the metal quenchers examined in this study, so as to assess their optical responses for sensing [34,35,36,37,38,39,40,43,44,45,46,47,48,49,50,51].

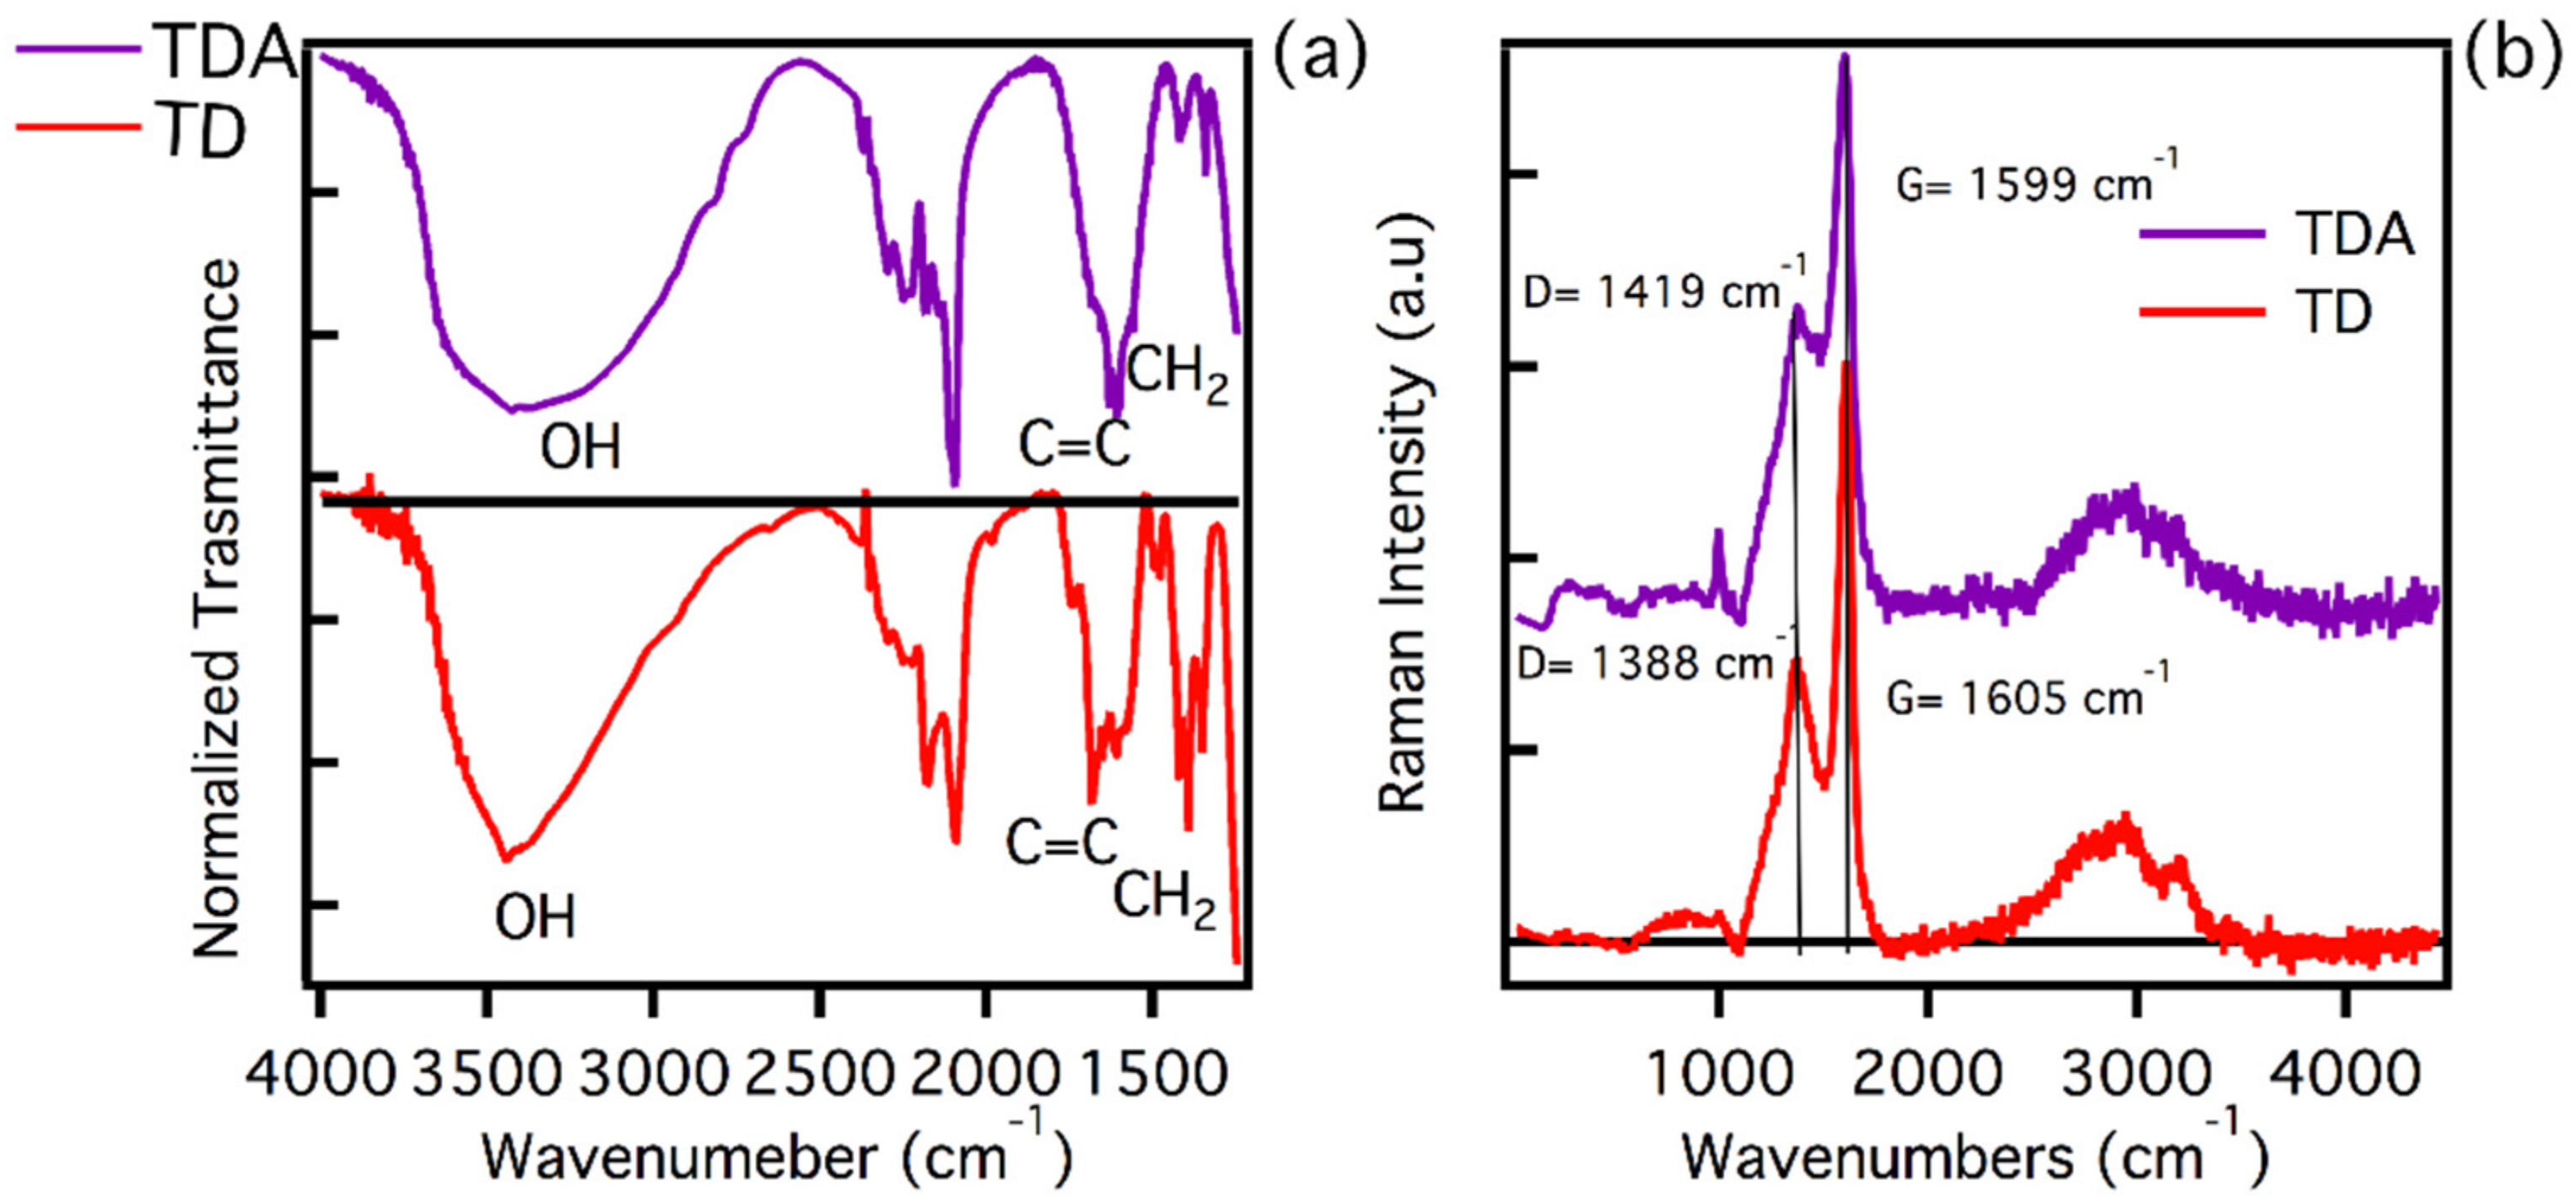
3.1. Structural Characterization

We carried out a rich structural characterisation using Raman and FT-IR spectroscopy, in order to understand both the surface and structural properties of the two analysed samples. In Figure 1a, the FT-IR spectra of the two samples are presented. As can be seen, the samples being prepared and purified under the same conditions show very similar characteristic signals.
As already obtained in a previous study by ATR measurements [39], the main changes on the surface structure of the CQDs induced by functionalization consist in the formation of plentiful C-O-C groups on TDA, absorbing near 1100 cm−1. The FT-IR measurements reported in Figure 1, acquired in the spectral range 4000–1250 cm−1, show a variety of signals due to different surface groups, with a few differences in the two samples. These data provide further hints on the success of surface functionalization, although the results, compared with the previous ATR study [39], are harder to trace back to specific chemical structures of functional groups. In Figure 1, we see in both samples a broad band around 3400 cm−1, which can be attributed to -OH stretching. It is worth noting that the shape of the bands for TD and TDA are slightly different, suggesting different surface interactions which can be related to functionalization. Both samples have bands peaking around 1600 cm−1, more precisely located at 1656 cm−1 for TD and 1602 cm−1 for TDA, which are attributable to vibrational motions of the C=C bond. The spectra evidence a difference between TD and TDA in the peaks in the range 1440–1350 cm−1, which can be attributed to CH2 bending. In fact, it is clear that the TD displays more pronounced peaks, unlike the TDA, which has almost no signals in this region. The near disappearance of CH2 from the TDA can also be attributed to surface functionalization [38,39,50].
To deepen the structural characterisation of the samples, the respective Raman spectra were recorded, using an excitation wavelength of 325 nm. As shown in Figure 1b, the TD spectrum shows the presence of the two main bands D and G, which have peaks at 1388 cm−1 and 1605 cm−1, respectively [43,44]. These features indicate the presence of a carbonaceous core with a sp2 hybridisation. The analysis carried out using the ratio of ID/IG intensities shows a value of 0.59, which highlights the presence of a tendentially graphitic core [44]. A similar analysis can be made for the TDA. Its Raman spectrum shows the same D and G bands, but shifted at 1419 cm−1 and 1599 cm−1, respectively. The ratio ID/IG is 0.55. Considering that also in this case the core of the nanoparticles can be described as graphitic with sp2 hybridisation, the small differences recorded in the Raman band positions can be attributed to some strain of the lattice attributed to the functionalization. In addition to this, the presence of a peak at around 1000 cm−1 in TDA can be attributed to a Raman vibration of the C-O [44], confirming the successful functionalization of the CDs surface.
In conclusion, the structural characterisation carried out has provided important information on the type of carbonaceous core present in both samples, which is, however, very similar and with a sp2 hybridisation [44,45]. As far as infrared FT-IR is concerned, the analysis carried out allows for the evidencing of small differences in the functional groups present on the surface of the samples, which are the main candidates for the interactions with heavy metals.

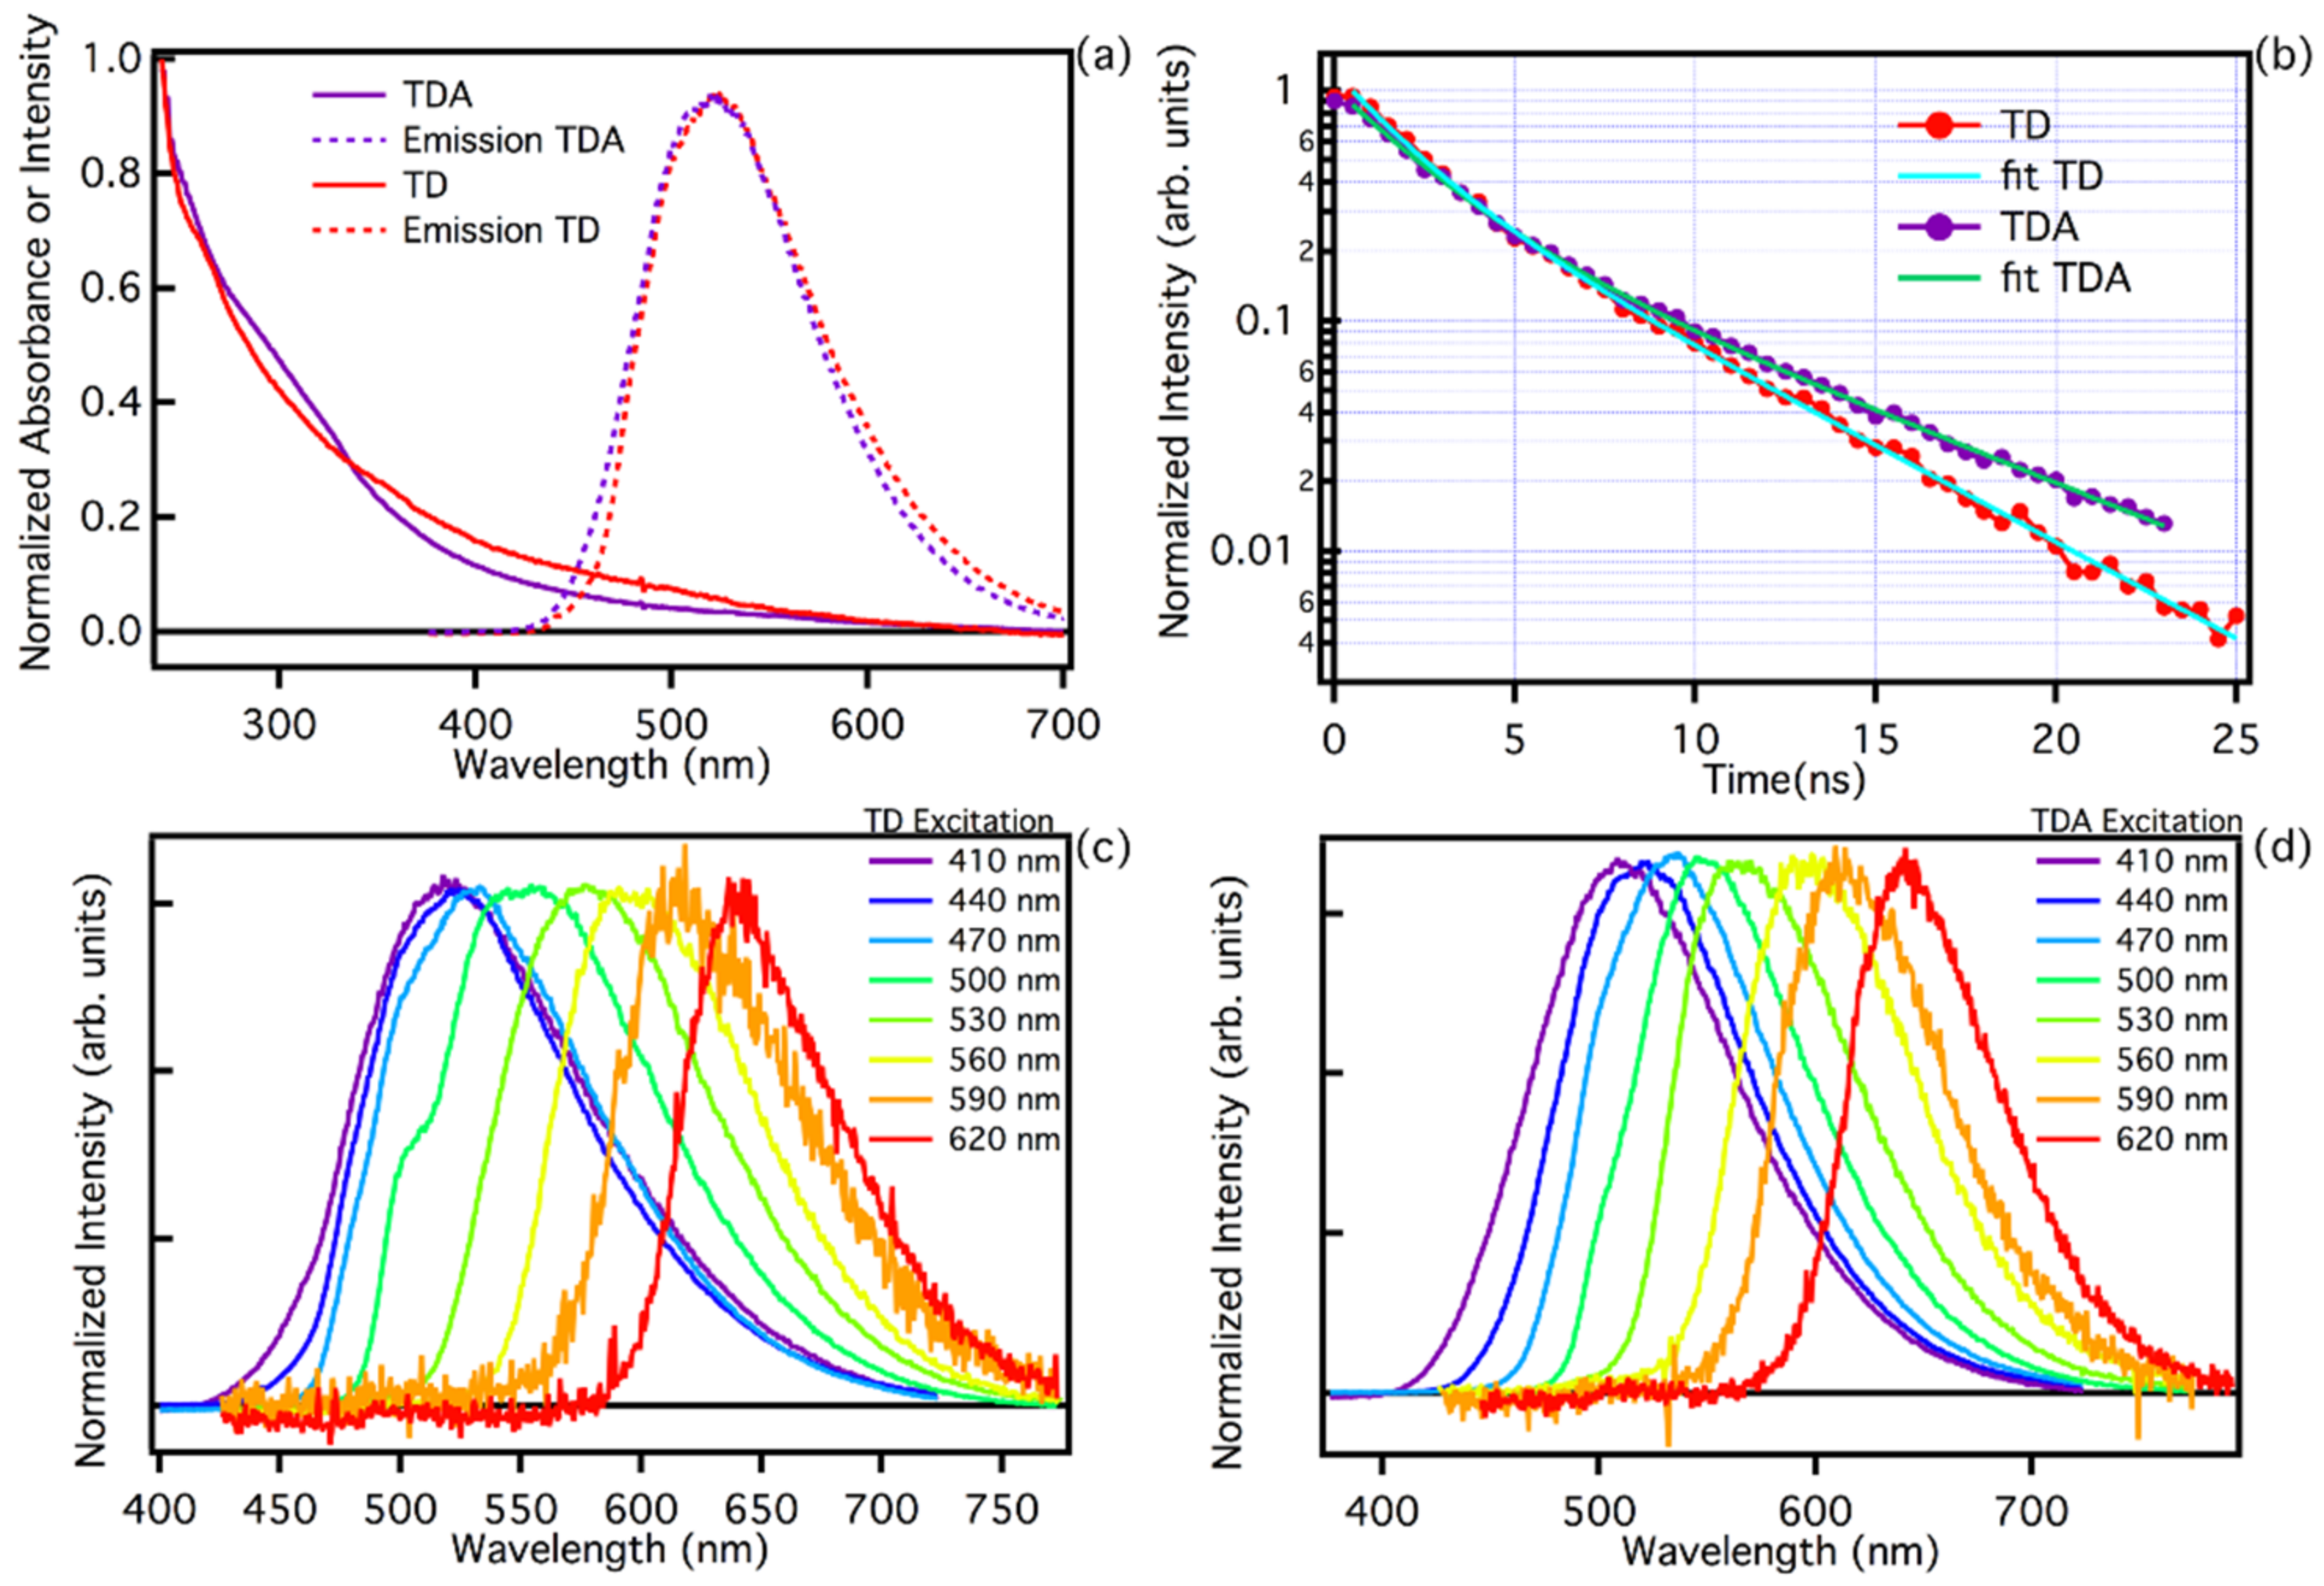
3.2. TD vs. TDA: Optical Properties

The normalized optical absorption spectra of TD and TDA samples are reported in Figure 2a. Both spectra appear broad and structureless over the entire wavelength range, suggesting a near continuum of absorption transitions and also a very similar carbon core of the nanoparticles. Small changes are present in the wavelength region around 300 nm, where the TDA features a small shoulder, possibly due to n-π* transitions [25,46,51], associated with the surface changes that occurred with functionalization [20,23,29,30,42].
Figure 2a also reports the emission spectra recorded with excitation at 440 nm. Both TD and TDA samples feature a very broad band with a maximum emission efficiency in the green at about 524 nm. The quantum yield (QY) of the two samples at the excitation wavelength of 440 nm was estimated, taking fluorescein as a reference. The respective QYs is 6.1% for TD, and 9.2% for TDA. Such relatively low QY values are known in the literature for carbon dots synthesised via top-down procedures [4,6,22,27,28,39,42]. It is interesting to note that passivation of the surface allows the QY to be increased by adding chemical groups that favour the radiative emission process.
The fluorescence of TD and TDA is highly dependent on excitation energy, which is a typical feature observed in the photoluminescence of carbon nanodots. As shown in Figure 2c,d, both TD and TDA show an identical trend in exciting the samples in a wide range of wavelengths, 410–620 nm, and significant emission shift ranging from cyan (480 nm) to red (650 nm) is found, thus maintaining a wide tunability range [13,28,39]. This is further evidence that functionalization does not significantly alter the emission properties of the studied CQDs [13,32,33,46].
The steady state optical analysis, as we have seen, does not give much information about the surface change due to functionalization; however, analysis using time-resolved spectroscopy allows us to highlight a quite appreciable difference in lifetimes. Typical PL time decay measurements at 520 nm are reported in Figure 2b under pulsed excitation at 440 nm. A non-single-exponential decay is found for both samples. Although at the beginning of the decay the curves are very similar, it is possible to appreciate that the TD has a faster decay than TDA, which becomes apparent at longer time delays. Analysing the decay curves with a double exponential fit ( I t = A 1 exp t t 0 / τ 1 + A 2 exp t t 0 / τ 2 ), we found the lifetimes for TD and TDA. In particular, the final decay times are τ1 = 2.3 ± 0.2 ns and τ2 = 6.9 ± 0.2 ns for TDA, and τ1 = 1.8 ± 0.2 ns and τ2 = 5.2 ± 0.2 ns for TD. The two samples have a very similar initial decay rate, and the first lifetime τ1 is almost consistent within experimental uncertainty. However, we find that the second lifetime, τ2, is appreciably shorter in TD. Evidently, the chemical groups present on the surface after functionalization tend to reduce the effect of non-radiative relaxation in TDA samples, making their decay slower than TD.
As far as the optical characterization of the two samples TD and TDA is concerned, it can be stated that their optical properties are very similar, i.e., both samples show very broad absorption spectra with an almost continuous structure, with some differences in the low wavelength region (300 nm). The emissive properties are also very similar, maintaining tunability over a large excitation range. This is a clear sign of a large structural disorder, typical of fluorescent nanocarbons [21,24,32,33]. A more appreciable change, possibly due to surface passivation, is found for the lifetime, which is slightly longer in TDA than in TD, which could mean that the functionalization process tends to switch off some radiative channels on the surface. Overall, passivation of the surface creates small changes in the optical properties, which can be appreciated in the absorption spectra and in the slight change in lifetime, thus passivation creates small structural differences on the surface, without disrupting the emissive properties of the CQDs.

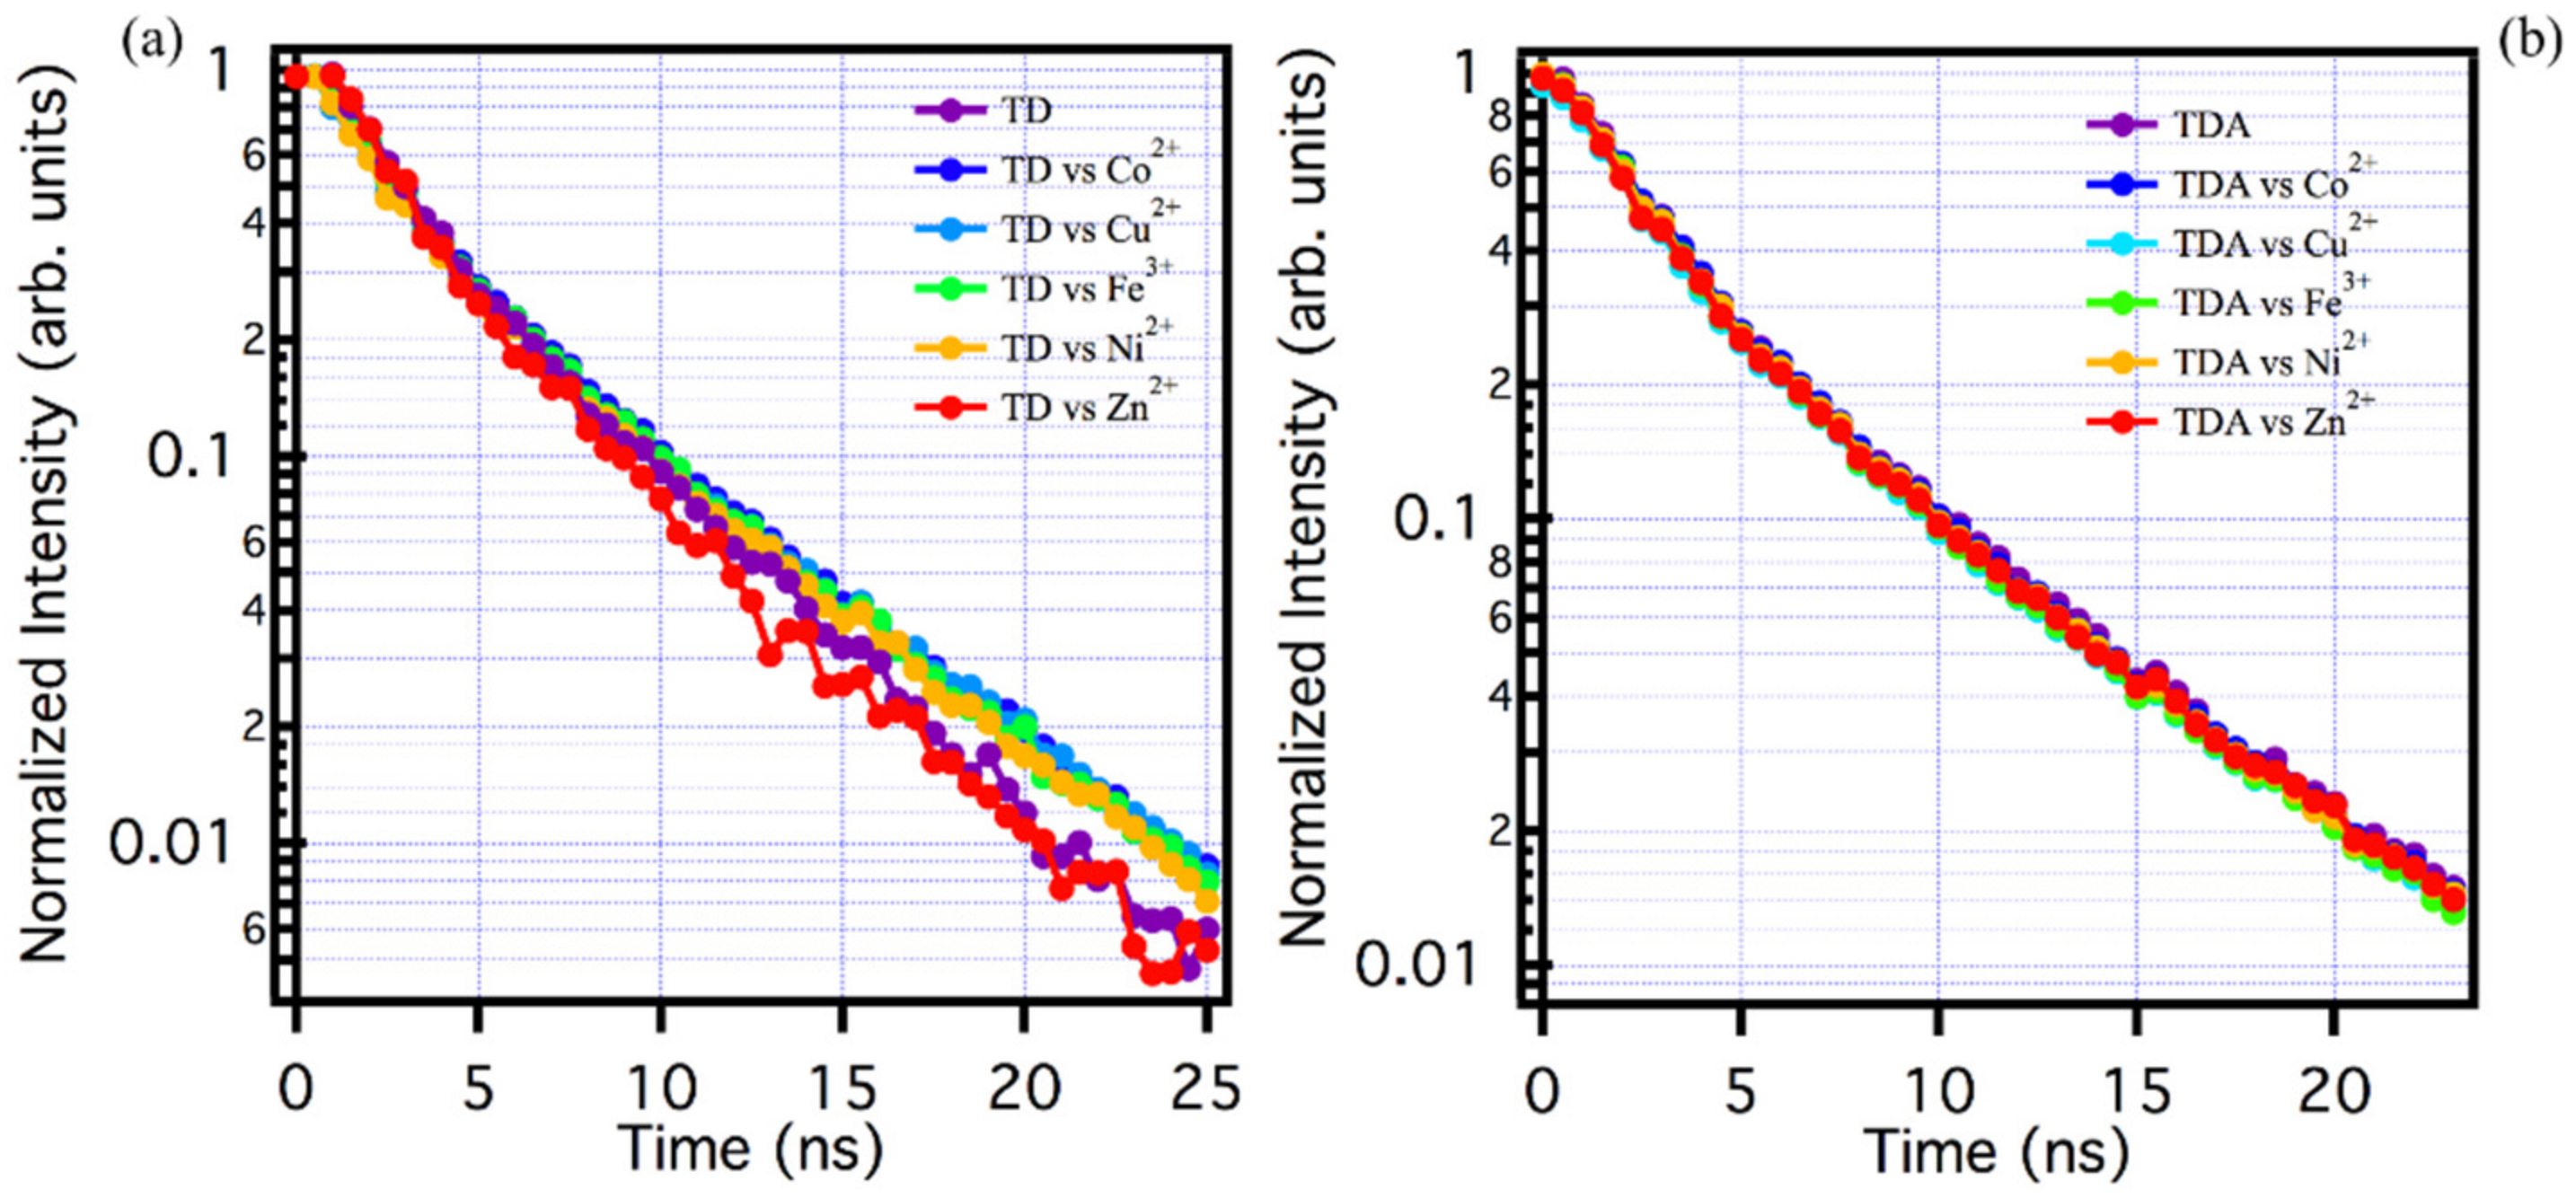
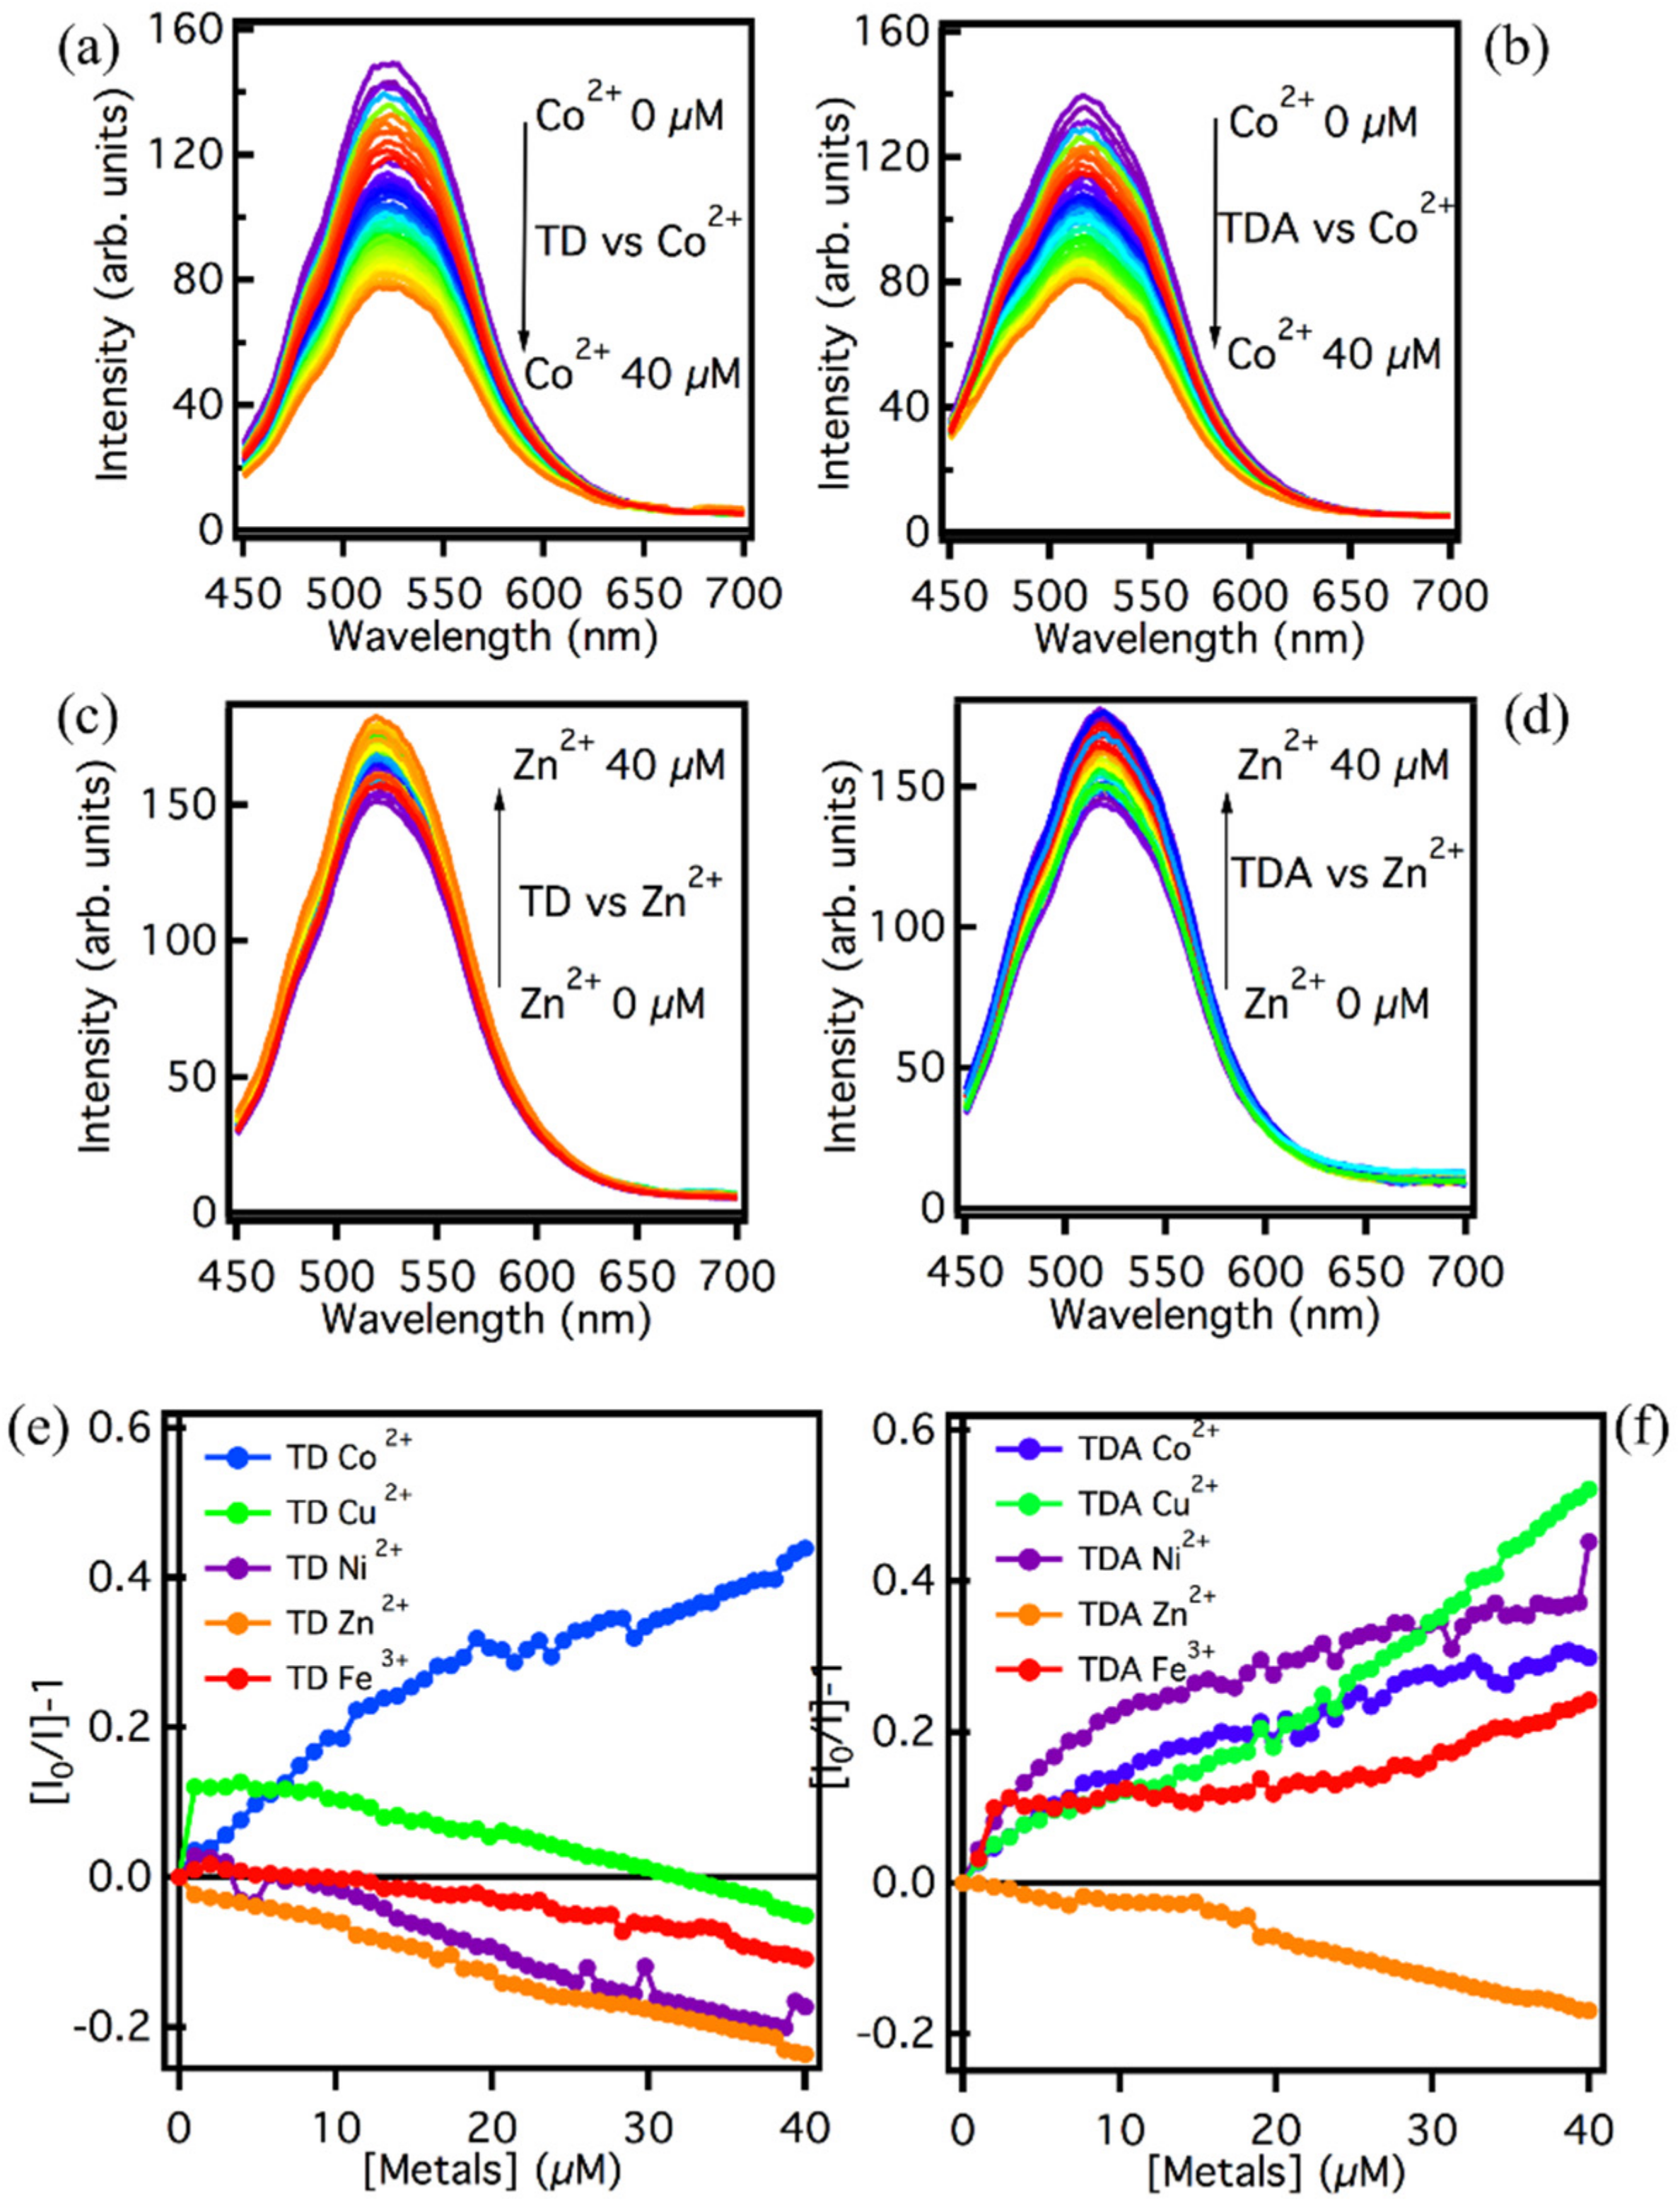
3.3. Heavy Metals Sensing

One possibility to discriminate against and highlight the optical and surface differences in TD and TDA is to evaluate their response to heavy metal ions in aqueous solutions. In particular, the use of heavy metals of the first transition series (Fe, Co, Ni, Cu, and Zn) as potential quenchers has been considered here [34,35,36,37,38,40,49,50]. Sensing tests were conducted on these two CQDs, assessing through fluorescence and absorption spectroscopy any spectral changes in the presence of different aliquots of heavy metals. The first approach to determine and evaluate the interaction between transition metals and the samples under investigation was to use fluorescence spectroscopy.
Figure 3 shows the emission of the two samples TD and TDA in the presence of increasing amounts of metal. In Figure 3a, the interaction between Co2+ and TD is shown. It can be seen that, as the amount of Co2+ increases, the emission intensity decreases steadily with each addition of metal, resulting in approximately 50% quenching of the fluorescence intensity at the maximum concentration 40 µM of metal ions. The same effect is found for the interaction between TDA and Co2+. As reported in Figure 3b, a decrease in emission intensity is observed as the amount of Co2+ increases, and, also in this case, the quenching reaches 50% for 40 µM of metal ions. The two fluorescence quenching processes appear to be very similar to each other, so the interaction process with cobalt, a likely photoinduced electron transfer, is independent of surface functionalization. In Figure 3c,d, on the other hand, the interaction process between the two CQDs and Zn2+, is assessed. In this case the process is the reverse, i.e., the zinc causes an increase in fluorescence, and again both samples respond in the same way. This feature could be due to a screening effect by the Zn2+ ions that cover the surface of the CQDs, thus causing a consistent increase in emission intensity [47]. Since similar results are found for TD and TDA, it can be stated that the interaction process in this case too is independent of the functionalization of the surface.
To deepen the dependence on the metal ions concentration, the experiments were repeated also for other ions (Fe3+, Cu2+, Ni2+), and a Stern–Volmer analysis was performed. Figure 3e,f, show the concentration dependence of the emission in all considered cases. Different interaction processes between TD/TDA and metals ions under the same conditions can be assumed. As far as TD is concerned, the Stern–Volmer graphs in Figure 3e show different trends for the different ions. The interaction process between Co2+ and TD causes a clear fluorescence quenching with an important response over the whole concentration range, the possible interaction being the formation of a coordination bond between Co2+ and OH groups present in abundance on the TD surface [50]. With regard to the other metals, Cu2+ induces an initial very pronounced fluorescence quenching of approximately 10%, but after the first few additions, the interaction process shows a levelling until, at high concentrations, the TD seems to be shielded by Cu, and emission amplitude decreases [47]. For the remaining metals, Ni, Fe, and Zn, there does not seem to be a process of quenching of the fluorescence, but rather a process of intensity increase. It can be assumed that, for these three metals, there is an electronic screening of the surface from PL quenchers over the entire concentration range [48].
Overall, from the above Stern–Volmer graphs, it appears that TD has a remarkable selectivity and affinity towards the Co2+ ion over a wide range of concentrations, as it is the only metal that is able to significantly decrease the emission intensity of TD, making this latter sample an ideal candidate for a sensing application towards this metal. By contrast, the other metals have a different interaction process with the TD surface causing essentially the increase in emission.
TDA, on the other hand, shows a decidedly different trend in the Stern–Volmer plots: all of the metals are able to reduce the intensity of emissions, and Co2+, Fe3+, Ni2+, and Cu2+, in particular, seem to be excellent quenchers [34,35,36,37,38,40,49,50]. Here, the ease of interaction between these metal ions and the surface of the TDA does not allow for discrimination of the metals present in solution, and so in the case of these metals, the quenching selectivity of the carbon nanodots towards them is drastically reduced. However, TDA can be considered selective for Zn2+ ions, in that the interaction with this ion appears markedly different, and in contrast to the pattern observed with the other metals. Zn2+ are in fact the only ions which cause an enhancement of TDA fluorescence intensity of approximately 15%. This effect could be due, as in the case of TD, to an electrostatic screening effect by the Zn2+ ions, which, by attaching themselves to the surface, can increase the PL intensity by limiting the geometric rearrangement of the surface groups [47,51].
Finally, in order to distinguish the type of quenching and, in general, the type of interaction process between the samples examined, TD and TDA, and the heavy metals, we carried out a study using time-resolved spectroscopy to assess the fluorescence decay kinetics, and thus distinguish whether the type of quenching could be static or dynamic [1,8,10,31,32,33,50].
The study was carried out on both samples, using the maximum concentration of metals used in the previous experiment, i.e., 40 µM, and evaluating the PL time decay in the presence of heavy metals. The results of the experiments are reported in Figure 4. As far as TDA is concerned, Figure 4b, despite the fact that the Stern–Volmer plots (Figure 3f) show an important PL quenching for metals such as Co2+, Ni2+, Fe3+, Cu2+, and Zn2+, it is clear that the decay kinetics in the presence and absence of metals remain completely unchanged within experimental uncertainty. This is the fingerprint of so-called static quenching, which is associated to the formation of entirely non-luminescent complexes between TDA and the quenchers, most likely quenched by extremely efficient (sub-nanosecond) photoinduced electron transfer. By analogy, this model can also be applied to the Zn2+ ion, where the increased fluorescence intensity in steady state measurements can be described as a static enhancement, occurring within stable TDA-Zn complexes.
As far as TD is concerned, the exact same thing can be observed: although steady state measurements show a change in the emissive properties in the presence of the metal ions, the lifetime of TD in the presence of the ions does not change within the experimental repeatability, so here too the interaction process with the CQDs can be defined as static, in the same sense explained above.
Based on the data in Figure 3, we finally estimated the limit of detection (LOD) of our CQDs for Co2+ and Zn2+ respectively. For the LOD of Co2+ with TDA, we find a threshold of 0.52 uM, while the value Zn2+ is 0.84 uM. For TD-metal samples, on the other hand, the LOD values are 0.20 uM for Co2+, and 0.49 uM for Zn2+, respectively.

4. Conclusions

The study carried out on two families of carbon quantum dots, TD and TDA, both synthesised by a top-down method, provides information on the structural and optical properties of these nanomaterials, and on their suitability as sensors of transition metal ions. Both samples show a sp2-hybridized carbon core, confirmed by Raman spectroscopy, which presents the typical D and G bands. The surface changes induced by functionalization, although not enormous, are confirmed by FT-IR analysis, showing slight but significant differences, such as the near disappearance of CH2 groups in TDA. While the steady-state optical properties are almost identical, both samples showing quasi-continuum absorption spectra and tunable fluorescence, differences are observed between the decay lifetimes of the two samples, further confirming the effect of functionalization.
Interestingly, the sensing responses of TD and TDA to metal ions in solution are very different from one another. TD fluorescence shows a remarkable and selective quenching process in presence of cobalt ions, approximately 50% throughout the 0–40 µM concentration range. In contrast, the other transition metals only lead to an increase of the luminescence intensity. TDA, on the other hand, responds to all of the metals taken into consideration, which are found to behave as excellent quenchers. However, an exception is represented by zinc, which induces a continuous increase in the intensity of emission in the whole range of explored concentrations (0–40 µM). Therefore, it can be said that the optical response of TDA is selective to zinc ions due to their unique behaviour in the interaction process. Overall, both TD and TDA are suitable for heavy metal sensing applications, showing sensitivity and selectivity to specific ions over a wide range of concentrations in the micromolar range. These results confirm the potential of carbon quantum dots as a multifunctional platform for optical and sensing applications, and the importance of surface functionalization to control their properties.

Author Contributions

Conceptualization, F.B., A.S., F.M. and S.A.; investigation, F.B., A.S., F.M. and S.A.; writing—original draft preparation, F.B., A.S. and F.M.; writing—review and editing, F.B., A.S., G.B., M.C., F.M.G., F.M. and S.A.; supervision, F.M. and S.A.; funding acquisition, F.M. and S.A. All authors have read and agreed to the published version of the manuscript.

Funding

This research was funded by industrial PhD grant DOT1320535, “Sensori ottici a base di carbon nanodots per la rivelazione fluorescente di inquinanti”, provided by MIUR (DDG n.2983) under the call “PON ricerca e innovazione 2014–2020—Dottorati Innovativi a Caratterizzazione Industriale”, and by the PRIN project “CANDL2—CARBON NANODOTS FOR LIGHT-EMITTING MATERIALS AND LASING APPLICATIONS”, funded by Ministero dell’Università e della Ricerca under grant number 2017W75RAE.

Institutional Review Board Statement

Not applicable.

Informed Consent Statement

Not applicable.

Data Availability Statement

The data presented in this study are available on request form the corresponding author.

Acknowledgments

We acknowledge useful scientific discussion with members of the LaBAM group at the Department of Physics and Chemistry Emilio Segré at University of Palermo, https://www.unipa.it/lamp/.

Conflicts of Interest

The authors declare no conflict of interest.

References

  1. Bacon, M.; Bradley, S.J.; Nann, T. Graphene quantum dots. Part. Part. Syst. Charact. 2014, 31, 415–428. [Google Scholar] [CrossRef]
  2. Campuzano, S.; Yáñez-Sedeño, P.; Pingarrón, J.M. Carbon dots and graphene quantum dots in electrochemical biosensing. Nnomaterials 2019, 9, 634. [Google Scholar] [CrossRef] [PubMed] [Green Version]
  3. Lim, S.Y.; Shen, W.; Gao, Z. Carbon quantum dots and their applications. Chem. Soc. Rev. 2015, 44, 362–381. [Google Scholar] [CrossRef] [PubMed]
  4. Sciortino, A.; Cannizzo, A.; Messina, F. Carbon nanodots: A Review—From the Current understanding of the fundamental photophysics to the full control of the optical response. C—J. Carbon Res. 2018, 4, 67. [Google Scholar] [CrossRef] [Green Version]
  5. Li, X.; Rui, M.; Song, J.; Shen, Z.; Zeng, H. Carbon and graphene quantum dots for optoelectronic and energy devices: A review. Adv. Funct. Mater. 2015, 25, 4929–4947. [Google Scholar] [CrossRef]
  6. Tian, P.; Tang, L.; Teng, K.; Lau, S. Graphene quantum dots from chemistry to applications. Mater. Today Chem. 2018, 10, 221–258. [Google Scholar] [CrossRef]
  7. Sun, H.; Wu, L.; Wei, W.; Qu, X. Recent advances in graphene quantum dots for sensing. Mater. Today 2013, 16, 433–442. [Google Scholar] [CrossRef]
  8. Du, Y.; Guo, S. Chemically doped fluorescent carbon and graphene quantum dots for bioimaging, sensor, catalytic and photoelectronic applications. Nanoscale 2016, 8, 2532–2543. [Google Scholar] [CrossRef] [PubMed]
  9. Zheng, X.T.; Ananthanarayanan, A.; Luo, K.Q.; Chen, P. Glowing graphene quantum dots and carbon dots: Properties, syntheses, and biological applications. Small 2015, 11, 1620–1636. [Google Scholar] [CrossRef] [PubMed]
  10. Wang, Z.; Zeng, H.; Sun, L. Graphene quantum dots: Versatile photoluminescence for energy, biomedical, and environmental applications. J. Mater. Chem. C 2015, 3, 1157–1165. [Google Scholar] [CrossRef]
  11. Pan, D.; Zhang, J.; Li, Z.; Wu, M. Hydrothermal route for cutting graphene sheets into Blue-Luminescent graphene quantum dots. Adv. Mater. 2010, 22, 734–738. [Google Scholar] [CrossRef] [PubMed]
  12. Zhu, H.; Wang, X.; Li, Y.; Wang, Z.; Yang, F.; Yang, X. Microwave synthesis of fluorescent carbon nanoparticles with electro-chemiluminescence properties. Chem. Commun. 2009, 34, 5118–5120. [Google Scholar] [CrossRef]
  13. Sciortino, A.; Cayuela, A.; Soriano, M.L.; Gelardi, F.M.; Cannas, M.; Valcárcel, M.; Messina, F. Different natures of surface electronic transitions of carbon nanoparticles. Phys. Chem. Chem. Phys. 2017, 19, 22670–22677. [Google Scholar] [CrossRef] [PubMed]
  14. Xu, X.; Gao, F.; Bai, X.; Liu, F.; Kong, W.; Li, M. Tuning the photoluminescence of graphene quantum dots by photochemical doping with nitrogen. Materials 2017, 10, 1328. [Google Scholar] [CrossRef] [PubMed] [Green Version]
  15. Meng, X.; Chang, Q.; Xue, C.; Yang, J.; Hu, S. Full-colour carbon dots: From energy-efficient synthesis to concentration-dependent photoluminescence properties. Chem. Commun. 2017, 53, 3074–3077. [Google Scholar] [CrossRef]
  16. Wang, Y.; Zhang, L.; Liang, R.-P.; Bai, J.-M.; Qiu, J.-D. Using graphene quantum dots as photoluminescent probes for protein kinase sensing. Anal. Chem. 2013, 85, 9148–9155. [Google Scholar] [CrossRef] [PubMed]
  17. Li, Y.; Hu, Y.; Zhao, Y.; Shi, G.; Deng, L.; Hou, Y.; Qu, L. An electrochemical avenue to green-luminescent graphene quantum dots as potential Electron-Acceptors for photovoltaics. Adv. Mater. 2011, 23, 776–780. [Google Scholar] [CrossRef] [PubMed]
  18. Lee, B.; McKinney, R.; Hasan, T.; Naumov, A. Graphene quantum dots as intracellular Imaging-Based temperature sensors. Materials 2021, 14, 616. [Google Scholar] [CrossRef]
  19. Lee, N.E.; Lee, S.Y.; Lim, H.S.; Yoo, S.H.; Cho, S.O. A novel route to high-quality graphene quantum dots by hydrogen-assisted pyrolysis of silicon carbide. Nanomaterials 2020, 10, 277. [Google Scholar] [CrossRef] [Green Version]
  20. Liu, R.; Wu, D.; Feng, X.; Müllen, K. Bottom-up fabrication of photoluminescent graphene quantum dots with uniform mor-phology. J. Am. Chem. Soc. 2011, 133, 15221–15223. [Google Scholar] [CrossRef] [PubMed]
  21. Lin, L.; Zhang, S. Creating high yield water soluble luminescent graphene quantum dots via exfoliating and disintegrating carbon nanotubes and graphite flakes. Chem. Commun. 2012, 48, 10177–10179. [Google Scholar] [CrossRef] [PubMed]
  22. Liu, Q.; Zhang, J.; He, H.; Huang, G.; Xing, B.; Jia, J.; Zhang, C. Green preparation of high yield fluorescent graphene quantum dots from coal-tar-pitch by mild oxidation. Nanomaterials 2018, 8, 844. [Google Scholar] [CrossRef] [Green Version]
  23. Ðordevicć, L.; Arcudi, F.; Prato, M. Synthesis, separation, and characterization of small and highly fluorescent nitrogen-doped carbon nanodots. Angew. Chem. Int. Ed. 2016, 55, 2107. [Google Scholar]
  24. Sciortino, A.; Mauro, N.; Buscarino, G.; Sciortino, L.; Popescu, R.; Schneider, R.; Giammona, G.; Gerthsen, D.; Cannas, M.; Messina, F. β-C3N4 Nanocrystals: Carbon dots with extraordinary morphological, structural, and optical homogeneity. Chem. Mater. 2018, 30, 1695–1700. [Google Scholar] [CrossRef]
  25. Zhao, M. Direct Synthesis of graphene quantum dots with different fluorescence properties by oxidation of graphene ox-ide using nitric acid. Appl. Sci. 2018, 8, 1303. [Google Scholar] [CrossRef] [Green Version]
  26. Hu, S.; Liu, J.; Yang, J.; Wang, Y.; Cao, S. Laser synthesis and size tailor of carbon quantum dots. J. Nanopart. Res. 2011, 13, 7247–7252. [Google Scholar] [CrossRef]
  27. Xu, X.; Ray, R.; Gu, Y.; Ploehn, H.J.; Gearheart, L.; Raker, K.; Scrivens, W.A. Electrophoretic analysis and purification of fluorescent single-walled carbon nanotube fragments. J. Am. Chem. Soc. 2004, 126, 12736–12737. [Google Scholar] [CrossRef] [PubMed]
  28. Umrao, S.; Jang, M.-H.; Oh, J.-H.; Kim, G.; Sahoo, S.; Cho, Y.-H.; Srivastva, A.; Oh, I. Microwave bottom-up route for size-tunable and switchable photoluminescent graphene quantum dots using acetylacetone: New platform for enzyme-free detection of hydrogen peroxide. Carbon 2015, 81, 514–524. [Google Scholar] [CrossRef]
  29. Ji, H.; Zhou, F.; Gu, J.; Shu, C.; Xi, K.; Jia, X. Nitrogen-Doped carbon dots as a new substrate for sensitive glucose deter-mination. Sensors 2016, 16, 630. [Google Scholar] [CrossRef] [Green Version]
  30. Ðordević, L.; Arcudi, F.; Prato, M. Preparation, functionalization and characterization of engineered carbon nanodots. Nat. Protoc. 2019, 14, 2931–2953. [Google Scholar] [CrossRef]
  31. Xu, Q.; Kuang, T.; Liu, Y.; Cai, L.; Peng, X.; Sreeprasad, T.S.; Zhao, P.; Yu, Z.; Li, N. Heteroatom-doped carbon dots: Synthesis, characterization, properties, photoluminescence mechanism and biological applications. J. Mater. Chem. B 2016, 4, 7204–7219. [Google Scholar] [CrossRef] [PubMed]
  32. Hu, S.; Wang, Y.; Zhang, W.; Chang, Q.; Yang, J. Multicolour emission states from charge transfer between carbon dots and surface molecules. Materials 2017, 10, 165. [Google Scholar] [CrossRef] [Green Version]
  33. Cadranel, A.; Margraf, J.T.; Strauss, V.; Clark, T.; Guldi, D.M. Carbon nanodots for Charge-Transfer processes. Accounts Chem. Res. 2019, 52, 955–963. [Google Scholar] [CrossRef]
  34. Zhang, L.; Wang, Z.; Zhang, J.; Jia, J.; Zhao, D.; Fan, Y. Phenanthroline-Derivative functionalized carbon dots for highly selective and sensitive detection of Cu2+ and S2− and imaging inside live cells. Nanomaterials 2018, 8, 1071. [Google Scholar] [CrossRef] [Green Version]
  35. Zhang, L.-N.; Liu, A.-L.; Liu, Y.-X.; Shen, J.-X.; Du, C.-X.; Hou, H.-W. A luminescent europium metal–organic framework with free phenanthroline sites for highly selective and sensitive sensing of Cu2+ in aqueous solution. Inorg. Chem. Commun. 2015, 56, 137–140. [Google Scholar] [CrossRef]
  36. Zhang, H.-Y.; Wang, Y.; Xiao, S.; Wang, H.; Wang, J.-H.; Feng, L. Rapid detection of Cr(VI) ions based on cobalt(II)-doped carbon dots. Biosens. Bioelectron. 2017, 87, 46–52. [Google Scholar] [CrossRef] [PubMed]
  37. Du, F.; Cheng, Z.; Kremer, M.; Liu, Y.; Wang, X.; Shuang, S.; Dong, C. A label-free multifunctional nanosensor based on N-doped carbon nanodots for vitamin B12 and Co2+ detection, and bioimaging in living cells and zebrafish. J. Mater. Chem. B 2020, 8, 5089–5095. [Google Scholar] [CrossRef] [PubMed]
  38. Zhao, L.; Wang, Y.; Zhao, X.; Deng, Y.; Xia, Y. Facile synthesis of Nitrogen-Doped carbon quantum dots with chitosan for fluorescent detection of Fe3+. Polymers 2019, 11, 1731. [Google Scholar] [CrossRef] [PubMed] [Green Version]
  39. Bruno, F.; Sciortino, A.; Buscarino, G.; Soriano, M.L.; Ríos, Á.; Cannas, M.; Gelardi, F.; Messina, F.; Agnello, S. A comparative study of top-down and bottom-up carbon nanodots and their interaction with mercury ions. Nanomaterials 2021, 11, 1265. [Google Scholar] [CrossRef] [PubMed]
  40. Lee, H.; Su, Y.-C.; Tang, H.-H.; Lee, Y.-S.; Lee, J.-Y.; Hu, C.-C.; Chiu, T.-C. One-Pot hydrothermal synthesis of carbon dots as fluorescent probes for the determination of mercuric and hypochlorite ions. Nanomaterials 2021, 11, 1831. [Google Scholar] [CrossRef]
  41. Bakier, Y.M.; Ghali, M.; Elkun, A.; Beltagi, A.M.; Zahra, W.K. Static interaction between colloidal carbon nano-dots and ani-line: A novel platform for ultrasensitive detection of aniline in aqueous media. Mater. Res. Bull. 2021, 134, 111. [Google Scholar] [CrossRef]
  42. Cayuela, A.; Soriano, M.; Valcárcel, M. Strong luminescence of Carbon Dots induced by acetone passivation: Efficient sensor for a rapid analysis of two different pollutants. Anal. Chim. Acta 2013, 804, 246–251. [Google Scholar] [CrossRef]
  43. Catena, A.; Agnello, S.; Cannas, M.; Gelardi, F.M.; Wehner, S.; Fischer, C.B. Evolution of the sp2 content and revealed multi-layer growth of amorphous hydrogenated carbon (a-C:H) films on selected thermoplastic materials. Carbon 2017, 117, 351. [Google Scholar] [CrossRef]
  44. Ferrari, A.C.; Robertson, J. Origin of the 1150 cm-1 Raman mode in nanocrystalline diamond. Phys. Rev. B 2000, 61, 14095. [Google Scholar] [CrossRef] [Green Version]
  45. Wu, J.; Wang, P.; Wang, F.; Fang, Y. Investigation of the Microstructures of Graphene Quantum Dots (GQDs) by Sur-face-Enhanced Raman Spectroscopy. Nanomaterials 2018, 8, 864. [Google Scholar] [CrossRef] [Green Version]
  46. Qian, F.; Li, X.; Tang, L.; Lai, S.K.; Lu, C.; Lau, S.P. Potassium doping: Tuning the optical properties of graphene quantum dots. AIP Adv. 2016, 6, 075116. [Google Scholar] [CrossRef] [Green Version]
  47. Daniyal, W.M.E.M.M.; Fen, Y.W.; Anas, N.A.A.; Omar, N.A.S.; Ramdzan, N.S.M.; Nakajima, H.; Mahdi, M.A. Enhancing the sensitivity of a surface plasmon resonance-based optical sensor for zinc ion detection by the modification of a gold thin film. RSC Adv. 2019, 9, 41729–41736. [Google Scholar] [CrossRef] [Green Version]
  48. Sciortino, A.; Madonia, A.; Gazzetto, M.; Sciortino, L.; Rohwer, E.J.; Feurer, T.; Gelardi, F.M.; Cannas, M.; Cannizzo, A.; Messina, F. The interaction of photoexcited carbon nanodots with metal ions disclosed down to the femtosecond scale. Nanoscale 2017, 9, 11902–11911. [Google Scholar] [CrossRef] [PubMed] [Green Version]
  49. Liu, C.; Tang, B.; Zhang, S.; Zhou, M.; Yang, M.; Liu, Y.; Zhang, Z.-L.; Zhang, B.; Pang, D.-W. Photoinduced electron transfer mediated by coordination between carboxyl on carbon nanodots and Cu2+ quenching photoluminescence. J. Phys. Chem. C 2018, 122, 3662–3668. [Google Scholar] [CrossRef]
  50. Zhao, L.; Li, H.; Liu, H.; Liu, M.; Huang, N.; He, Z.; Li, Y.; Chen, Y.; Ding, L. Microwave-assisted facile synthesis of polymer dots as a fluorescent probe for detection of cobalt(II) and manganese(II). Anal. Bioanal. Chem. 2019, 411, 2373–2381. [Google Scholar] [CrossRef] [PubMed]
  51. Issa, M.A.; Abidin, Z.Z. Sustainable Development of Enhanced Luminescence Polymer-Carbon Dots Composite Film for Rapid Cd2+ Removal from Wastewater. Molecules 2020, 25, 3541. [Google Scholar] [CrossRef]
Figure 1. (a) FT-IR spectra of TD (red line) and TDA (purple line) samples. (b) Normalized Raman spectra of TD (red line) and TDA (purple line) samples. FT-IR and Raman spectra have been arbitrarily vertically shifted for clarity. The arrow in the top portion of panel (a) marks the spectral range of CH2 bending vibrations.
Applsci 11 10360 g001
Figure 2. (a) Absorption spectra of TDA (purple line) and TD (red line) and emission spectra normalized to the maximum excited at the same wavelength of 440 nm. (b) Photoluminescence time decay at wavelength 520 nm, as collected by time-resolved fluorescence measurements on TDA (purple line) and TD (red line), excited at a wavelength of 440 nm (c) TD emission tunability normalized to the maximum as observed exciting the sample in the range 410–620 nm. (d) TDA emission tunability normalized to the maximum exciting the sample in the range 410–620 nm.
Applsci 11 10360 g002
Figure 3. Emission spectra recorded with excitation wavelength at 440 nm for (a) TD and (b) TDA in an aqueous solution in the presence of Co2+ (0–40 µM). Emission spectra recorded with excitation wavelength at 440 nm for (c) TD and (d) TDA in aqueous solution in the presence of Zn2+ (0–40 µM). Stern–Volmer analysis at the emission wavelength 520 nm under excitation at 440 nm for (e) TD and (f) TDA in the presence of the metal ions Co2+ (blue line), Cu2+ (green line), Ni2+ (purple line), Zn2+ (orange line), and Fe2+ (red line). All measurements are carried out at a CQD concentration of 5 mg/L.
Applsci 11 10360 g003
Figure 4. (a) Lifetime analysis for TD solutions with and without metals: pure TD (purple line), Co2+ (blue line), Cu2+ (light blue line), Fe3+ (green line), Ni2+ (orange line), and Zn2+ (red line). (b) TDA lifetime analysis in solution with and without metals: pure TDA (purple line), Co2+ (blue line), Cu2+ (light blue line), Fe3+ (green line), Ni2+ (orange line), and Zn2+ (red line). Lifetime has been always recorded at 520 nm under excitation at 440 nm.
Applsci 11 10360 g004
Publisher’s Note: MDPI stays neutral with regard to jurisdictional claims in published maps and institutional affiliations.

