Abstract
To minimize the existing risks associated with the energy production, distribution, and development of urban areas, the concept of sustainable development of smart manufacturing is being introduced everywhere. However, most of existing digital transformation technologies do not sufficiently take into account environmental, economic, and social components. It requires the development of specialized solutions that, on the one hand, contribute to the development of the urban environment, and on the other, are focused on the use of innovative technologies that have a positive effect on the environment. However, in order to provide electric power to objects of a smart urban environment, we propose using autonomous power plants with renewable energy sources (wind and sun) instead of classical central power supply. The article describes the benefits of using combined wind-solar power plants to provide electricity to smart urban environments. The article considers advantages and disadvantages of this solution. We describe the design of the combined wind-solar installation with a vertical Darier rotor and photoelectric converters located on a common supporting structure. This solution allows getting a positive synergistic effect from the use of several renewable energy sources. The presented main advantages of this solution include increasing the energy efficiency of photovoltaic converters due to the intensification of heat removal from the surface of solar cells by the wind flow from the Darier rotor. In addition, this article considers the efficient use of the area and stability of electricity output. Digital aerodynamic modeling performed the parametric optimization of the Darier rotor having three blades with NACA 0021profile. The simulation demonstrated that the blades installed at an angle of 3.8° provide the maximum value of the wind utilization coefficient. This article also considers parametric optimization of a photovoltaic installation. In particular, the optimal installation angle of photovoltaic modules for Sevastopol is 34°.
1. Introduction
The use of modern technologies to improve the efficiency of organizing the functioning of manufacturing and urban processes and the provision of innovative services forms the basis of smart sustainable city and society concept [1,2,3,4,5]. Emerging environmental problems and other risks associated with an increase in the proportion of the population living in cities [1,2] can be solved using assessing models [4,5]. Special attention should be paid to the set of strategies for the conceptual development of urban areas, which are called “smart” cities in the literature, proposed by many studies [6,7,8]. The concept of a “smart” city aims to find new ways to meet these challenges based on the integration of information and communication technologies, the introduction of modern advances in artificial intelligence, big data processing, decision support technologies, and IoT [7,8,9,10,11,12,13,14,15]. Thus, in practice, the implementation of smart sustainable city concept allows to meet the growing needs of the present and future generations while minimizing the negative impact of the implemented technical solutions on the economic, social, and environmental components of the city [6,7,8,9,10]. The technological base for ensuring sustainable development of smart sustainable city (SSC) cities is the so-called “smart” solutions in the field of digital transformation of urbanized territories [9,10,11,12,13,14,15,16,17]. Examples of such solutions are smart power grids [16,17,18,19,20,21], effective video surveillance systems [22,23,24], intelligent traffic management [25,26], and housing and communal services [27]. However, the difficulty of electricity providing using city power supply networks limits the widespread implementation of such solutions. This is due the need of significant financial costs and additional construction works in some cases many times higher than the cost of the installed equipment. In addition, meeting the increased energy needs only through the use of traditional types of energy will lead to a deterioration of the environmental situation.
These problems can be solved by using power plants that implement the concept of small-scale distributed energy, with generating plants located in the immediate vicinity of electricity consumers. This concept fits well with the use of renewable energy sources (RES) and, in particular solar and wind power plants. In addition, the advantages of such installations are environmental friendliness, which allows them to be used on almost any scale without causing damage to the environment, as well as their availability in almost every point of our planet, differing in radiation density by no more than two times [28,29], which is very important for the implementation of the concept of a smart urban environment. However, despite the stated advantages, the widespread use of PGR in Russia is constrained by a number of disadvantages. One of the main such disadvantages of most PGR-based power plants is the inconstancy of the output power [30]. This disadvantage can be leveled by using in one design several generating plants that convert different types of renewable energy sources and an energy storage system. This is because various types of renewable energy sources, as a rule, have a weak correlation, which makes it possible to significantly reduce their influence in combined wind-solar installations.
The authors analyzed the existing technical solutions, the simultaneous use of photoelectric converters (PV) and a wind power plant (WPP) [31]. This analysis shows that the technical implementation of such a combination does not always bring a noticeable synergistic effect and may lead to a decrease in the energy efficiency of each of the converters. In this regard, when designing these installations, it is necessary initially to take into account the design features of PV and wind turbines, as well as the features of their work.
2. Materials and Methods
The analysis showed that one of the most promising installations that allows to obtain a positive synergistic effect from the combined use of PV and wind turbines is the development of the Scientific and Production Center “Solar Energy”. The design of which provides for the placement of photovoltaic modules on the supporting structure of a wind turbine with a vertical-axial rotor of the Darrieus type (Figure 1). The peculiarity of this solution is that the photovoltaic modules are located below the rotor of the wind turbine, the design of which allows the forced air supply to the rear surface of the photovoltaic converters, intensifying the heat transfer from them to the environment. This solution makes it possible to increase the energy efficiency of solar cells by lowering their temperature. To ensure the maximum extraction of electrical energy from the wind-solar plant, it includes an MPPT controller and an automatic voltage stabilizer, which allows the voltage matching of the wind and photovoltaic plants when they are connected in parallel [32]. To simulate the operating mode and calculate the output power of photovoltaic modules, in order to assess its energy parameters and efficiency, a system of Equation (1) was compiled. The determination of the values of the intensity of solar radiation entering the surface of the PVC was carried out according to the methods [33,34] based on data from [35] and PVGIS online service (Photovoltaic Geographical Information System https://re.jrc.ec.europa.eu/pvg_tools/en/tools.html, accessed on 1 September 2021).
where —photovoltaic module power, W; current at the output of the automatic voltage stabilizer of the photovoltaic module, A; —voltage at the output of the automatic voltage stabilizer of the photovoltaic module, V; —wind turbine output voltage, V; —voltage at the output of the MPPT controller of the photovoltaic module, V; —current at the output of the MPPT controller of the photovoltaic module, V; —the efficiency of the voltage stabilizer of the photovoltaic module; —photocurrent of solar cells, A; —reverse saturation current of solar cells, A; —electron charge, (1.602·10−19 C); —series resistance of solar cells, Ohm; —the ideality factor, depending on the thickness of the p-n-junction and the material, takes values for a silicon solar cell from 1.2 to 5 (Table 1); —Boltzmann constant, (1.381·10−23 J/K); T—absolute solar cell temperature, K; —short-circuit current of the solar cell under standard conditions, A; —temperature coefficient of the short-circuit current of the solar cell, A/K; —temperature coefficient of no-load voltage, V/K; —temperature coefficient of temperature rise, (K·m2)/W; —temperature standard conditions, (298 K); number of solar cells connected in series; —ambient temperature, K; —open circuit voltage of the solar cell under standard conditions, V; —value of the intensity of solar radiation, W/m2; and —solar radiation intensity under standard conditions, (W/m2).
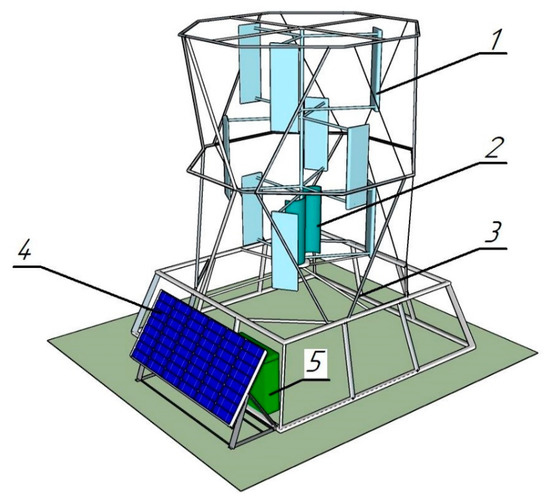
Figure 1.
Combined wind-solar power station: (1) Darier rotor; (2) Savonius rotor; (3) supporting structure; (4) photoelectric converters; (5) control cabinet with rechargeable batteries.

Table 1.
Coefficient of ideality solar cell from material [6].
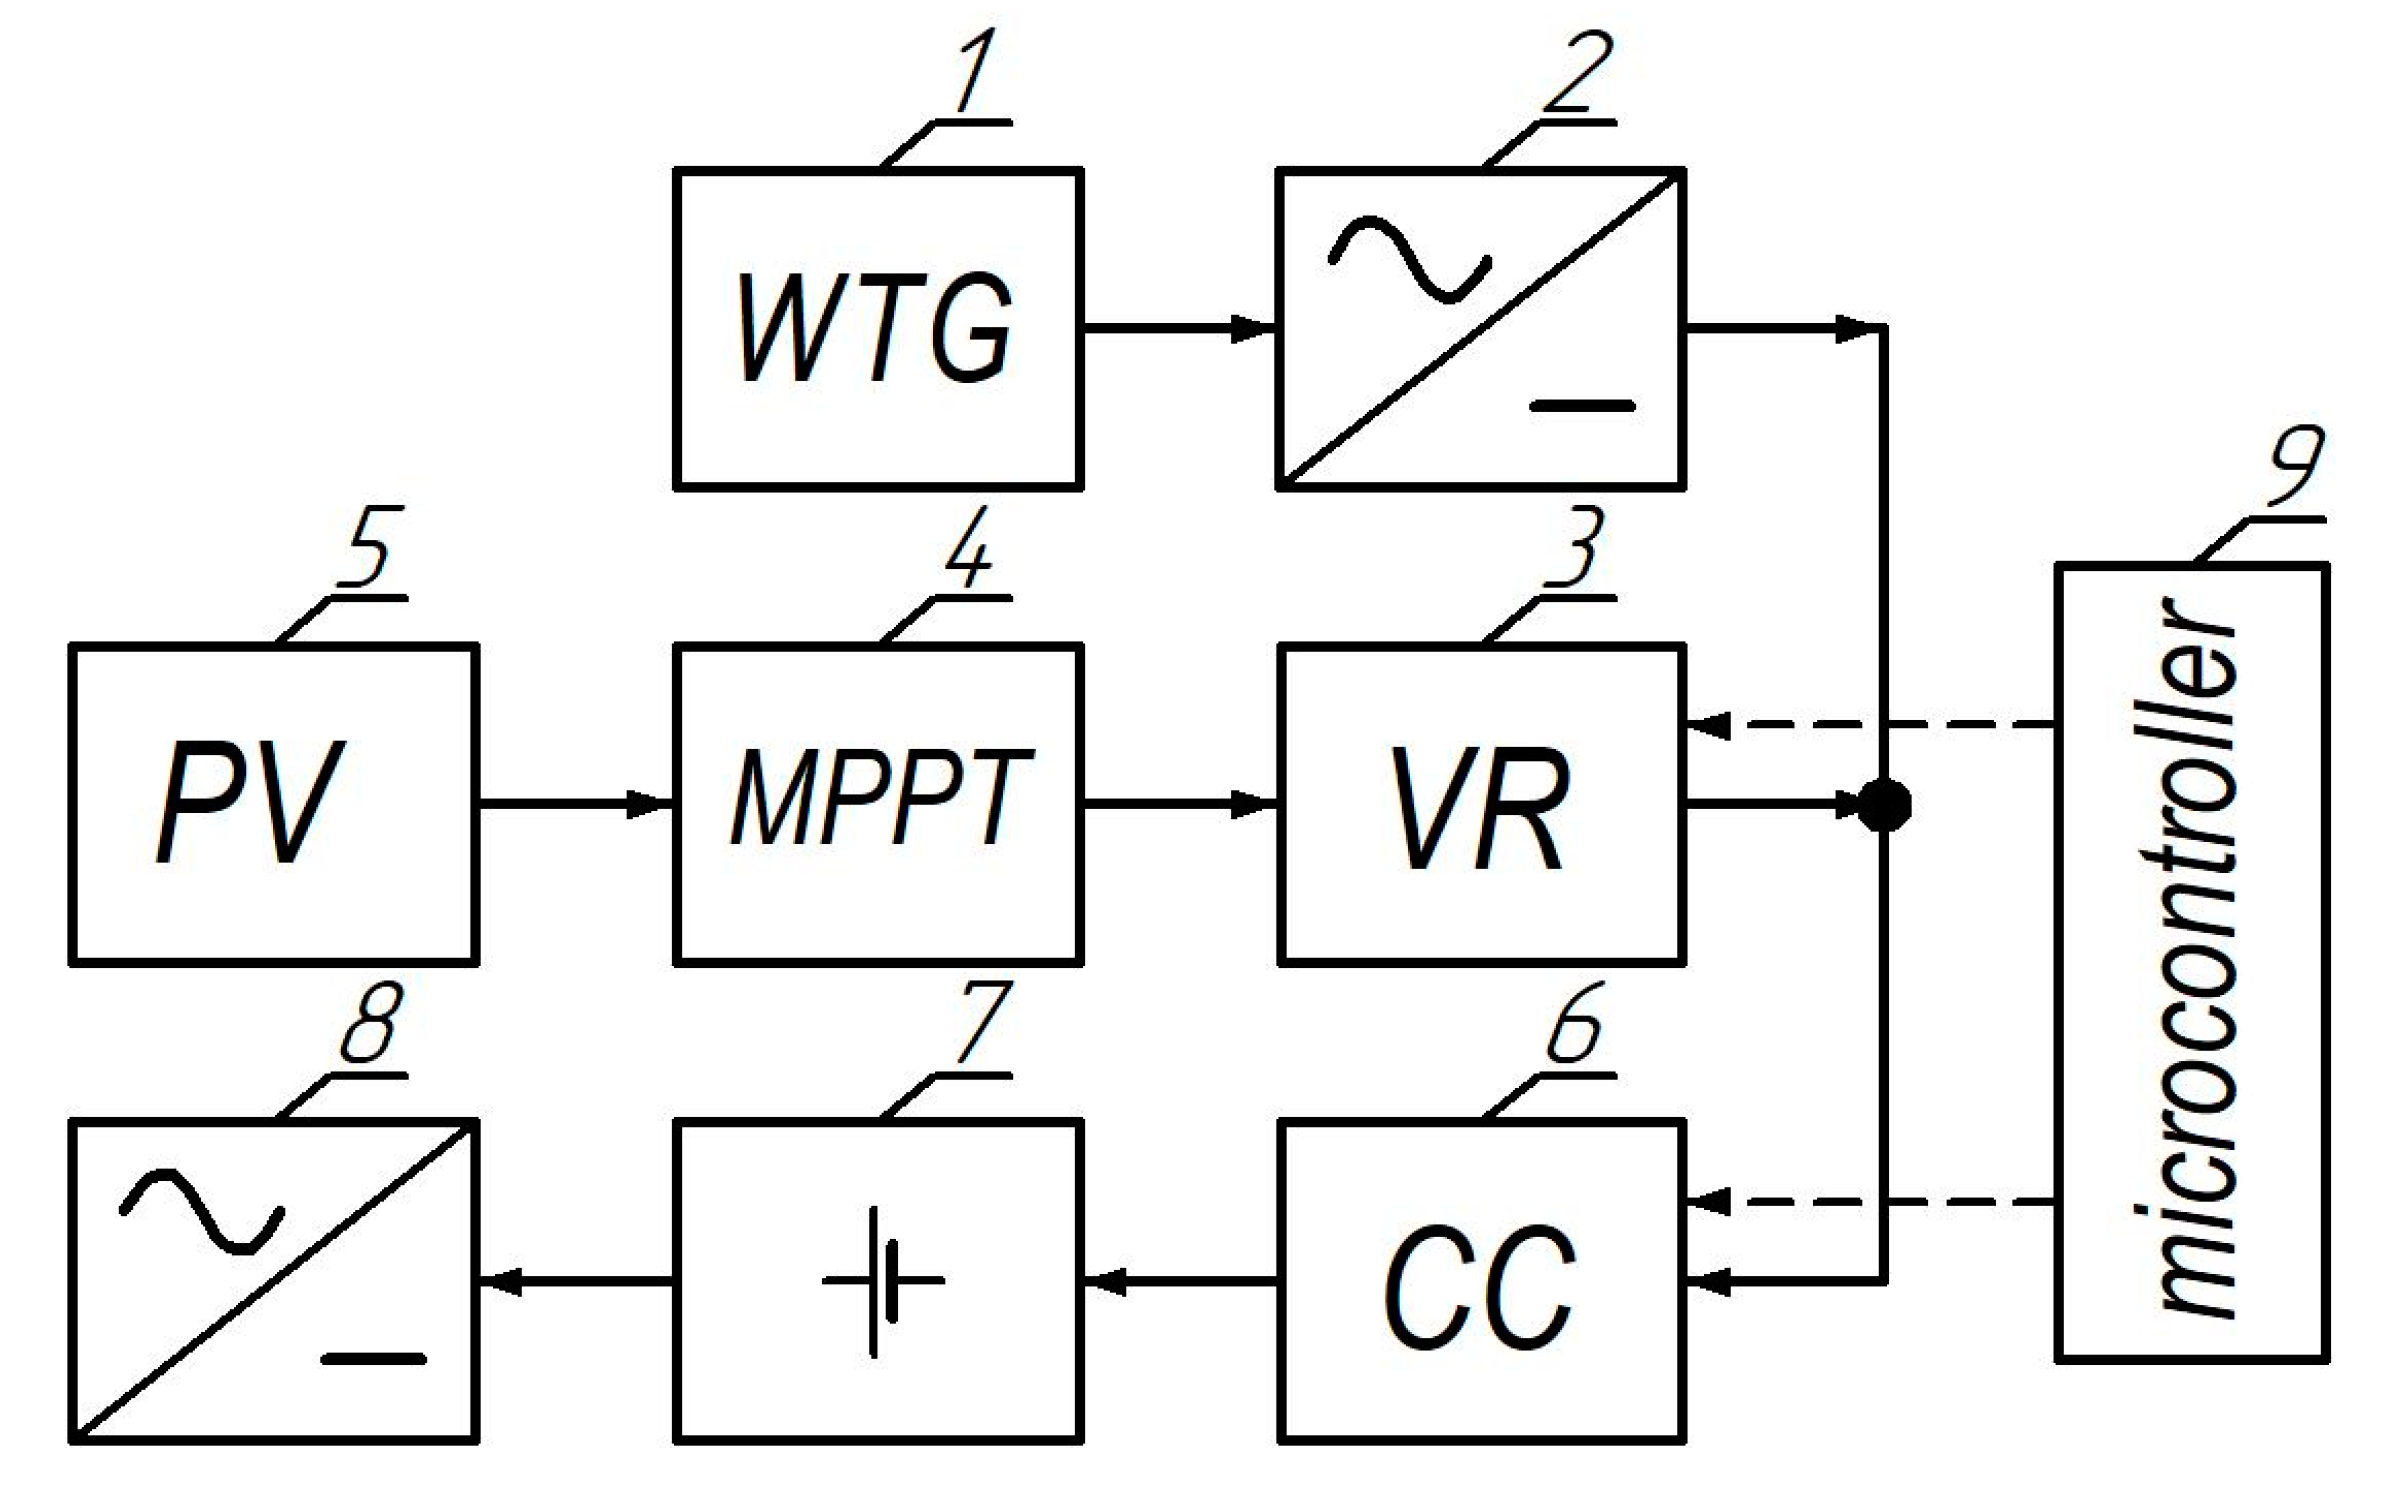
The block diagram of the electrical part of the power plant is shown in Figure 2. The principle of operation is as follows: electrical energy from the alternating current generator of the wind turbine (1) through the charge controller (6) is transferred to the storage battery (7). In this case, the conversion of alternating voltage to direct voltage is carried out by means of a rectifier (2). The electrical energy from the photovoltaic system (5) is also transferred to the battery through the charge controller. At the same time, in order to ensure efficient extraction of electrical energy, using the MPPT controller (4), an energy extraction mode is set corresponding to the maximum power point of photovoltaic converters and voltage matching is performed by means of a stabilizer (3). The voltage regulator and the charge controller are controlled by a microcontroller device (9). Electric energy from the battery is transmitted to the consumer through the inverter (8), which converts DC voltage into AC voltage.
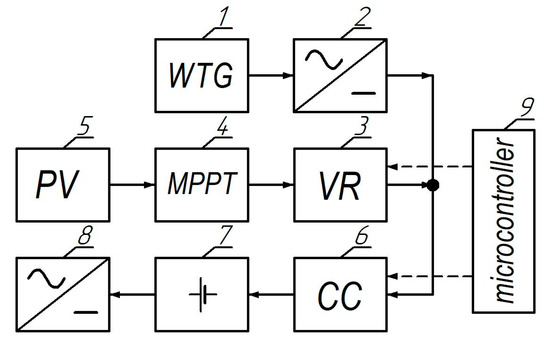
Figure 2.
Block diagram of the electrical part of a wind-solar power station.
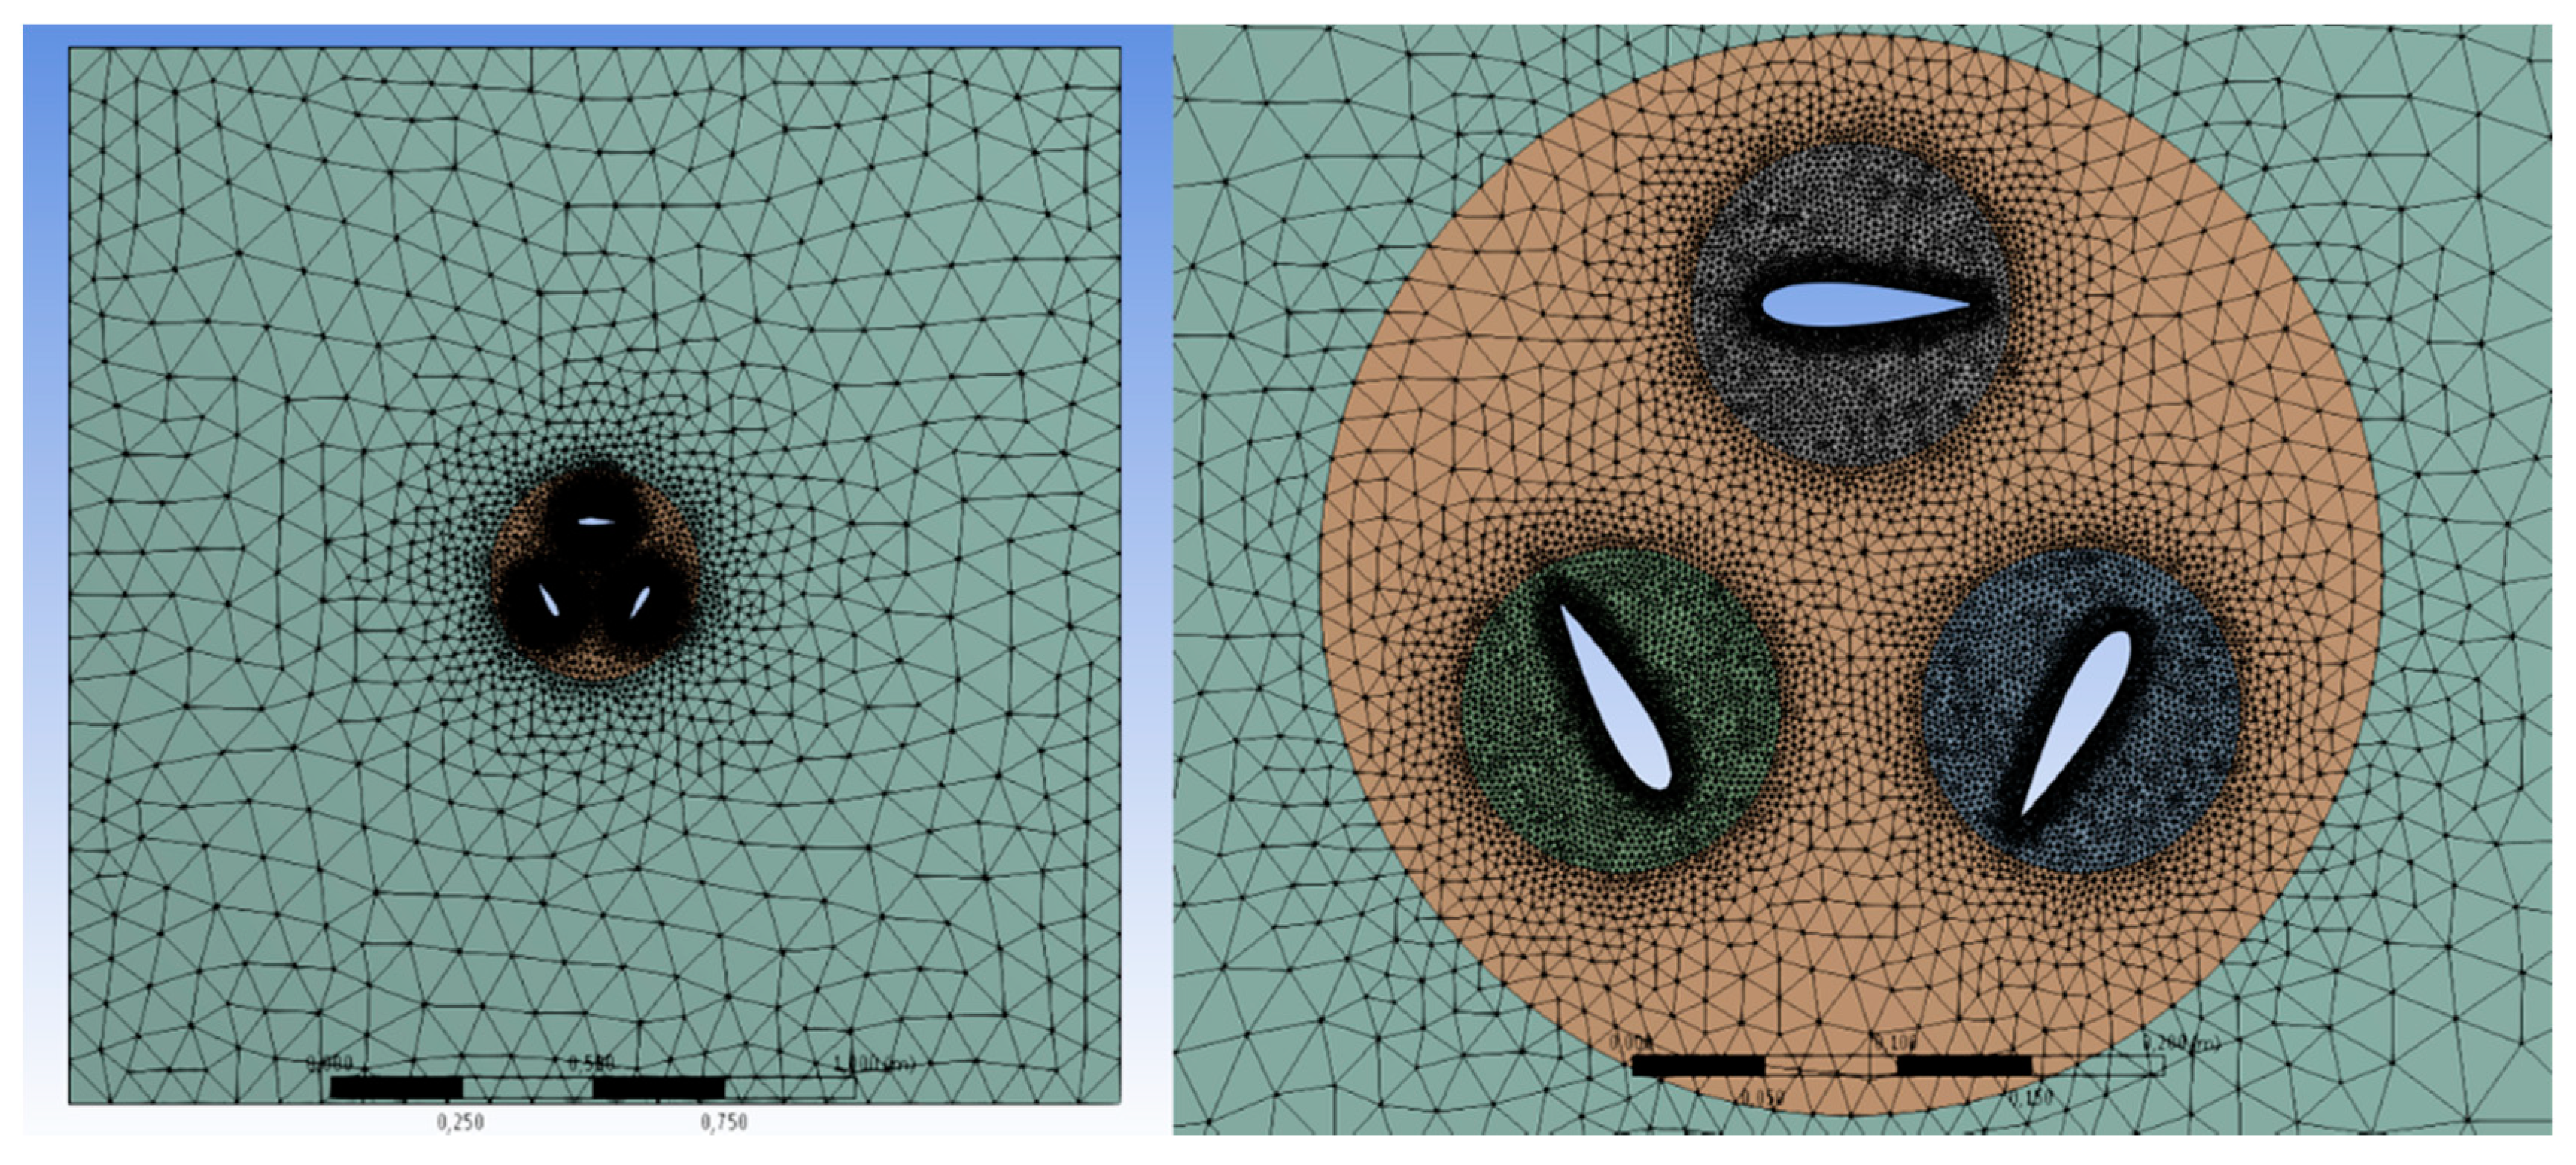
We carried out a digital aerodynamic simulation of the operation of the Darrieus rotor of a wind turbine with three blades with NACA 0021 profiles using the finite volume method [36]. A 2D computational domain with a length exceeding the rotor diameter by a factor of 5 has been developed, which makes it possible to obtain the parameters of the flow around the rotor with an accuracy sufficient for engineering calculations. To speed up the calculations without reducing the accuracy of their results, the computational domain was composed of three subdomains with different grid densities: the outer space around the rotor—the largest mesh size and the inner rotor space—the average mesh size, and the near-wall areas around each blade—the smallest mesh size. The main purpose of the simulation was to determine the angle of the rotor blades ϕ (the angle between the chord of the blade and the tangent to the trajectory of its motion on the fixing axis), at which the value of the coefficient of utilization of wind energy Cp will take the maximum value. The utilization factor of wind energy is a dimensionless value showing the efficiency of converting wind energy into mechanical energy of the rotor. Its value was calculated as the ratio of the mechanical power of the wind turbine rotor to the power of the wind flow:
where PM—mechanical power of the wind turbine rotor; PW—wind power; ω—angular speed of rotation of the rotor; M—torque; ρ—air density; S—swept rotor area; and V—wind speed.
The torque value was calculated using the torque coefficients [37,38] calculated for each blade in one full revolution using the following formula:
where —moment coefficients of rotor blades and R—rotor radius.
3. Results and Discussion
To simulate the operation of the Darrieus rotor and calculate its energy characteristics, a mathematical model was developed using the finite element method.
The geometry was created at the software CATIA P3V5 (Mechanical Design). The calculations and simulations were made at the software ANSYS 14.5, ANSYS Fluent.
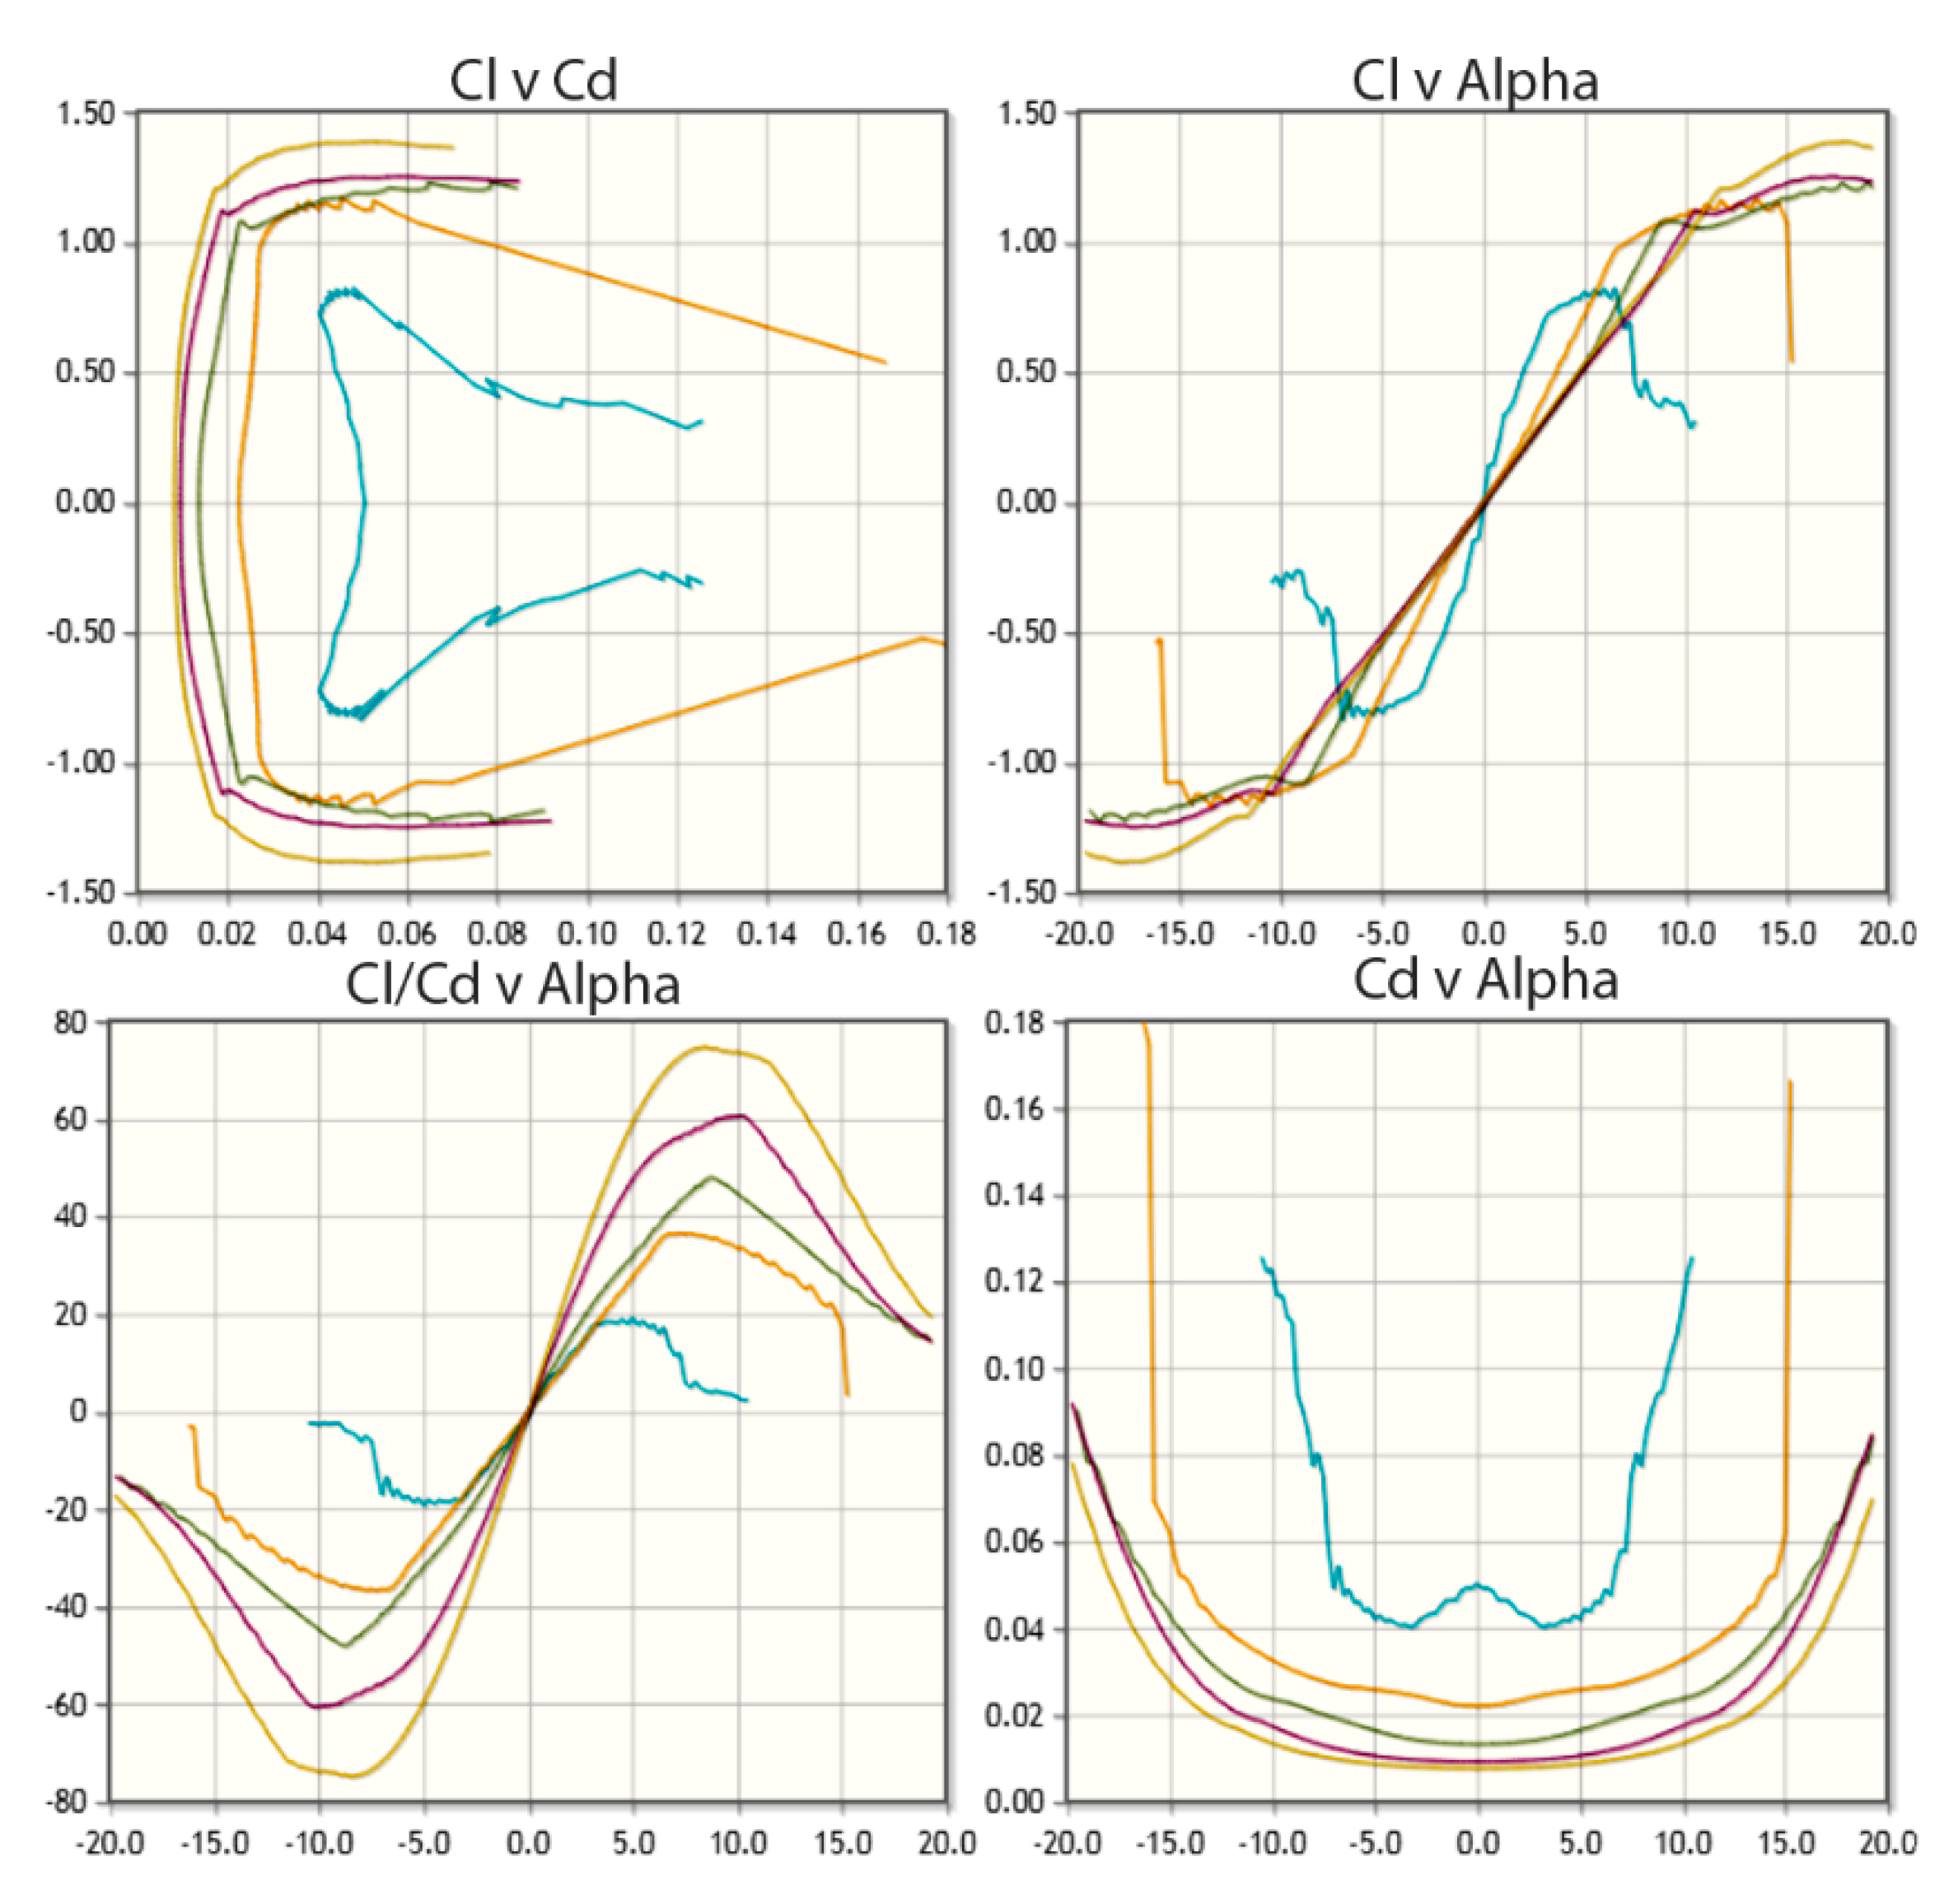
At the first stage, the geometry of the NACA 0021 blade was created. To construct the model of the Darrieus rotor blades, in the CATIA program, the geometric points of the edges were calculated using the known models of the blade profiles. The model was used as a base profile naca0021-il, which has the next parameters: Max thickness 21% at 30% chord, Max camber 0% at 0% chord. Profile characteristics are shown in the Figure 3.
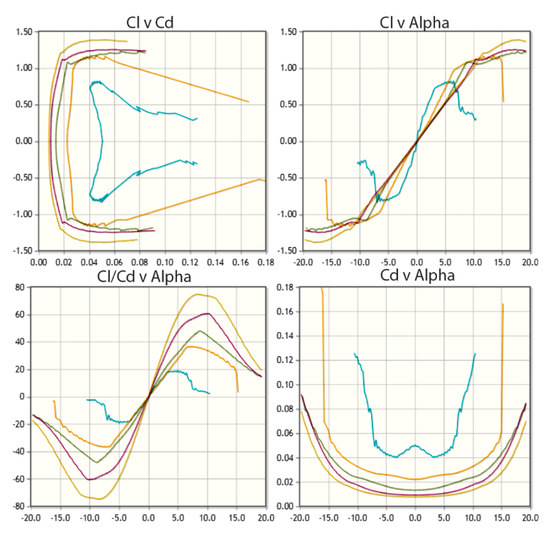
Figure 3.
Profile characteristics of the naca0021-il.
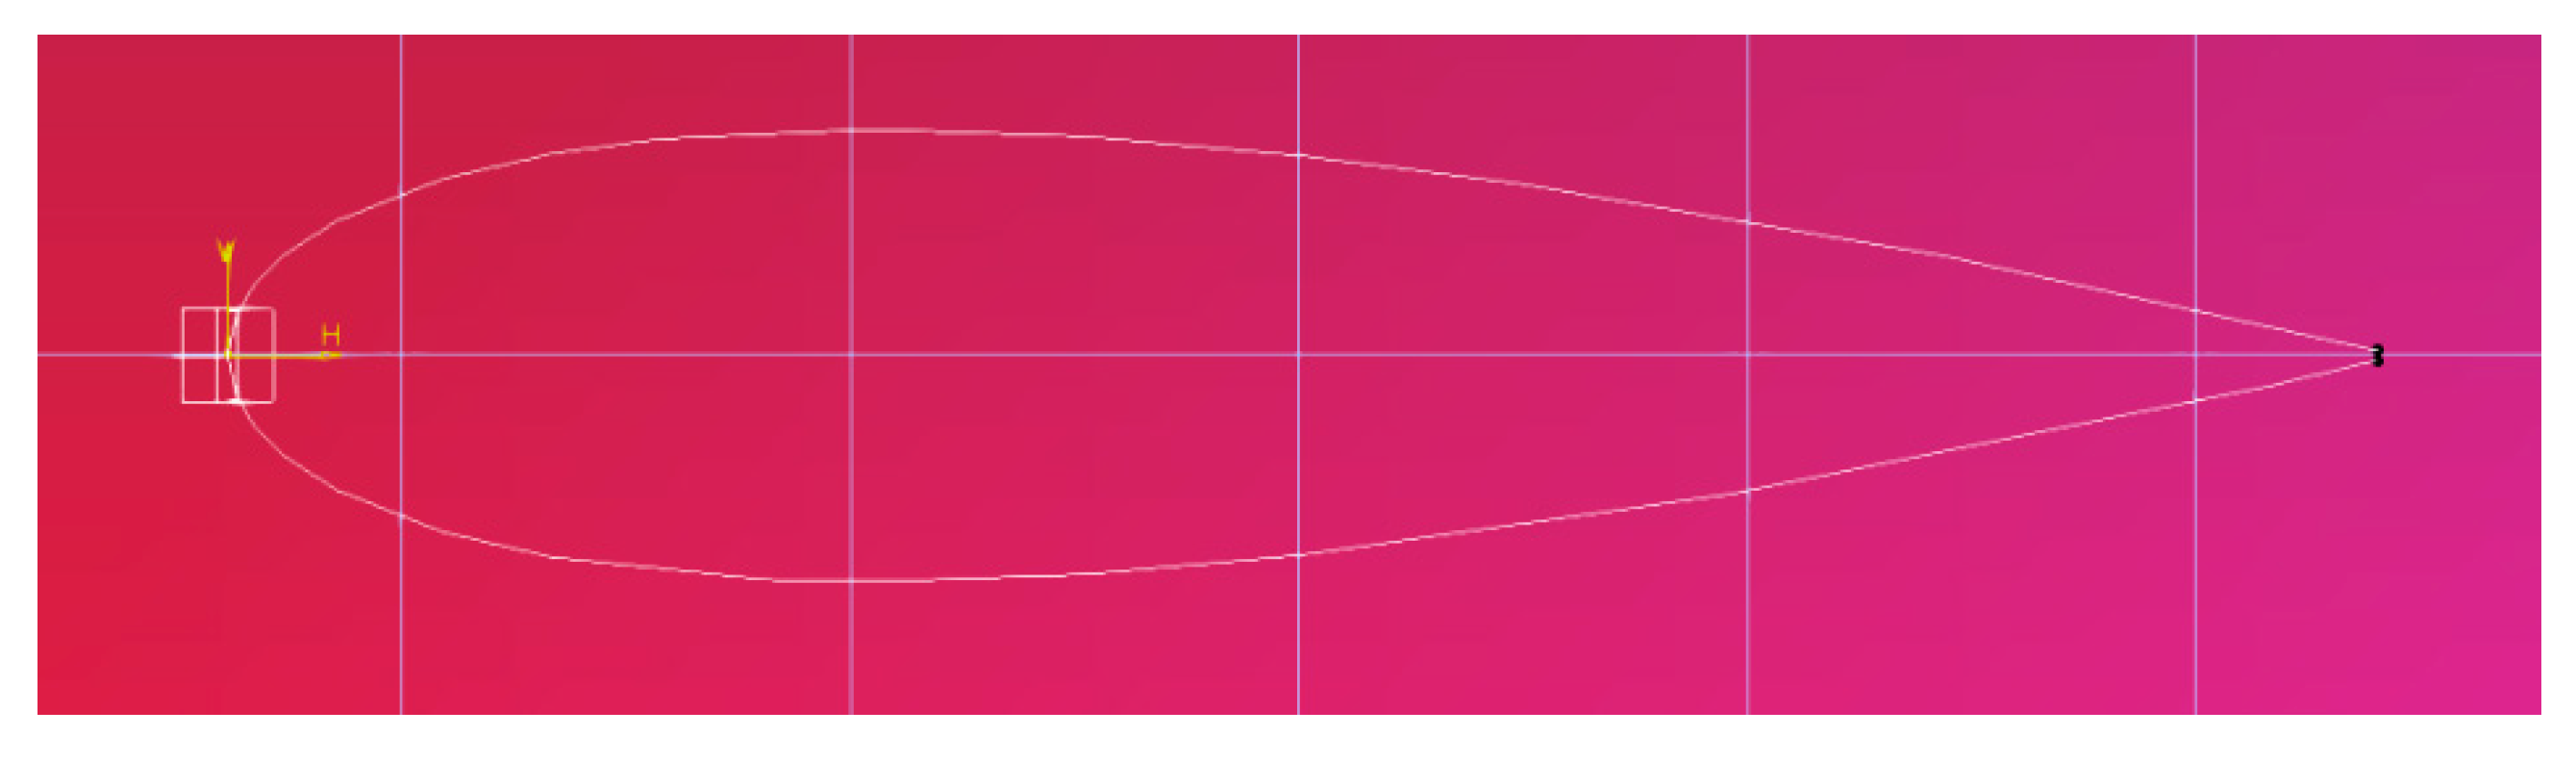
The naca0021-il profile points were transferred to the CATIA program and a sketch of the Darrieus rotor blade was created (Figure 4).
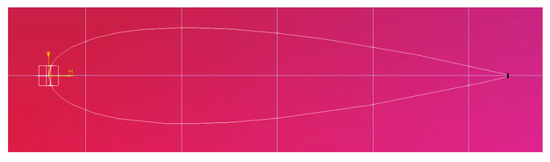
Figure 4.
Sketch of the Darrieus rotor blade in CATIA.
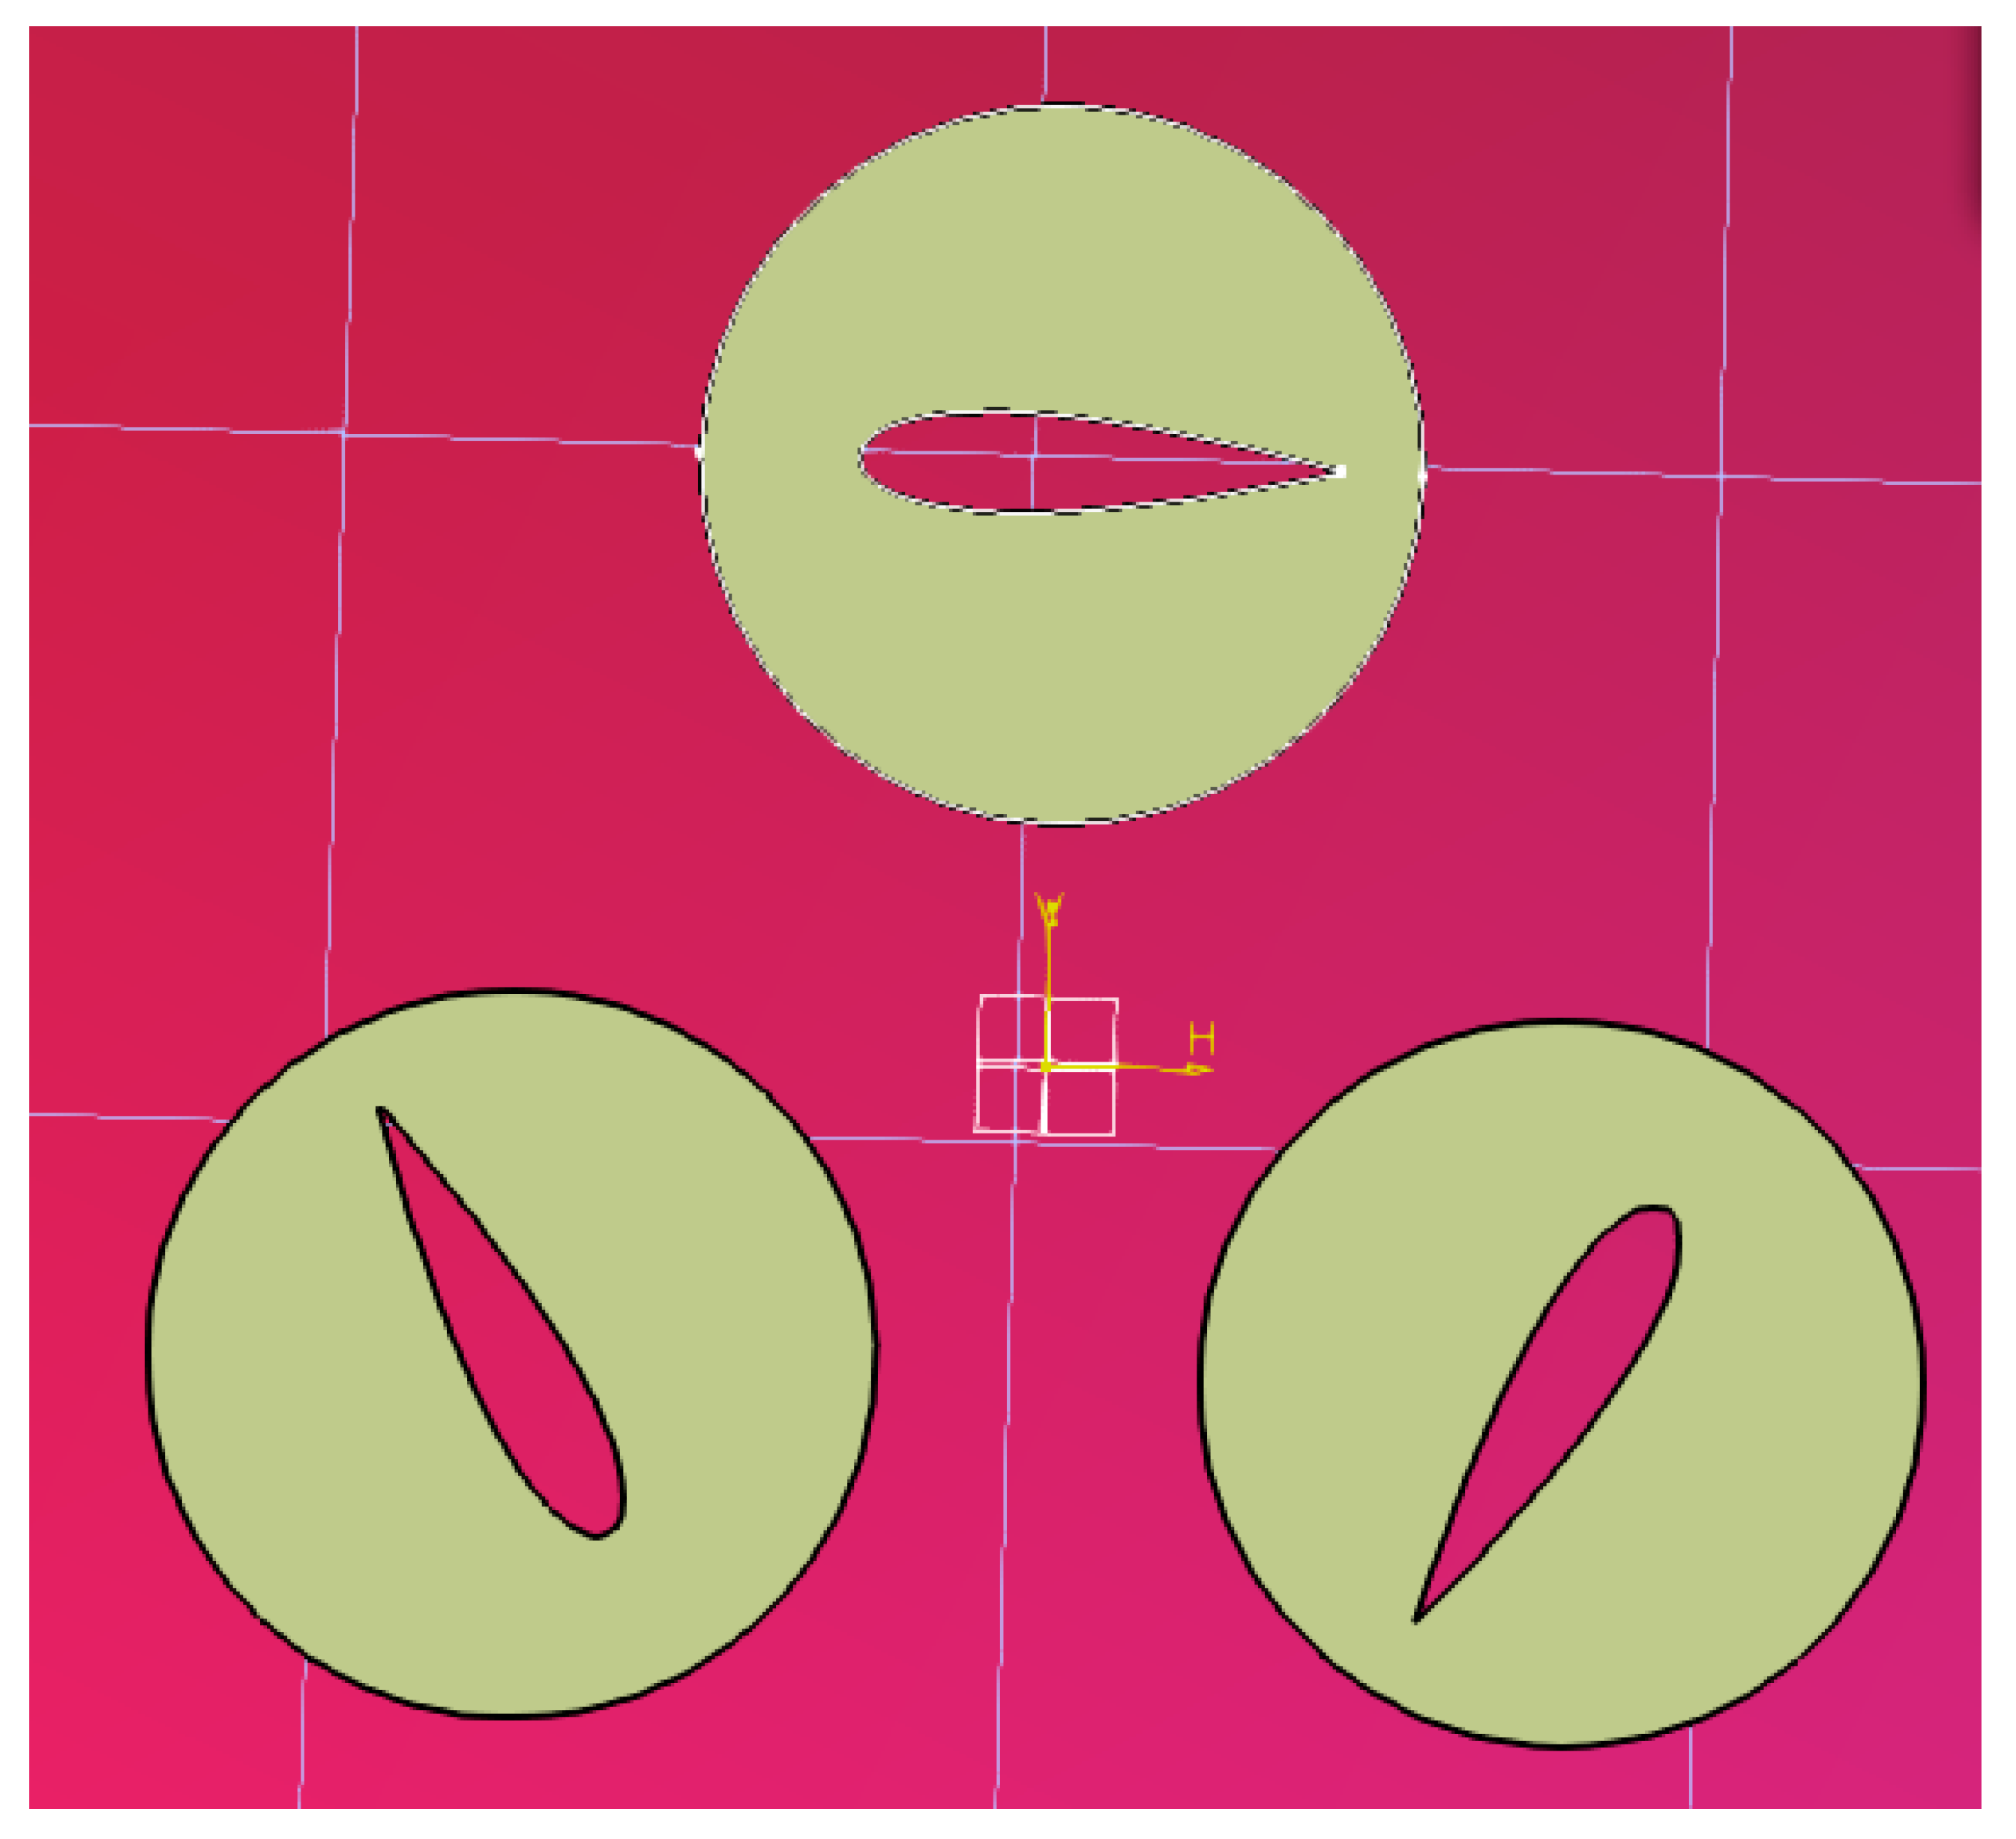
Then, this blade was transformed into a full-fledged geometric copy of the rotor (Figure 5).
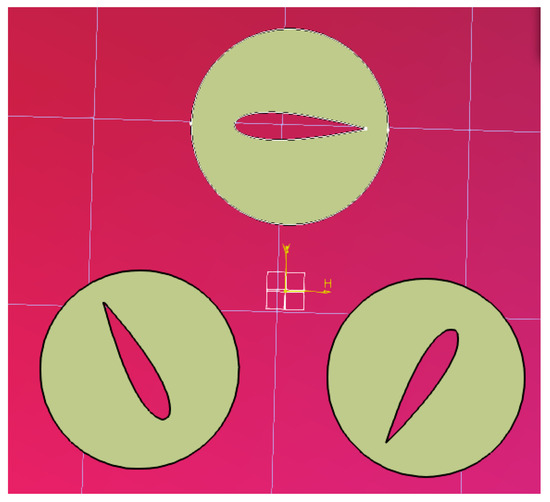
Figure 5.
Sketch of the Darrieus rotor blades in CATIA.
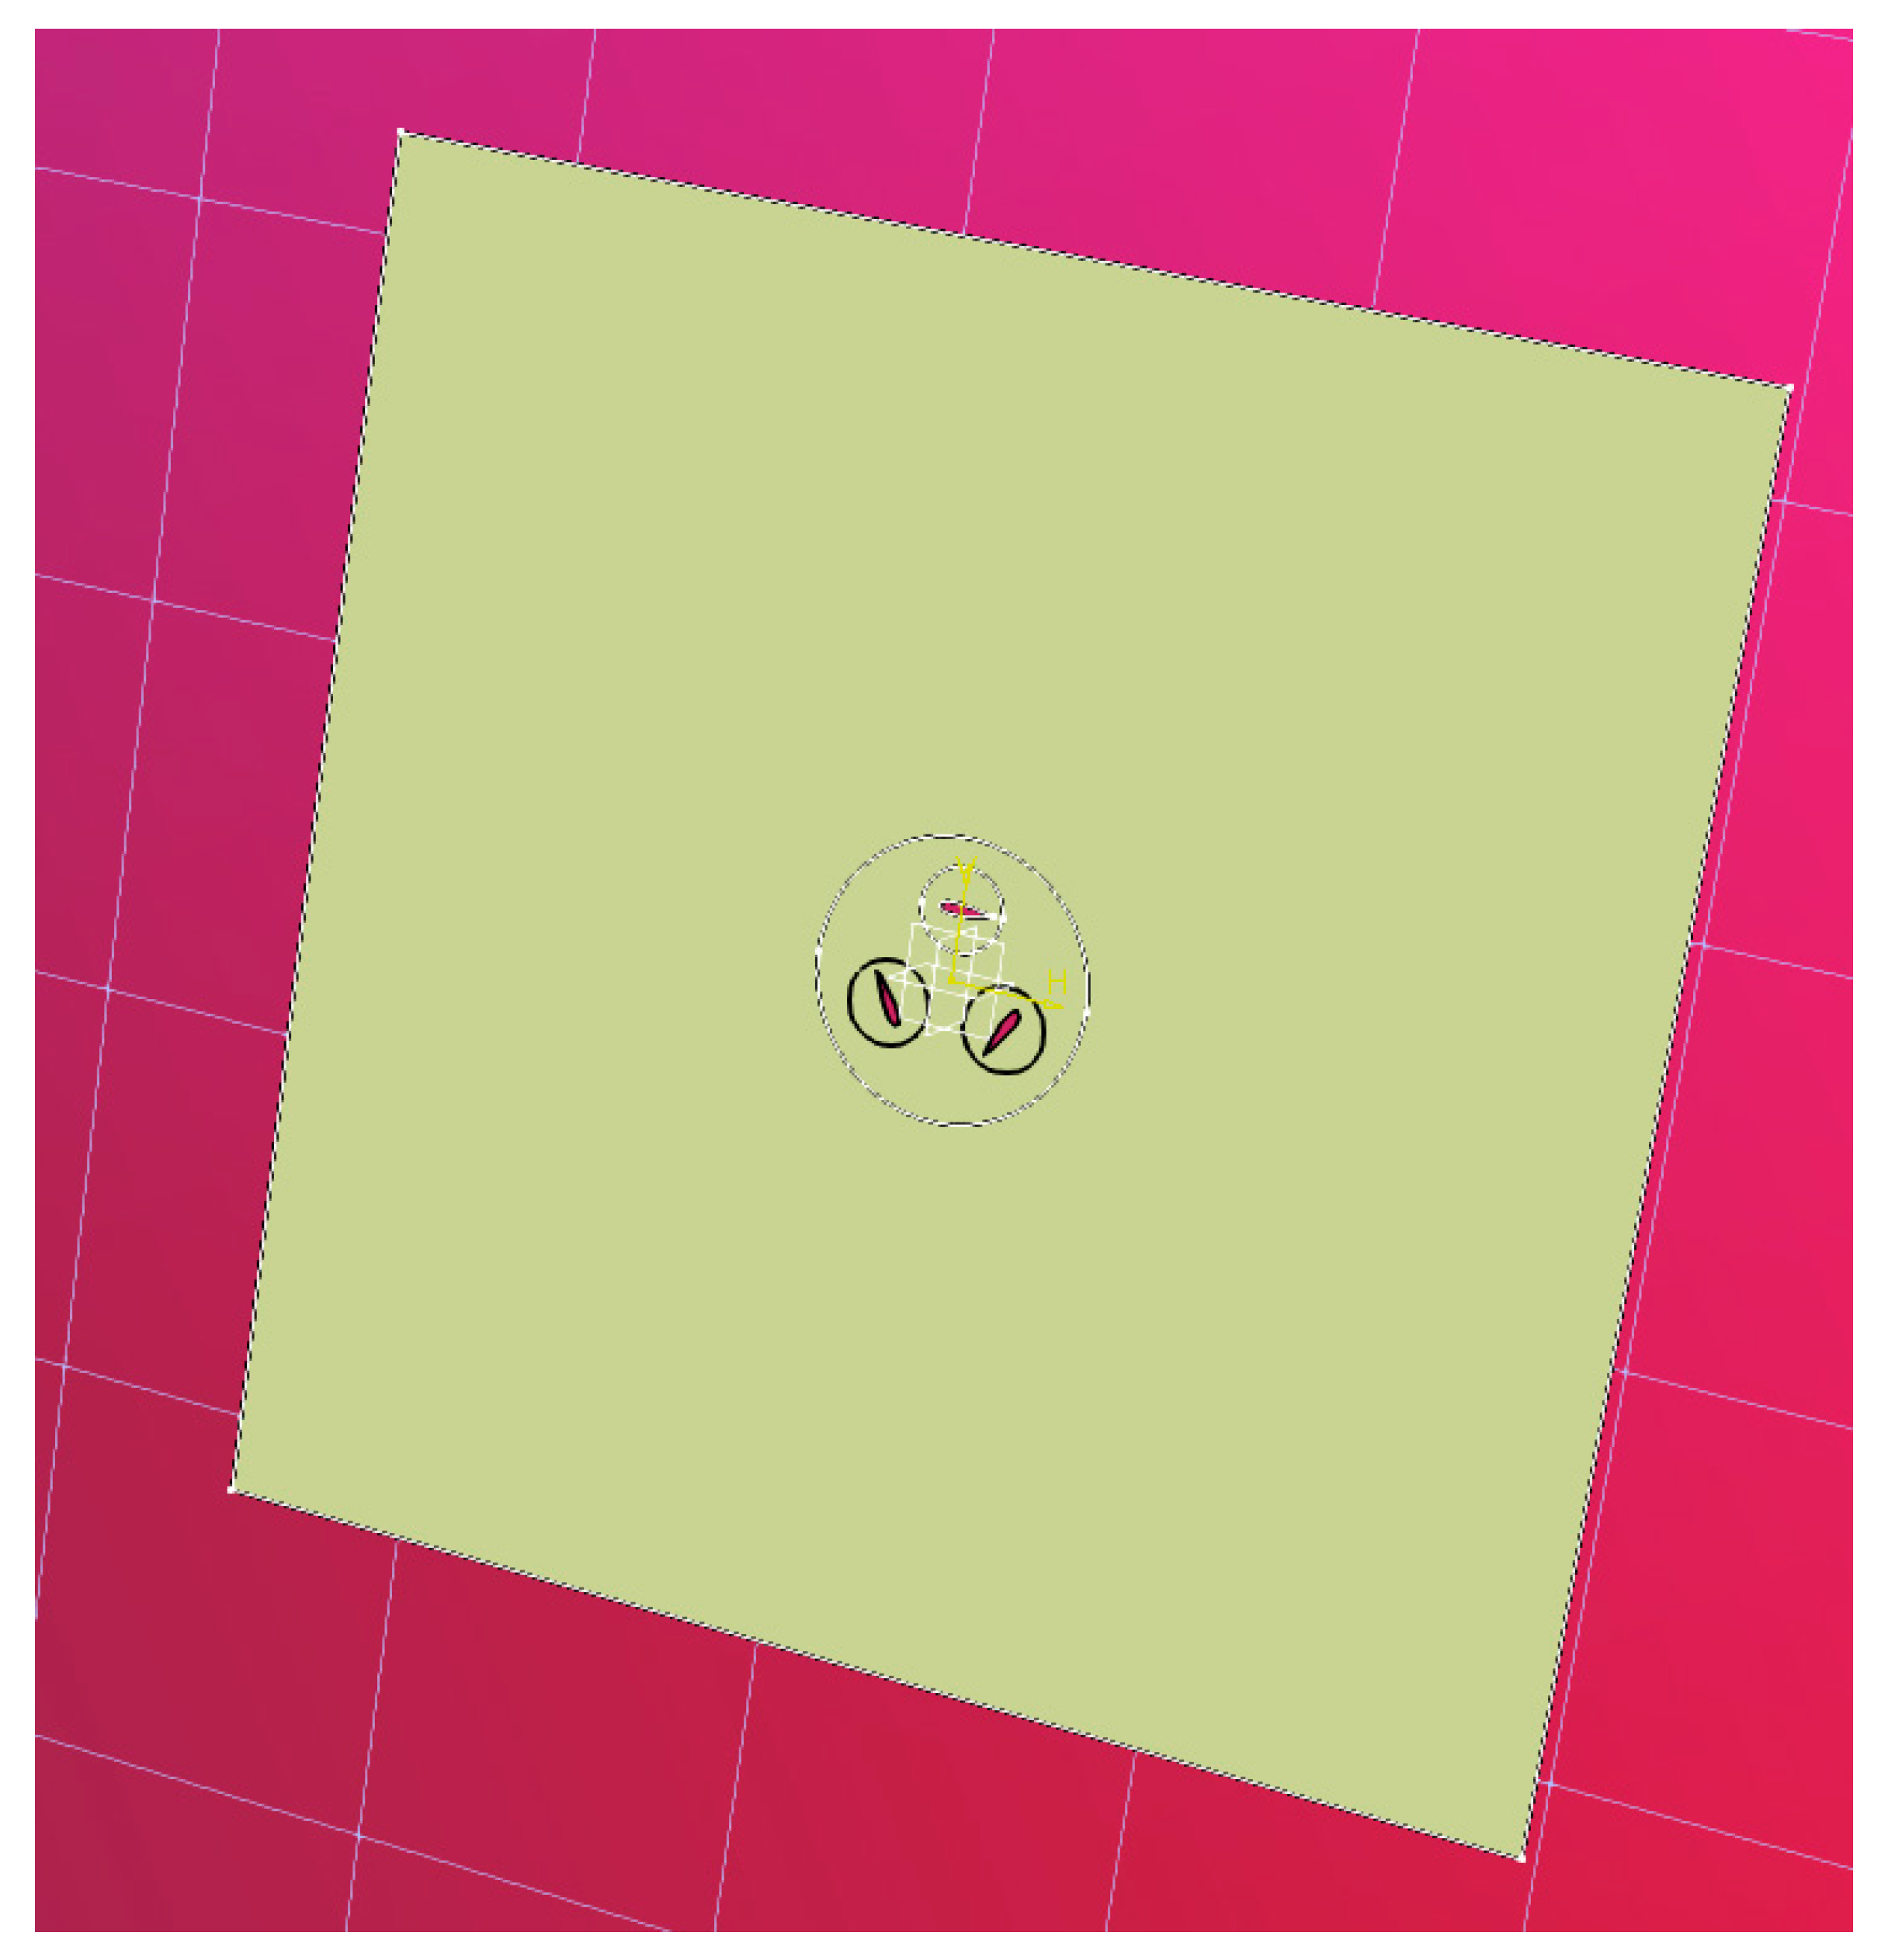
The next step was to set additional geometry elements in the form of geometric contours of boundary conditions, which were necessary for performing subsequent calculations in ANSYS and ANSYS FLUENT software.
Figure 6 shows an image of the final version of the geometry of the simulated Darrieus rotor with a given geometry of all boundary conditions, including three main boundaries: the area remote from the rotor (for approximate modeling of the environment—meshes with large elements), the area near the rotor (for more accurate modeling of the environment around the rotor we used meshes with middle elements), and the area around the rotor blades (for accurate modeling of the environment and the flow of the wind flow along the geometry of the blade we used meshes with small elements).
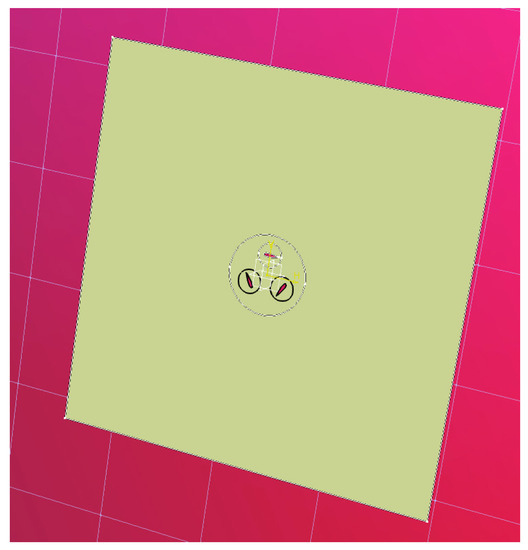
Figure 6.
Sketch of the Darrieus rotor blades in CATIA.
The mesh was generated in ANSYS Mesh using the proximity and curvature advanced size function. The mesh is shown on the Figure 7.

Figure 7.
Mesh of the model.
The results of the simulation of the velocities are shown in Figure 8a,b.
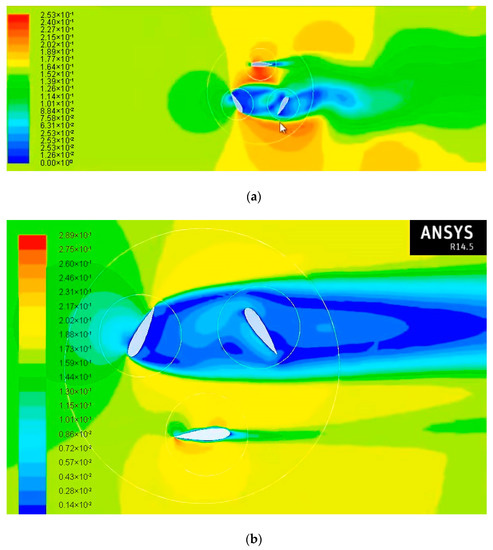
Figure 8.
Results of the simulation (velocities): (a) simulation results and (b) enlarged view of the simulation model.
As a result of the simulation, the characteristic of the utilization factor (Cp) from the peripheral speed was obtained and presented in Figure 8. From the presented characteristics, it follows that the maximum value of the utilization factor is 0.345, which can be assumed as a small value with the respect to the number of model assumptions. As a result, it is necessary to carry out work aimed at increasing this indicator by changing the geometry parameters of the wind turbine rotor and the use of other technical design improvements. The work planned in the subsequent stages of work under this grant will be aimed at solving these problems.
Figure 9 shows the flow velocity diagram in the cross section of a wind turbine with a diameter of 2 m, obtained because of the simulation at a wind speed of 10 m/s using the finite volume method.
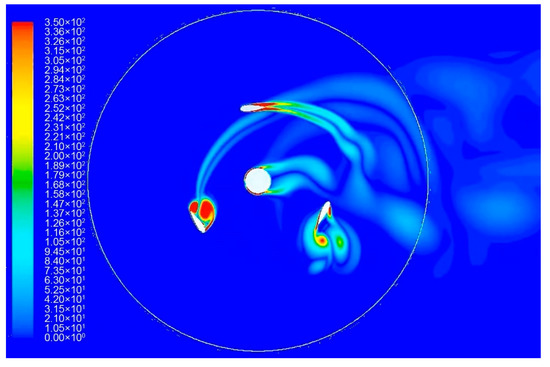
Figure 9.
Velocity map in the turbine’s cross section at 10 m/s of wind speed.
During modeling, the dependence of the coefficient of use of wind energy Cp at different angles of installation of the rotor blades was determined. The results obtained are shown in the summary graph (Figure 10), from which it follows that the maximum value of the wind energy utilization factor Cp is achieved when setting the blade angle φ = 3.8°, while the design value of this angle, regulated by the manufacturer, is 7.8°.
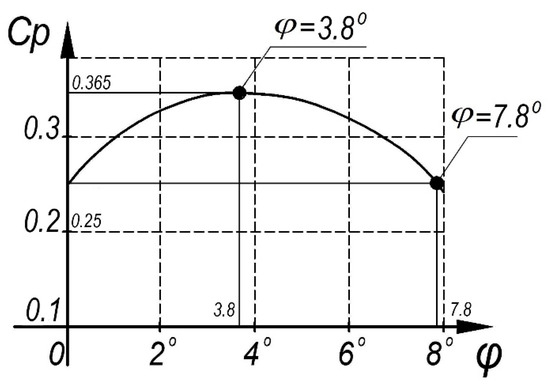
Figure 10.
Power efficiency Cp as a function of the blade pitch angle φ.
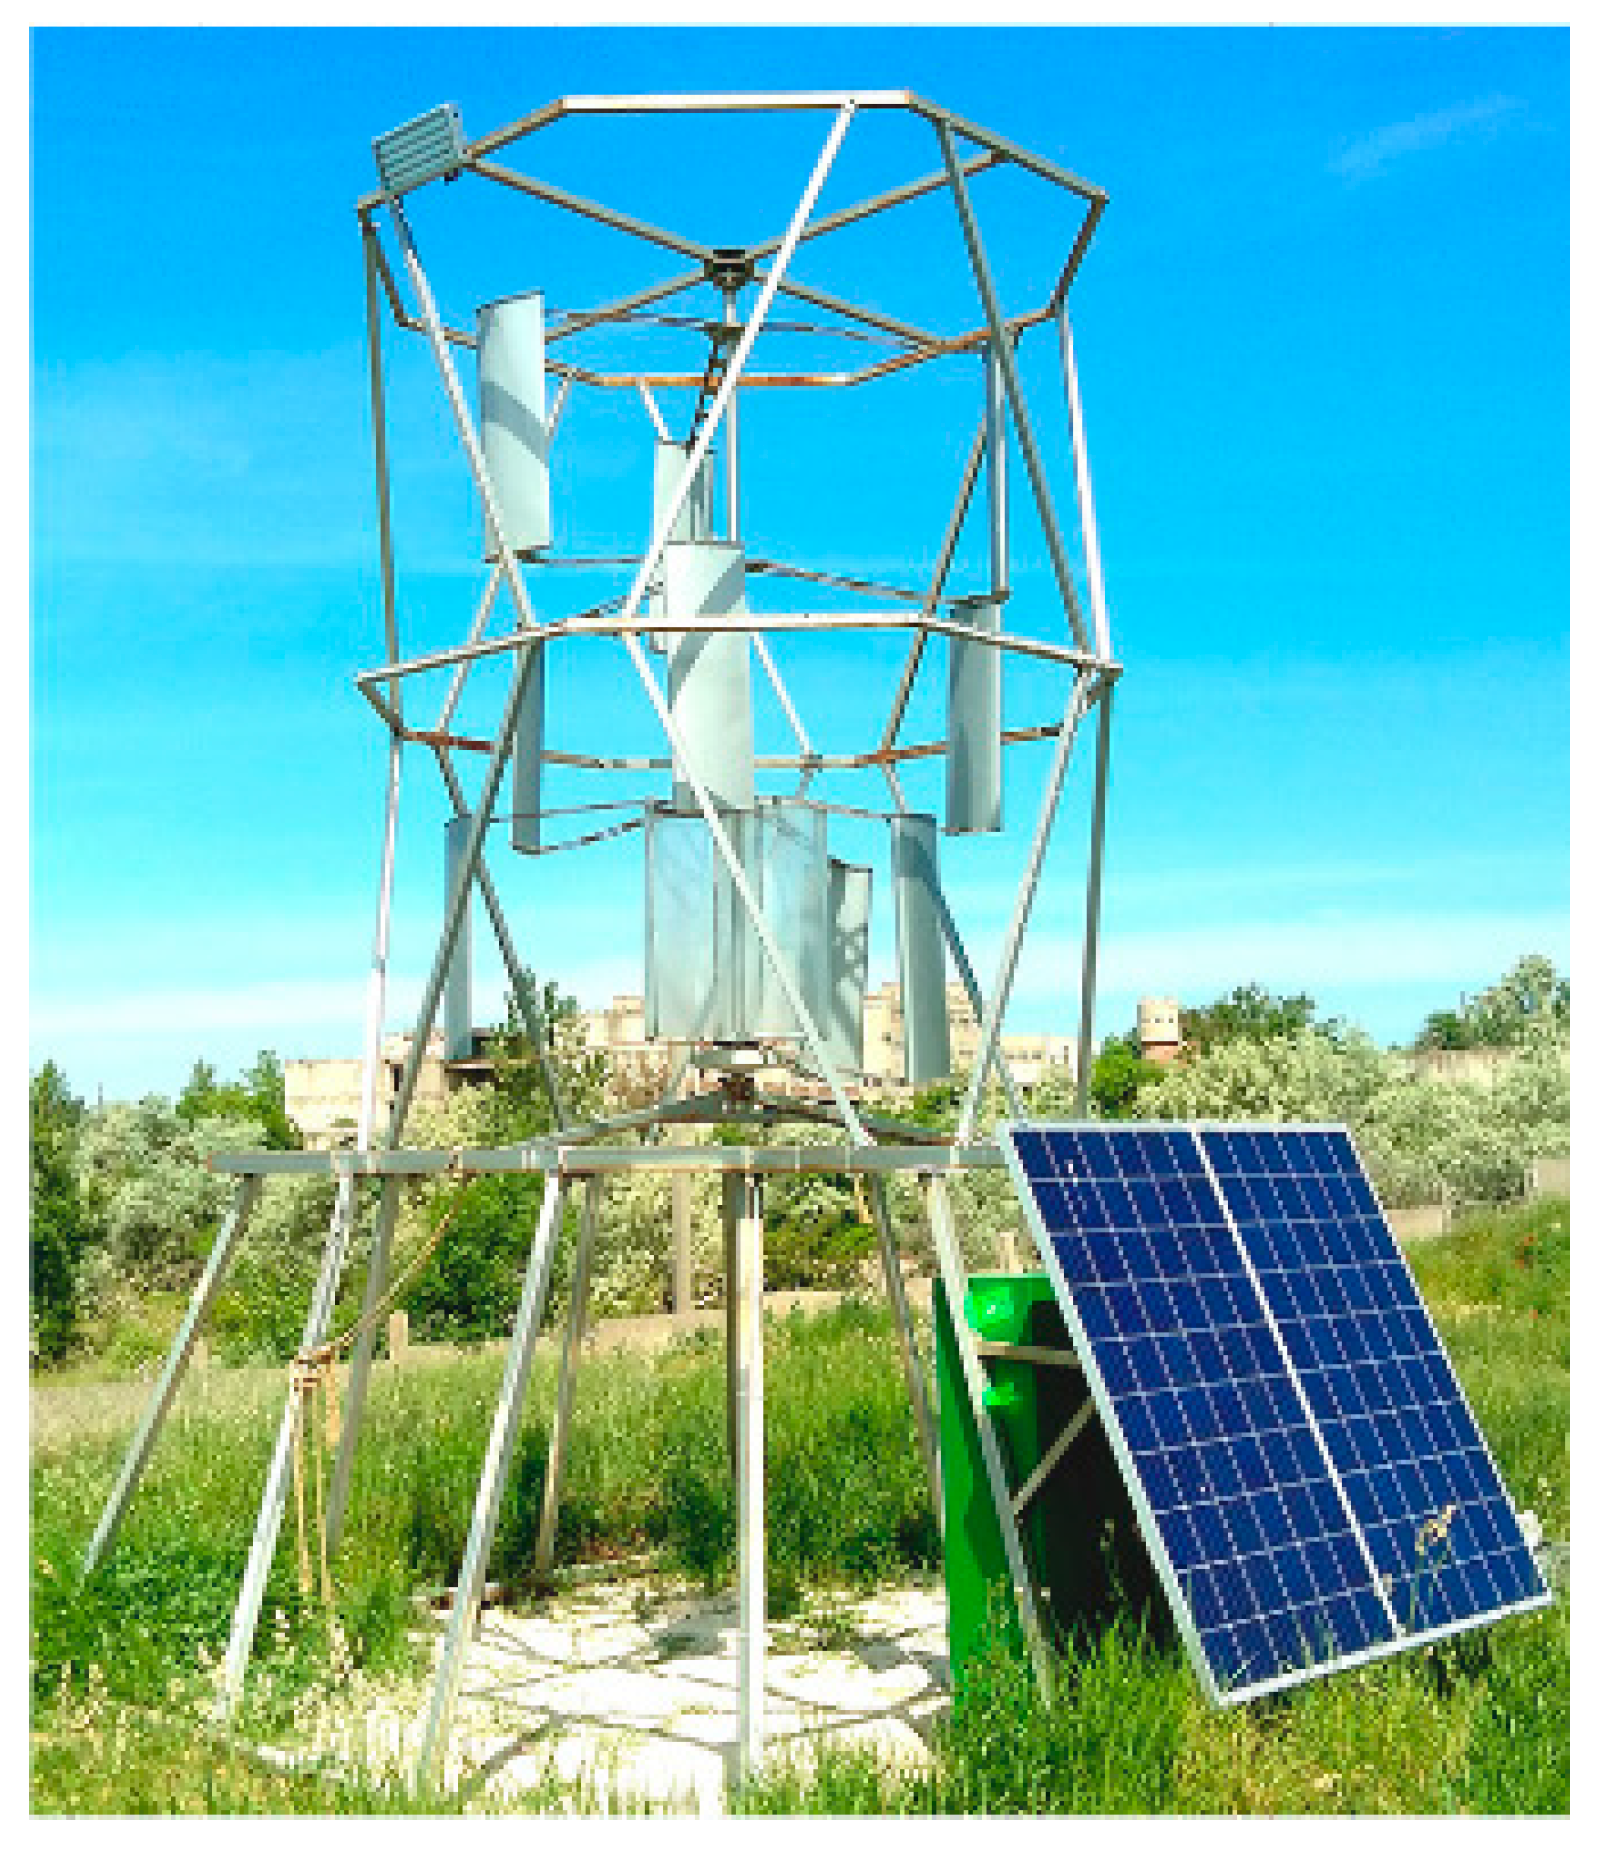
Thus, the simulation showed that initially the wind turbine was operating at limited capacity. An experimental study was also carried out, the purpose of which was to verify the results obtained from digital simulations. To carry out this study, in the city of Sevastopol, on the territory of the student sports and health camp “Horizon”, a physical model of a wind-solar installation was installed, a photograph of which is shown in Figure 11. The rated design power of the wind turbine is 3 kW at a wind speed of 12 m/s. The Darrieus rotor area is 12 m2. Photovoltaic installation formed by two series-connected modules Delta SM 250-24 P and has a rated power of 500 watts.

Figure 11.
Combined wind-solar power plant with a three-section Darier rotor and two photoelectric modules (Sevastopol, SRC «Horizont»).
The technique [39] was used to estimate the true value of the measured values from the results of the experiment. By the beginning of the mathematical processing of the measurement results, all gross and systematic errors were eliminated by introducing appropriate corrections to the measurement results and discarding obviously erroneous results [40]. These operations were eliminated in the first stage of mathematical processing of the measurement results. Thus, the measurement accuracy in the experiments was determined only by random errors.
When processing the experimental results, the “three sigma” rule was used. Thus, the confidence score, given that the sigma value is not known, was calculated from the expression
where —true measured value; —arithmetic mean of measurement results; —number of independent measurements; and —an estimate of the standard deviation determined from the ratio:
where —i-th measurement result.
The accuracy of such an assessment depends significantly on the number of measurements, and therefore, during the experimental study, at least five measurements were carried out, which makes it possible to obtain the value of the reliability assessment Ρ > 0.96.
Calculation of deviations of true values from the arithmetic mean values of measurement results shows that the errors of electrical parameters do not go beyond the limit ±0.2%, for non-electric—±5.2%.
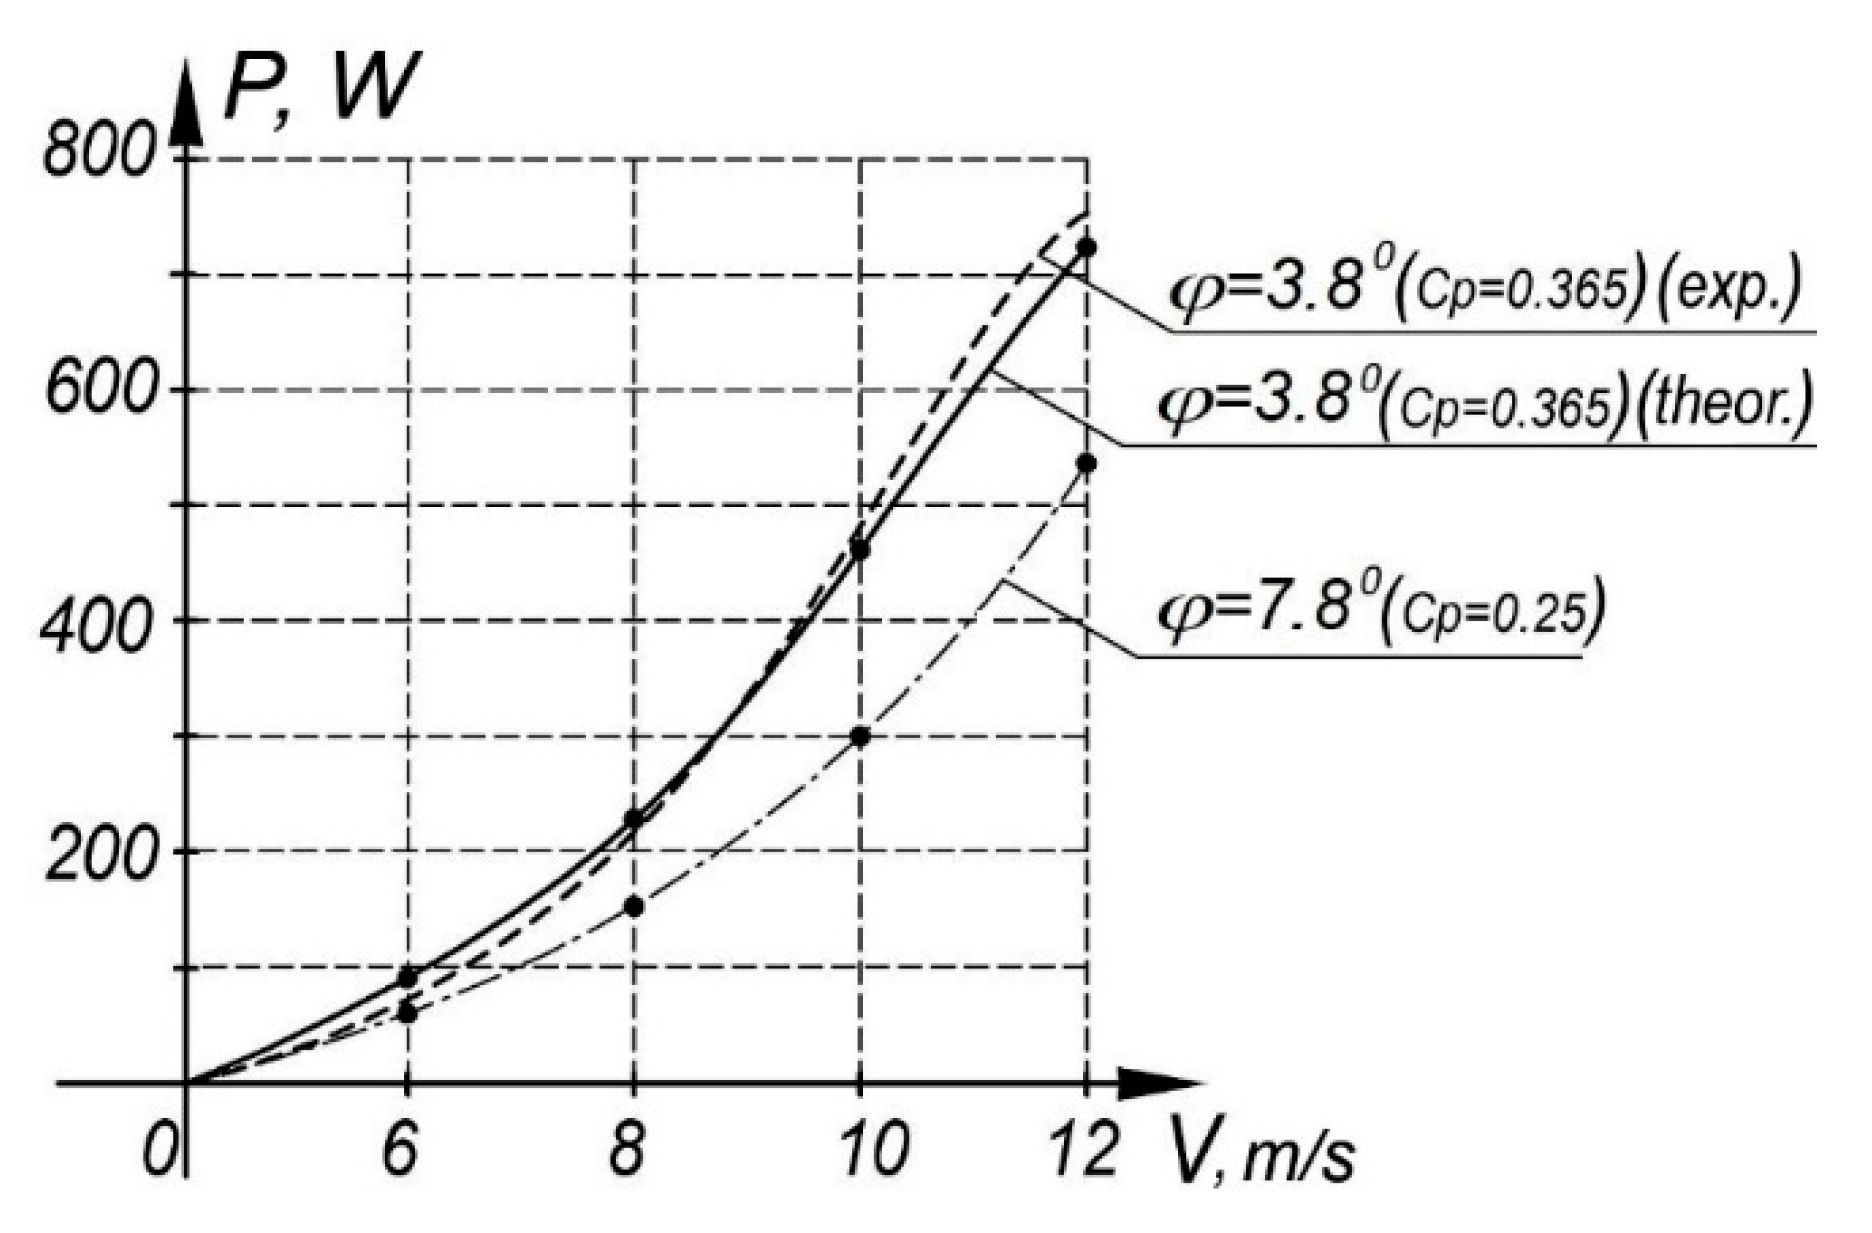
Figure 12 shows the obtained power characteristics of the wind turbine (dependence of power on wind speed) at an angle of installation of the blades 3.8° and 7.8°. The power values obtained in the experimental study were divided by 3 due to the fact that the simulation was performed only for one of the three sections of the Darrieus rotor [41]. The theoretical characteristics were constructed using the wind turbine power formula
where P—wind turbine power and Efficiency of the generator and mechanical transmission of the wind turbine.

Figure 12.
Power curves of the wind turbine.
It follows from the characteristics that the change in the angle of the blades made it possible to increase the energy efficiency of the operation of the wind turbine by more than 30% in almost the entire measured range of wind speed.
During the experimental study, the temperature of the rear surface of the photovoltaic modules was also measured by the pyrometric method. The measurement showed that the rotation of the rotor of the wind turbine makes it possible to reduce the temperature from 41.1 °C to 32 °C at wind speed 5 m/s, southbound, ambient temperature 25 °C and the intensity of solar radiation is about 650 W/m2. This made it possible to increase the output power of photovoltaic modules by 3%. This result made it possible to obtain a qualitative result that confirms an increase in the energy efficiency of photovoltaic modules due to an increase in heat transfer from a solar cell by means of additional convective heat transfer.
Figure 13 shows the current-voltage characteristics at the output of photovoltaic modules and a matching stabilizer, obtained as a result of simulation. It can be seen from the characteristics that the matching stabilizer allows the transfer of electrical energy from photovoltaic modules at the point of maximum power at any voltage values at the output of the wind turbine generator.
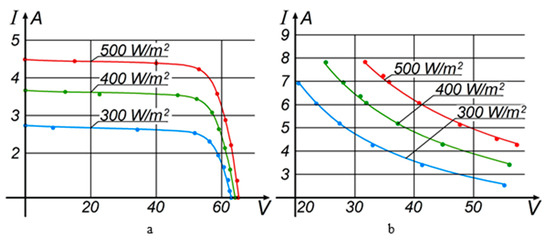
Figure 13.
Current-voltage characteristics of photovoltaic modules (a) and a matching stabilizer (b) (dots indicate experimental).
The results of calculations of the annual power generation of photovoltaic modules showed that the optimal angle of installation of photovoltaic modules for the city of Sevastopol is 34°. From this it follows that they worked at limited power, as the module was fixed at a suboptimal angle 50°, set by the manufacturer. Figure 14 shows diagrams of annual energy production for optimal (34°) and suboptimal installation angle (50°) of photovoltaic modules.
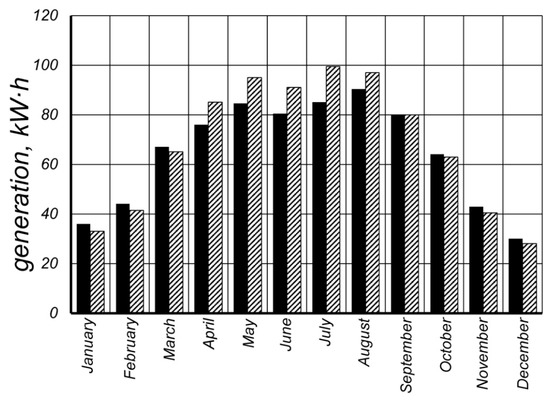
Figure 14.
Diagram of monthly energy output of photovoltaic modules installed at an angle of 34° ▒ and 50° █ to the horizon.
It follows from the diagram that when the angle of photovoltaic modules is set to 34°, the annual power generation is 817 kW·h, and when the angle of installation is 50° it is 783 kW·h. Thus, changing the angle makes it possible to increase the power generation of the photovoltaic installation by 4.3%. The diagram also shows that for an even greater increase in efficiency, it is required to change the angle during operation: in the cold season, set the angle 50°, and in warm—34°. This event will allow to work out electrical energy on 6.2% more.
4. Conclusions
The processes of energy transformation from the RES have a direct impact on the environment. Implementation of the multivalent RES stations will decrease the dependency on the energy form the fossil fuel in the manufacturing and urban sectors primarily in the areas with the poor fossil fuel network.
Thus, the article shows that in order to minimize the existing risks associated with the development of urbanized areas, the concept of sustainable development of a smart urban environment is being introduced everywhere. However, existing digital transformation technologies do not sufficiently take into account environmental, economic, and social components. It requires the development of specialized solutions that, on the one hand, contribute to the development of the urban environment, and on the other, are focused on the use of innovative technologies that have a beneficial effect on the environment. In view of this, in order to provide electricity to objects of a smart urban environment, the authors propose, instead of the classical central power supply, to use autonomous power plants operating from renewable energy sources, in particular, wind and sun. The article showed the advantages of using combined wind-solar power plants, the main of which is the increased stability of electricity generation. An important advantage of this solution is also that it allows to increase the energy efficiency of photovoltaic converters by intensifying heat removal from the surface of the photocells, which significantly increases its total energy characteristics and increases the production of thermal and electrical energy. The presented results of digital aerodynamic modeling of the operation of the Darrieus wind turbine rotor using the finite volume method show that by setting the optimal blade angle, its energy efficiency can be significantly increased. The simulation results show that the maximum value of the wind utilization coefficient is achieved when the blades are installed at an angle 3.8°. The results of the parametric optimization of the photovoltaic installation in the conditions of Sevastopol showed that the highest efficiency is achieved when the modules are installed at an angle 50° to the horizon in the winter season, and in the summer—34°, which allows to generate 6.2% more electrical energy.
Estimated calculations of the energy parameters of the combined wind-solar plant with a rated power of 3.5 kW show that the potential annual energy production is 9817 kWh (9000 kWh is generated by the wind generator and 817 kWh by photovoltaic modules).
Author Contributions
Conceptualization, P.K. and M.R.; methodology, B.Y.; software, P.K. and D.V.; validation, V.E.; formal analysis, P.K.; investigation, B.Y.; resources, D.V.; data curation, V.E.; writing—original draft preparation, P.K.; writing—review and editing, P.K. and O.K.; visualization, O.K.; supervision, M.R. and M.L. All authors have read and agreed to the published version of the manuscript.
Funding
This research was funded by APVV-16-0192 and KEGA: 023TUKE-4/2021.
Institutional Review Board Statement
Not applicable.
Informed Consent Statement
Not applicable.
Data Availability Statement
Not applicable.
Acknowledgments
This work was supported by the Slovak Research and Development Agency under the contract No. APVV-16-0192. The autors would like to thank the KEGA grant agency for supporting research work and co-financing the project KEGA: 023TUKE-4/2021.
Conflicts of Interest
The authors declare no conflict of interest.
References
- Höjer, M.; Wangel, J. Smart sustainable cities: Definition and challenges. ICT Innov. Sustain. 2015, 310, 333–349. [Google Scholar]
- Martin, C.J.; Evans, J.; Karvonen, A. Smart and sustainable? Five tensions in the visions and practices of the smart-sustainable city in Europe and North America. Technol. Forecast. Soc. Chang. 2018, 133, 269–278. [Google Scholar] [CrossRef]
- Hara, M. New key performance indicators for a smart sustainable city. Sustainability 2016, 8, 206. [Google Scholar] [CrossRef] [Green Version]
- Bibri, S.E. A foundational framework for smart sustainable city development: Theoretical, disciplinary, and discursive dimensions and their synergies. Sustain. Cities Soc. 2018, 38, 758–794. [Google Scholar] [CrossRef]
- Al-Nasrawi, S.; Adams, C.; El-Zaart, A. A conceptual multidimensional model for assessing smart sustainable cities. J. Inf. Syst. Technol. Manag. 2015, 12, 541–558. [Google Scholar]
- Albino, V.; Berardi, U.; Dangelico, R.M. Smart cities: Definitions, dimensions, performance, and initiatives. J. Urban Technol. 2015, 22, 3–21. [Google Scholar] [CrossRef]
- Kummitha, R.K.; Crutzen, N. How do we understand smart cities? An evolutionary perspective. Cities 2017, 67, 43–52. [Google Scholar] [CrossRef]
- Batty, M.; Axhausen, K.W.; Giannotti, F.; Pozdnoukhov, A.; Bazzani, A.; Wachowicz, M.; Ouzounis, G.; Portugali, Y. Smart cities of the future. Eur. Phys. J. Spec. Top. 2012, 214, 481–518. [Google Scholar] [CrossRef] [Green Version]
- Hader, M.; Rodzi, A. The smart city infrastructure development and monitoring. Theor. Empir. Res. Urban Manag. 2009, 4, 87–94. [Google Scholar]
- Ramaprasad, A.; Sánchez-Ortiz, A.; Syn, T. A unified definition of a smart city. In International Conference on Electronic Government; Springer: Cham, Switzerland, 2017; pp. 13–24. [Google Scholar]
- Ghosal, A.; Halder, S. Building Intelligent Systems for Smart Cities: Issues, Challenges and Approaches. Comput. Commun. Netw. 2018, 18, 107–125. [Google Scholar] [CrossRef]
- Gupta, S.K.; Vanjale, S.B. Internet of things in smart city environments. Int. J. Recent Technol. Eng. 2019, 8, 7917–7921. [Google Scholar]
- Sujata, J.; Abhijit, C.; Chanda, B. Impact of IOT technologies on smart city infrastructure: Current applications and future potential. Int. J. Recent Technol. Eng. 2019, 8, 2387–2391. [Google Scholar]
- Sharma, S.; Nanda, M.; Goel, R.; Jain, A.; Bhushan, M.; Kumar, A. Smart cities using internet of things: Recent trends and techniques. Int. J. Innov. Technol. Explor. Eng. 2019, 8, 24–28. [Google Scholar]
- Freudendal-Pedersen, M.; Kesselring, S.; Servou, E. What is smart for the future city? Mobilities and automation. Sustainability 2019, 11, 221. [Google Scholar] [CrossRef] [Green Version]
- Sandoval, R.M.; Garcia-Sanchez, A.-J.; Garcia-Haro, J. Performance optimization of LoRa nodes for the future smart city/industry. EURASIP J. Wirel. Commun. Netw. 2019, 2019, 200. [Google Scholar] [CrossRef]
- Andrade, R.O.; Yoo, S.G. A comprehensive study of the use of LoRa in the development of smart cities. Appl. Sci. 2019, 22, 4753. [Google Scholar] [CrossRef] [Green Version]
- Jin, Y.; Yan, D.; Zhang, X.; Han, M.; Kang, X.; An, J.; Sun, H. District household electricity consumption pattern analysis based on auto-encoder algorithm. IOP Conf. Ser. Mater. Sci. Eng. 2019, 609, 072028. [Google Scholar] [CrossRef]
- Zhou, S.; Zou, F.; Wu, Z.; Gu, W.; Hong, Q.; Booth, C. A smart community energy management scheme considering user dominated demand side response and P2P trading. Int. J. Electr. Power Energy Syst. 2020, 114, 105378. [Google Scholar] [CrossRef]
- Ahmadian, E.; Byrd, H.; Sodagar, B.; Matthewman, S.; Kenney, C.; Mills, G. Energy and the form of cities: The counterintuitive impact of disruptive technologies. Archit. Sci. Rev. 2019, 62, 145–151. [Google Scholar] [CrossRef] [Green Version]
- Wang, S.J.; Moriarty, P. Energy savings from Smart Cities: A critical analysis. Energy Procedia 2019, 158, 3271–3276. [Google Scholar] [CrossRef]
- Costa, D.G.; Vasques, F.; Portugal, P.; Aguiar, A. A distributed multi-tier emergency alerting system exploiting sensors-based event detection to support smart city applications. Sensors 2020, 20, 170. [Google Scholar] [CrossRef] [Green Version]
- Ilyas, N.; Shahzad, A.; Kim, K. Convolutional-neural network-based image crowd counting: Review, categorization, analysis, and performance evaluation. Sensors 2020, 20, 43. [Google Scholar] [CrossRef] [PubMed] [Green Version]
- Hynes, M. Investigating Automobility and Its Implications for Local Urban Transport Policy Design. Urban Sci. 2017, 1, 14. [Google Scholar] [CrossRef] [Green Version]
- Barthlemy, J.; Verstaevel, N.; Forehead, H.; Perez, P. Edge-computing video analytics for real-time traffic monitoring in a smart city. Sensors 2019, 19, 2048. [Google Scholar] [CrossRef] [Green Version]
- Chong, X.J. Design and implementation of a self-powered smart water meter. Sensors 2019, 19, 4177. [Google Scholar] [CrossRef] [Green Version]
- Mingaleeva, R.D.; Zajcev, V.S.; Bessel, V.V. Assessment of the technical potential of wind and solar energy in Russia. Territ. Neftegaz 2014, 3, 84–92. [Google Scholar]
- Kuznetsov, P.N.; Lyamina, N.V.; Yuferev, L.Y. A device for remote monitoring of solar power plant parameters. Appl. Sol. Energy 2019, 55, 247–251. [Google Scholar] [CrossRef]
- Cheboxarov, V.V.; Kuznetsov, P.N. Ways to solve the problem of instability in energy production of renewable energy plants. Sci. Diary 2019, 4, 60–66. [Google Scholar]
- Kuznetsov, P.N.; Cheboxarov, V.V.; Yakimovich, B.A. Hybrid wind-solar power plants. Bull. IzhSTU Named MT Kalashnikov 2020, 1, 116–123. [Google Scholar] [CrossRef]
- Kuznetsov, P.N.; Kuvshinov, V.V.; Issa, H.A.; Mohammed, H.J.; Al Barmani, A.G. Investigation of the losses of photovoltaic solar systems during operation under partial shading. J. Appl. Eng. Sci. 2020, 18, 313–320. [Google Scholar] [CrossRef]
- Nazarov, B.I.; Saliev, M.A.; Mahmudov, A.N.; Abdullaev, S.F. The effect of aerosol pollution on the operation of solar receivers. Rep. Acad. Sci. Repub. Tajikistan Dushanbe Presidium Acad. Sci. Repub. 2016, 49, 206–213. [Google Scholar]
- Savenko, A.E.; Osmanov, E.S. Calculation of realized capacity and power generation by a single-standing wind turbine. Bull. Kazan State Energy Univ. 2019, 1, 68–78. [Google Scholar]
- Huld, T. PVMAPS: Software tools and data for the estimation of solar radiation and photovoltaic module performance over large geographical areas. Sol. Energy 2017, 142, 171–181. [Google Scholar] [CrossRef]
- Tsai, H.L.; Tu, C.S.; Su, Y.J. Development of generalized photovoltaic model using MATLAB/SIMULINK. In Proceedings of the World Congress on Engineering and Computer Science, San Francisco, CA, USA, 22–24 October 2008; pp. 1–6. [Google Scholar]
- Ebrahimpour, M.; Shafaghat, R.; Alamian, R.; Safdari Shadloo, M. Numerical investigation of the savonius vertical axis wind turbine and evaluation of the effect of the overlap parameter in both horizontal and vertical directions on its performance. Symmetry 2019, 11, 821. [Google Scholar] [CrossRef] [Green Version]
- Kothe, L.B.; Möller, S.V.; Petry, A.P. Numerical and experimental study of a helical Savonius wind turbine and a comparison with a two-stage Savonius turbine. Renew. Energy 2020, 148, 627–638. [Google Scholar] [CrossRef]
- Sahim, K.; Santoso, D.; Puspitasari, D. Investigations on the effect of radius rotor in combined Darrieus-Savonius wind turbine. Int. J. Rotating Mach. 2018, 2018, 3568542. [Google Scholar] [CrossRef] [Green Version]
- Mandel, J. The Statistical Analysis of Experimental Data; Courier Corporation: New York, NY, USA, 2012. [Google Scholar]
- Rabinovich, S.G. Measurement Errors and Uncertainties: Theory and Practice; Springer Science & Business Media: Berlin/Heidelberg, Germany, 2006. [Google Scholar]
- Inoue, A.; Takahashi, R.; Murata, T.; Tamura, J.; Kimura, M.; Futami, M.O.; Ide, K. A calculation method of the total efficiency of wind generators. Electr. Eng. Jpn. 2006, 157, 52–62. [Google Scholar] [CrossRef]


Publisher’s Note: MDPI stays neutral with regard to jurisdictional claims in published maps and institutional affiliations. |
© 2021 by the authors. Licensee MDPI, Basel, Switzerland. This article is an open access article distributed under the terms and conditions of the Creative Commons Attribution (CC BY) license (https://creativecommons.org/licenses/by/4.0/).