Abstract
Cooling in liquid nitrogen is a typical service condition of high-temperature superconducting wire, and the variation of boiling stages on the wire protective layers such as the brass layers could be crucial for the quench behavior of superconducting devices. In this study, the influence of brass surface morphology (parameters of surface roughness and fractal dimension) on the Leidenfrost effect (including the wall superheat at critical heat flux and the wall superheat at Leidenfrost point, which are respectively characterized by the temperatures of and ) was studied. The surfaces of brass samples were polished by sandpaper to obtain different morphologies, which were characterized by using white light interferometer images, and the boiling curves were recorded and analyzed by Matlab with lumped parameter method. The experimental results demonstrated that the surface morphology of brass samples could influence the significantly, but had no clear relationship with the . Moreover, the multi-scaled analysis was carried out to explore the influencing mechanism of surface microstructure, the relationship between and scale was more clear when the scale was small, and the fractal dimension was calculated and discussed together with surface roughness. The findings of this study could be instructive for surface treatment of superconducting wires to suppress quench propagation.
1. Introduction
The boiling phenomenon is a natural phenomenon that has attracted lots of attention [1,2,3,4] and could be applied in the quenching process optimization, superconducting equipment design, chemical reaction regulation, nuclear reactor heat exchanger improvement and so on. Boiling curves are usually used to measure the boiling phenomenon at the liquid–solid interface including four regimes [5,6], i.e., single-phase, nucleate boiling, transition boiling and film boiling. Film boiling is also known as the Leidenfrost effect [7,8], which refers to the phenomenon that the liquid cannot moisten a hot surface but forms a vapor layer on top of it, whose main indexes, including the wall superheat at critical heat flux () and the wall superheat at Leidenfrost point (), can be obtained based on the boiling curve [9].
The morphology of solid surface plays an important role in the Leidenfrost effect [10,11,12], and roughness is one of the commonly used parameters to characterize the surface morphology. It seems that roughness is not important under the film boiling status, because the gas film separates the liquid and solid surface. However, during the transitions between nucleate boiling regime, transition boiling regime and film boiling regime, the contact between liquid and solid surface is crucial for the boiling parameters such as and ). Such a contact is highly related to surface morphology, which is commonly quantified by roughness. Therefore, there were many studies about the influence of surface roughness on Leidenfrost effect [13,14,15,16,17,18]. In most previous studies [13,14,15,16,17], it was reported that increased along with the increase in surface roughness. However, there were also some studies reporting other trends [18]. The issue might be due to the multi-scaled behavior of surface roughness, which actually varied significantly if the concerned spatial scale (L) was different. The multi-scaled characteristics of roughness could be associated with the fractal nature of surfaces, whose complexity could be quantified by using fractal dimension (D). The studies of fractal analysis on various surfaces and D calculation algorithm have been carried out in many fields [19,20,21,22]. In our previous studies [23], an algorithm named roughness scaling extraction (RSE) was proposed, and the RSE algorithm has been verified as capable of obtaining the multi-scaled data of surfaces roughness and quantifying feature complexity by calculating the values [24], which has been used in the field of thin films, seizure detection and chatter recognition. By using the RSE algorithm, the multi-scaled analysis on brass surface might reveal more information about its influence on the Leidenfrost effect.
An important scenario of the Leidenfrost effect is the cooling in liquid nitrogen (77 K) because this is a typical cryogenic method of the second generation high-temperature superconducting (HTS) wires, also known as HTS coated conductors, which possess the characteristics of zero DC resistance, high current transmission, excellent in-field performance, etc. [25,26,27]. However, there might be local thermal interference or mechanical interference in HTS wires that may lead to wire damage in serious cases (quench propagation) [28,29,30], which refers to the fact that in the normal flow process of HTS, these interferences could change from a superconducting state to a normal state and generate a lot of joule heat. If the liquid nitrogen cannot take away the heat in time, the temperature of the area near the interferences rises, which could result in a new loss of superconductor, and finally the overall loss of superconductor. Therefore, the boiling phenomenon should be concerned with the interface of liquid nitrogen and wire surface because the film boiling might occur when the temperature of wire surface is higher than . Under such an occasion, the wire is easy to burn and damage, thus violating the whole HTS device. Therefore, it is necessary to study the influence of surface morphology of the HTS wires on the Leidenfrost effect during liquid nitrogen cooling.
In this study, the influence of brass surface morphology (parameters of surface roughness and fractal dimension) on the Leidenfrost effect ( and ) was studied. The samples of brass, which is a typical material of the protective layer of HTS wires that is in direct contact with the liquid nitrogen [31,32], were characterized by using white light interferometer images with surfaces, and the boiling curves were recorded and analyzed. Various surface morphologies were obtained and characterized to study the influence of brass surface morphology on the Leidenfrost effect, which could be instructive to consider the heat transfer performance of HTS wires. The RSE algorithm was utilized to process the 3D morphology data of brass surfaces; thus, the multi-scaled and fractal analyses were carried out to obtain a further understanding of the related mechanism. Matlab software was used for all calculations in this study.
2. Experimental Details
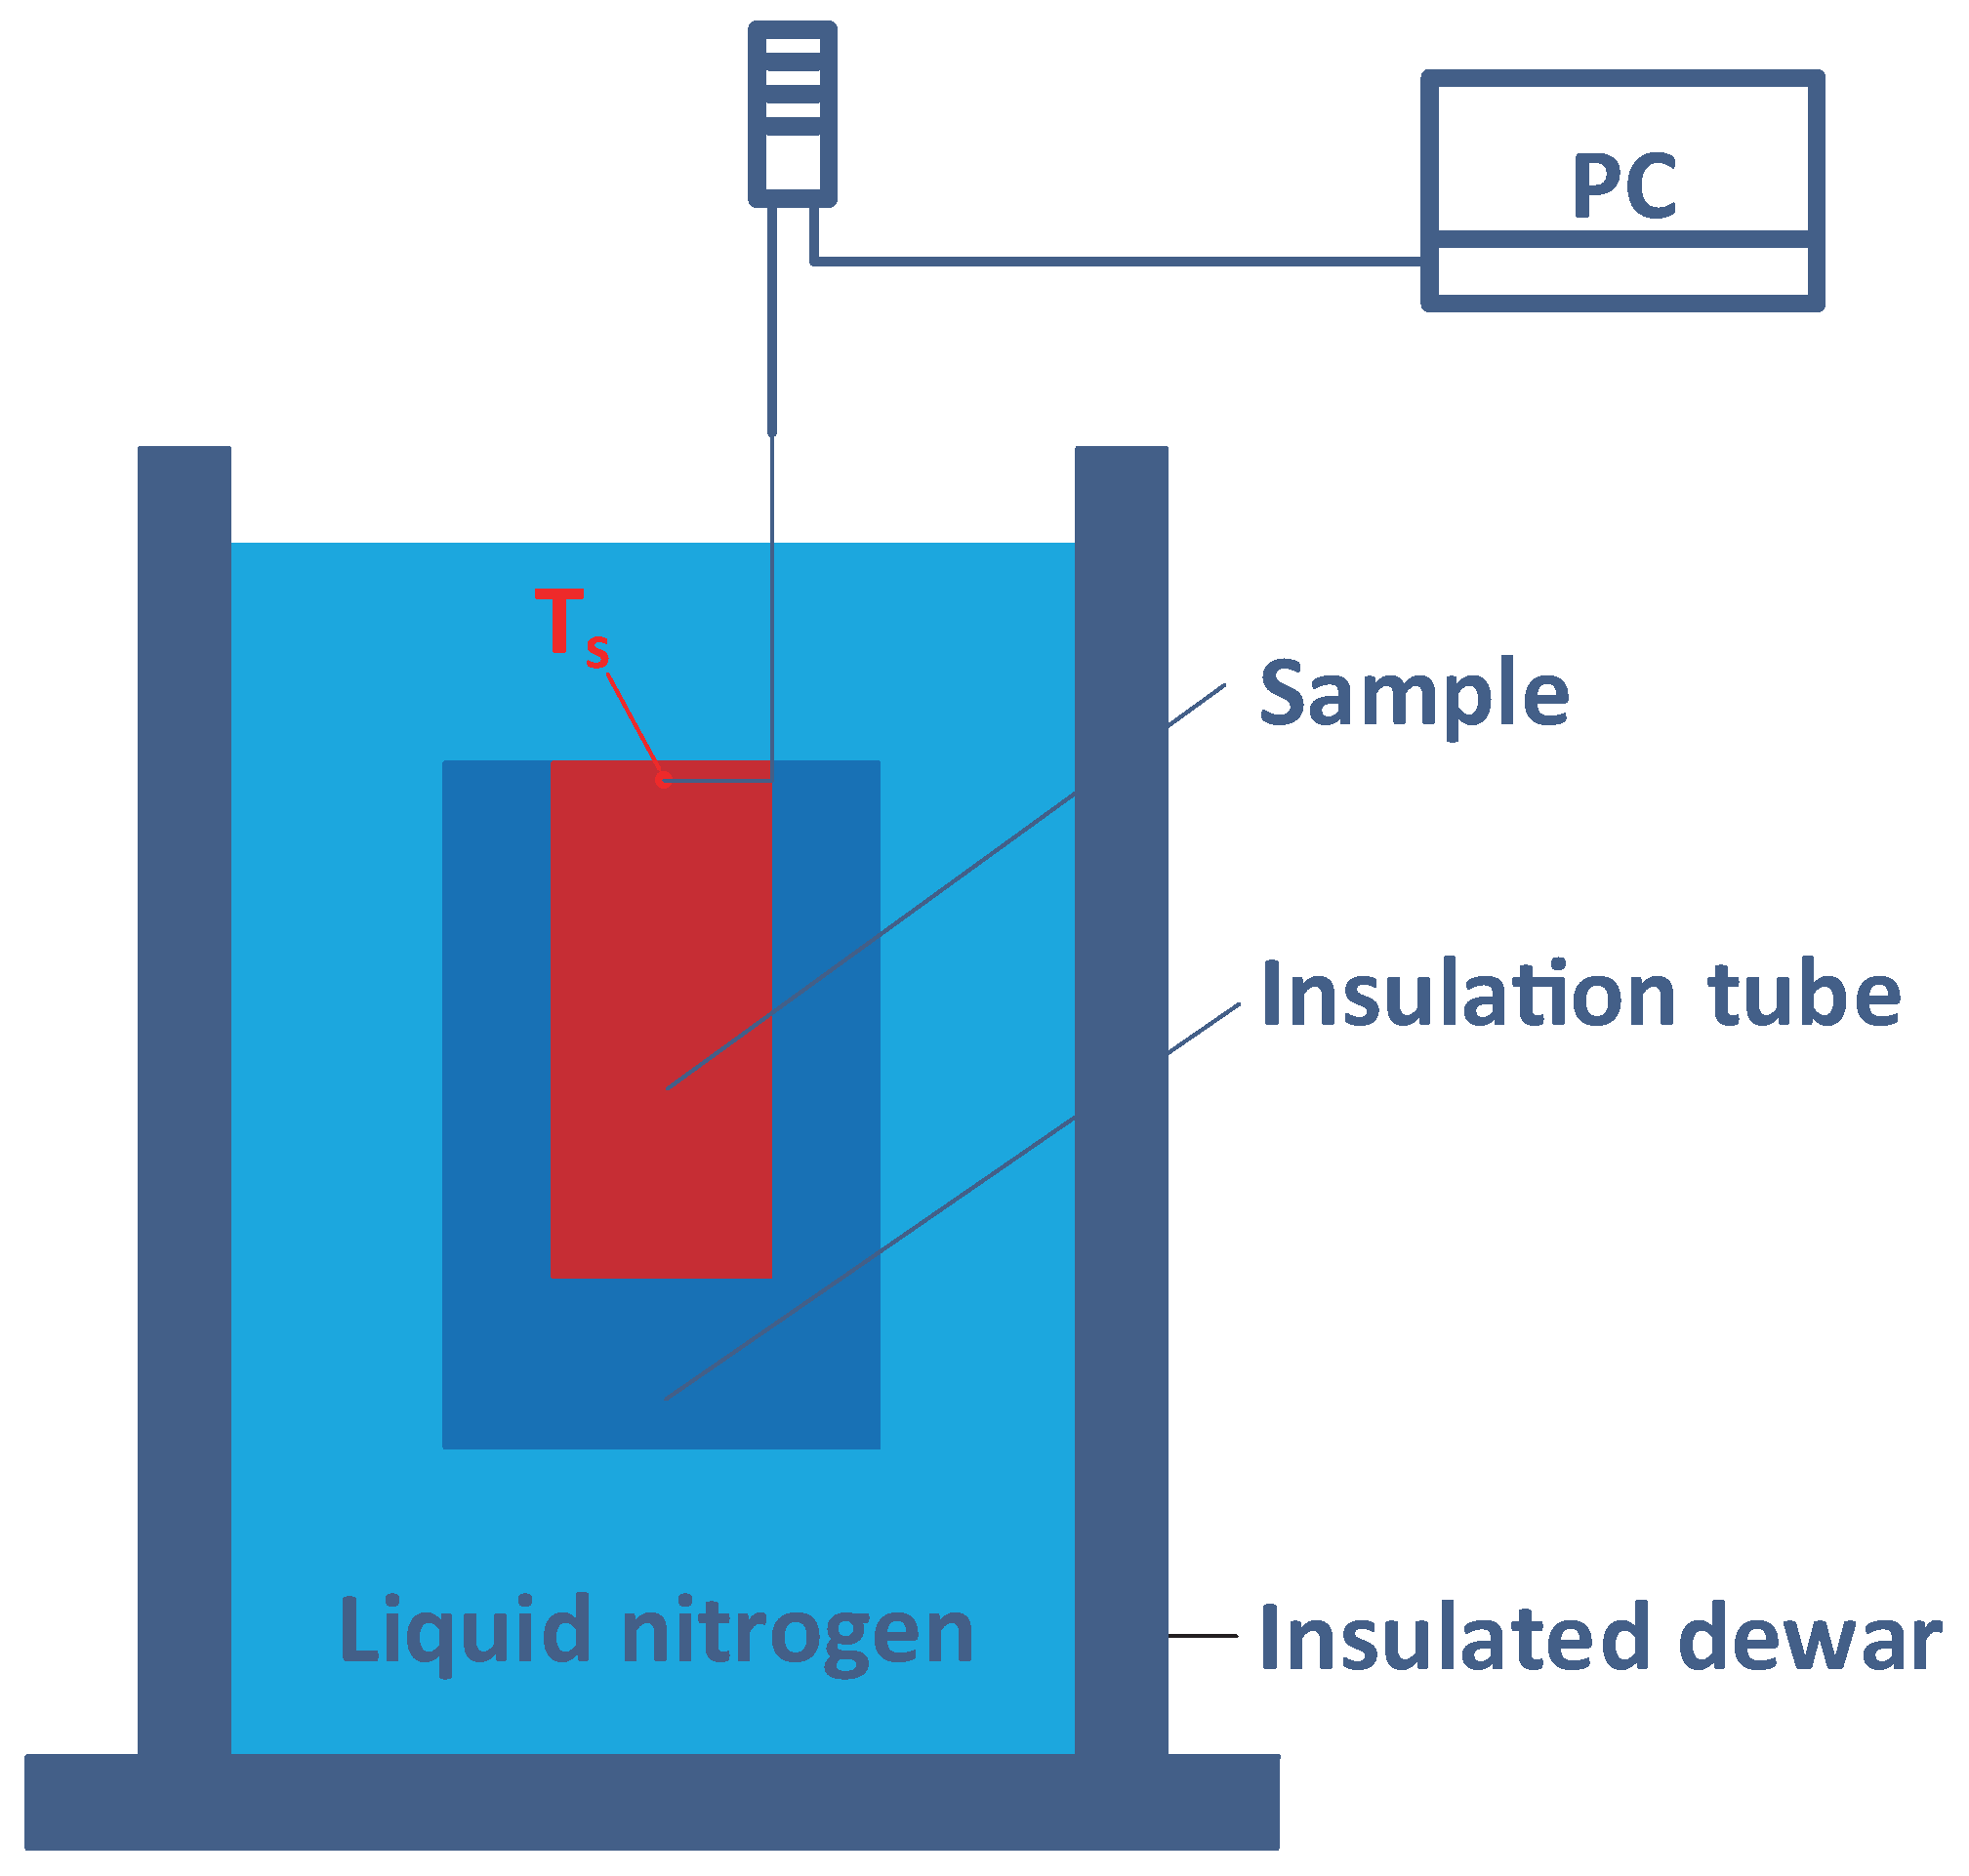
2.1. Apparatus and Samples
An experimental apparatus for exploring the boiling process was set up as shown in Figure 1. Liquid nitrogen needed to be added to the insulated dewar to create an environment at about 77 K before and during the experiment, and for maintaining the temperature and the amount of cooling liquid, the liquid nitrogen should be slowly poured into the dewar. The equilibrium temperature of liquid nitrogen and gaseous nitrogen under atmospheric pressure should be 77 K, and especially the temperature of liquid nitrogen should always be maintained at 77 K. The temperature of nitrogen may rise, but it does not influence this study. The diameter and height of the insulated dewar were 65 mm and 150 mm, respectively. The material of samples was H62 brass (thermal conductivity , specific heat at room temperature) with a density of 8.136 g/cm3, which was mainly composed of 62 wt.% copper and 38 wt.% zinc, and the initial temperature of the sample was room temperature about 298 K. The brass was machined into samples of cylinders with diameter of 10 mm and height of 20 mm, and their surfaces were polished by using different sandpapers. The samples were then packaged with thermal insulation tube (thermal conductivity ), and only the polished surface was exposed. The temperature sensor used in the experiment was a PT-100 low-temperature film resistor (Heraeus C220 Series, class B, ±0.3 K), which was inserted through a drilled hole with 2 mm diameter. The bottom of the drilled hole was 1 mm apart from the polished surface of brass samples. Under such a condition, the heat transfer could be assumed to be only in the axial direction, and the heat transfer in other directions could be ignored [33]. Each brass sample was tested 5 times, and the duration of a test was about 50 min, including the cooling process for about 10 min and the warming back to room temperature in air for about 40 min.
Figure 1.
Diagram of the experimental apparatus.
Different sandpapers were used to polish the sample surface in one direction, and the brass samples were denoted as A, B, C, D, E, F, G, H and I, corresponding to the sandpaper with grit density (abrasive quantity per square inch) of 180, 320, 400, 600, 800, 1000, 1200, 1500 and 2000, respectively. The surface morphologies were first observed by using scanning electron microscope (SEM, Phenom XL). Then, the sample surfaces were characterized with a line roughness tester (TR200) to measure (perpendicular to texture) and a white light interferometer (WLI, ZYGO Nexview) to obtain the surface height matrix to measure . The vertical and horizontal resolutions were 0.09 and 0.71 μm, respectively. The root square roughness can more accurately reflect the overall situation of roughness than other surface roughness parameters such as .
2.2. Calculation Methods
Based on the height matrix measured with WLI, roughness values at various L and D could be calculated. The calculation formula of was:
where Z represented the height of a measured position, i.e., an element of the matrix, and were the number of rows and column elements of the height matrix, respectively. The calculation method of the RSE algorithm to obtain -L data and D values could be found in our previous publications [23].
The relevant calculation equations of the RSE algorithm were:
The algorithm was carried out as follows. A morphological image of surfaces was segmented into sub-images. The sub-images were fitted by using the second-order planarization (), where indicated the pixel location in the matrix of image data, and z was the height of the pixel. The matrix of the as-fitted data was then subtracted from the matrix of the sub-image, and the matrix of the planarized sub-image could be obtained. The of each planarized sub-image was calculated, and the curves could be plotted by using the average of values under the same L. Finally, the fitting was applied on the curve to obtain the calculated dimension ().
As shown in Figure 2a, the cooling curve including temperature–time data could be obtained through the test. The lumped parameter method [8,34,35], as shown in Equation (4), was used to convert the cooling curve into a boiling curve including the relationship between surface superheat () and heat flux as shown in Figure 2b. In Equation (4), q, , A, c, m, T and t were defined as heat flux, heat, area, specific heat, mass, temperature and time, respectively. The locations of and could not be accurately pointed out in the cooling curve; thus, the converted boiling curves were used to calculate them. The characteristic of was that the slope of boiling curve changed from negative to positive, indicating the moment of status changing from transition boiling to film boiling.
Figure 2.
The typical (a) cooling curve and (b) boiling curve with and .
2.3. Uncertainty Analysis
The measurement uncertainty of specific heat, mass and area was , , , respectively. The temperature and time measured by the Pt-100 and PC had a measurement error of and , repectively.
The heat flux uncertainty measurement was calculated as follows:
where and A are the specific heat, mass and area of the sample, is the temperature difference between the sample and liquid nitrogen and represents the experiment time, and in this equation, the uncertainties of these parameters are evaluated assuming that these parameters can be regarded as independent. Therefore, the uncertainty of the heat flux was calculated as follows:
Thus, the heat flux error was calculated at about 5%, and every experiment was conducted five times to confirm the repeatability.
3. Results
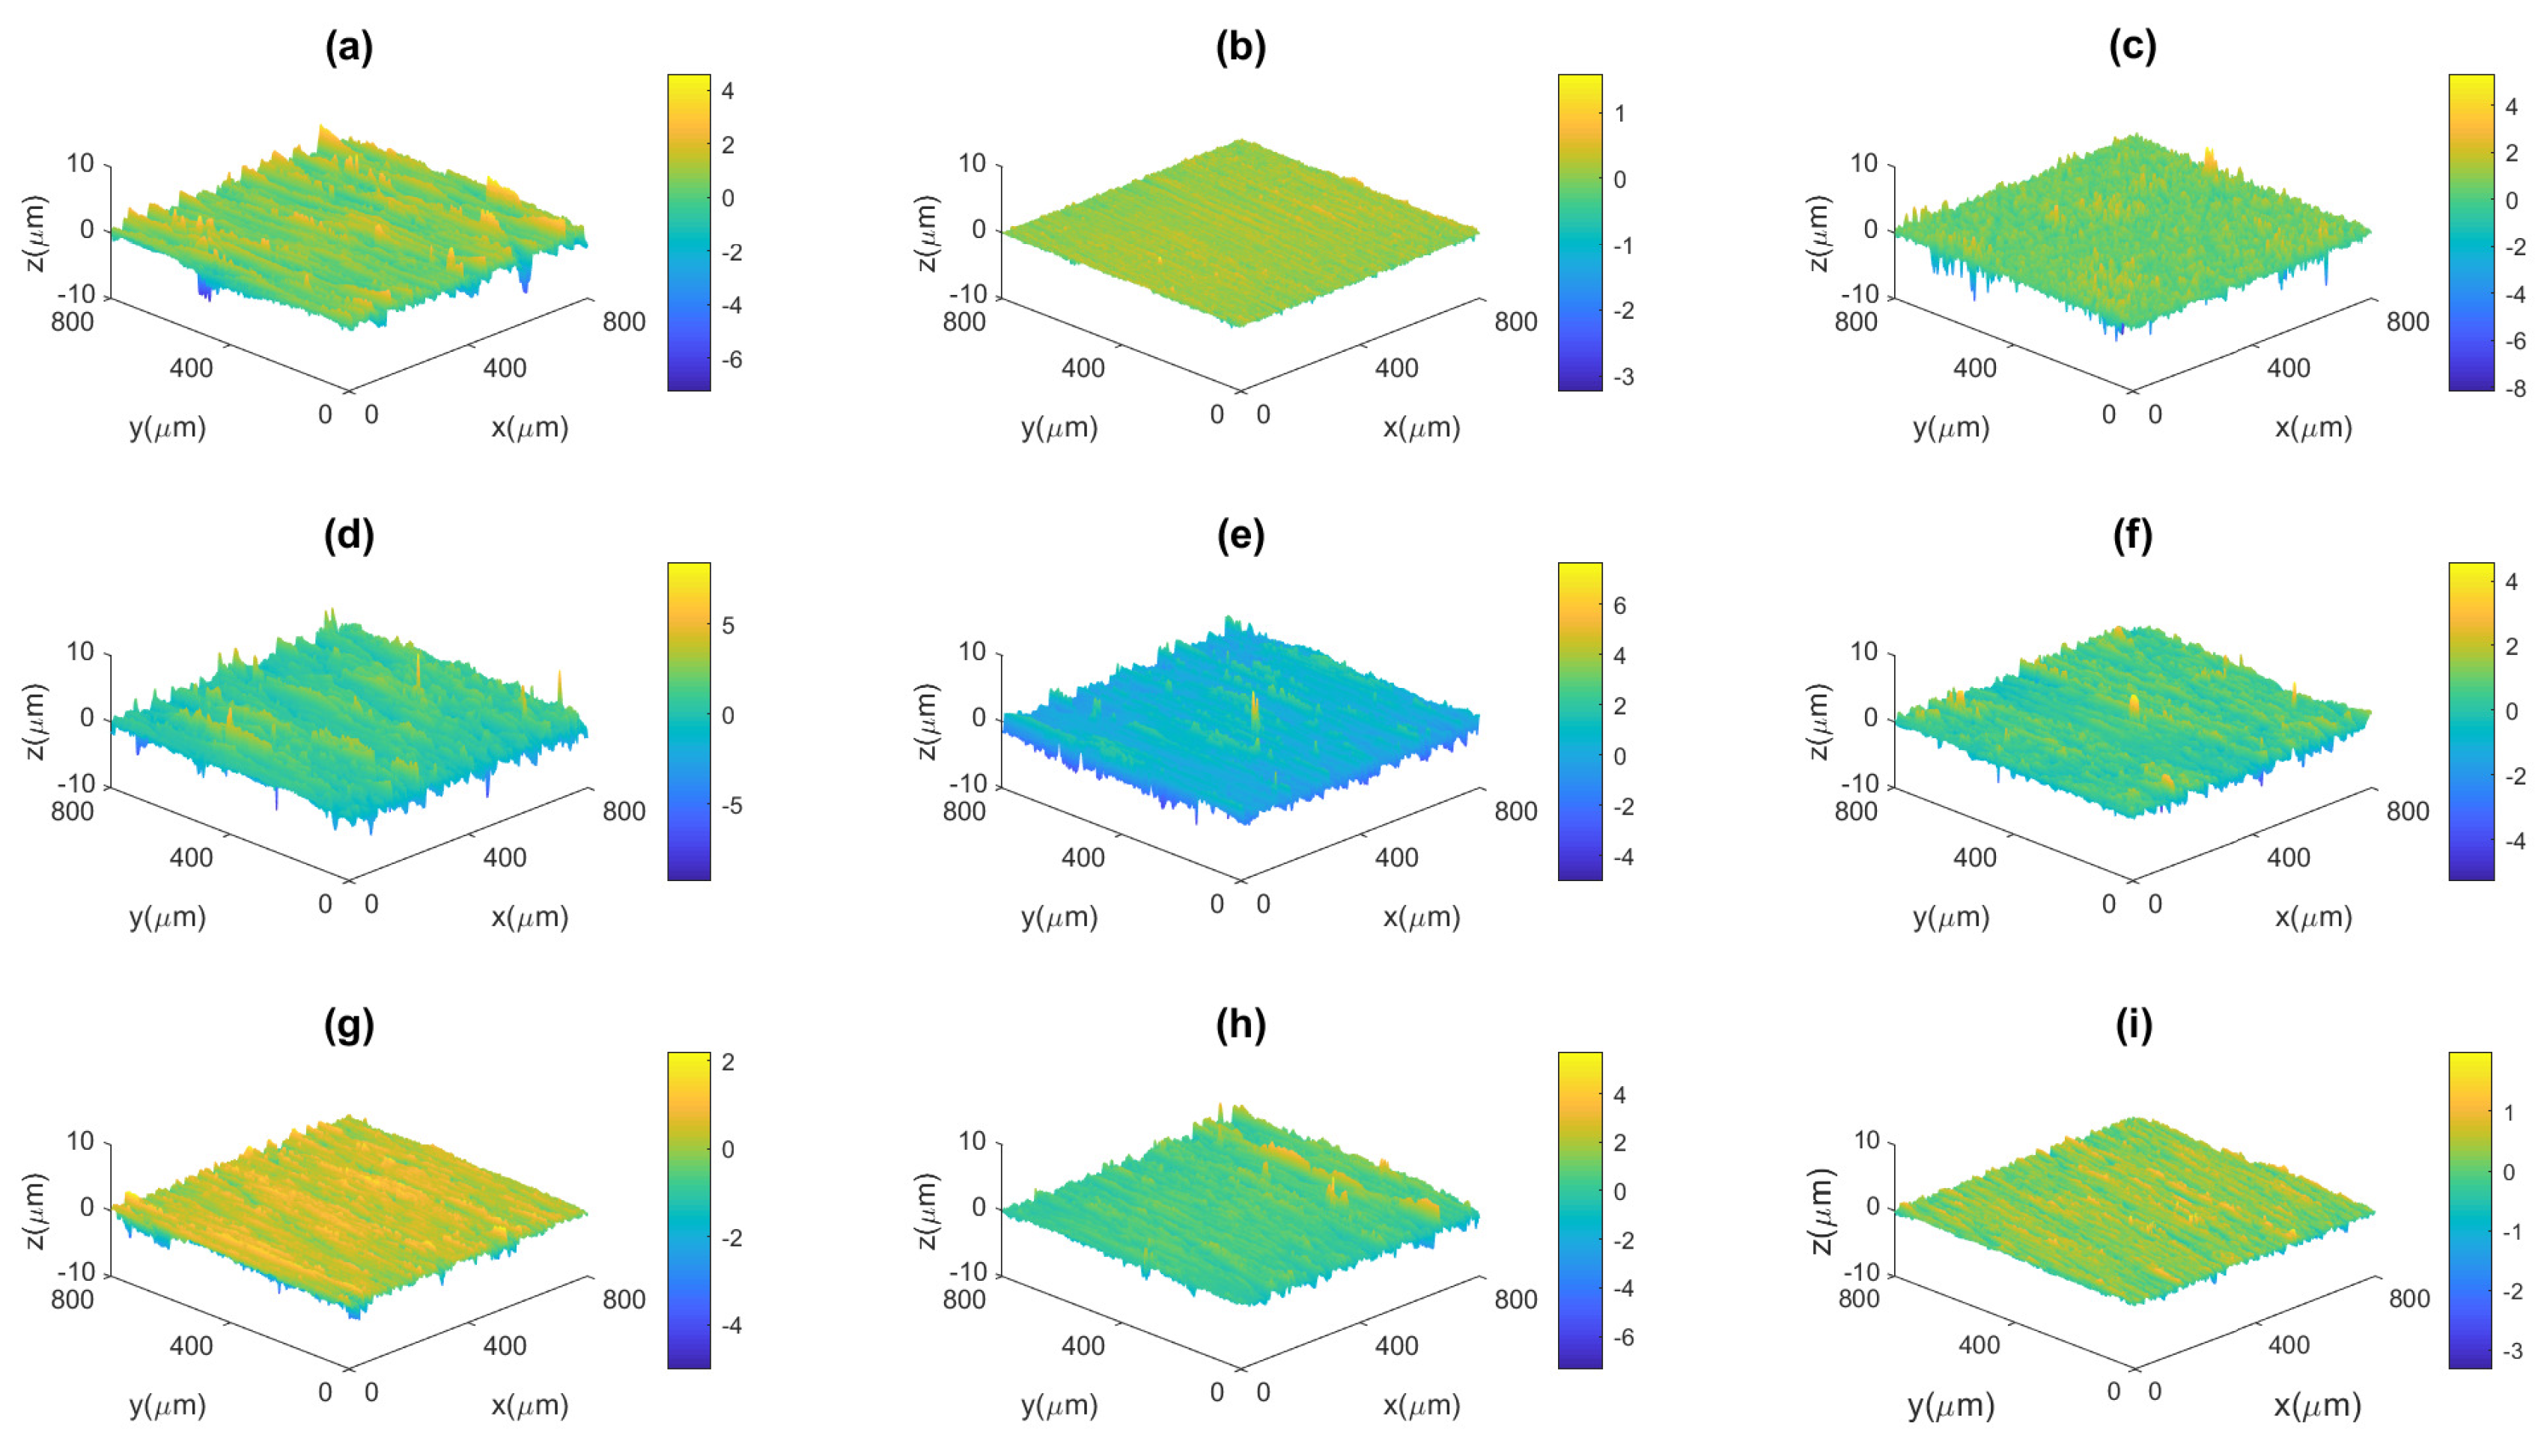
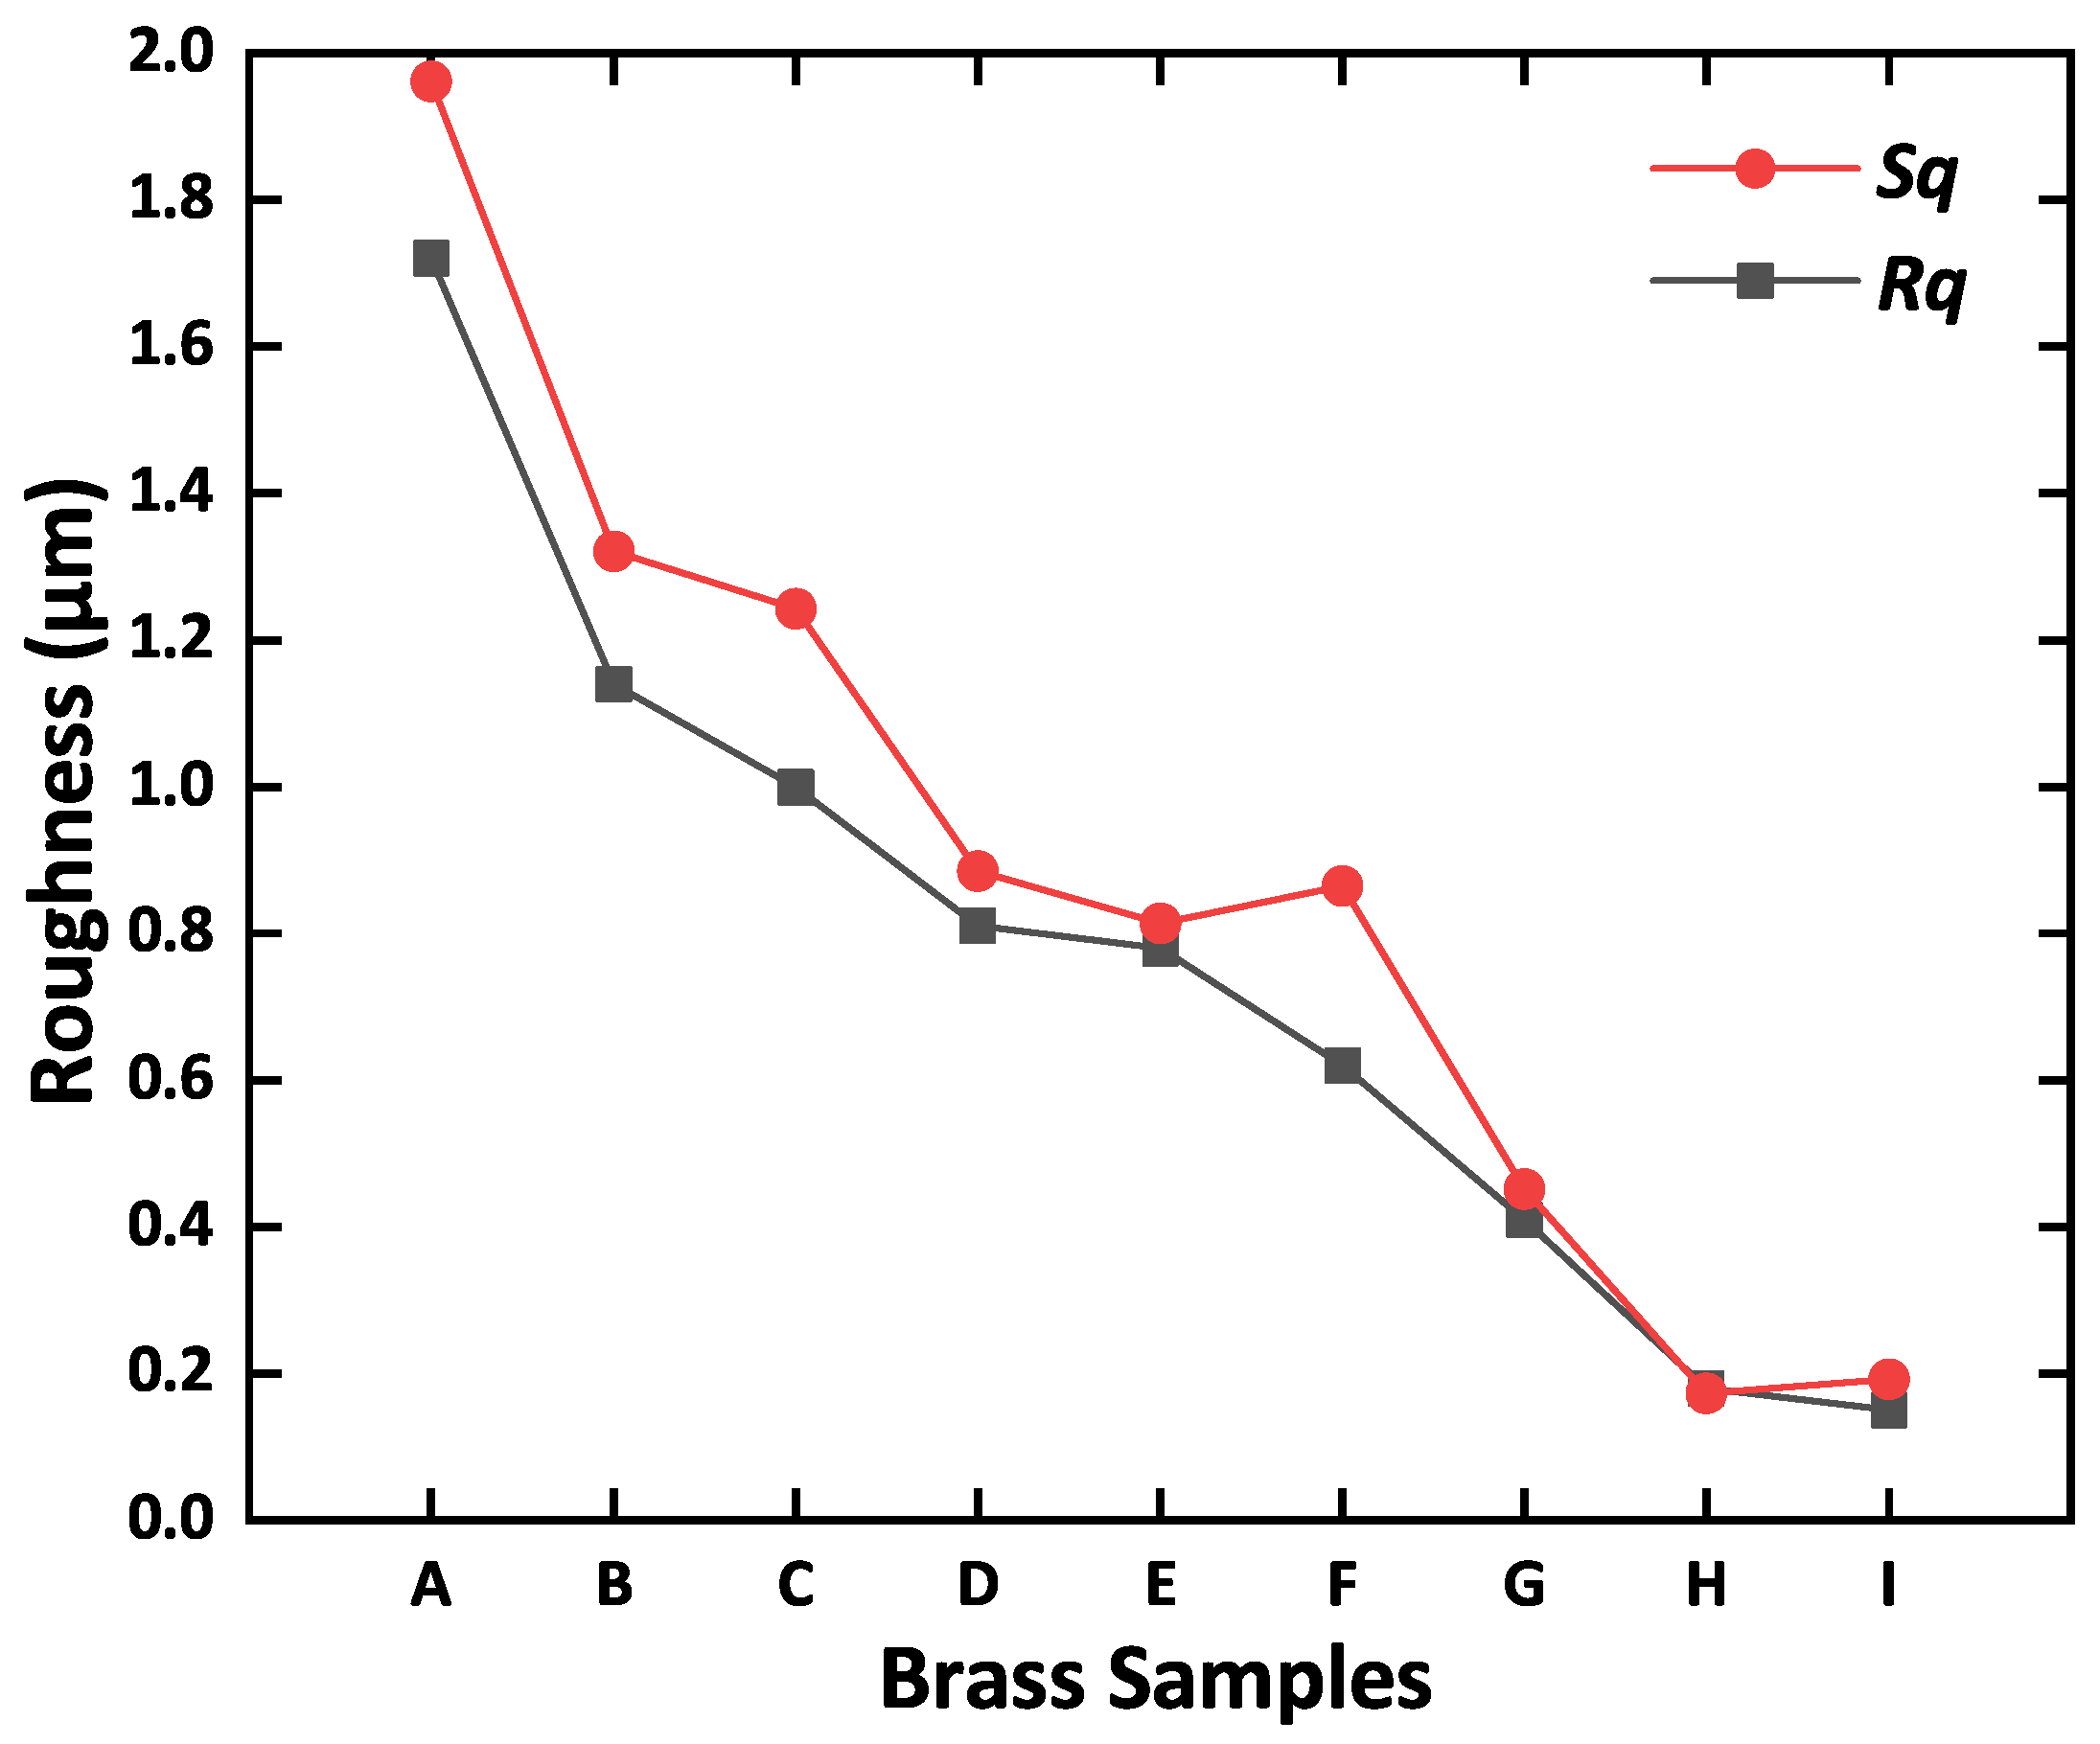
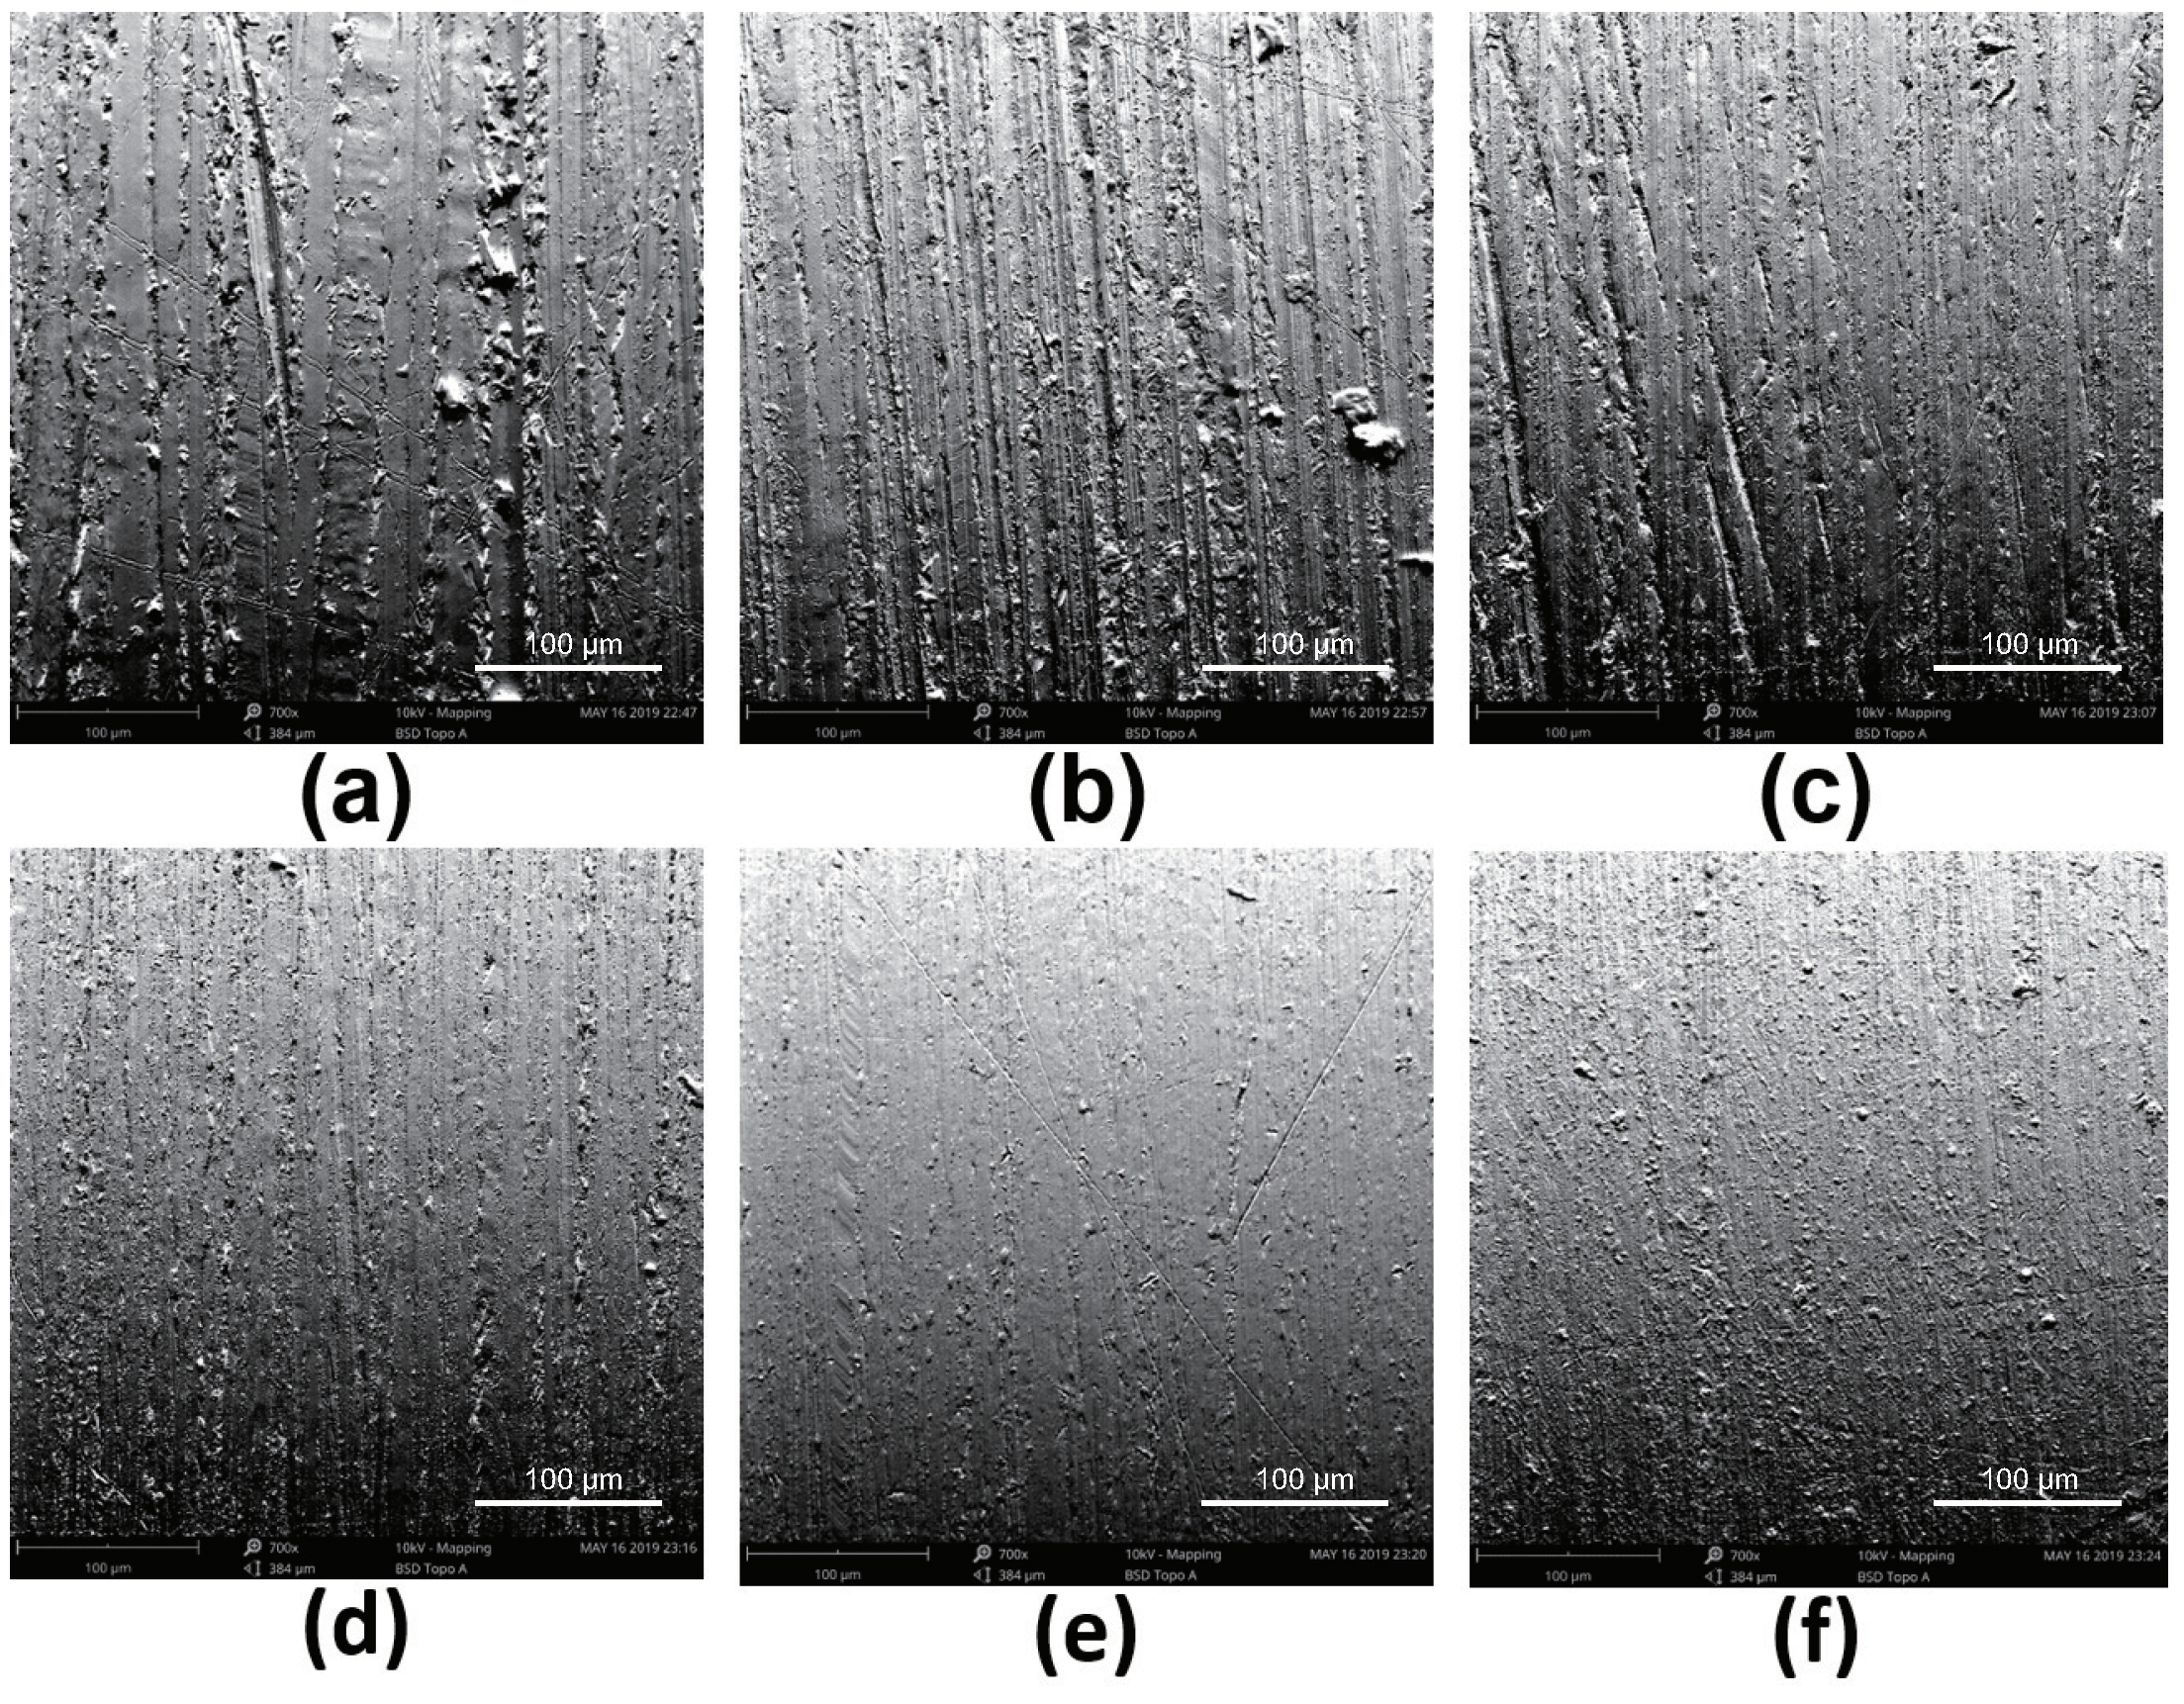
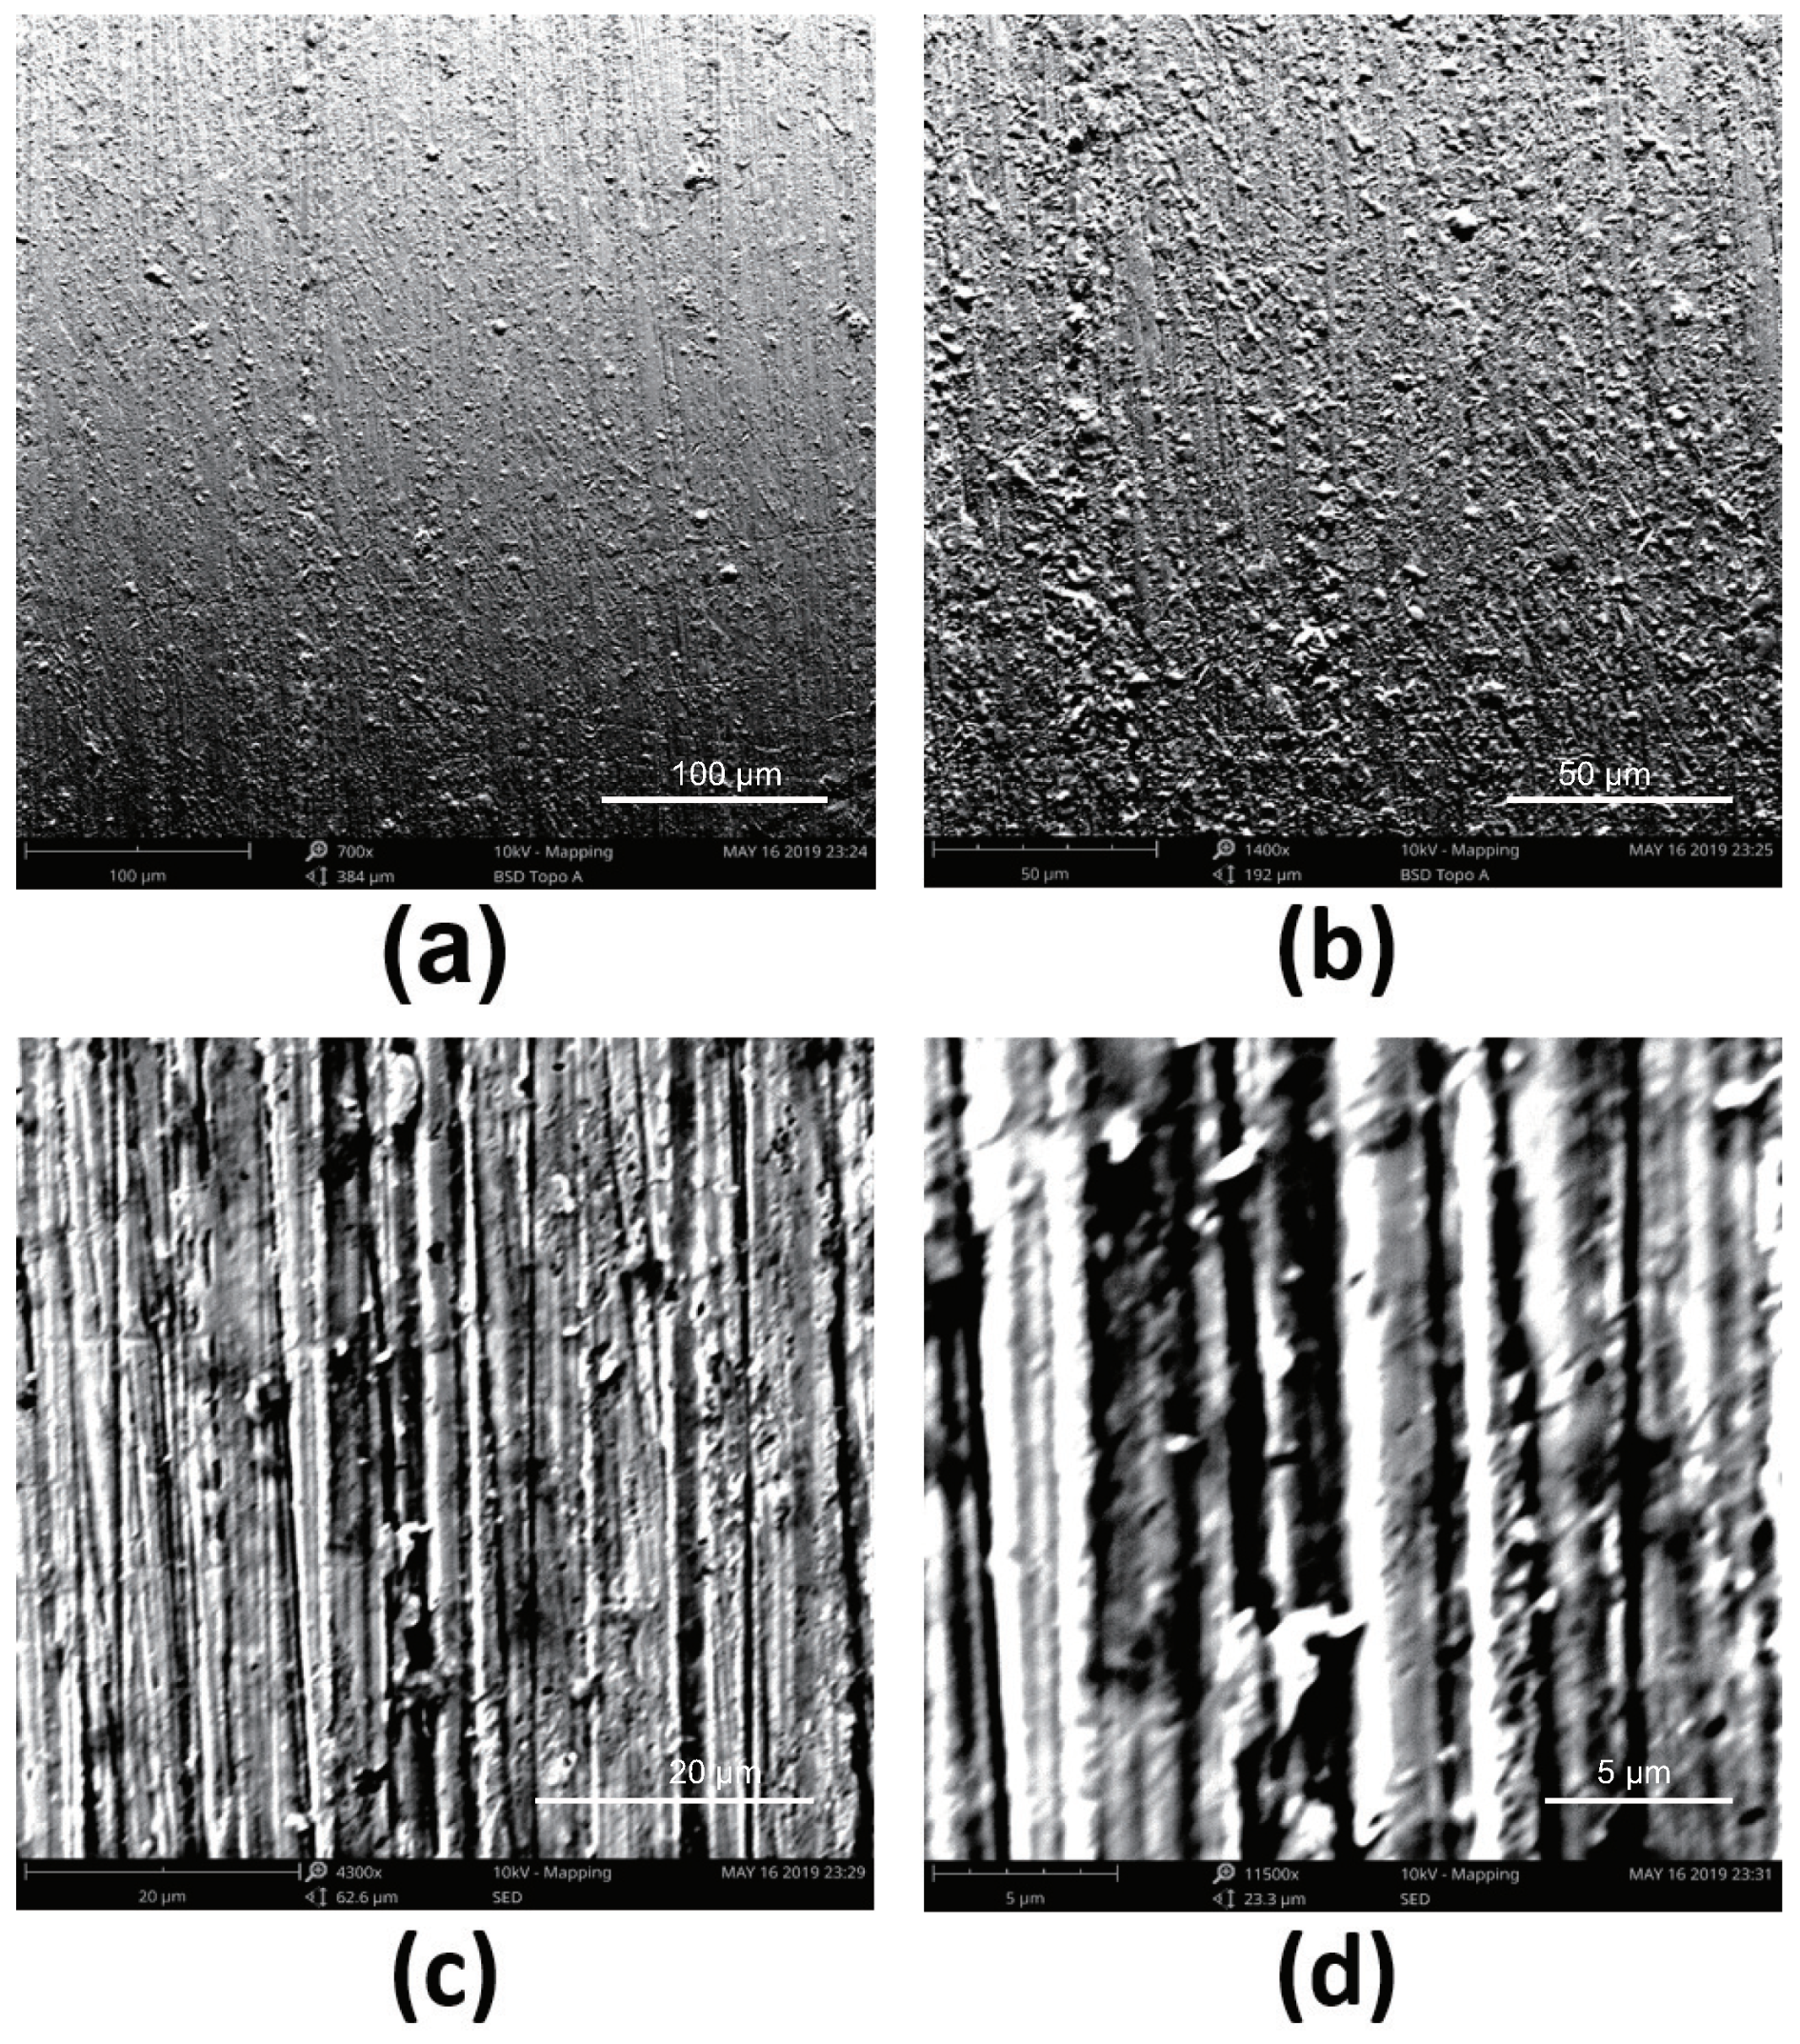
3.1. Surface Morphology
The 3D surface morphologies of brass samples measured by WLI are shown in Figure 3. The roughness values obtained by using both WLI () and roughness meter () are illustrated in Figure 4, where the measurement data have a favorable consistency. The surface roughness decreased with the increasing of grit density, which can also be observed in the height fluctuation along Z-direction of Figure 3.
Figure 3.
Surface morphologies of brass samples, the samples polished by using grit densities of 180, 320, 400, 600, 800, 1000, 1200, 1500 and 2000, were denoted from (a–i), respectively.
Figure 4.
Comparison of and roughness values of brass samples, which were obtained by using WLI and roughness meter, respectively.
The SEM images brass surface morphologies at a magnification of 700× are shown in Figure 5. The main microstructure of the sample surfaces was the grooves caused by sandpaper polishing, and the surface became more smooth when the grit density was enlarged.
Figure 5.
SEM images of brass samples surface at 700×. The sub-figures from (a–f) correspond to the grit densities of 180, 400, 800, 1200, 1500 and 2000, respectively.
3.2. Leidenfrost Indexes
To explore the influence of brass surface morphology on the Leidenfrost effect in liquid nitrogen cooling process, the indexes and of the Leidenfrost effect were associated to the two parameters and of surface morphology. First, the and values calculated by using the WLI data shown in Figure 3 are illustrated in Figure 6a, which imply that there was a strong correlation between and . monotonically decreased from 2.664 to 2.287 when increased from 0.192 m to 1.961 m, and such a trend was consistent with previous studies on fractal analysis of various surfaces.
Figure 6.
The relationships of: (a) -, (b) -, (c) -.
could vary from 94.1 K to 104.3 K, but there was no clear relationship of - or -, indicating that brass surfaces morphology could not directly influence within the experimental scope of this study.
The relationships of - and - were shown in Figure 6b,c, respectively. generally increased within a range from 102.74 K to 107.58 K along with the increasing within the range from 0.192 m to approximate 1 m, but there was a significant fluctuation of . It could also be noticed that when was larger than 1 m, its further increasing could cause a slight decreasing of .
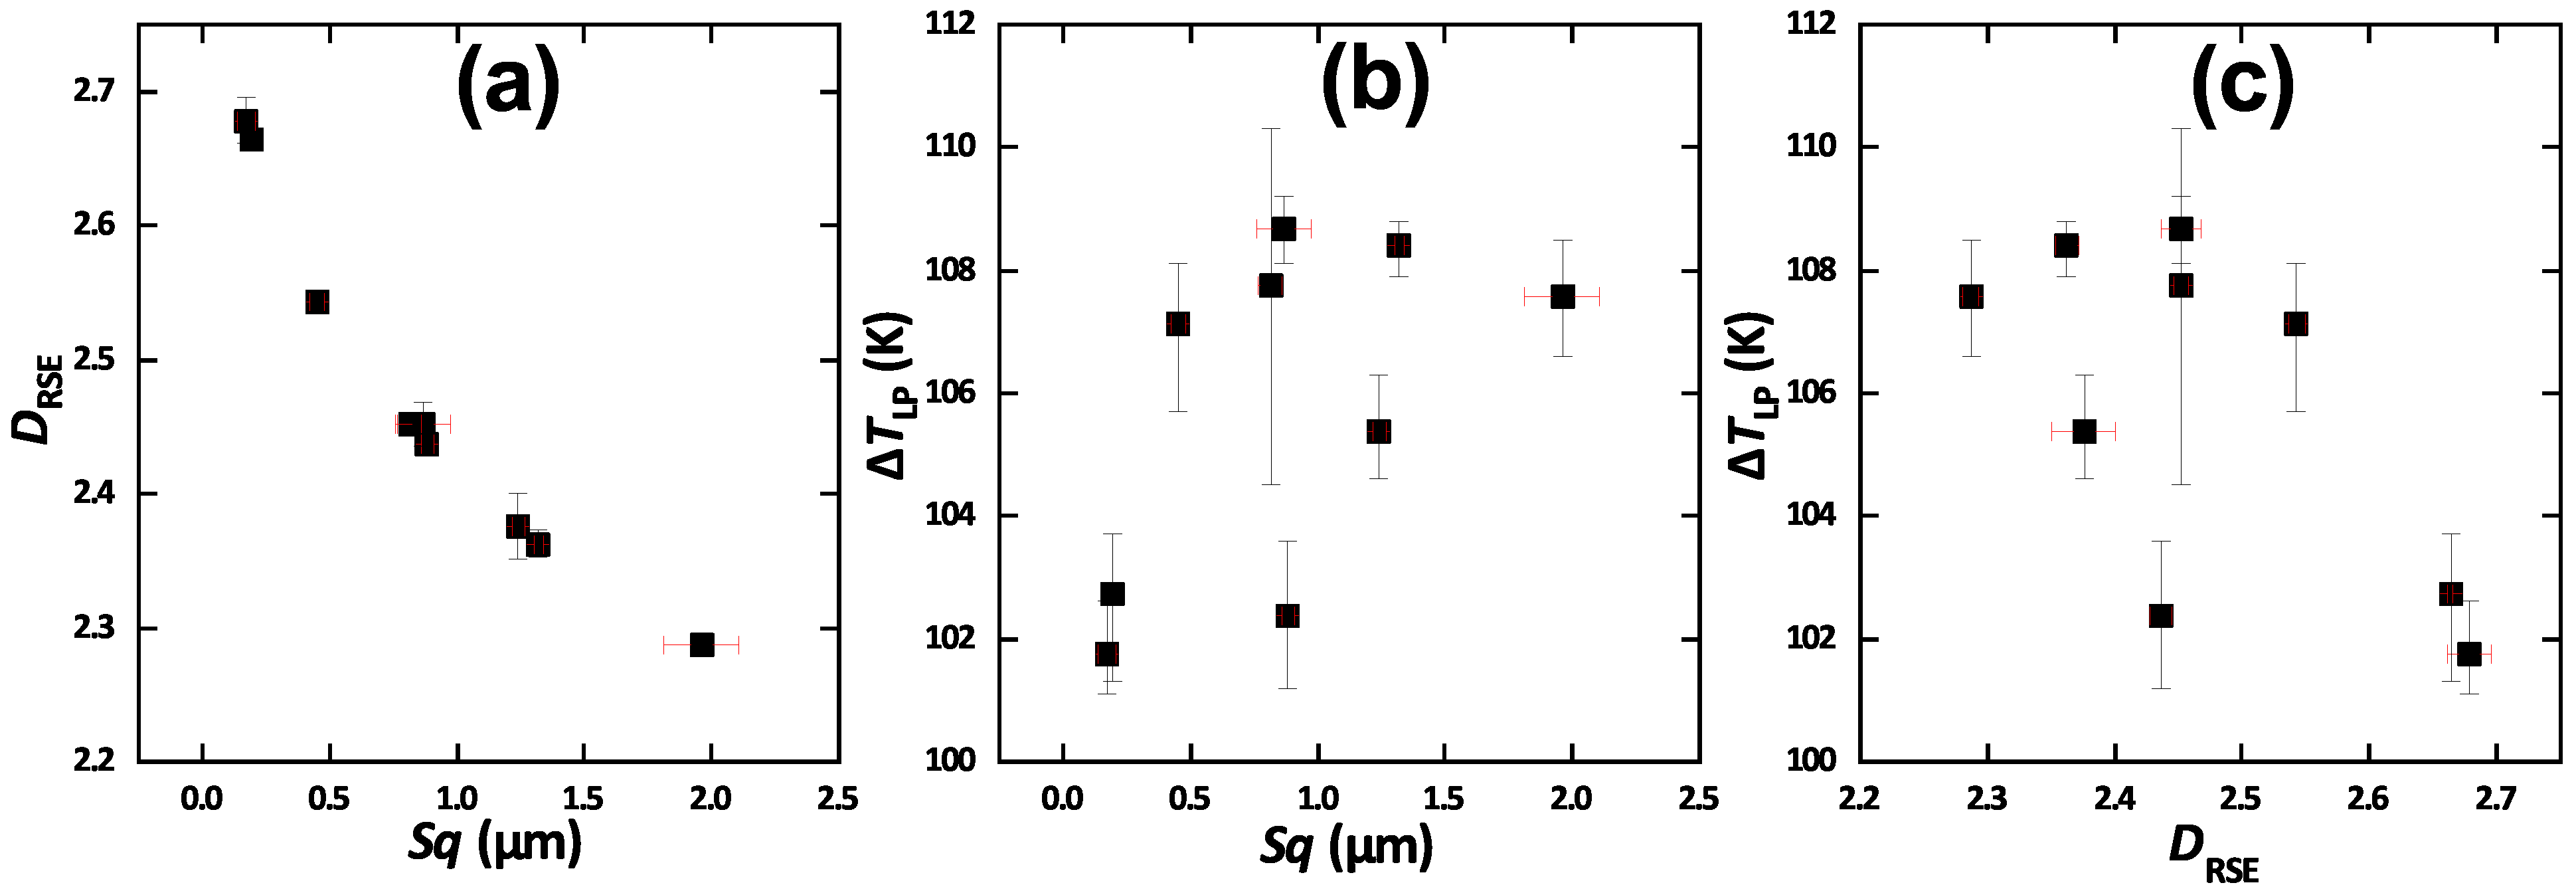
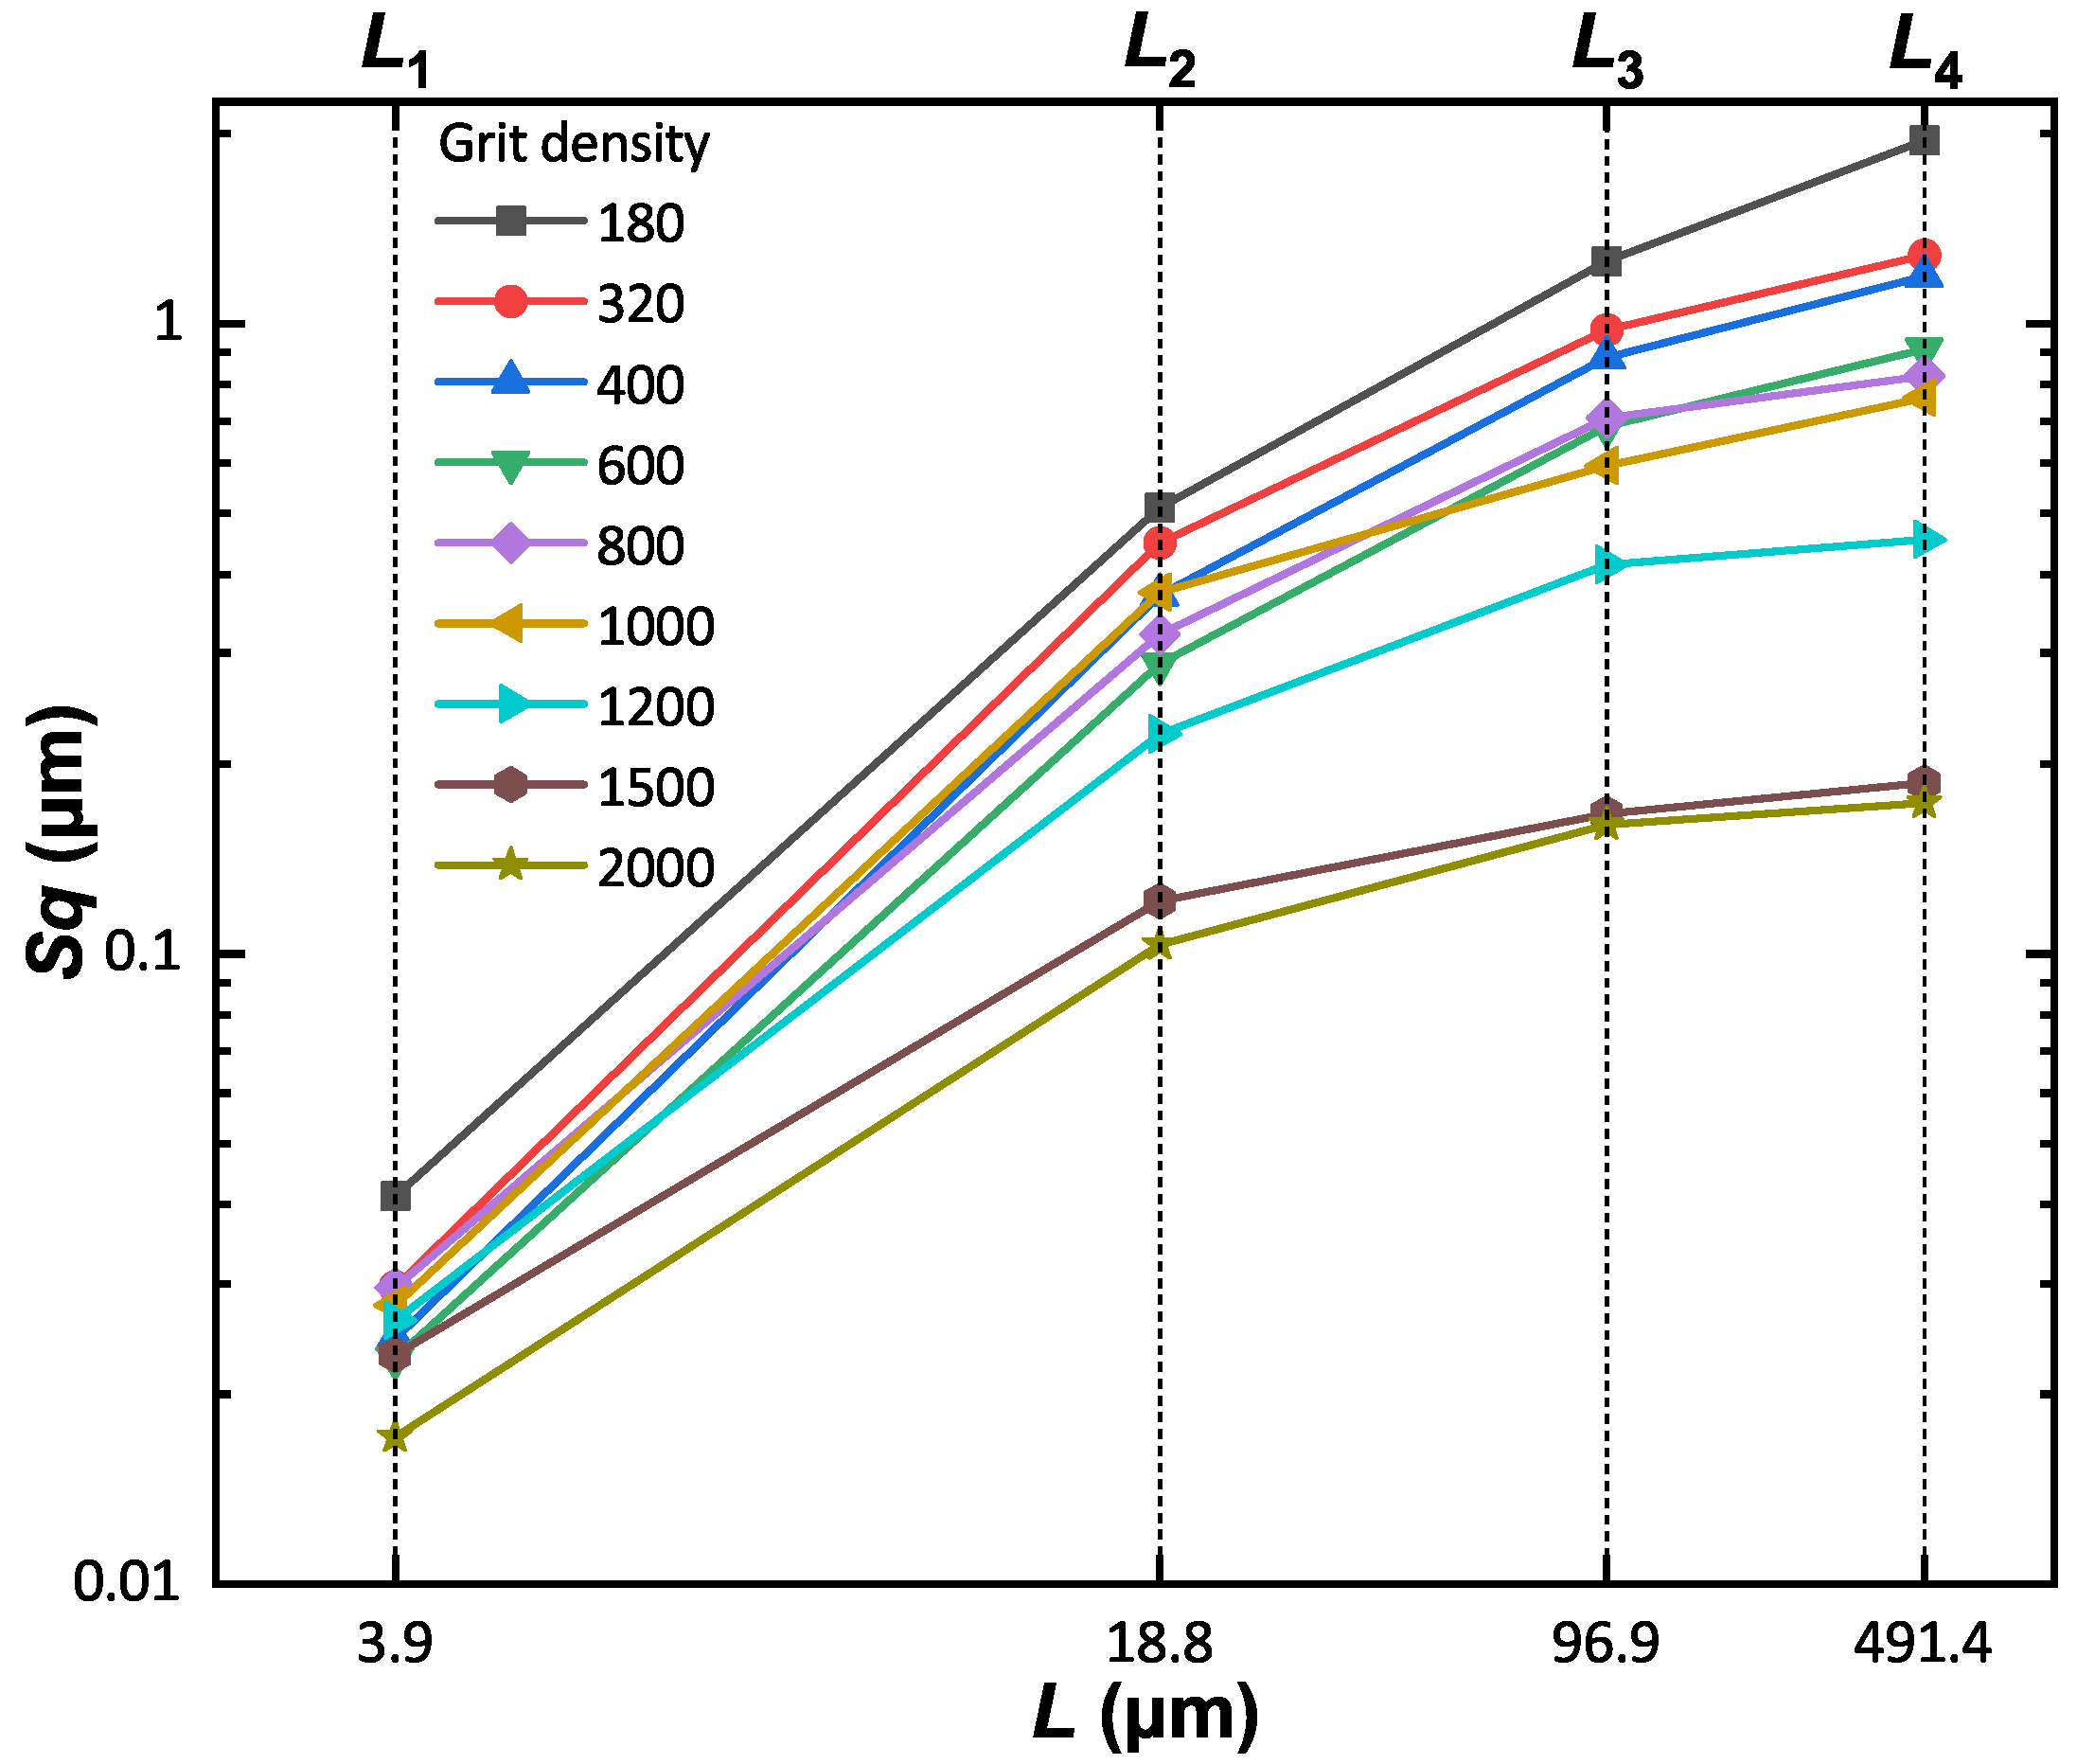
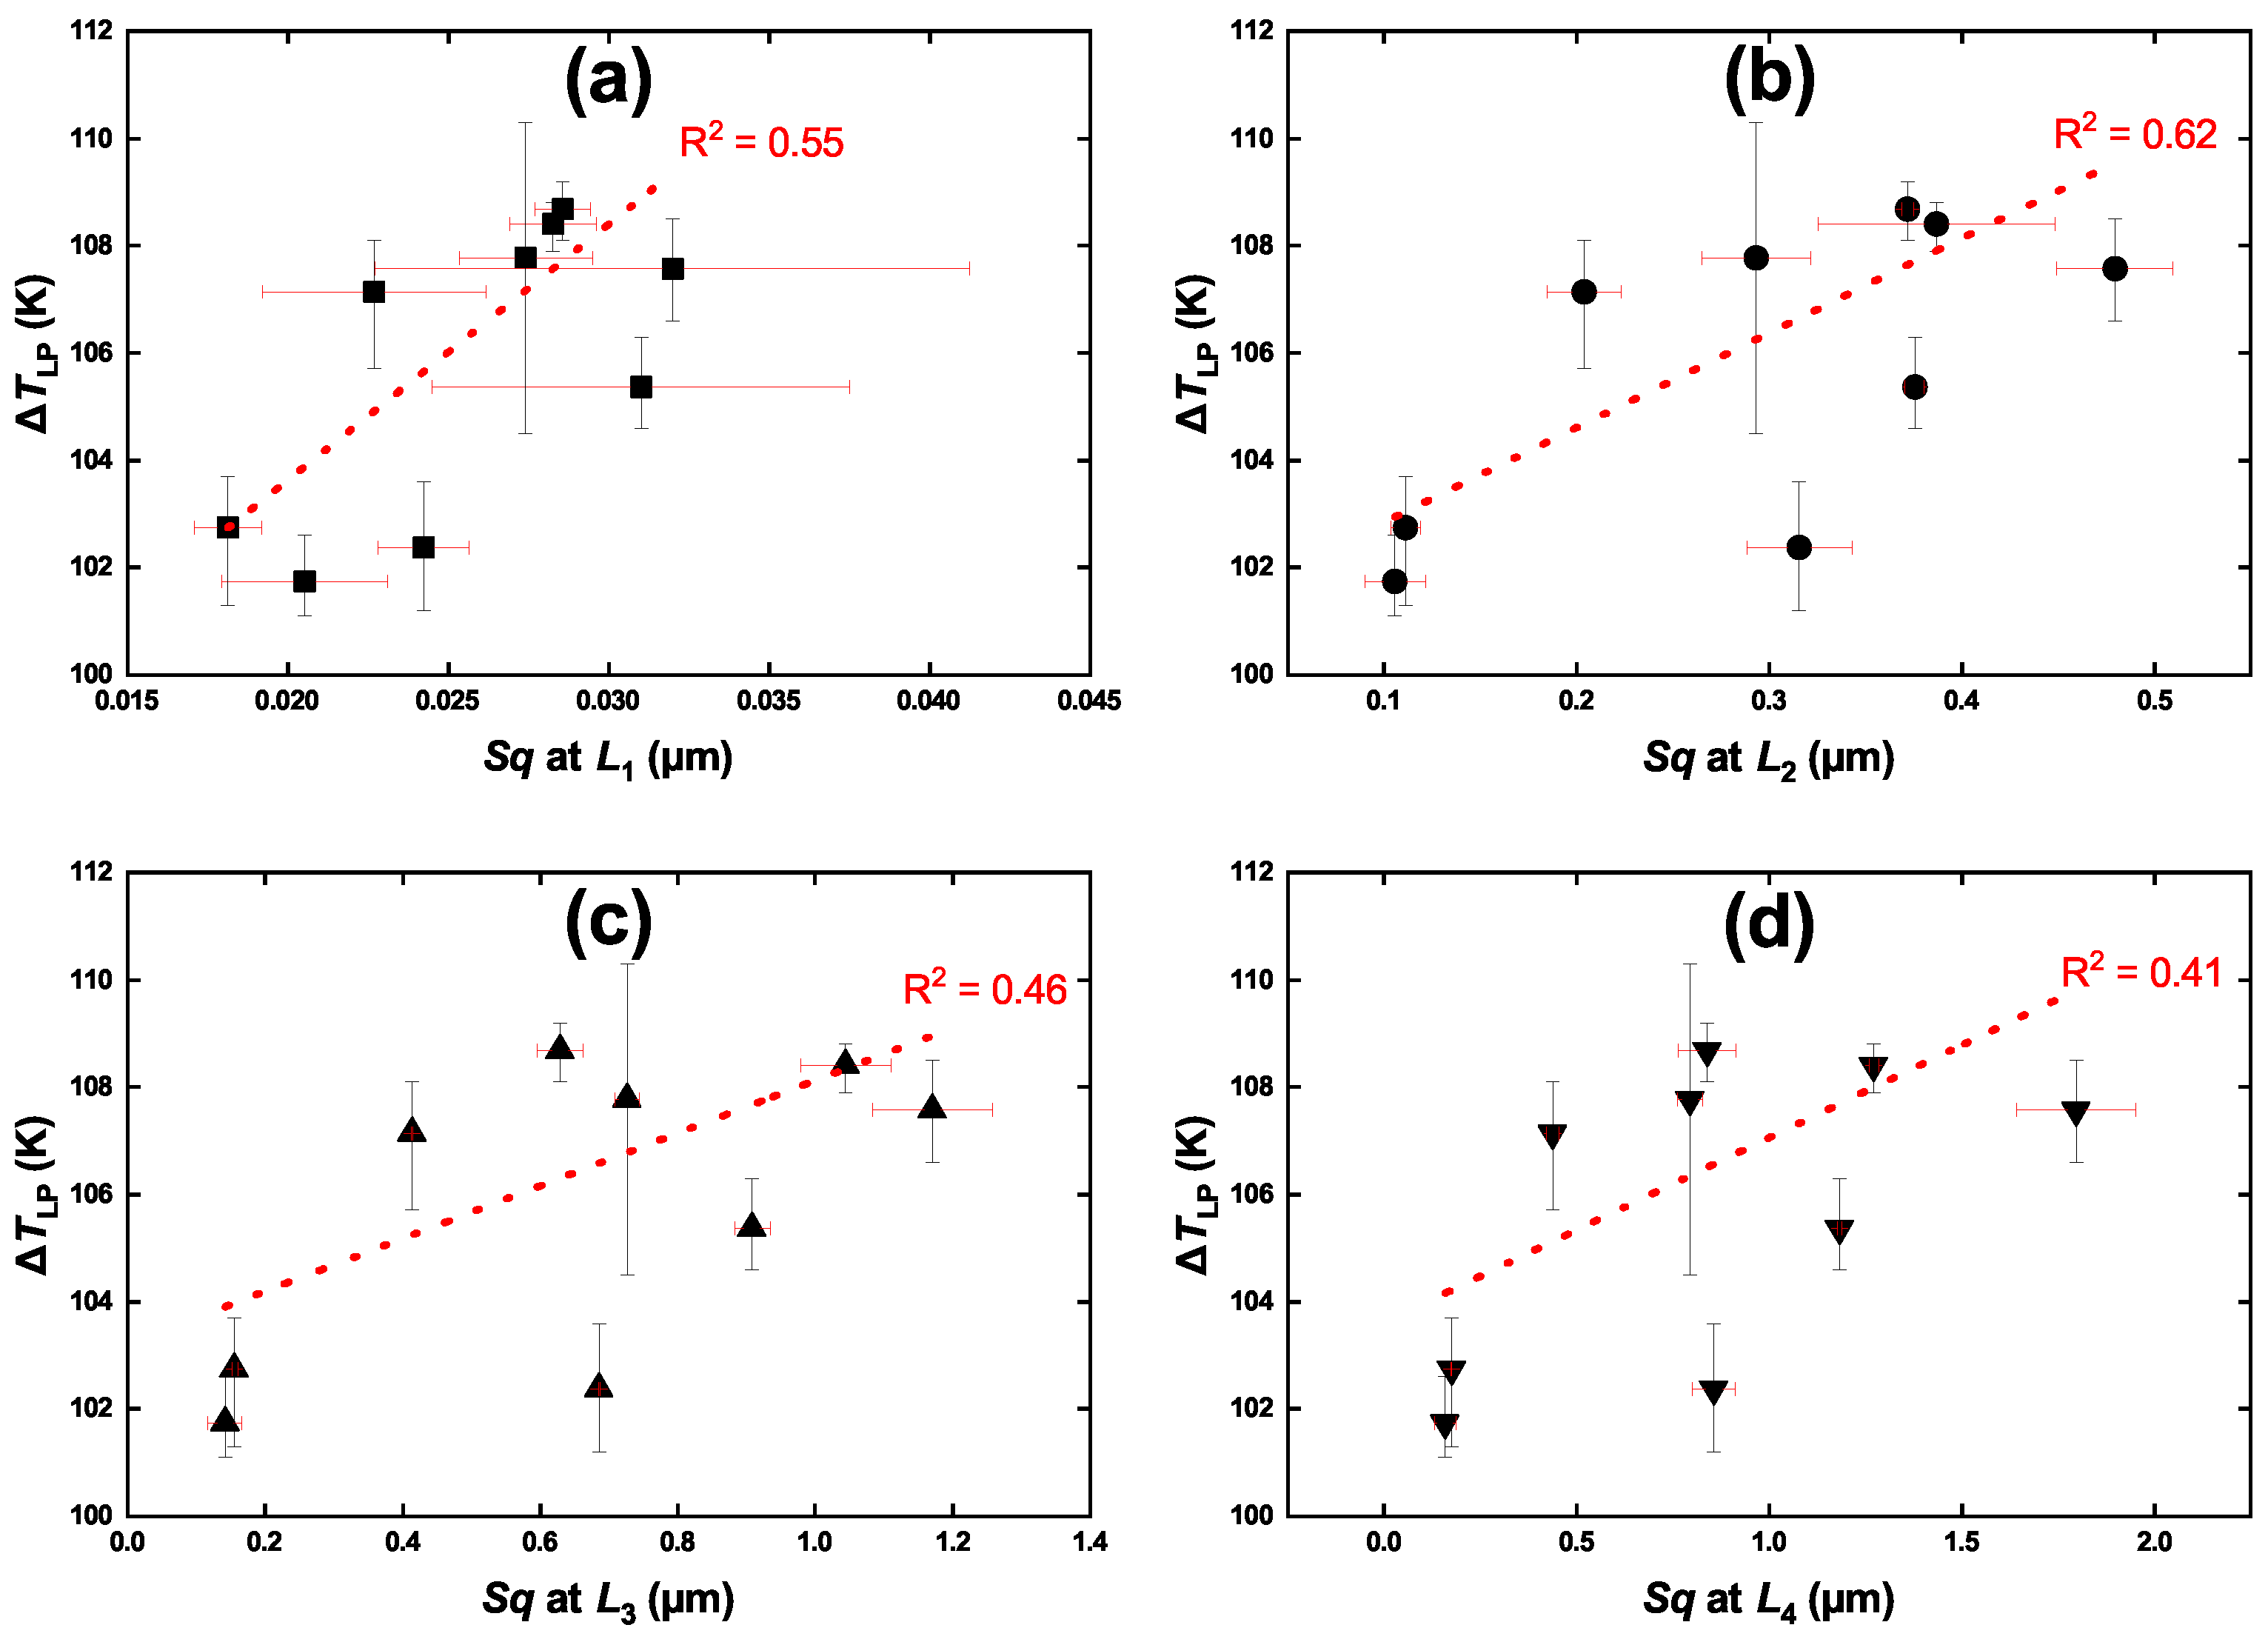
3.3. Multi-Scaled Analysis
A surface might exhibit various morphology characteristics when investigated with different magnifications. Taking the brass sample with the lowest roughness under the grit density of 2000 as an example, as shown in Figure 7, with the increasing of magnification, the microstructure with more complexity could be observed, which might also influence the Leidenfrost effect.
Figure 7.
SEM images of brass sample I under various magnifications: (a) 700×, (b) 1400×, (c) 4300×, (d) 11,500×.
In general, would decrease when a smaller L was used, because the finer microstructure became the main source of surface roughness. The relationship curves of -L, which were calculated out of WLI data by using the RSE algorithm with a flatten order of 2, were plotted in Figure 8. To study the influence of the multi-scaled behavior of , four L values were selected: = 3.9 m, = 18.8 m, = 96.9 m and = 491.4 m.
Figure 8.
The relationship curves of -L obtained by processing WLI data with the RSE algorithm.
The relationships between and at various L are illustrated in Figure 9. Straight lines were used for fitting, and the correlation coefficient of each fitting line was obtained. It could be observed that the - relationship at = 3.9 m and = 18.8 m became clearer (bigger ), while those at larger L values were similar to Figure 6b, where the maximum L of WLI image (800 m) was used.
Figure 9.
The relationships between and at various spatial scales: (a) = 3.9 m, (b) = 18.8 m, (c) = 96.9 m, (d) = 491.4 m. Straight lines were used for fitting, and the correlation coefficient of each fitting line was obtained.
4. Discussion
Based on the above experimental results, it could be found that the surface morphology of brass samples did affect to a large extent during liquid nitrogen cooling. In view of the influence of on , most previous publications demonstrated that increased with the increasing of surface roughness [13,14,15,16,17]. However, there was also literature reporting that the roughness increasing did not continuously enhance the boiling heat transfer, and the optimal boiling heat transfer occurred when = 1 m [18]. The results of this study could bring up a combined understanding with two aspects.
First, when was investigated at the maximum L of 800 m in this study as shown in Figure 6b, the results were similar to the latter type of literature reported by Vachon et al. [18]. In the range from 0.2 to 1.0 m, generally increased with the increasing. When further increased beyond 1.0 m, there was a slight deceasing of . In this study, reached its maximum when was 0.865 m. Second, when the small L was concerned in the investigation, as shown in Figure 9a, the results of this study were a generally continuous increasing along with the incresing, similar to the former type of literature.
Straight lines were used for fitting, and the correlation coefficient of each line was obtained in Figure 9. Small cavities (usually in the size range of several hundred nanometers to several tens of micrometers) served as active nucleation sites [13,36]; therefore, multi-scaled analysis was used to study the influence between and scale L. This study was different from previous literature [16,17,18], which mainly studied the influences of roughness at a single measurement scale, for example, 1.73–5.08 m, 0.076–0.635 m and 0.056–1.57 m were adopted in [16,17,18], respectively. The measurement scale of this study was from 3.9 m to 191.4 m. The complicated behavior of - relationship at different L might be attributed to the multi-scaled characteristics of brass surfaces. According to the classical theory of cavity activation and bubble growth [36], more activated cavities that meet the diameter requirements on the solid surface could enhance the generation of bubbles; thus, a stable gas film that could cause the Leidenfrost effect would occur more easily with a lower . Based on the findings of this study, it could be speculated that the cavities that could be activated as nucleation sites for bubbles should be within a spatial scope of small L such as microns. When L in the investigation was larger, the cavities or grooves with larger sizes could cause the increasing of surface roughness, but they might not make contribution for the bubble nucleation. In conclusion, the main novelty of this study is the multi-scaled analysis on surface roughness, because roughness at a single scale was measured and considered in the literature. However, the multi-scaled property of surface roughness has an influence on the Leidenfrost effect, which might be promising to obtain more understanding beyond the current one of film boiling and the Leidenfrost effect.
According to the results and analysis of this study, the surface morphology of the protective layer of HTS wires such as brass layers could play a significant role in inhibiting the quench propagation. If the of a HTS wire was lower, the thermal disturbance might result in the film boiling more easily, and the heat transfer efficiency would decrease sharply, which would lead to the wire burning and device failure. Therefore, it would be necessary to treat the wire surface properly to make an enlarged of HTS wires. More studies on the influence of boiling of liquid nitrogen on the quenching propagation of HTS devices are required in future, which would be instructive for the community of HTS, because the increasing could help to suppress the quenching propagation during the HTS device operation.
5. Conclusions
In this study, the Leidenfrost effect was studied by cooling brass samples in liquid nitrogen from room temperature. The surface of the brass samples was polished by using different sandpapers in prior; thus, different surface morphologies with texture were prepared with roughness and fractal dimension , which were highly negative-correlated. An apparatus for boiling experiment was setup to record the cooling curves, which was converted to the boiling curves with the lumped parameter method, and the SEM and WLI were used to observe the surface morphologies and obtain the height matrix to calculate the and of the surface, respectively. The experimental parameters of the Leidenfrost effect ( and ) were obtained. To further illustrate the scale effect of the on the , multi-scaled analysis was performed. The findings of this study could be instructive for the community of HTS wires, whose protecting layer is usually brass or copper, because the increasing could help to suppress the quench propagation during the HTS device operation. The conclusions obtained are as follows:
(1) It was found that the surface morphology of brass could influence , but neither nor had a clear correlation with . With increasing from 0.192 m to 1.961 m, i.e., decreasing from 2.664 to 2.287, could increase from 102.74 K to 107.58 K with a significant fluctuation. Besides, for ranging within the scope of 94.1–104.3 K, the or of brass samples had no clear influence.
(2) The measurement scale was from 3.9 m to 491.4 m, and the influence of with the measurement scales was much more obvious than the . The multi-scaled property of showed an influence on the Leidenfrost effect and showed that the utilization of smaller measurement scale (L) could reveal a closer relationship between and , which might be attributed to the scale of microcavities where vapor bubbles can nucleate, and could be promising to obtain more understanding beyond the current one of film boiling and the Leidenfrost effect. Besides, a higher correlationship between and roughness smaller L was found.
The RSE algorithm used in this study could be applied to the characterization of more engineering surfaces, and the experimental apparatus and results could provide reference for other low-temperature experiments.
Author Contributions
Data curation, Z.L. and F.F.; Funding acquisition, P.F. and F.F.; Investigation, Z.L., J.C. and F.F.; Project administration, D.Y., P.F. and F.F.; Visualization, Z.L., J.C. and F.F.; Writing—original draft, Z.L.; Writing—review and editing, D.Y., J.C., P.F. and F.F. All authors have read and agreed to the published version of the manuscript.
Funding
This study was supported by National Natural Science Foundation of China under Grant No. 51875311, Guangdong Basic and Applied Basic Research Foundation under Grant No. 2020A1515011199, and Shenzhen Foundational Research Project under Grant No. WDZC20200817152115001.
Institutional Review Board Statement
Not applicable.
Informed Consent Statement
Not applicable.
Data Availability Statement
The data presented in this study are available on request from the corresponding author.
Conflicts of Interest
The authors declare no conflict of interest. The funders had no role in the design of the study; in the collection, analyses, or interpretation of data; in the writing of the manuscript, or in the decision to publish the results.
Nomenclature
| The wall superheat at Leidenfrost point | |
| The wall superheat at critical heat flux | |
| HTS | High-temperature superconducting |
| WLI | White light interferometer |
| SEM | Scanning electron microscope |
| RSE | Roughness scaling extraction |
| Root mean square deviation roughness of profile | |
| Root mean square deviation roughness of surface | |
| L | Scale |
| D | Fractal dimension |
| Fractal dimension calculated by RSE algorithm | |
| q | Heat flux |
| Heat flow | |
| A | Area |
| c | Specific heat |
| m | Mass |
| T | Temperature |
| t | Time |
| Coefficient of determination |
References
- Gottfried, B.S.; Lee, C.J.; Bell, K.J. The leidenfrost phenomenon: Film boiling of liquid droplets on a flat plate. Int. J. Heat Mass Transf. 1966, 9, 1167–1188. [Google Scholar] [CrossRef]
- Tran, T.; Staat, H.J.J.; Prosperetti, A.; Sun, C.; Lohse, D. Drop Impact on Superheated Surfaces. Phys. Rev. Lett. 2012, 108, 036101. [Google Scholar] [CrossRef] [Green Version]
- Bouillant, A.; Mouterde, T.; Bourrianne, P.; Lagarde, A.; Clanet, C.; Quéré, D. Leidenfrost wheels. Nat. Phys. 2018, 14, 1188–1192. [Google Scholar] [CrossRef]
- Galicia, E.S.; Otomo, Y.; Saiwai, T.; Takita, K.; Orito, K.; Enoki, K. Subcooled Flow Boiling Heat Flux Enhancement Using High Porosity Sintered Fiber. Appl. Sci. 2021, 11, 5883. [Google Scholar] [CrossRef]
- Shiro, N. The maximum and minimum values of the heat Q transmitted from metal to boiling water under atmospheric pressure. Int. J. Heat Mass Transf. 1966, 9, 1419–1433. [Google Scholar] [CrossRef]
- Shiro, N. Memories of my research on boiling. Int. J. Heat Mass Transf. 1984, 27, 955–957. [Google Scholar] [CrossRef]
- Linke, H.; Aleman, B.J.; Melling, L.D.; Taormina, M.J.; Francis, M.J.; Dow-Hygelund, C.C.; Narayanan, V.; Taylor, R.P.; Stout, A. Self-propelled Leidenfrost droplets. Phys. Rev. Lett. 2006, 96, 154502. [Google Scholar] [CrossRef] [Green Version]
- Ivan, U.V.; Neelesh, A.P.; Jeremy, O.M.; Derek, Y.C.C.; Sigurdur, T.T. Stabilization of Leidenfrost vapour layer by textured superhydrophobic surfaces. Nature 2012, 489, 274–277. [Google Scholar]
- Otomo, Y.; Santiago, G.E.; Enoki, K. Enhancement of Subcooled Flow Boiling Heat Transfer with High Porosity Sintered Fiber Metal. Appl. Sci. 2021, 11, 1237. [Google Scholar] [CrossRef]
- Kim, H.; Truong, B.H.; Buongiorno, J.; Hu, L.W. On the effect of surface roughness height, wettability, and nanoporosity on Leidenfrost phenomena. Appl. Phys. Lett. 2011, 98, 083121. [Google Scholar] [CrossRef]
- Kwon, H.M.; Bird, J.C.; Varanasi, K.K. Increasing Leidenfrost point using micro-nano hierarchical surface structures. Appl. Phys. Lett. 2013, 103, 365–689. [Google Scholar] [CrossRef] [Green Version]
- Liang, G.T.; Mudawar, I. Review of drop impact on heated walls. Int. J. Heat Mass Transf. 2017, 106, 103–126. [Google Scholar] [CrossRef]
- Bernardin, J.D.; Mudawar, I.J. The Leidenfrost Point: Experimental Study and Assessment of Existing Models. J. Heat Transf. 1999, 121, 894–903. [Google Scholar] [CrossRef]
- Bernardin, J.D.; Stebbins, C.J.; Mudawar, I. Effects of surface roughness on water droplet impact history and heat transfer regimes. Int. J. Heat Mass Transf. 1996, 40, 73–88. [Google Scholar] [CrossRef]
- Avedisian, C.T.; Koplik, J. Leidenfrost boiling of methanol droplets on hot porous/ceramic surfaces. Int. J. Heat Mass Transf. 1987, 30, 379–393. [Google Scholar] [CrossRef]
- Bradfield, W.S. Liquid-Solid Contact in Stable Film Boiling. Ind. Eng. Chem. Fundam. 1966, 5, 200–204. [Google Scholar] [CrossRef]
- Baumeister, K.J.; Simon, F.F. Leidenfrost Temperature—Its Correlation for Liquid Metals, Cryogens, Hydrocarbons, and Water. J. Heat Transf. 1973, 95, 166–173. [Google Scholar] [CrossRef]
- Vachon, R.I.; Tanger, G.E.; Davis, D.L.; Nix, G.H. Pool Boiling on Polished and Chemically Etched Stainless-Steel Surfaces. J. Heat Transf. 1968, 90, 231–238. [Google Scholar] [CrossRef]
- Chen, Y.; Zhang, C.; Shi, M.; Peterson, G.P. Optimal surface fractal dimension for heat and fluid flow in microchannels. Appl. Phys. Lett. 2010, 97, 084101. [Google Scholar] [CrossRef]
- Langroudi, A.A.; Jefferson, I.; O’Hara-Dhand, K.; Smalley, I. Micromechanics of quartz sand breakage in a fractal context. Geomorphology 2014, 211, 1–10. [Google Scholar] [CrossRef]
- Gou, X.F.; Justin, S. Fractal analysis of the role of the rough interface between Bi2Sr2CaCu2Ox filaments and the Ag matrix in the mechanical behavior of composite round wires. Supercond. Sci. Technol. 2013, 26, 055016. [Google Scholar] [CrossRef]
- Matos, R.S.; Ţălu, Ş.; Mota, G.V.S.; Pinto, E.P.; Pires, M.A.; Abraçado, L.G.; Ferreira, N.S. Correlating Structure and Morphology of Andiroba Leaf (Carapa guianensis Aubl.) by Microscopy and Fractal Theory Analyses. Appl. Sci. 2021, 11, 5848. [Google Scholar] [CrossRef]
- Feng, F.; Huang, J.L.; Li, X.H.; Qu, T.M.; Liu, B.B.; Zhou, W.M.; Qian, X.; Feng, P.F. Influences of planarization modification and morphological filtering by AFM probe-tip on the evaluation accuracy of fractal dimension. Surf. Coat. Tech. 2019, 363, 436–441. [Google Scholar] [CrossRef]
- Li, Z.W.; Qian, X.; Feng, F.; Qu, T.M.; Xia, Y.S.; Zhou, W.M. A continuous variation of roughness scaling characteristics across fractal and non-fractal profiles. Fractals 2021, 29, 2150109. [Google Scholar] [CrossRef]
- Malozemoff, A.P. Second-Generation High-Temperature Superconductor Wires for the Electric Power Grid. Ann. Rev. Mater. Res. 2012, 42, 373–397. [Google Scholar] [CrossRef]
- Xin, Y.; Gong, W.Z.; Hong, H.; Gao, Y.Q.; Niu, X.Y.; Zhang, J.Y.; Sun, Y.W.; Ren, A.L.; Wang, H.Z.; Zhang, L.F.; et al. Development of a 220 kV/300 MVA superconductive fault current limiter. Supercond. Sci. Technol. 2012, 25, 105011. [Google Scholar] [CrossRef]
- Snitchler, G.; Gamble, B.; King, C.; Winn, P. 10 MW Class Superconductor Wind Turbine Generators. IEEE Trans. Appl. Supercond. 2011, 21, 1089–1092. [Google Scholar] [CrossRef]
- Hahn, S.; Kim, K.; Kim, K.; Hu, X.B.; Painter, T.; Dixon, I.; Kim, S.; Bhattarai, K.; Noguchi, J.; Jaroszynski, J.; et al. 45.5-tesla direct-current magnetic field generated with a high-temperature superconducting magnet. Nature 2019, 570, 496–499. [Google Scholar] [CrossRef]
- Yanagisawa, Y.; Okuyama, E.; Nakagome, H.; Takematsu, T.; Takao, T.; Hamada, M.; Matsumoto, S.; Kiyoshi, T.; Takizawa, A.; Takahashi, M.; et al. The mechanism of thermal runaway due to continuous local disturbances in the YBCO-coated conductor coil winding. Supercond. Sci. Tech. 2012, 25, 075014. [Google Scholar] [CrossRef]
- Wang, X.; Trociewitz, U.P.; Schwartz, J. Near-adiabatic quench experiments on short YBa2Cu3O7 coated conductors. J. Appl. Phys. 2007, 101, 053904. [Google Scholar] [CrossRef]
- Song, H.H.; Kevin, G.; Justin, S. Quench behavior of conduction-cooled YBa2Cu3O7 coated conductor pancake coils stabilized with brass or copper. Supercond. Sci. Technol. 2010, 23, 065021. [Google Scholar] [CrossRef]
- Shin, H.; Bautista, Z.; Gorospe, A.; Lee, J.; Lee, H.; Moon, S. Electro-Mechanical Properties of Single-Side Brass Foil Laminated Coated Conductor Tapes at 77 K Under Self-Field. IEEE Trans. Appl. Supercond. 2016, 26, 1–5. [Google Scholar] [CrossRef]
- Westwater, J.W.; Hwalek, J.J.; Irving, M.E. Suggested standard method for obtaining boiling curves by quenching. Ind. Eng. Chem. Fundam. 1986, 25, 685–692. [Google Scholar] [CrossRef]
- Holman, J.P. Heat Transfer, 10th ed.; McGraw-Hill: New York, NY, USA, 2010; pp. 141–143. [Google Scholar]
- Li, J.Q. On the Microscale Mechanisms of the Effects of Surface Properties on the Cooling Rate and Boiling Heat Transfer during Quenching; Zhejiang University: Hangzhou, China, 2019. (In Chinese) [Google Scholar]
- Bernardin, J.D.; Mudawar, I. A cavity activation and bubble growth model of the leidenfrost point. J. Heat Transf. 2002, 124, 864–874. [Google Scholar] [CrossRef]
Publisher’s Note: MDPI stays neutral with regard to jurisdictional claims in published maps and institutional affiliations. |
© 2021 by the authors. Licensee MDPI, Basel, Switzerland. This article is an open access article distributed under the terms and conditions of the Creative Commons Attribution (CC BY) license (https://creativecommons.org/licenses/by/4.0/).