Article

A Simple Graphene Functionalized Electrochemical Aptasensor for the Sensitive and Selective Detection of Glycated Albumin

by
Nang Noon Shean Aye
1,
Pornsuda Maraming
1,
Ratree Tavichakorntrakool
1,
Attawut Chaibunruang
1,
Patcharee Boonsiri
2,
Sakda Daduang
3,
Nattiya Teawtrakul
4,
Prinya Prasongdee
5,
Vittaya Amornkitbamrung
6,7 and
Jureerut Daduang
1,*
1
Centre for Research and Development of Medical Diagnostic Laboratories, Faculty of Associated Medical Sciences, Khon Kaen University, Khon Kaen 40002, Thailand
2
Department of Biochemistry, Faculty of Medicine, Khon Kaen University, Khon Kaen 40002, Thailand
3
Division of Pharmacognosy and Toxicology, Faculty of Pharmaceutical Sciences, Khon Kaen University, Khon Kaen 40002, Thailand
4
Division of Hematology, Department of Internal Medicine, Faculty of Medicine, Srinagarind Hospital, Khon Kaen University, Khon Kaen 40002, Thailand
5
Clinical Chemistry Unit of Srinagarind Hospital, Faculty of Medicine, Khon Kaen University, Khon Kaen 40002, Thailand
6
Department of Physics, Khon Kaen University, Khon Kaen 40002, Thailand
7
Institute of Nanomaterials Research and Innovation for Energy (IN-RIE), NANOTEC-KKU RNN on Nanomaterials Research and Innovation for Energy, Khon Kaen University, Khon Kaen 40002, Thailand
*
Author to whom correspondence should be addressed.
Appl. Sci. 2021, 11(21), 10315; https://doi.org/10.3390/app112110315
Submission received: 6 September 2021 / Revised: 23 October 2021 / Accepted: 25 October 2021 / Published: 3 November 2021
(This article belongs to the Section Applied Biosciences and Bioengineering)

Abstract

:
Glycated albumin (GA) has been previously introduced as a promising biomarker for glycemic monitoring in diabetes patients with thalassemia. In this study, a label-free graphene oxide (GO)-modified aptasensor was developed for the rapid detection of GA. The fabrication of the aptasensor was dependent on the covalent interaction of the amine-functionalized GA-specific aptamer with the carboxylic groups of GO. Square wave voltammetry (SWV) analysis was carried out for the measurement of GA-aptamer binding to their specific proteins. The peak current changes before and after incubation with GA protein were directly proportional to the concentration. The developed aptasensor exhibited a broad linearity (1–10,000 µg mL−1), a low detection limit (LOD) of 0.031 µg mL−1, and high selectivity for GA detection. In addition, the aptasensor was successfully applied to detect GA in both spiked and clinical serum samples. The comparison of the developed method with a commercial assay validated the reliability of the aptasensor for clinical application. Therefore, the newly developed aptasensor is a promising tool for GA measurements in diabetic patients with underlying thalassemia.

1. Introduction

Diabetes mellitus (DM) is a chronic disease that is characterized by hyperglycemia. It has become a globally threatening disease that affected 463 million people (9.3%) in the age group of 18–99 years in 2019 and is predicted to affect 700 million (10.9%) in 2045 [1]. The laboratory tests that are currently used for the diagnosis of DM are fasting blood sugar (FBS), two-hour plasma glucose (2hG), and glycosylated hemoglobin (HbA1c) [2]. Among these, HbA1c has been recognized as the gold standard for glycemic control. HbA1c indicates glycemic control over one to two months because erythrocytes (RBCs) have a life span of approximately 120 days. However, underlying diseases that shorten the lifespan of RBCs, such as haemoglobinopathy, thalassemia, renal anemia, hemolytic anemia (HA), and liver cirrhosis, affect HbA1c measurement [3].
Glycated albumin (GA), one of the fructosamines, is produced by the nonenzymatic reaction of glucose and albumin and it is specific to albumin glycation rates. Unlike HbA1c, abnormal hemoglobin and impaired metabolism, such as anemia or variant hemoglobin, cannot affect GA levels. GA has a half-life of 14–21 days [4]. Therefore, GA indicates the glycemic status for the previous 2 weeks [5], which is an earlier detection of rapid changes in blood glucose compared to HbA1c [6]. Several methods are used for the measurement of GA levels, including boronate affinity chromatography, immunoassays (radioimmunoassay or enzyme-linked immunosorbent assays), high-performance liquid chromatography, ion-exchange chromatography, capillary electrophoresis [7], refractive index measurement [8], Raman spectroscopy [9], graphene-based aptasensors [10], field effect aptasensors [11], electrochemical aptasensors [12,13,14] and other electrophoretic techniques [15]. However, low sensitivity, the need for sophisticated instruments, expense and interference limits the utility of these methods for GA measurements. Therefore, the development of rapid, sensitive, and cost-effective biosensors is required.
Short, synthetic, single-stranded DNA or RNA oligonucleotides are known as aptamers. Aptamers have complex, three-dimensional structures and low molecular weight (6–40 kDa) [16]. The advantages of aptamers compromise their ability to be synthesized for mass production: little immunogenicity or toxicity, the capability of immobilization to various surfaces, high tolerance to temperature, ease of transport, greater consistency than antibodies, and alteration of the desired aptamer binding capacity to the target [17].
Among the biosensors for the detection of biomolecules, such as proteins, electrochemical-based aptamer biosensors have emerged as an ultrasensitive, rapid, and cost-effective approach [18,19]. Electrochemical biosensors transduce the biomolecular reaction into the electrochemical signal via the transducer and quantify the number of antigens in the sample. Label-free detection is proven to be simple, time saving and more applicable than label-based protocols. Different electrochemical biosensors depend on the types of applied signals and responses [20]. Graphene oxide (GO), an oxidized form of graphene, can exhibit a higher affinity in attaching biomolecules through amidic bonds. GO has been implied as a transducer in biosensing elements because of its broad surface area, electrical conductivity, high charge transfer, and capability to immobilize different biomolecules [21]. Graphene-based nanomaterials have been widely used in electrochemical sensors because they facilitate electron transfer reactions, thereby generating high signal sensitivity. Bunyarataphan et al. reported an electrochemical aptasensor with a low LOD (3 ng mL−1) [12]. The fabrication is based on the streptavidin (STR)-biotin aptamer reaction, which is simple yet has a prolonged processing time requiring overnight incubation of STR to firmly bind onto the electrode surface. Another study also reported a reduced-GO/gold nanoparticle aptamer-based electrochemical detection system for GA measurement with a LOD of 0.07 µg mL−1 [13]. However, it presents some drawbacks, such as the cost of fabrication and the application of glass carbon electrodes, which require cleaning and mechanical polishing prior to testing.
In our study, a graphene-based electrochemical aptasensor was developed for the high-sensitivity, effective, and rapid detection of GA. Screen-printed carbon electrodes (SPCEs) modified by GO were used as disposable biosensing sensor elements. The application of SPCEs makes our aptasensor fabrication cost-effective and easy to operate compared to conventional glass carbon electrodes. The aptasensor was constructed by the immobilization of aptamer onto GO-modified SPCEs by an amide bond, which is stronger than physical adsorption. Covalent binding between the NH2 aptamer and GO was achieved by simple modification requiring no additional nanomaterial or complicated GO carboxylation treatment. The binding of the target analyte (GA) to the aptamer was analyzed by a sensitive square wave voltammetry (SWV) technique. The sensitivity, specificity and reliability of the developed electrochemical aptasensor was evaluated for GA detection. To validate the aptasensor, the clinical samples from diabetes and non-diabetes were analyzed and compared with a commercial assay. This study indicates that the aptasensor we developed can be applied for the detection of GA levels for glycemic monitoring of DM.

2. Materials and Methods

2.1. Reagents and Materials

An amine modified GA binding aptamer with 23 nucleotide sequence of 5′-NH2-TGC GGT TGT AGT ACT CGT GGC CG–3′ designed in a previous study [10] was customized by Integrated DNA Technologies Pte. Ltd., Singapore. GO, GA, human serum albumin (HSA), N-hydroxysuccinimide (NHS), ethanolamine, and N-(3-dimethylaminopropyl)-N-ethylcarbodiimide hydro-chloride (EDC) were purchased from Sigma-Aldrich (Singapore). The screen-printed carbon electrodes with a three-electrode system were purchased from Quasense, Thailand. A commercial GA-ELISA assay kit (96 wells) was purchased from Abbexa (UK). Potassium ferricyanide ([Fe (CN)6]4–/3–, 5 mM) in phosphate-buffered saline (PBS) (1×, pH 7.4) was used as a redox indicator. PBS (1×, pH 7.4) was used for all washing steps. Tris-EDTA (TE) buffer (1×, pH 8.2) was used for reconstitution of the aptamer. The reagents were prepared in ultrapure deionized water.

2.2. Instruments

The electrochemical detection system consists of a transducer (the electrode sensor) and the detector. The disposable screen-printed electrode (30 × 12.5 mm) consists of a three-electrode system (a 3-mm working carbon electrode, a silver/silver chloride reference electrode, and a carbon counter electrode). All electrochemical measurements were performed on a PalmSens4 potentiostat (PalmSens BV, GA Houten, The Netherlands) using PS Trace 5.8 software. The characterization of GO was carried out by a Bruker TENSOR II ATR-FTIR spectrometer (Bruker, Bremen, Germany).

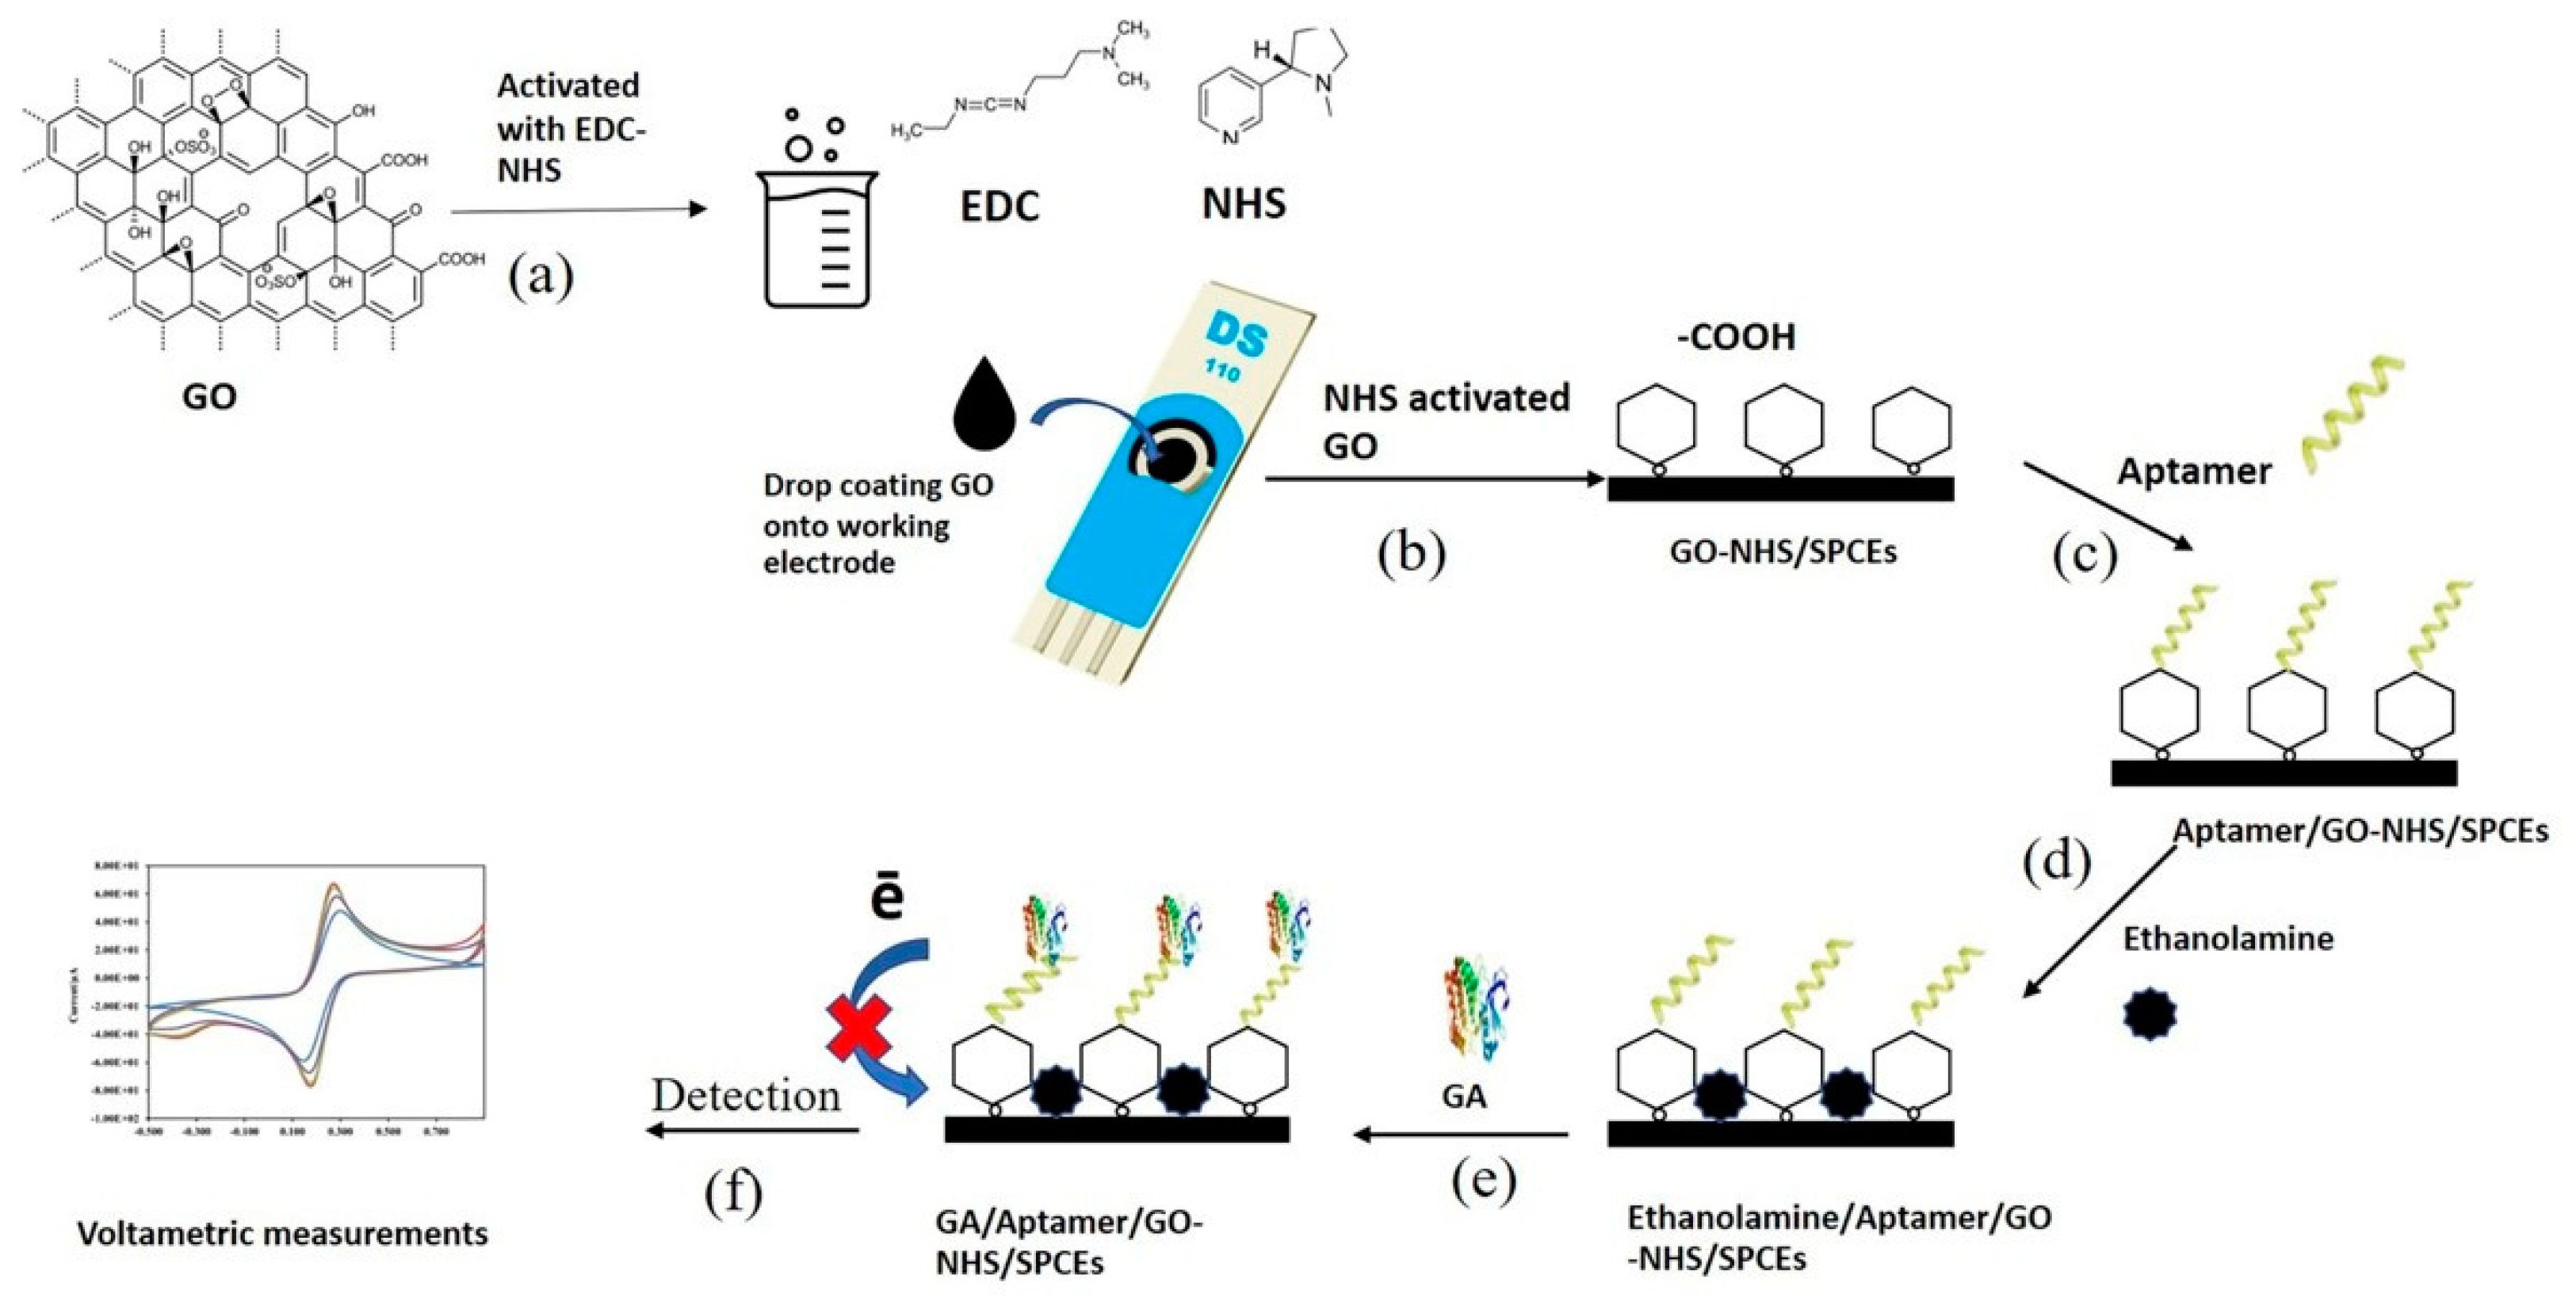
2.3. Functionalization of GO

The GO powder (0.1 g) was resuspended in 10 mL of 400 µM EDC/NHS. The solution was mixed by stirring for 4 h at room temperature and sonicated for 10 min. The EDC/NHS-activated graphene oxide suspension was centrifuged at 10,000 rpm for 25 min and washed with deionized water three times to remove excess EDC and NHS. The supernatant was discarded, and the remaining solid materials were dehydrated at 30 °C for 24 h. Solidified functionalized GO can be used to prepare working GO solutions. The activated GO (0.5 mg) was resuspended in water by stirring for 30 min followed by sonication for 10 min to obtain a homogeneous suspension.

2.4. Fabrication of the Electrochemical Aptasensor

Seven microliters of functionalized GO (0.5 mg mL−1) was deposited onto the working carbon electrode and evaporated for 15 min at 50 °C. The electrodes were washed thoroughly with PBS to remove excess GO. Then, 7 µL of GA binding aptamer (1 µM) was immobilized to the working electrode and stabilized for 30 min for complete binding between the amine-modified aptamer and carboxyl groups of the GO. The unbound aptamers were washed thoroughly with PBS (1×, pH 7.2). 0.1 M ethanolamine was used as a blocking reagent to reduce non-specific binding on the surface. After blocking for 15 min, the SPCEs were washed with PBS again. The layer-by-layer fabricated aptasensor was applied as a biosensor in our study.

2.5. Electrochemical Analysis

Different concentrations of GA were incubated with the prepared aptasensor for 40 min. After rinsing with PBS, 130 µL of 5 mM [Fe (CN)6]4–/3– was added until all the electrode surfaces had been immersed. The characterization of the aptasensor was performed by electrochemical impedance spectrometry (EIS) and cyclic voltammetry (CV). The electrochemical signal was measured by square wave voltammetry (SWV) using 5 mM [Fe (CN)6]4–/3– as a redox indicator. For the characterization of the fabrication process, CV and EIS analyses were carried out after each immobilization procedure. CV was applied with a potential of −0.5 V to 0.9 V at a scan rate of 100 mVs−1 using redox indicator. The impedance spectra were measured by using the frequency range (100 mHz to 100 kHz) using the open circuit potential (OCP). GA detection was carried out by more sensitive SWV analysis. The SWV measurements were performed by applying a potential range of −0.6 to 0.6 V with a step potential of 5 mV, amplitude of 2 mV, and frequency of 8 Hz. The flow diagram of the proposed electrochemical aptasensor is illustrated in Figure 1.

2.6. Clinical Sample Analysis

The clinical performance of the proposed biosensor was determined by testing with clinical serum sample. Clinical serum samples (10 diabetes and 20 non-diabetics serum samples) collected from Srinagarind Hospital, Khon Kaen province, Thailand, were performed for GA assay using the developed electrochemical aptasensor. The sample collecttion was conducted in accordance with the Declaration of Helsinki, and the protocol was approved by the Centre for Ethics in Human Research, Khon Kaen University with the ethical approval number HE641192. After incubation with clinical samples, the electrochemical measurements were done as described in the previous section.

2.7. Statistical Analysis

A statistical analysis was performed by SPSS program, version 27.0 (SPSS Inc., Chicago, IL, USA). Differences between two groups was analyzed by using an independent two-sample t-test. Normality of data distribution was confirmed by Kolmogorov–Smirnova, Shapiro–Wilk tests and normal quantile plots. Correlation between the variations were evaluated by Pearson’s correlation coefficient and multivariate linear regression.

3. Results and Discussion

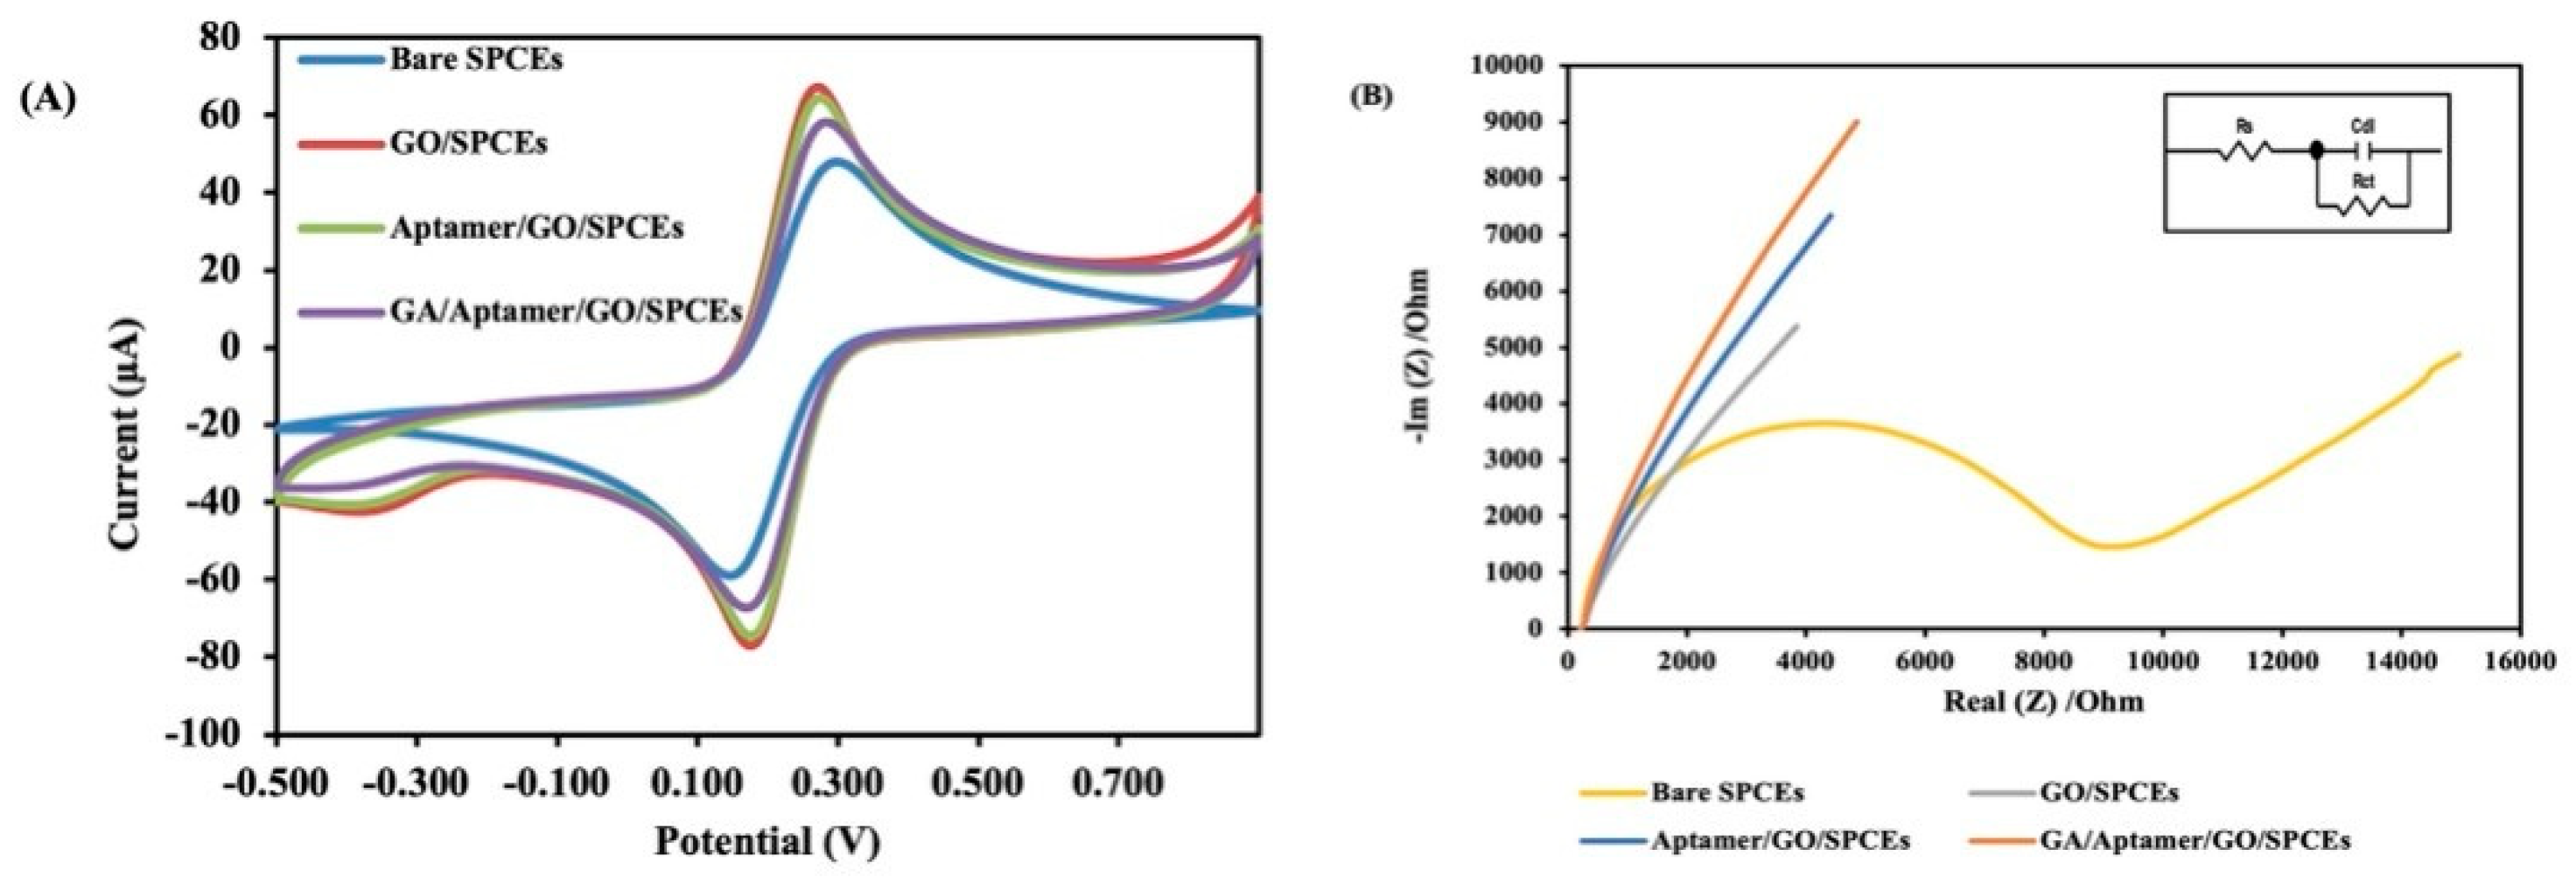
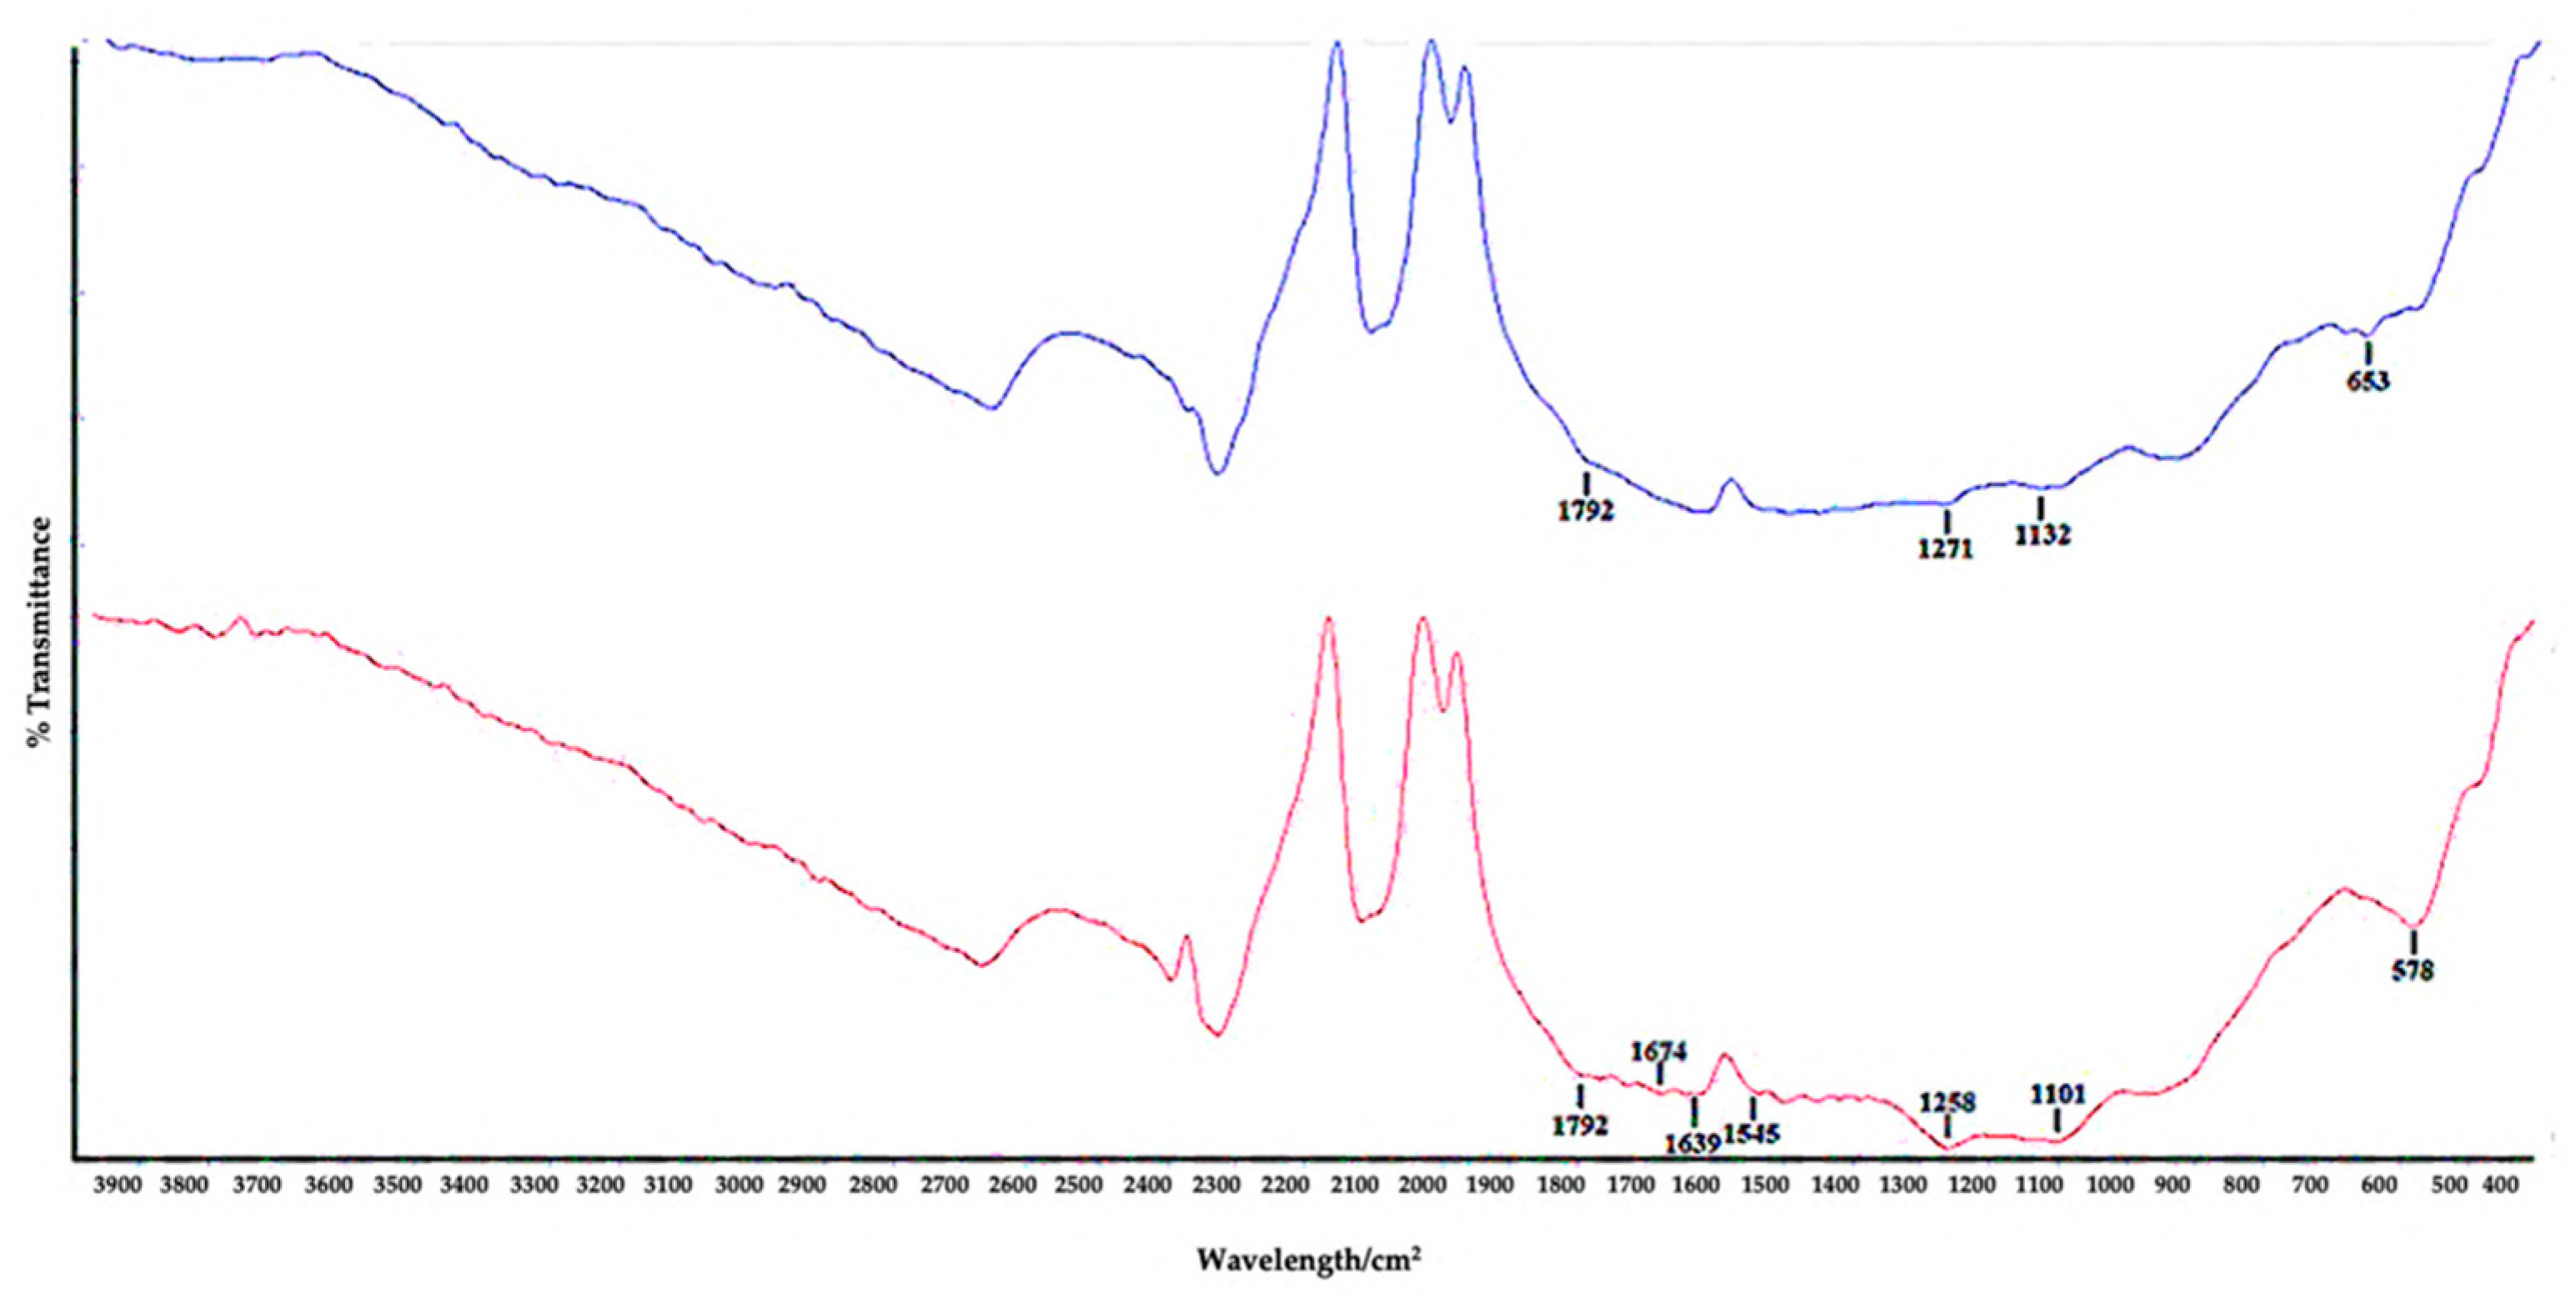
3.1. Characterization of the Electrochemical Aptasensor

The utilization of graphene in electrochemical biosensors is impactful because no chemical treatment is needed. A uniform distribution of graphene on the electrode surface was observed by depositing only a small volume of GO (7 µL) (Figure 1). A DNA aptamer was coated on the SPCE surface by physical adsorption, but various issues, such as the inefficient orientation of the attached aptamer, the uncontrollability over bonding strength, and strong binding of the aptamer for minimal physical adsorption [22] were challenges. In our experiments, GO was pre-treated with EDC/NHS to activate the carboxyl groups of GO. EDC is a cross-linker that was used to couple carboxyl groups to primary amines by forming an active ester intermediate that was substituted by nucleophilic attack from the primary amine. The intermediate product is prone to be hydrolyzed and reverted to the original molecule [23]. NHS ester was used to overcome this by forming a steady second intermediate before amination [24]. EDC crosslinking was carried out in a buffer devoid of carboxyl or primary amines. The coupling reaction requires over 20 min for efficient carboxylation [25]. In conventional GO-based electrochemical biosensors, activation of GO was carried out by incubating GO-modified electrodes in EDC/NHS solutions. However, the uniformity of carboxylation is difficult to achieve. In our study, the pre-treatment of GO with EDC/NHS resulted in uniform carboxylation and stable aptamer immobilization. Covalent bonding of carboxyl groups of GO to the amine-modified aptamer was achieved after activation. The covalent binding for the aptamer was more stable than a weak π–π interaction corresponding with physical adsorption [26].
The characterization of the electrochemical aptasensor was confirmed by CV and EIS using 5 mM [Fe (CN)6]4–/3–. Figure 2A represents the cyclic voltammograms of the bare SPCEs and GO-modified SPCEs. After modification of the SPCE surface with GO, both anodic (Ipa) and cathodic (Ipc) peak currents significantly increased. GO-modified SPCEs exhibited higher peak currents than bare SPCEs. The modification of SPCEs with GO provides a shift in the cathodic (Epc) and anodic (Epa) potentials, thus resulting in smaller peak-to-peak separation (∆Ep). The significant increase in the peak current can be attributed to the improved electrochemical activity with a higher charge transfer rate, which in turn leads to the improvement of the total electroactive area of GO/SPCEs. After aptamer immobilization, the redox peak current was decreased because of the large structure of the aptamer and the negative charge on the aptamer phosphate backbone. The peak was further reduced after target incubation due to a change in aptamer conformational structure after specific protein binding. The EIS spectra of the electrochemical sensor are illustrated in Figure 2B. The successful modification of the electrode surface was characterized by EIS data, which revealed the changes in charge transfer resistance (Rct) in each modification step. The simplified Randles circuit, which consists of a series of active electrolyte resistances Rs and double layer capacitances Cdl that are parallel to the charge transfer resistance Rct, was used for EIS fitting. The Nyquist spectrum for the bare SPCEs consists of a semicircle and a linear in high- and low-frequency regions. The diameter of the semicircle denotes the charge-transfer resistance Rct at the electrode [27]. The Rct values decreased after GO/SPCEs because the electron transfer rate was amplified upon modification with GO, which facilitated the redox process. The EIS data agrees with the cyclic voltammetry data (Figure 2A), thereby showing the successful modification of the SPCEs with GO. The charge transfer resistance was increased after aptamer immobilization. This might be due to the aptamer hindering the access of redox species to the transducer surface, thereby blocking electron transfer. The increase in Rct after aptamer immobilization indicates the successful immobilization of the aptamer on the electrode surface. The Rct was increased again after incubation with the target protein (GA). This is probably due to the binding of the protein to the aptamer complex hindering the electron transfer process.
The effect of the scan rate on the voltammetric behavior of GO/SPCEs was examined. The scan rate was increased from 10 to 300 mVs−1. A linear relationship was observed after plotting the square root of the scan rate vs. the anodic (Ipa) and cathodic (Ipc) peak currents (Figure S1A), with R2 values of 0.9992 and 0.9996, respectively (Figure S1B). This result suggested the characteristics of the corresponding thin-layer type voltammetry [28]. The plot between the logarithms of scan rates (v) and log Ipa and Ipc showed a linear relationship with slope values of 0.49 and 0.51, respectively. The resulting values were consistent with those for purely diffusion-controlled currents [29]. This in turn suggests that the modified SPCE surface was not fouled, and the electrochemical process was diffusion controlled.
FTIR characterization was carried out for the characterization of the functionalized GO. Figure 3 illustrates the FTIR spectra of the original GO and EDC/NHS-activated GO. The bands at 1271 and 1258 cm−1 represent the C–O stretching (ether) of the original GO and activated GO, respectively. The peaks at 1132 and 1101 cm−1 were attributed to C–O stretching (alcohol) of the original and activated GO. C–H bending (aromatic) functional groups were observed in the 1792 and 1674 cm−1 peak positions. The broad band at 2669 cm−1 was attributed to O–H stretching of both GO types. The absorption peaks were more intense for activated GO than for the original GO. These factors contribute to the characteristics of GO, as reported by previous studies [30,31,32,33]. New bands were introduced at 1639, 1545 and 578 cm−1, corresponding to N–H stretching and C–N stretching of activated GO. This proves that the chemical modification resulted in amine groups that reacted with NHS. FTIR spectra revealed that GO functionalization of the amine-modified aptamer was complete.

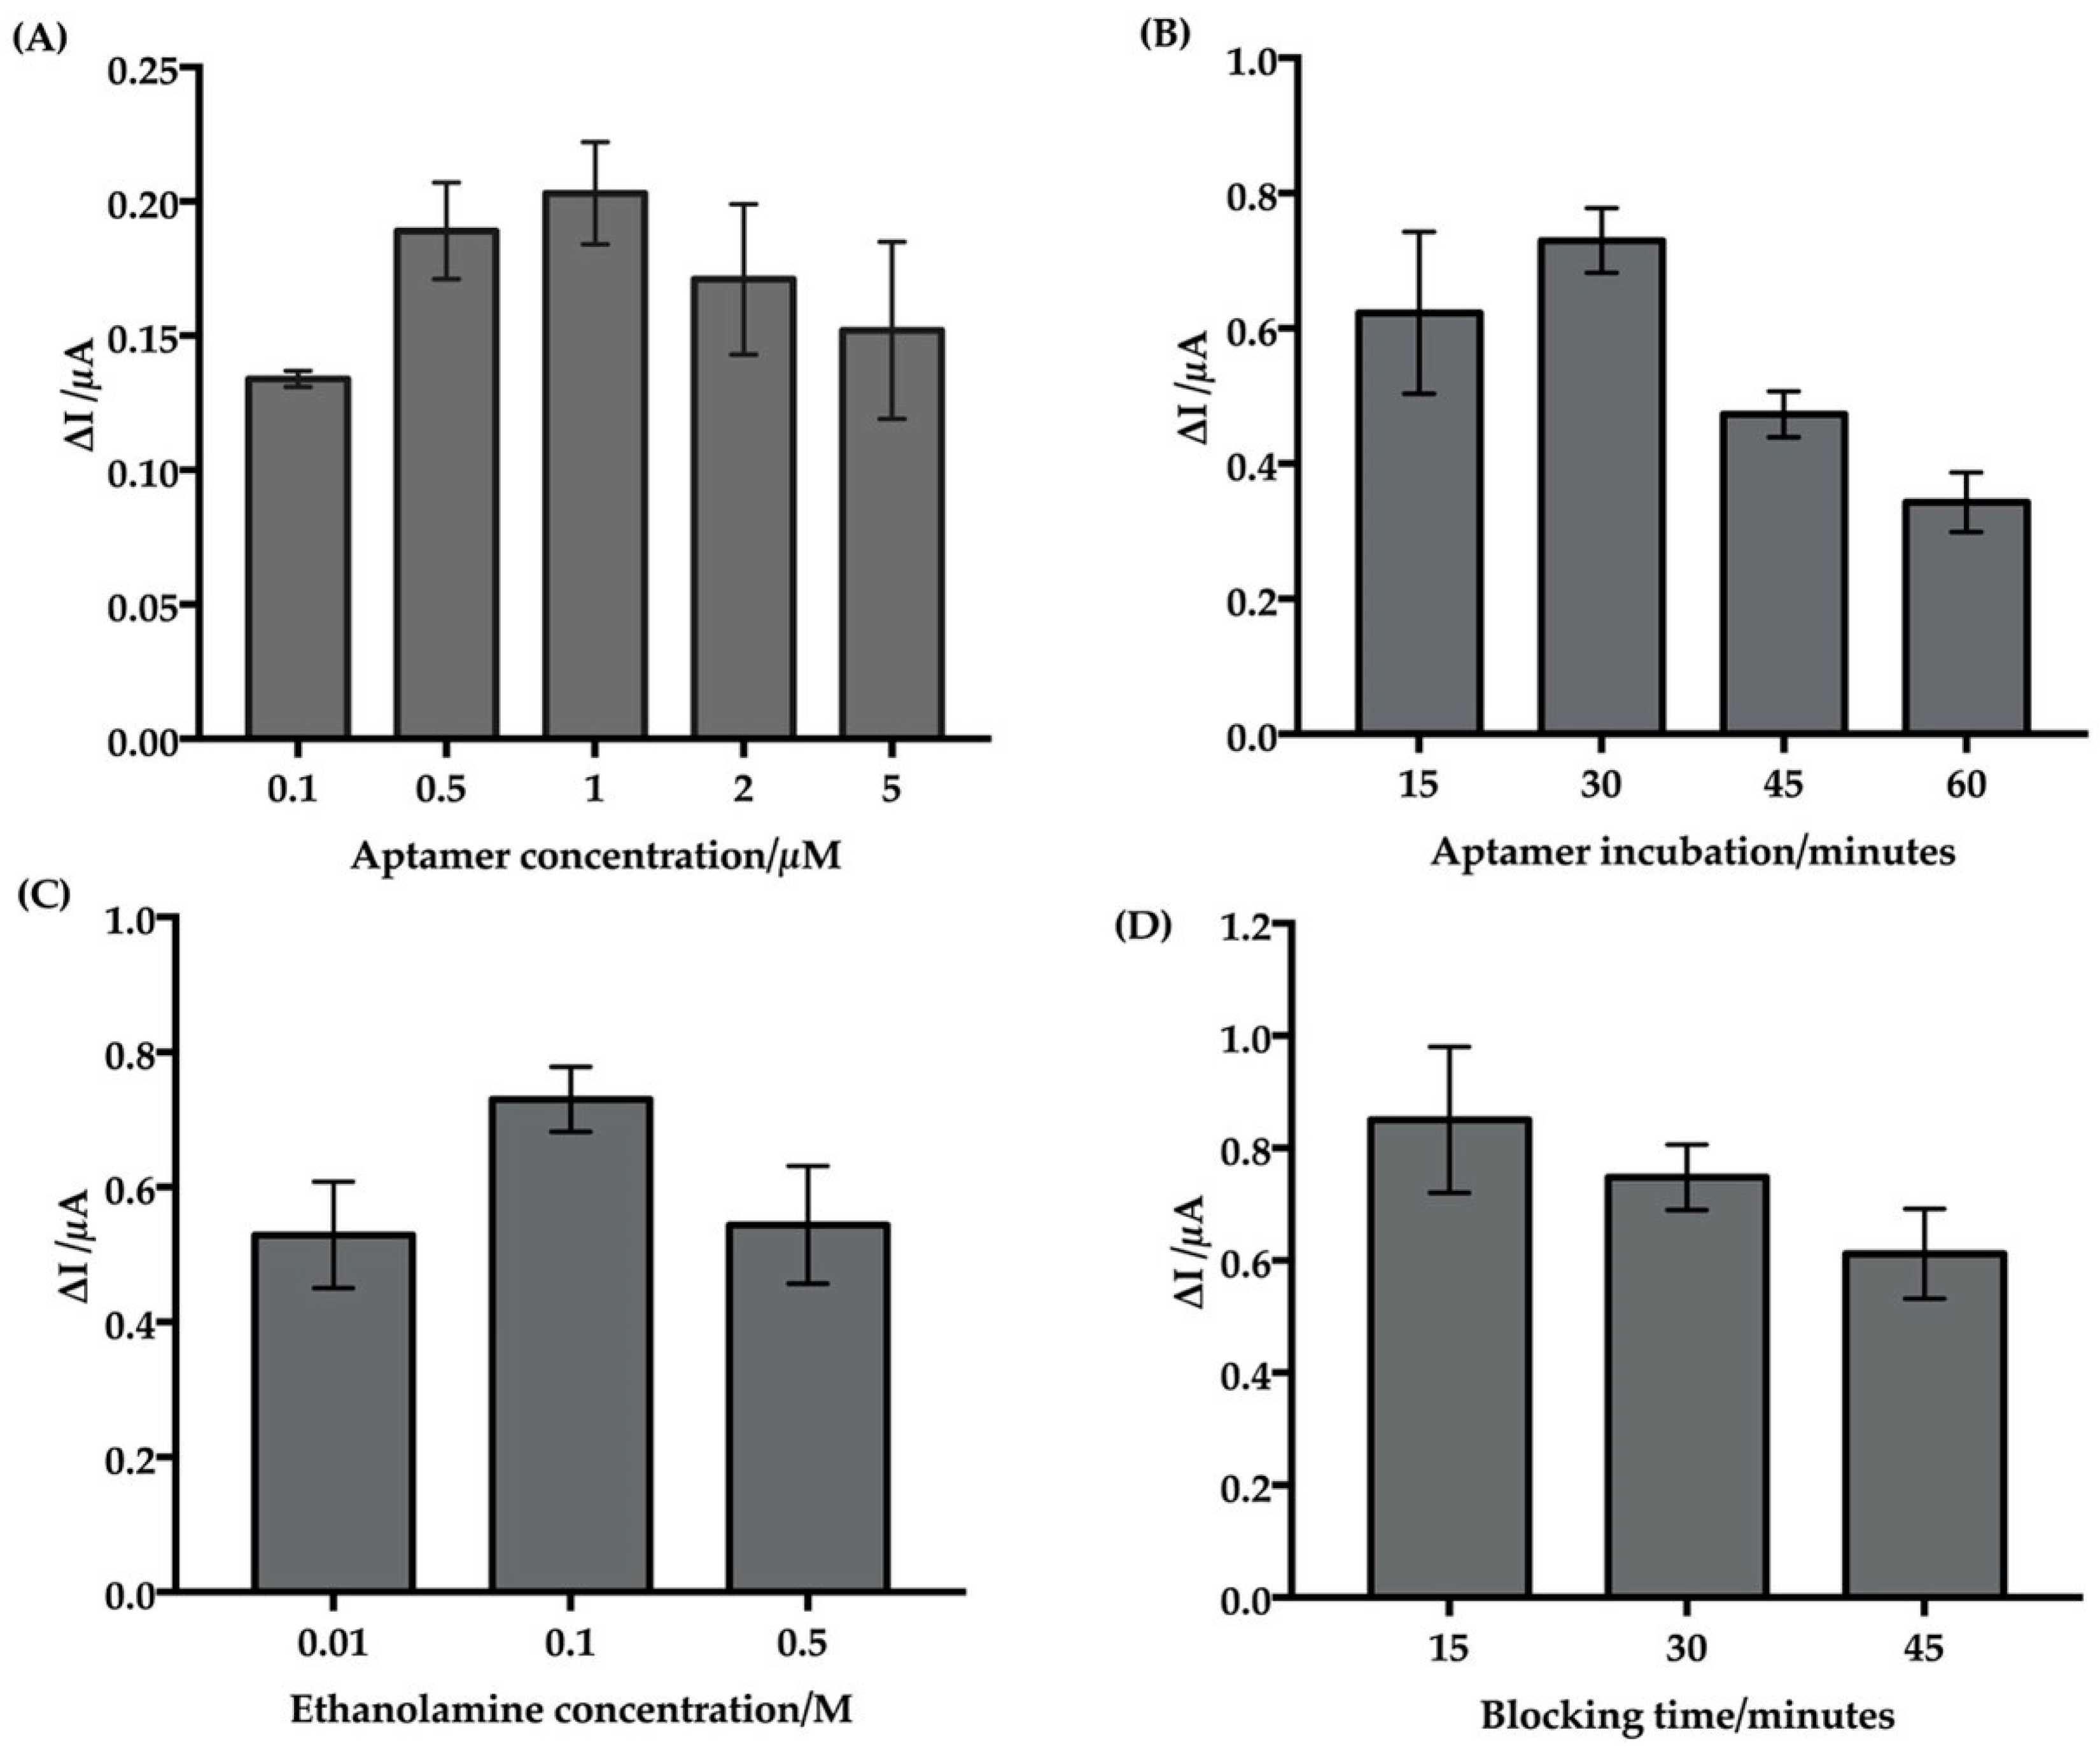
3.2. Optimization of the Electrochemical Aptasensor

During the development of the electrochemical aptasensor, both the concentration of GO and GO functionalization were optimized. Several conditions, including (1) measurement techniques, (2) concentration and incubation time for aptamer immobilization, (3) concentration and duration of blocking, and (4) the incubation time with the target solution, were optimized. The signal-to-noise ratio (SNR) was altered in CV because of the high background current (or noise) that masks the Faradaic current (signal) [34]. Among the voltammetric measurements, SWV enables faster analysis, lessens electrode surface fouling, and yields higher sensitivity, a lower detection limit, and greater discrimination of signal and background current [35]. Differential pulse voltammetry (DPV) offers advantages similar to those of SWV. EIS is useful for the characterization of surfaces, corrosion, batteries, and semiconductors. Faradic impedance spectrometry is used for biosensing of protein binding, such as antigen-antibody reactions [36,37]. Occasionally, non-specific impedance changes were observed in EIS and were unable to discriminate between specific and non-specific interactions [38]. Several other factors, such as repetitive measurements, electrode contamination, and additional voltammetric measurements, cause non-steady EIS signals [39]. According to its property of high sensitivity towards surface modification, EIS gave a false-positive reaction in our experiments. Certain concentrations of GA detected by three electrochemical techniques including. CV, DPV, and SWV were compared (Figure S2). SWV analysis was used for the detection of GA protein by our fabricated aptasensor.

3.2.1. Optimization of Aptamer Immobilization

Aptamer immobilization is critical for the development of electrochemical aptasensors. The secondary structure of the GA binding aptamer used in this study, which was predicted by the Mfold web server using 137 mM sodium (Na) and 1 mM magnesium (Mg) at both RT and 37 °C, is described in Figure S2. The GA aptamer formed a secondary structure with a large hairpin loop that plays a role in GA binding. It has a dissociation constant (KDa) of 5.78 µM [10]. The optimal folding temperature was predicted to be 37.3 °C. For the optimization of aptamer immobilization, different concentrations of aptamer (0.1 to 5 µM) were tested. Very low concentrations of aptamer (0.1 and 0.5 µM) could not provide an efficient electrochemical signal. Moreover, a high aptamer concentration, such as 5 µM, resulted in dense immobilization, leading to decreased sensitivity of the aptasensor. An aptamer concentration of 1 µM showed an appropriate signal and better sensitivity in the context of SWV current (Figure 4A). The reaction time for aptamer immobilization was optimized by ranging the incubation time from 15 to 60 min. The largest changes in SWV current were observed after 30 min of incubation for the detection of 10 µg mL−1 GA (Figure 4B). According to our SWV data, 30 min was used for immobilization of the aptamer. The shortened aptamer immobilization period facilitated the fabrication process and provided the great analytical performance of the aptasensor. TE buffer (1×, pH 8.2) was used to dilute the aptamer, and the experiments for aptamer immobilization were performed at room temperature.

3.2.2. Optimization of Blocking and Reaction Time

Normally, ethanolamine or 5% BSA is used to block the electrode. The use of BSA might interfere with our result. Therefore, ethanolamine was used as a blocking reagent in this study. Different concentrations of ethanolamine (0.5, 0.1, and 0.01 M) were screened for optimal concentrations. According to SWV results, using 0.1 M ethanolamine for blocking produced the largest current changes and most reproducible results (Figure 4C). Time required for blocking was also optimized. Blocking with 0.1 M ethanolamine for 15 min was enough to cover unbound aptamer on the sensor surface (Figure 4D). The incubation time for the target protein solution was optimized (data not shown). Incubation for less than 30 min was insufficient for aptamer and target binding. However, binding was achieved at 40 min with appropriate EIS and SWV signals.

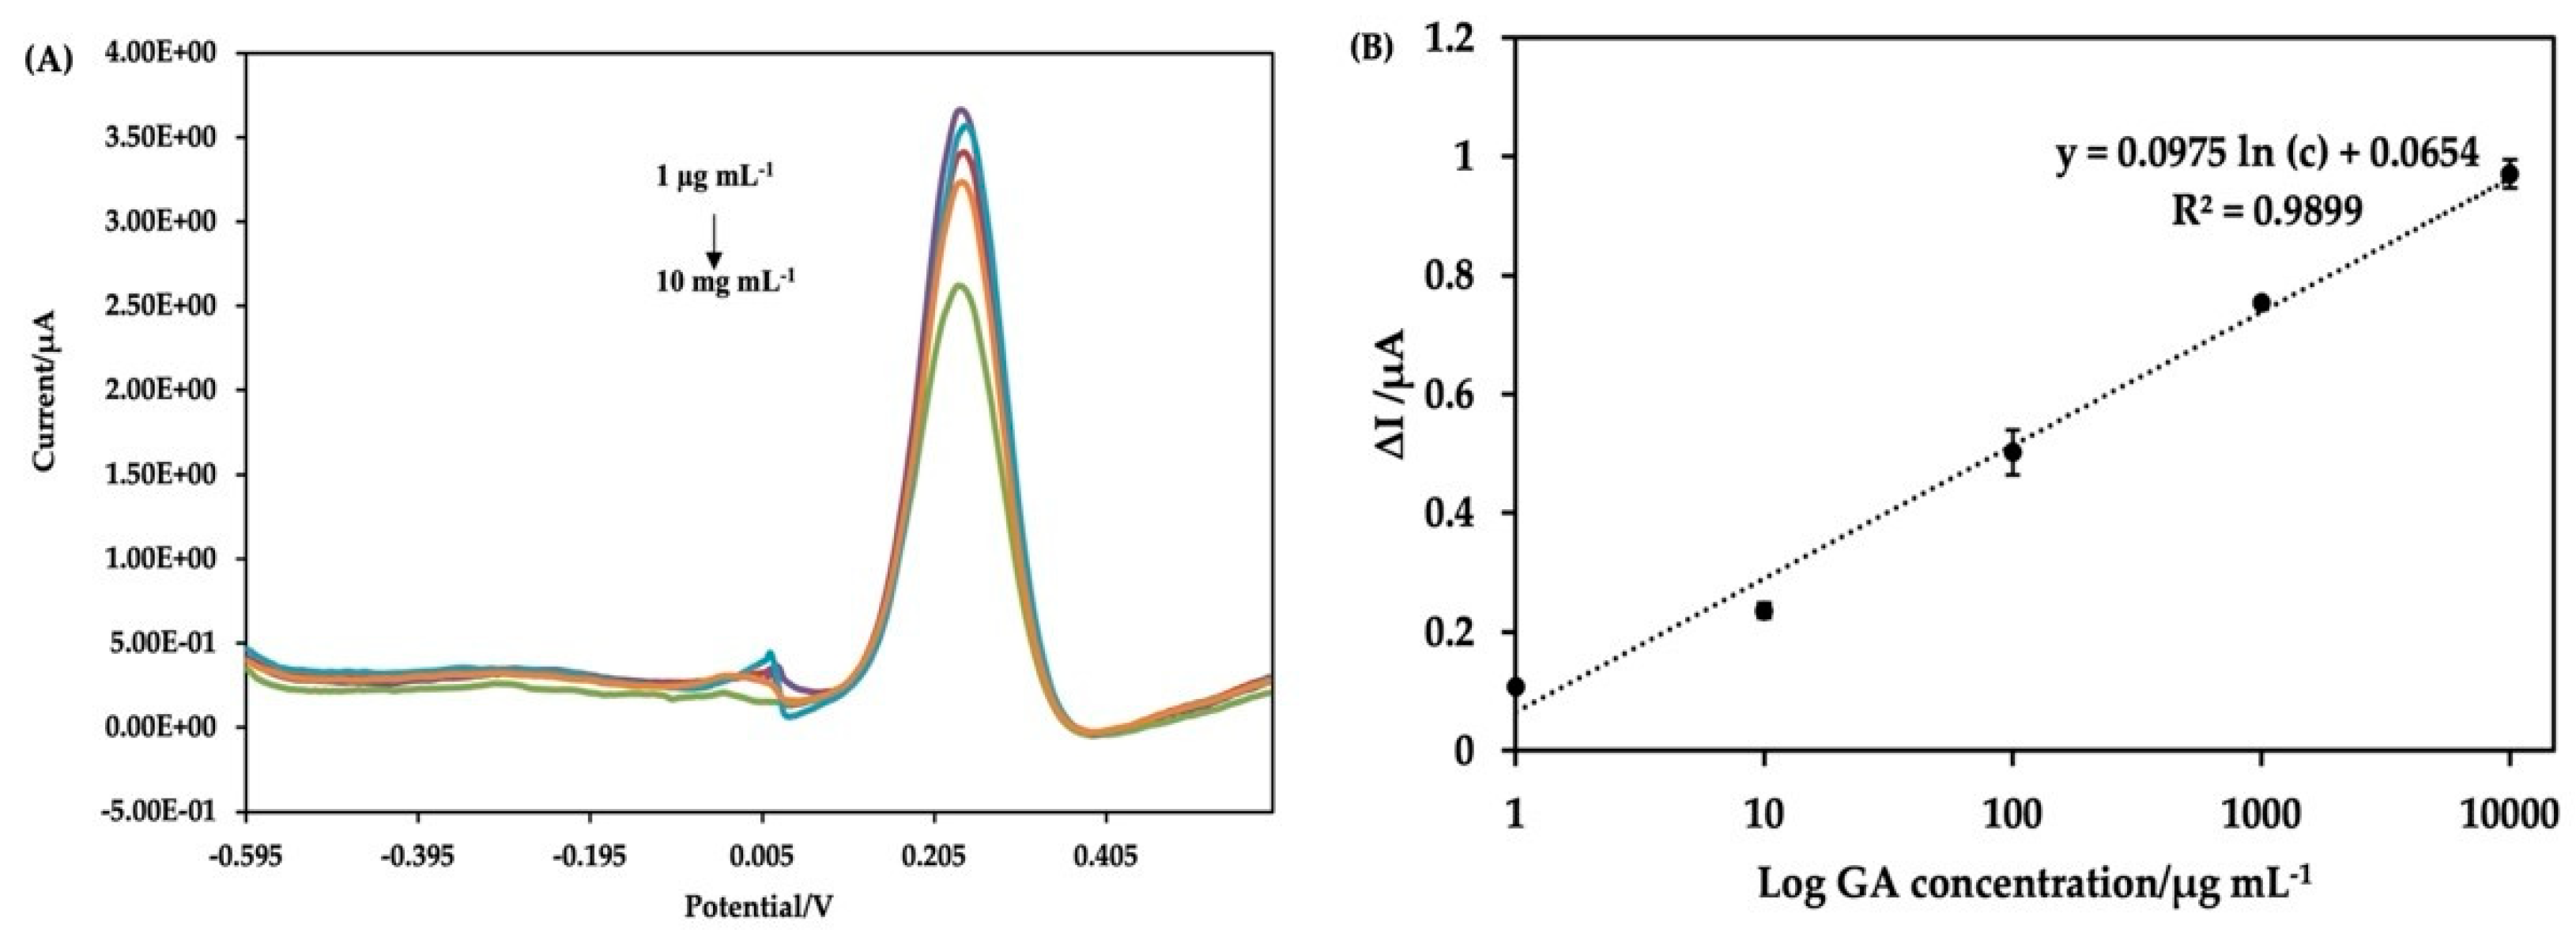
3.3. Analytical Performance of the Electrochemical Aptasensor

The analytical performance of the aptasensor was determined by calibration with various concentrations of GA (from 1 to 10,000 µg mL−1) under the optimal conditions. During the electrochemical measurements, the immobilized aptamer exhibits a free and steady assembly on the electrode surface, yielding a relatively significant current. When incubating the aptasensor with GA molecules, the aptamer changed the conformation for target binding. The captured GA-aptamer complex on the sensor surface acted as a blocking layer, hindering the electron transfer reaction, and thereby reducing the peak current. The decreasing SWV peak current signal was observed corresponding to increasing concentration of GA (Figure 5A). Electrochemical measurements were carried out before and after target binding with the aptamer. The SWV peak current change after sample incubation was calculated as ∆I = I0 − I1, where ∆I refers to the current change, and I0 and I1 represent the current before and after incubation with the target protein, respectively. In our experiment, a decrease in the maximum peak current was observed after GA treatment, confirming the efficient binding of GA by the aptasensor. The standard curve was plotted against the peak current change (µA) with the logarithm of the GA concentration (see Figure 5B). The current change increased with increasing GA concentration. A linear relationship between the logarithm of GA concentration and the current change was observed (I = 0.0975ln (c) + 0.0654), with a correlation coefficient (R2) of 0.9899 for GA detection over a range of 1–10,000 µg mL−1. The limit of detection (LOD) of GA was calculated by the formula LOD = 3σ/S, where σ is the standard deviation of the average measurement of the lowest concentration of GA and S is the slope of the regression line. Therefore, the calculated LOD of the experiment is 0.031 µg mL−1, which is sensitive enough to detect GA concentrations comparable with those of previous studies (Table 1). The normal range of GA was 0.2–7 mg mL−1 based on the method used [40]. The developed aptasensor is not only sensitive but also exhibits a broad linearity range (from 1 µg mL−1 to 1 × 10⁴ µg mL−1) in comparison with other studies (see Figure 6) Therefore, the developed aptasensor can confidently be applied for sensitive detection of both low and high GA levels in clinical samples not demanding 100-fold dilutions.

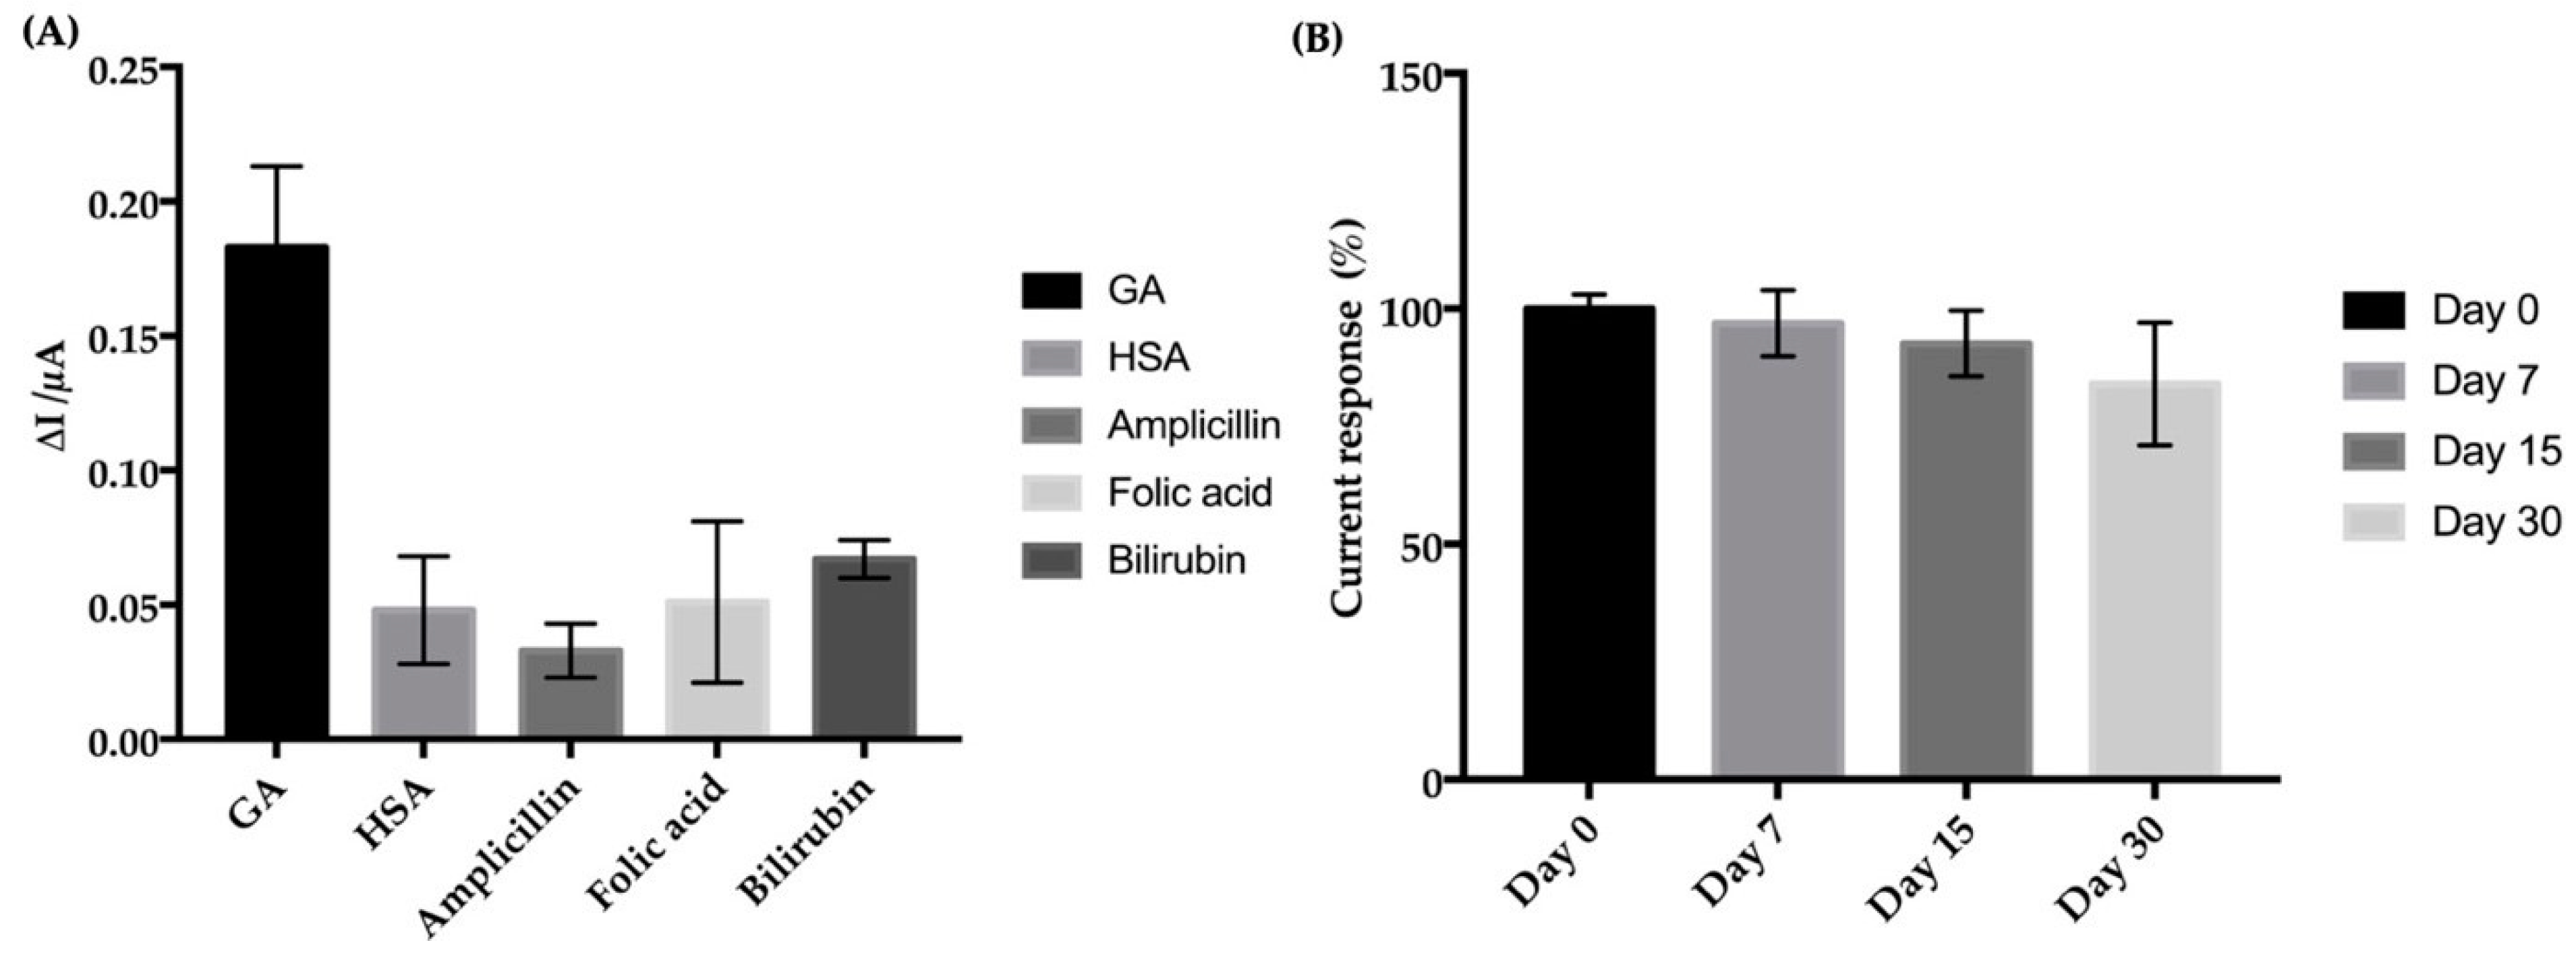
3.4. Specificity of the Electrochemical Aptasensor

Specificity testing is crucial for aptasensor fabrication, as non-specific interactions with other biomolecules would lead to a high background signal that diminishes the performance of the aptasensor. In our study, we tested the interference from proteins such as HSA (50 µg mL−1) as well as with other molecules such as glucose (250 mg dL−1), glycine (50 µg mL−1) and bilirubin (5 mg dL−1) and recommended drugs for drug interference testing in serum, including ampicillin (5 mg mL−1) [45] and folic acid (160 µg mL−1). The concentrations of drugs used were higher than their therapeutic levels in serum. The largest current change (0.183 ± 0.030 µA) was observed with 10 µg mL−1 GA protein. The cut-off for the detection of GA was 0.067 ± 0.001 µA. Meanwhile, small current changes were observed with HSA (0.048 ± 0.020 µA), folic acid (0.051 ± 0.030 µA), ampicillin (0.033 ± 0.010 µA) and bilirubin (0.067 ± 0.007 µA) indicating almost negligible interferences (Figure 6). There was no detectable signal with glucose or glycine, as there was no binding between the aptamer and these molecules (data not shown). The elimination of non-specific binding with HSA, the major limitation in most of the developed biosensors for GA detection [12,14] because of the very similar molecular structures of these two proteins, was solved in the proposed aptasensor. The interferences with high bilirubin levels were not detected in the assay. In contrast, the experimental results indicate that the developed aptasensor exhibit high specificity for the detection of GA.

3.5. Reproducibility and Stability of the Electrochemical Aptasensor

For reproducibility testing, all the experiments were repeated for 20 independent studies detecting three different concentrations of GA (10 mg mL−1, 1 mg mL−1 and 0 mg mL−1). The relative standard deviations (RSDs) obtained were 2.5%, 2.1% and 1.6%, respectively. The RSD is lower than the acceptable value (less than 10%) [46] and reported RSDs (6.5% and 9.88%) of other aptasensors [12,14]. This result indicates that the aptasensor can generate highly reproducible electrochemical signals. Moreover, consistency of aptamer immobilization on the electrode surface was observed. The simple layer-by-layer fabrication process enhances the reproducibility of the aptasensor.
The stability of the proposed aptasensor was investigated by using SWV current responses. The developed aptasensor was kept in the refrigerator at 4 °C and used for the determination of 500 µg mL−1 GA protein. After storage for 7, 15 and 30 days, the aptasensor retained 97%, 92% and 84% of its original response current, respectively (Figure 6B). The proposed aptasensor showed desirable stability towards GA detection. The stability was enhanced compared to that observed with another biosensor [14]. The improved stability and reproducibility of the aptasensor intensify the utility of the aptasensor.

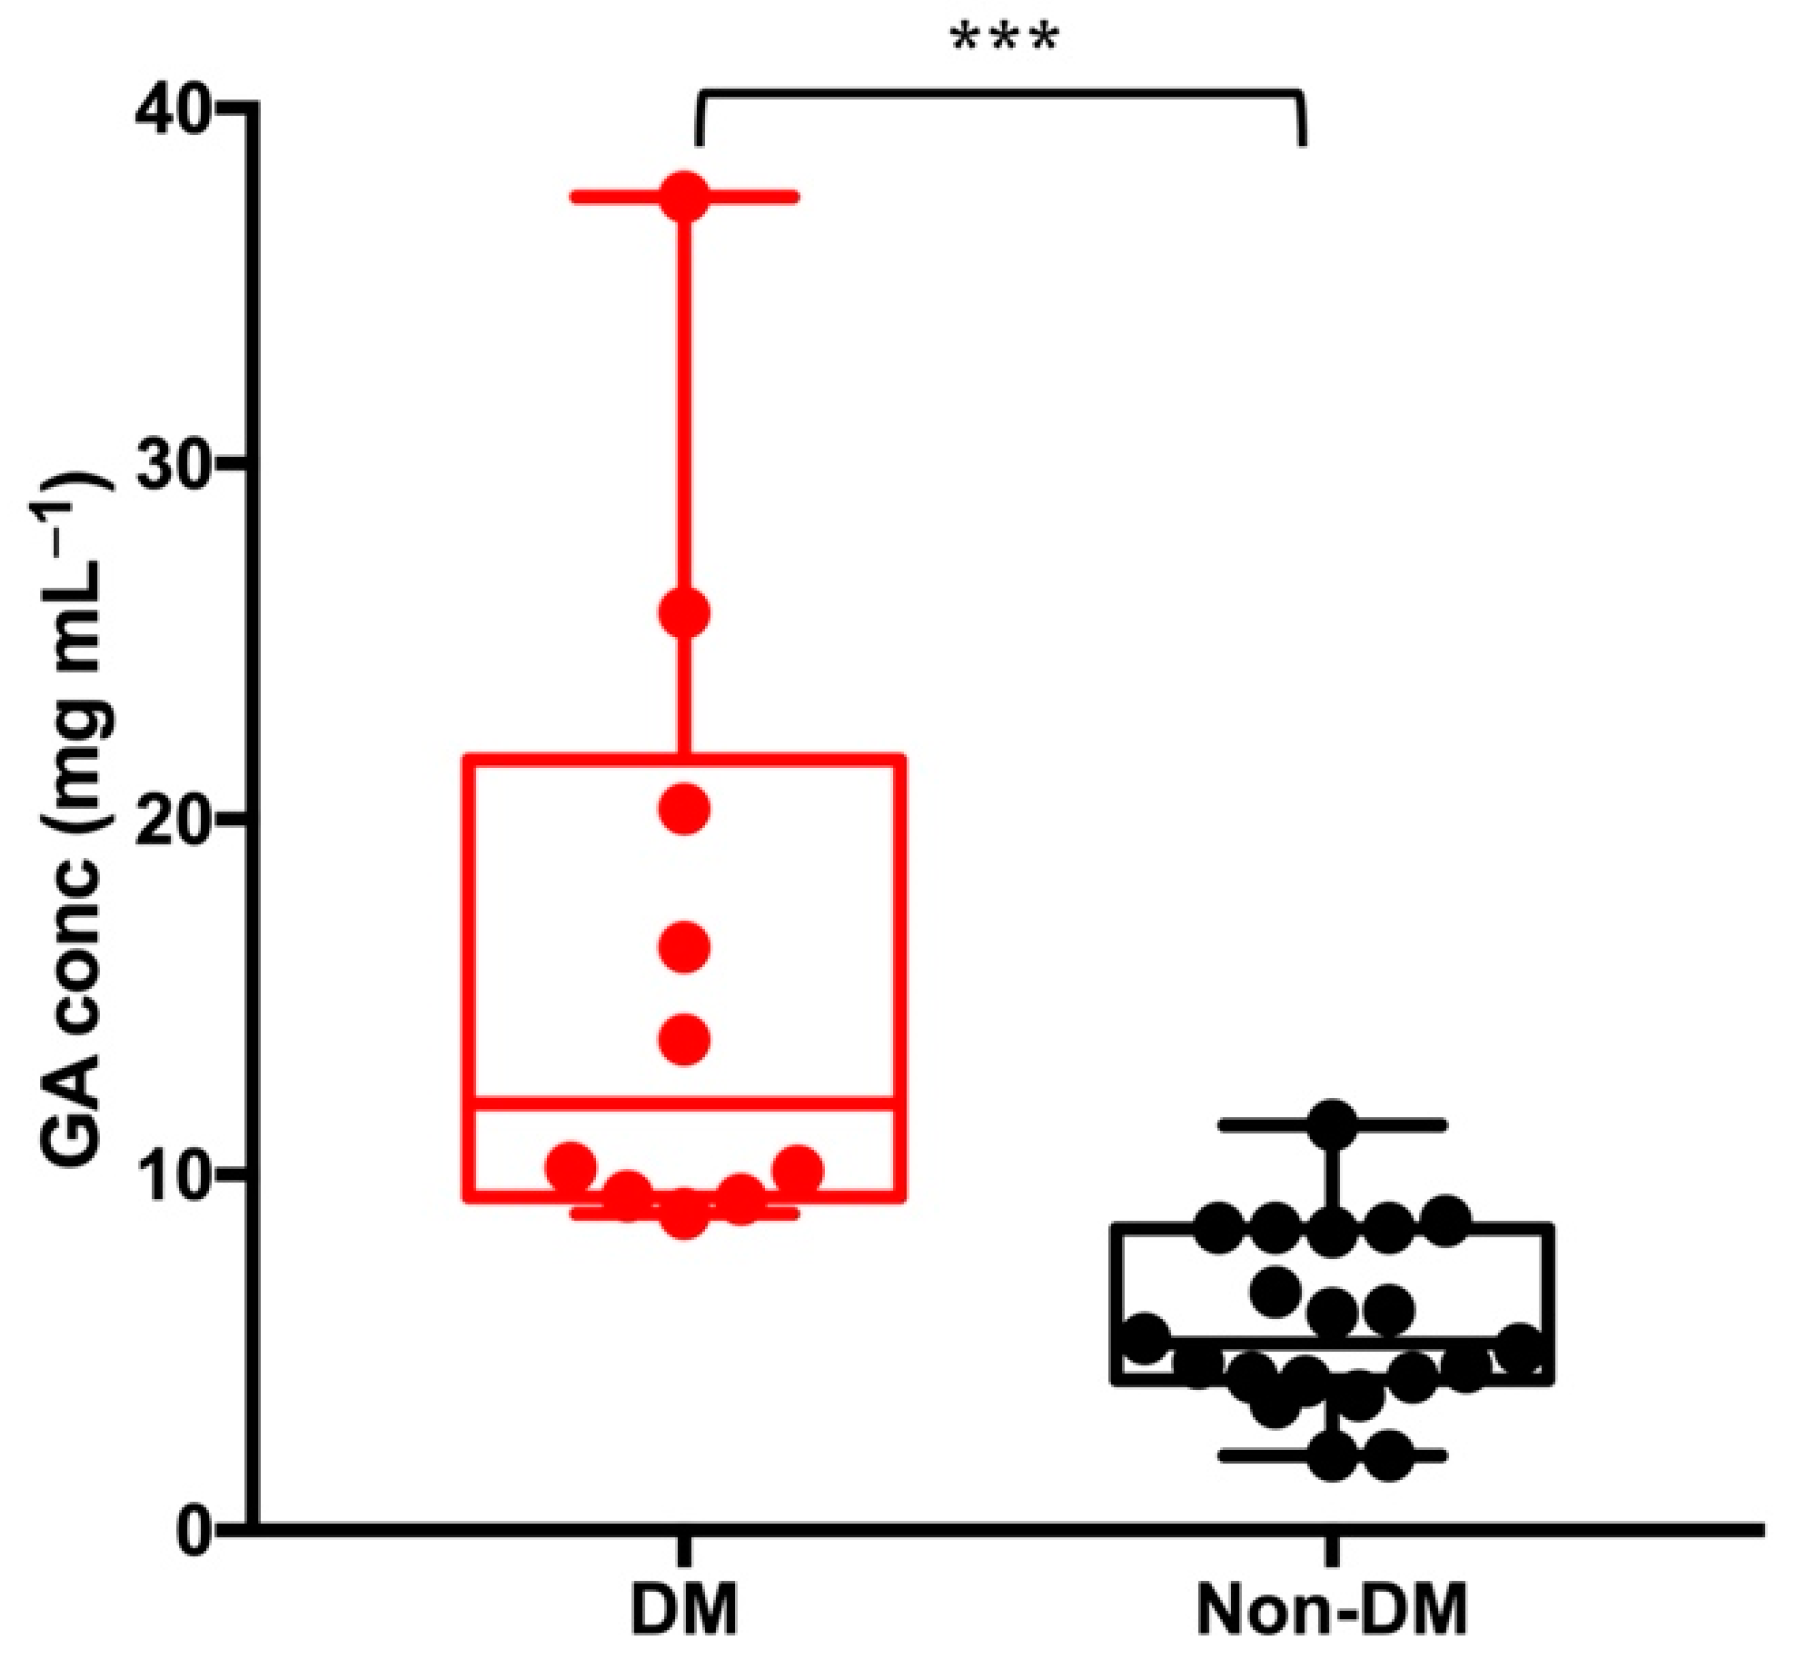
3.6. Clinical Sample Analysis

The analytical performance of the fabricated electrochemical aptasensor was evaluated with respect to GA detection in clinical samples by using spiked normal human serum. Prior to performing analysis in spiked serum, the optimal dilution of serum was investigated. Serum was diluted from 1:1 to 1:1000 with PBS buffer (pH 7.4). Sigmoidal increasing current changes were observed with decreasing dilution from 1:1000 to undiluted serum (Figure S3). A 1:1000 dilution was chosen because there was little interference from other serum proteins. Different concentrations of GA protein were spiked into the diluted serum. The concentrations of spiked GA were 49.5 and 233 µg mL−1. The recovery rates were 98.7% and 92.2%, respectively (see Table 2), which were within the acceptable range. RSD values were 2.1% and 2.6%. The recover assay in complex samples renders the high selectivity of the aptasensor toward GA detection supporting the data provided in Section 3.4. The accuracy and selectivity of the aptasensor signified the utility and reliability of the aptasensor. Therefore, the developed aptasensor can be applied as a potential tool for GA detection in real clinical samples.
For the practicality of the aptasensor for diagnostic purposes, GA concentrations in all serum samples were determined using our developed aptasensor. The GA concentrations in diabetic sera were significantly higher than that in non-diabetic sera: the values ranged from 8.9–37.5 mg mL−1 and 2.1–11.4 mg mL−1 in diabetic and non-diabetic serum, respectively (Table 3). The data were shown to be normally distributed using normal quantile plots and excess kurtosis calculations. The data were analyzed by using an independent two-sample t-test, resulting in a statistically significant difference between the two groups at a 95% confidence interval (p < 0.001) (Figure 7). The normal GA concentrations reported by this study was comparable with reference values reported by the enzymatic method [40]. Moreover, the concentrations of GA detected in both diabetic and non-diabetic sera were significantly correlated with other glycemic markers such as HbA1c, fructosamines and fasting blood sugar (Table S1). In this study, a relatively low sample volume (7 µL) was needed thus reducing the burden of sample collection for clinical use. These results imply that the GA detected by the aptasensor was trustworthy and the proposed electrochemical aptasensor is promising for the analytical determination of GA levels for glycemic monitoring.

3.7. Within-Run and Between-Run Coefficients of Variations (CVs)

Serum samples with high and normal concentrations of GA were used to determine the between-run CV analysis by repeating the experiments on 10 different days. The calculated %CV for between-run assay were 1.9% and 6.5% corresponding to high and normal concentrations of GA. In within-run assay, the GA concentrations were measured in triplicate for 30 samples and the average %CV of the samples is 2.5%. The within-run and between-run coefficient of variations of this method is lower than the acceptable value of less than 10% [46].

3.8. Method Comparison with a Commercial ELISA Kit in Clinical Samples

The method developed was compared for the detection of GA in clinical samples using a commercially available ELISA kit. Three samples from non-DM population (samples 1–3) and two DM samples (sample 4,5) were tested with both aptasensor and ELISA assay. At the 95 % confident interval, the calculated values of student’s t-test (p = 0.05) and F-test were less than their tabulated values, implying that there was no noticeable difference between the performance of the two compared methods (Table 4). Therefore, the developed electrochemical aptasensor showed a satisfactory accuracy for GA detection in clinical utility.

4. Conclusions

In conclusion, a simple electrochemical aptasensor was developed for the sensitive and rapid detection of GA. The overall aptasensor fabrication process is relatively simple, excluding the necessity of nanomaterials other than GO, carboxylation treatment, chemical pre-treatment of SPCEs, prolonged incubation of aptamer and GO and the labelling of redox probes to aptamer, thereby making it possible to take advantage of other fabrication methods. The developed aptasensor, with a broad linearity over 1 to 10,000 µg mL−1 and a relatively low LOD (0.031 µg mL−1), offers several benefits, such as selectivity, reproducibility, stability, and affordability of the aptasensor as compared with the previously reported methods for GA detection. The analytical performance (recovery, within-run and between-run CV) of this method support the great quality of the aptasensor. In addition, the excellent application of the developed aptasensor in clinical samples has intensified its practicality as a potential device for GA measurements in the screening and monitoring of diabetes mellitus with or without thalassemia. Moreover, the validation of the method developed with a commercial ELISA method verified the reliability of the aptasensor with high accuracy. The method proposed in this study may also be applied for the development of an electrochemical aptasensor for the detection of other biomolecules.

Supplementary Materials

The following are available online at https://www.mdpi.com/article/10.3390/app112110315/s1, Supplementary data associated with this article involved Figure S1: (A) Cyclic voltammograms of GO/SPCEs at different scan rates from 10 to 300 mVs−1 using 5 mM [Fe (CN6)]4–/3– in PBS as redox probe, (B) plot between anodic and cathodic peak current vs. square root of the scan rate (v), Figure S2: Different electrochemical measurements (DPV, SWV, CV) were applied for the detection of different concentrations of GA (10–10,000 µg mL−1). Figure S3: Secondary structure of GA binding aptamer with dG −0.586 kcal/mol predicted at 37 °C under 137 mM sodium (Na) and 1mM magnesium (Mg) concentration, and Figure S4: Application of the electrochemical aptasensor to human serum for determination of the optimal dilution of serum. Table S1: Correlation between GA detected by aptasensor with other glycemic parameters including HbA1c, Fructosamines and Fating blood sugar (FBS).

Author Contributions

Conceptualization, N.N.S.A. and J.D.; Formal Analysis, N.N.S.A.; Investigation, N.N.S.A.; Methodology, N.N.S.A.; Supervision, J.D.; Writing—Original Draft, N.N.S.A.; Writing—Review and Editing, N.N.S.A., P.M., R.T., A.C., P.B., S.D., N.T., P.P., V.A. and J.D. All authors have read and agreed to the published version of the manuscript.

Funding

This research is supported by Research and Academic Service grant no. RI62-09.

Institutional Review Board Statement

The study was conducted in accordance with the Declaration of Helsinki, and the protocol was approved by the Centre for Ethics in Human Research, Khon Kaen University with the ethical approval number HE641192.

Informed Consent Statement

Informed consent was obtained from all subjects involved in the study.

Data Availability Statement

Data sharing not applicable.

Acknowledgments

The author would like to appreciate Khon Kaen University ASEAN-GMS scholarship and financial supported from Research and Academic Service grant no. RI62-09.

Conflicts of Interest

The authors declare no conflict of interest.

References

  1. Saeedi, P.; Petersohn, I.; Salpea, P.; Malanda, B.; Karuranga, S.; Unwin, N.; Colagiuri, S.; Guariguata, L.; Motala, A.A.; Ogurtsova, K. Global and Regional Diabetes Prevalence Estimates for 2019 and Projections for 2030 and 2045: Results from the International Diabetes Federation Diabetes Atlas. Diabetes Res. Clin. Pract. 2019, 157, 107843. [Google Scholar] [CrossRef] [Green Version]
  2. Cho, N.H.; Shaw, J.E.; Karuranga, S.; Huang, Y.; da Rocha Fernandes, J.D.; Ohlrogge, A.W.; Malanda, B. IDF Diabetes Atlas: Global Estimates of Diabetes Prevalence for 2017 and Projections for 2045. Diabetes Res. Clin. Pract. 2018, 138, 271–281. [Google Scholar] [CrossRef] [PubMed]
  3. Koga, M.; Hashimoto, K.; Murai, J.; Saito, H.; Mukai, M.; Ikegame, K.; Ogawa, H.; Kasayama, S. Usefulness of Glycated Albumin as an Indicator of Glycemic Control Status in Patients with Hemolytic Anemia. Clin. Chim. Acta 2011, 412, 253–257. [Google Scholar] [CrossRef] [PubMed]
  4. Danese, E.; Montagnana, M.; Nouvenne, A.; Lippi, G. Advantages and Pitfalls of Fructosamine and Glycated Albumin in the Diagnosis and Treatment of Diabetes. J. Diabetes Sci. Technol. 2015, 9, 169–176. [Google Scholar] [CrossRef] [Green Version]
  5. Roohk, H.V.; Zaidi, A.R. A Review of Glycated Albumin as an Intermediate Glycation Index for Controlling Diabetes. J. Diabetes Sci. Technol. 2008, 2, 1114–1121. [Google Scholar] [CrossRef] [Green Version]
  6. Rondeau, P.; Bourdon, E. The Glycation of Albumin: Structural and Functional Impacts. Biochimie 2011, 93, 645–658. [Google Scholar] [CrossRef] [PubMed]
  7. Hinton, D.J.S.; Ames, J.M. Analysis of Glycated Protein by Capillary Electrophoresis. Int. Congr. Ser. 2002, 1245, 471–474. [Google Scholar] [CrossRef]
  8. Zhernovaya, O.S.; Tuchin, V.V.; Meglinski, I.V. Monitoring of Blood Proteins Glycation by Refractive Index and Spectral Measurements. Laser Phys. Lett. 2008, 5, 460. [Google Scholar] [CrossRef]
  9. Dingari, N.C.; Horowitz, G.L.; Kang, J.W.; Dasari, R.R.; Barman, I. Raman Spectroscopy Provides a Powerful Diagnostic Tool for Accurate Determination of Albumin Glycation. PLoS ONE 2012, 7, e32406. [Google Scholar] [CrossRef] [Green Version]
  10. Apiwat, C.; Luksirikul, P.; Kankla, P.; Pongprayoon, P.; Treerattrakoon, K.; Paiboonsukwong, K.; Fucharoen, S.; Dharakul, T.; Japrung, D. Graphene Based Aptasensor for Glycated Albumin in Diabetes Mellitus Diagnosis and Monitoring. Biosens. Bioelectron. 2016, 82, 140–145. [Google Scholar] [CrossRef]
  11. Sasar, M.; Farzadfard, A.; Abdi, Y.; Habibi-Rezaei, M. Detection of Glycated Albumin Using a Novel Field Effect Aptasensor. IEEE Sens. J. 2020, 20, 10387–10392. [Google Scholar] [CrossRef]
  12. Bunyarataphan, S.; Dharakul, T.; Fucharoen, S.; Paiboonsukwong, K.; Japrung, D. Glycated Albumin Measurement Using an Electrochemical Aptasensor for Screening and Monitoring of Diabetes Mellitus. Electroanalysis 2019, 31, 2254–2261. [Google Scholar] [CrossRef]
  13. Farzadfard, A.; Shayeh, J.S.; Habibi-Rezaei, M.; Omidi, M. Modification of Reduced Graphene/Au-Aptamer to Develop an Electrochemical Based Aptasensor for Measurement of Glycated Albumin. Talanta 2020, 211, 120722. [Google Scholar] [CrossRef]
  14. Waiwinya, W.; Putnin, T.; Pimalai, D.; Chawjiraphan, W.; Sathirapongsasuti, N.; Japrung, D. Immobilization-Free Electrochemical Sensor Coupled with a Graphene-Oxide-Based Aptasensor for Glycated Albumin Detection. Biosensors 2021, 11, 85. [Google Scholar] [CrossRef] [PubMed]
  15. Pereira Morais, M.P.; Kassaar, O.; Flower, S.E.; Williams, R.J.; James, T.D.; van den Elsen, J.M.H. Analysis of protein glycation using phenylboronate acrylamide gel electrophoresis. In Electrophoretic Separation of Proteins: Methods and Protocols; Kurien, B.T., Scofield, R.H., Eds.; Methods in Molecular Biology; Springer: New York, NY, USA, 2019; pp. 161–175. ISBN 978-1-4939-8793-1. [Google Scholar]
  16. Gopinath, S.C.B. Aptamers. In Encyclopedia of Analytical Chemistry; American Cancer Society: Newark, NJ, USA, 2016; pp. 1–33. ISBN 978-0-470-02731-8. [Google Scholar]
  17. Toh, S.Y.; Citartan, M.; Gopinath, S.C.B.; Tang, T.-H. Aptamers as a Replacement for Antibodies in Enzyme-Linked Immunosorbent Assay. Biosens. Bioelectron. 2015, 64, 392–403. [Google Scholar] [CrossRef]
  18. Ahmed, M.U.; Hossain, M.M.; Tamiya, E. Electrochemical Biosensors for Medical and Food Applications. Electroanalysis 2008, 20, 616–626. [Google Scholar] [CrossRef]
  19. Hasanzadeh, M.; Shadjou, N.; de la Guardia, M. Aptamer-Based Assay of Biomolecules: Recent Advances in Electro-Analytical Approach. TrAC Trends Anal. Chem. 2017, 89, 119–132. [Google Scholar] [CrossRef]
  20. Reich, P.; Preuß, J.-A.; Bahner, N.; Bahnemann, J. Impedimetric aptamer-based biosensors: Principles and techniques. In Aptamers in Biotechnology; Urmann, K., Walter, J.-G., Eds.; Advances in Biochemical Engineering/Biotechnology; Springer International Publishing: Cham, Switzerland, 2020; pp. 17–41. ISBN 978-3-030-54061-6. [Google Scholar]
  21. Rao, C.N.R.; Sood, A.K.; Subrahmanyam, K.S.; Govindaraj, A. Graphene: The New Two-Dimensional Nanomaterial. Angew. Chem. Int. Ed. 2009, 48, 7752–7777. [Google Scholar] [CrossRef]
  22. Settu, K.; Liu, J.-T.; Chen, C.-J.; Tsai, J.-Z. Development of Carbon−graphene-Based Aptamer Biosensor for EN2 Protein Detection. Anal. Biochem. 2017, 534, 99–107. [Google Scholar] [CrossRef]
  23. Hermanson, G.T. (Ed.) Chapter 3—The reactions of bioconjugation. In Bioconjugate Techniques, 3rd ed.; Academic Press: Boston, MA, USA, 2013; pp. 229–258. ISBN 978-0-12-382239-0. [Google Scholar]
  24. Staros, J.V.; Wright, R.W.; Swingle, D.M. Enhancement by N-Hydroxysulfosuccinimide of Water-Soluble Carbodiimide-Mediated Coupling Reactions. Anal. Biochem. 1986, 156, 220–222. [Google Scholar] [CrossRef]
  25. Janolino, V.G.; Swaisgood, H.E. Analysis and Optimization of Methods Using Water-Soluble Carbodiimide for Immobilization of Biochemicals to Porous Glass. Biotechnol. Bioeng. 1982, 24, 1069–1080. [Google Scholar] [CrossRef]
  26. Vashist, S.K.; Luong, J.H. Recent Advances in Electrochemical Biosensing Schemes Using Graphene and Graphene-Based Nanocomposites. Carbon 2015, 84, 519–550. [Google Scholar] [CrossRef]
  27. Kanyong, P.; Rawlinson, S.; Davis, J. A Voltammetric Sensor Based on Chemically Reduced Graphene Oxide-Modified Screen-Printed Carbon Electrode for the Simultaneous Analysis of Uric Acid, Ascorbic Acid and Dopamine. Chemosensors 2016, 4, 25. [Google Scholar] [CrossRef] [Green Version]
  28. Kanyong, P.; Krampa, F.D.; Aniweh, Y.; Awandare, G.A. Polydopamine-Functionalized Graphene Nanoplatelet Smart Conducting Electrode for Bio-Sensing Applications. Arab. J. Chem. 2020, 13, 1669–1677. [Google Scholar] [CrossRef]
  29. Cyclic Voltammetry; Simulation and Analysis of Reaction Mechanisms. Synth. React. Inorg. Met.-Org. Chem. 1994, 24, 1237–1238. [CrossRef]
  30. Shan, C.; Yang, H.; Song, J.; Han, D.; Ivaska, A.; Niu, L. Direct Electrochemistry of Glucose Oxidase and Biosensing for Glucose Based on Graphene. Anal. Chem. 2009, 81, 2378–2382. [Google Scholar] [CrossRef]
  31. Stankovich, S.; Piner, R.D.; Chen, X.; Wu, N.; Nguyen, S.T.; Ruoff, R.S. Stable Aqueous Dispersions of Graphitic Nanoplatelets via the Reduction of Exfoliated Graphite Oxide in the Presence of Poly(Sodium 4-Styrenesulfonate). J. Mater. Chem. 2006, 16, 155–158. [Google Scholar] [CrossRef]
  32. Shan, C.; Yang, H.; Han, D.; Zhang, Q.; Ivaska, A.; Niu, L. Water-Soluble Graphene Covalently Functionalized by Biocompatible Poly-L-Lysine. Langmuir 2009, 25, 12030–12033. [Google Scholar] [CrossRef] [PubMed]
  33. Tertiş, M.; Hosu, O.; Fritea, L.; Farcau, C.; Cernat, A.; Săndulescu, R.; Cristea, C. A Novel Label-Free Immunosensor Based on Activated Graphene Oxide for Acetaminophen Detection. Electroanalysis 2015, 27, 638–647. [Google Scholar] [CrossRef]
  34. Xu, H.; Mao, X.; Zeng, Q.; Wang, S.; Kawde, A.-N.; Liu, G. Aptamer-Functionalized Gold Nanoparticles as Probes in a Dry-Reagent Strip Biosensor for Protein Analysis. Anal. Chem. 2009, 81, 669–675. [Google Scholar] [CrossRef]
  35. Brett, C.M.A.; Brett, A.M.O. Electrochemistry: Principles, Methods, and Applications; Oxford Science Publications; Oxford University Press: Oxford, UK; New York, NY, USA, 1993; ISBN 978-0-19-855389-2. [Google Scholar]
  36. Dijksma, M.; Kamp, B.; Hoogvliet, J.C.; Van Bennekom, W.P. Development of an Electrochemical Immunosensor for Direct Detection of Interferon-γ at the Attomolar Level. Anal. Chem. 2001, 73, 901–907. [Google Scholar] [CrossRef]
  37. Bardea, A.; Katz, E.; Willner, I. Biosensors with Amperometric Detection of Enzymatically Controlled PH-Changes. Electroanalysis 2000, 12, 731–735. [Google Scholar] [CrossRef]
  38. Bogomolova, A.; Komarova, E.; Reber, K.; Gerasimov, T.; Yavuz, O.; Bhatt, S.; Aldissi, M. Challenges of Electrochemical Impedance Spectroscopy in Protein Biosensing. Anal. Chem. 2009, 81, 3944–3949. [Google Scholar] [CrossRef]
  39. Li, L.; Zhao, H.; Chen, Z.; Mu, X.; Guo, L. Aptamer Biosensor for Label-Free Square-Wave Voltammetry Detection of Angiogenin. Biosens. Bioelectron. 2011, 30, 261–266. [Google Scholar] [CrossRef]
  40. Kohzuma, T.; Yamamoto, T.; Uematsu, Y.; Shihabi, Z.K.; Freedman, B.I. Basic Performance of an Enzymatic Method for Glycated Albumin and Reference Range Determination. J. Diabetes Sci. Technol. 2011, 5, 1455–1462. [Google Scholar] [CrossRef] [Green Version]
  41. Inoue, Y.; Inoue, M.; Saito, M.; Yoshikawa, H.; Tamiya, E. Sensitive Detection of Glycated Albumin in Human Serum Albumin Using Electrochemiluminescence. Anal. Chem. 2017, 89, 5909–5915. [Google Scholar] [CrossRef]
  42. Ghosh, S.; Datta, D.; Cheema, M.; Dutta, M.; Stroscio, M.A. Aptasensor Based Optical Detection of Glycated Albumin for Diabetes Mellitus Diagnosis. Nanotechnology 2017, 28, 435505. [Google Scholar] [CrossRef]
  43. Reed, P.; Bhatnagar, D.; Dhar, H.; Winocour, P.H. Precise Measurement of Glycated Serum Albumin by Column Affinity Chromatography and Immunoturbidimetry. Clin. Chim. Acta 1986, 161, 191–199. [Google Scholar] [CrossRef]
  44. Kim, A.-R.; Choi, Y.; Kim, S.-H.; Moon, H.-S.; Ko, J.-H.; Yoon, M.-Y. Development of a Novel SsDNA Sequence for a Glycated Human Serum Albumin and Construction of a Simple Aptasensor System Based on Reduced Graphene Oxide (RGO). Biosensors 2020, 10, 141. [Google Scholar] [CrossRef]
  45. Sonntag, O.; Scholer, A. Drug Interference in Clinical Chemistry: Recommendation of Drugs and Their Concentrations to Be Used in Drug Interference Studies. Ann. Clin. Biochem. 2001, 38, 376–385. [Google Scholar] [CrossRef] [Green Version]
  46. Karnes, H.T.; March, C. Precision, Accuracy, and Data Acceptance Criteria in Biopharmaceutical Analysis. Pharm. Res. 1993, 10, 1420–1426. [Google Scholar] [CrossRef]
Figure 1. Schematic illustration of the proposed GO-based electrochemical aptasensor for GA protein detection. (a) Functionalization of GO; (b) drop-coating GO onto SPCEs; (c) immobilization of NH2 aptamer; (d) blocking with ethanolamine; (e) incubation with GA protein; (f) voltametric measurements using 5 mM [Fe (CN)6]4–/3– as a redox indicator.
Applsci 11 10315 g001
Figure 2. (A) Cyclic voltammograms of Bare SPCEs, GO–SPCEs showing successful immobilization of each layer. (B) EIS spectra of Bare SPCEs, GO-SPCEs, aptamer/GO–SPCEs, and GA/aptamer/GO–SPCEs in 5 mM [Fe (CN)6]4–/3–. The inserted circuit graph in (B) is the EIS fitting model.
Applsci 11 10315 g002
Figure 3. FTIR spectra of the original GO (blue), and EDC/NHS activated GO (red).
Applsci 11 10315 g003
Figure 4. Optimization of (A) aptamer concentration, (B) immobilization time for aptamer, and (C) concentration of blocking solution, and (D) blocking time with 0.1 M ethanolamine.
Applsci 11 10315 g004
Figure 5. (A) SWV response of aptamer/GO/SPCEs aptasensor after incubation with 1 µg mL−1 (purple), 10 µg mL−1 (blue), 100 µg mL−1 (red), 1 × 10³ µg mL−1 (orange), and 1 × 10⁴ µg mL−1 (green) of GA; (B) Calibration plot of the aptasensor showing the linear relationship between the logarithm of GA concentration 1–1 × 10⁴ µg mL−1 and corresponding maximum current (∆I) from SWV. Mean current value of each concentration was plotted from three independent experiments.
Applsci 11 10315 g005
Figure 6. (A) Specificity of electrochemical aptasensor to GA compared with other biomaterials HSA (50 µg mL−1), folic acid (160 µg mL−1), ampicillin (5mg mL−1) and bilirubin (5 mg dL−1). (B) Stability of the aptasensor after a storage at 4 °C for 0, 7, 15 and 30 days for detection of 1 mg mL−1 of GA.
Applsci 11 10315 g006
Figure 7. Statistical comparison of GA concentration (mg mL−1) in DM and non-DM groups. The box plot shows statistically significant different GA levels between non-DM and DM groups (*** p < 0.001).
Applsci 11 10315 g007
Table 1. Comparison of LOD from different biosensors for detection of glycated albumin.
No.MethodLimit of Detection (LOD)Linear Response RangeReference
1.Enzymatic assay-based electrochemiluminescence sensor6.6 µg mL−16.6–660 µg mL−1[41]
2.Graphene-based optical aptasensor50 µg mL−10.05–3 mg mL−1[10]
3.Electrochemical aptasensor0.003 µg mL−10.002–16 mg mL−1[12]
4.Optical aptasensor0.067 µg mL−10.067–967 µg mL−1[42]
5.Electrochemical aptasensor0.07 µg mL−18–36 mg mL−1[13]
6.Enzymatic assay-based sensor0.36 µg mL−10–0.6 mg mL−1[40]
7.Ramen spectroscopy-based sensor13.7 µM (0.9 mg mL−1)7–250 µM[9]
8.Affinity chromatography-based immunoturbidimetric sensor0.81 mg mL−1ND[43]
9.Immobilization-free electrochemical aptasensor8.7 ng mL−10.01–50 µg mL−1[14]
10.rGO-based aptasensor16.40 µg mL−1 0–125 µg mL−1[44]
11.GO-based electrochemical aptasensor0.031 µg mL−10.001–10 mg mL−1This study
Table 2. Recovery assay of GA protein in human serum by the developed aptasensor.
GA Concentration Spiked in Serum (µg mL−1)Measured Concentration (µg mL−1)Recovery (%)RSD (%) (n = 5)
49.5048.90 ± 0.0198.72.1
233.00214.80 ± 0.0292.22.6
Table 3. Descriptive statistics table showing different concentrations of GA in diabetic and non-diabetic sera.
GA (mg mL−1)
Mean Std. DeviationStd. ErrorMinMax
Diabetic (n = 10)16.179.362.968.9037.50
Non-diabetic (n = 20)5.862.470.552.1011.40
Table 4. GA measurements obtained from three repeated analyses by proposed aptasensor and ELISA kit for five clinical serum samples.
SampleELISA (mg mL −1)Aptasensor (mg mL −1)t-Test aF-Test b
11.60 ± 0.082.10 ± 0.040.104.90
22.30 ± 0.022.10 ± 0.050.800.80
38.70 ± 0.028.50 ± 0.090.401.00
410.10 ± 0.0410.00 ± 0.060.600.25
536.90 ± 0.0637.50 ± 0.040.123.86
a Tabulated t-value for 4° of freedom at p-value of 0.05 is 2.78. b Tabulated F-value for 2.2° of freedom at p-value of 0.05 is 19.
Publisher’s Note: MDPI stays neutral with regard to jurisdictional claims in published maps and institutional affiliations.

