
Towards Health Equality: Optimizing Hierarchical Healthcare Facilities towards Maximal Accessibility Equality in Shenzhen, China


Abstract
:1. Introduction
2. Literature Review
2.1. Classic Location–Allocation Models
2.2. Hierarchical Location–Allocation Problems
2.3. The Maximal Accessibility Equality Model
3. Data and Methods
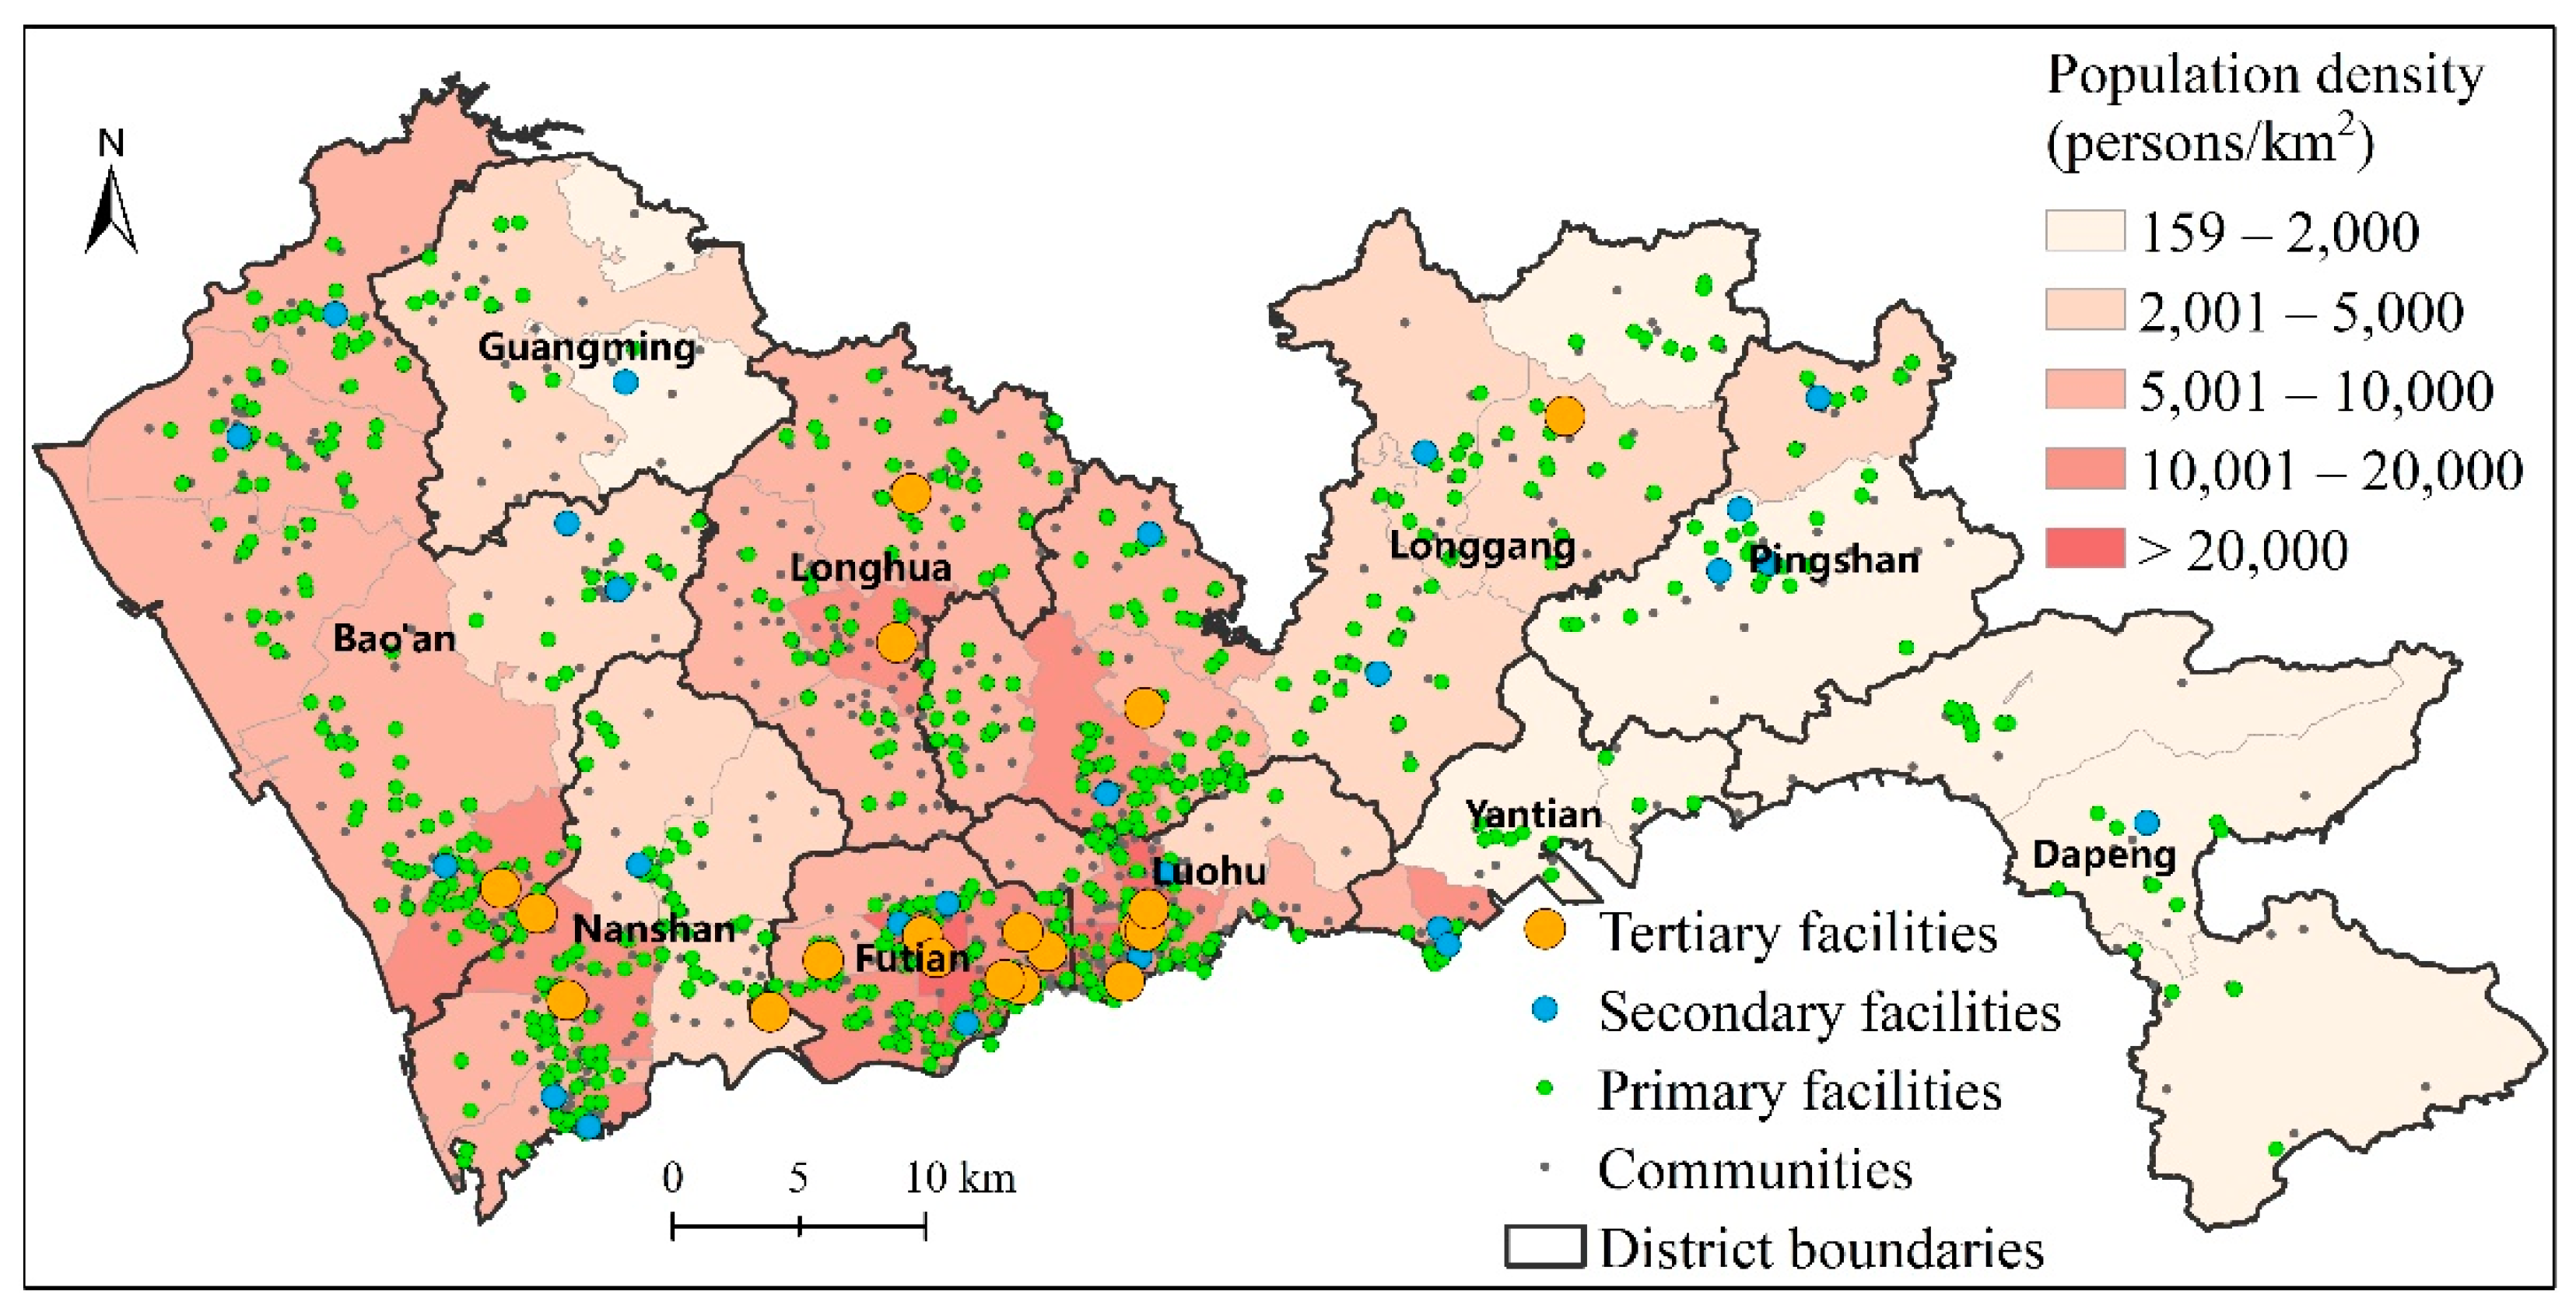
3.1. Study Area and Data
- (1)
- community-level population counts;
- (2)
- point-level healthcare facilities with attribute information such as names, hierarchy, number of physicians, and addresses;
- (3)
- the travel time between community centroids to healthcare facilities.
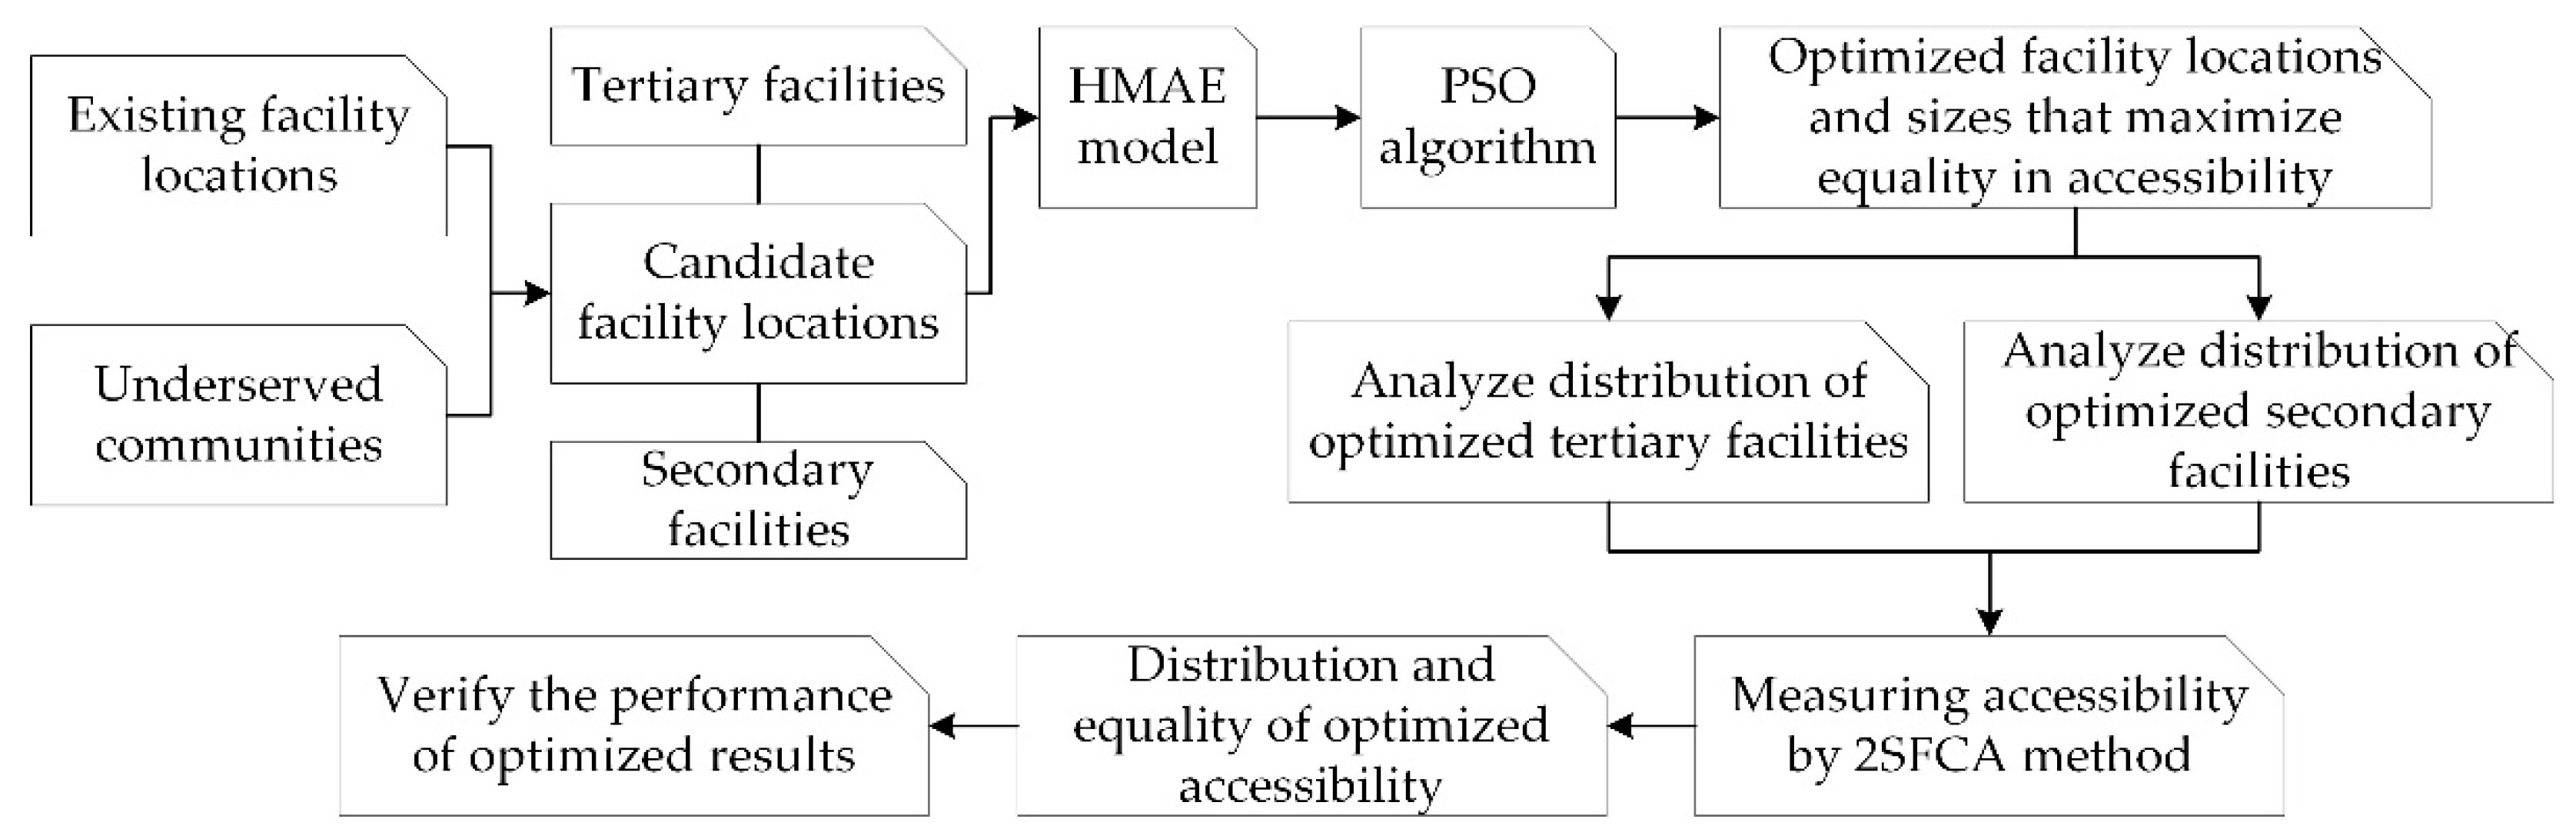
3.2. The Hierarchical Maximal Accessibility Equality (HMAE) Model
3.3. Implementation of the HMAE Model
4. Results
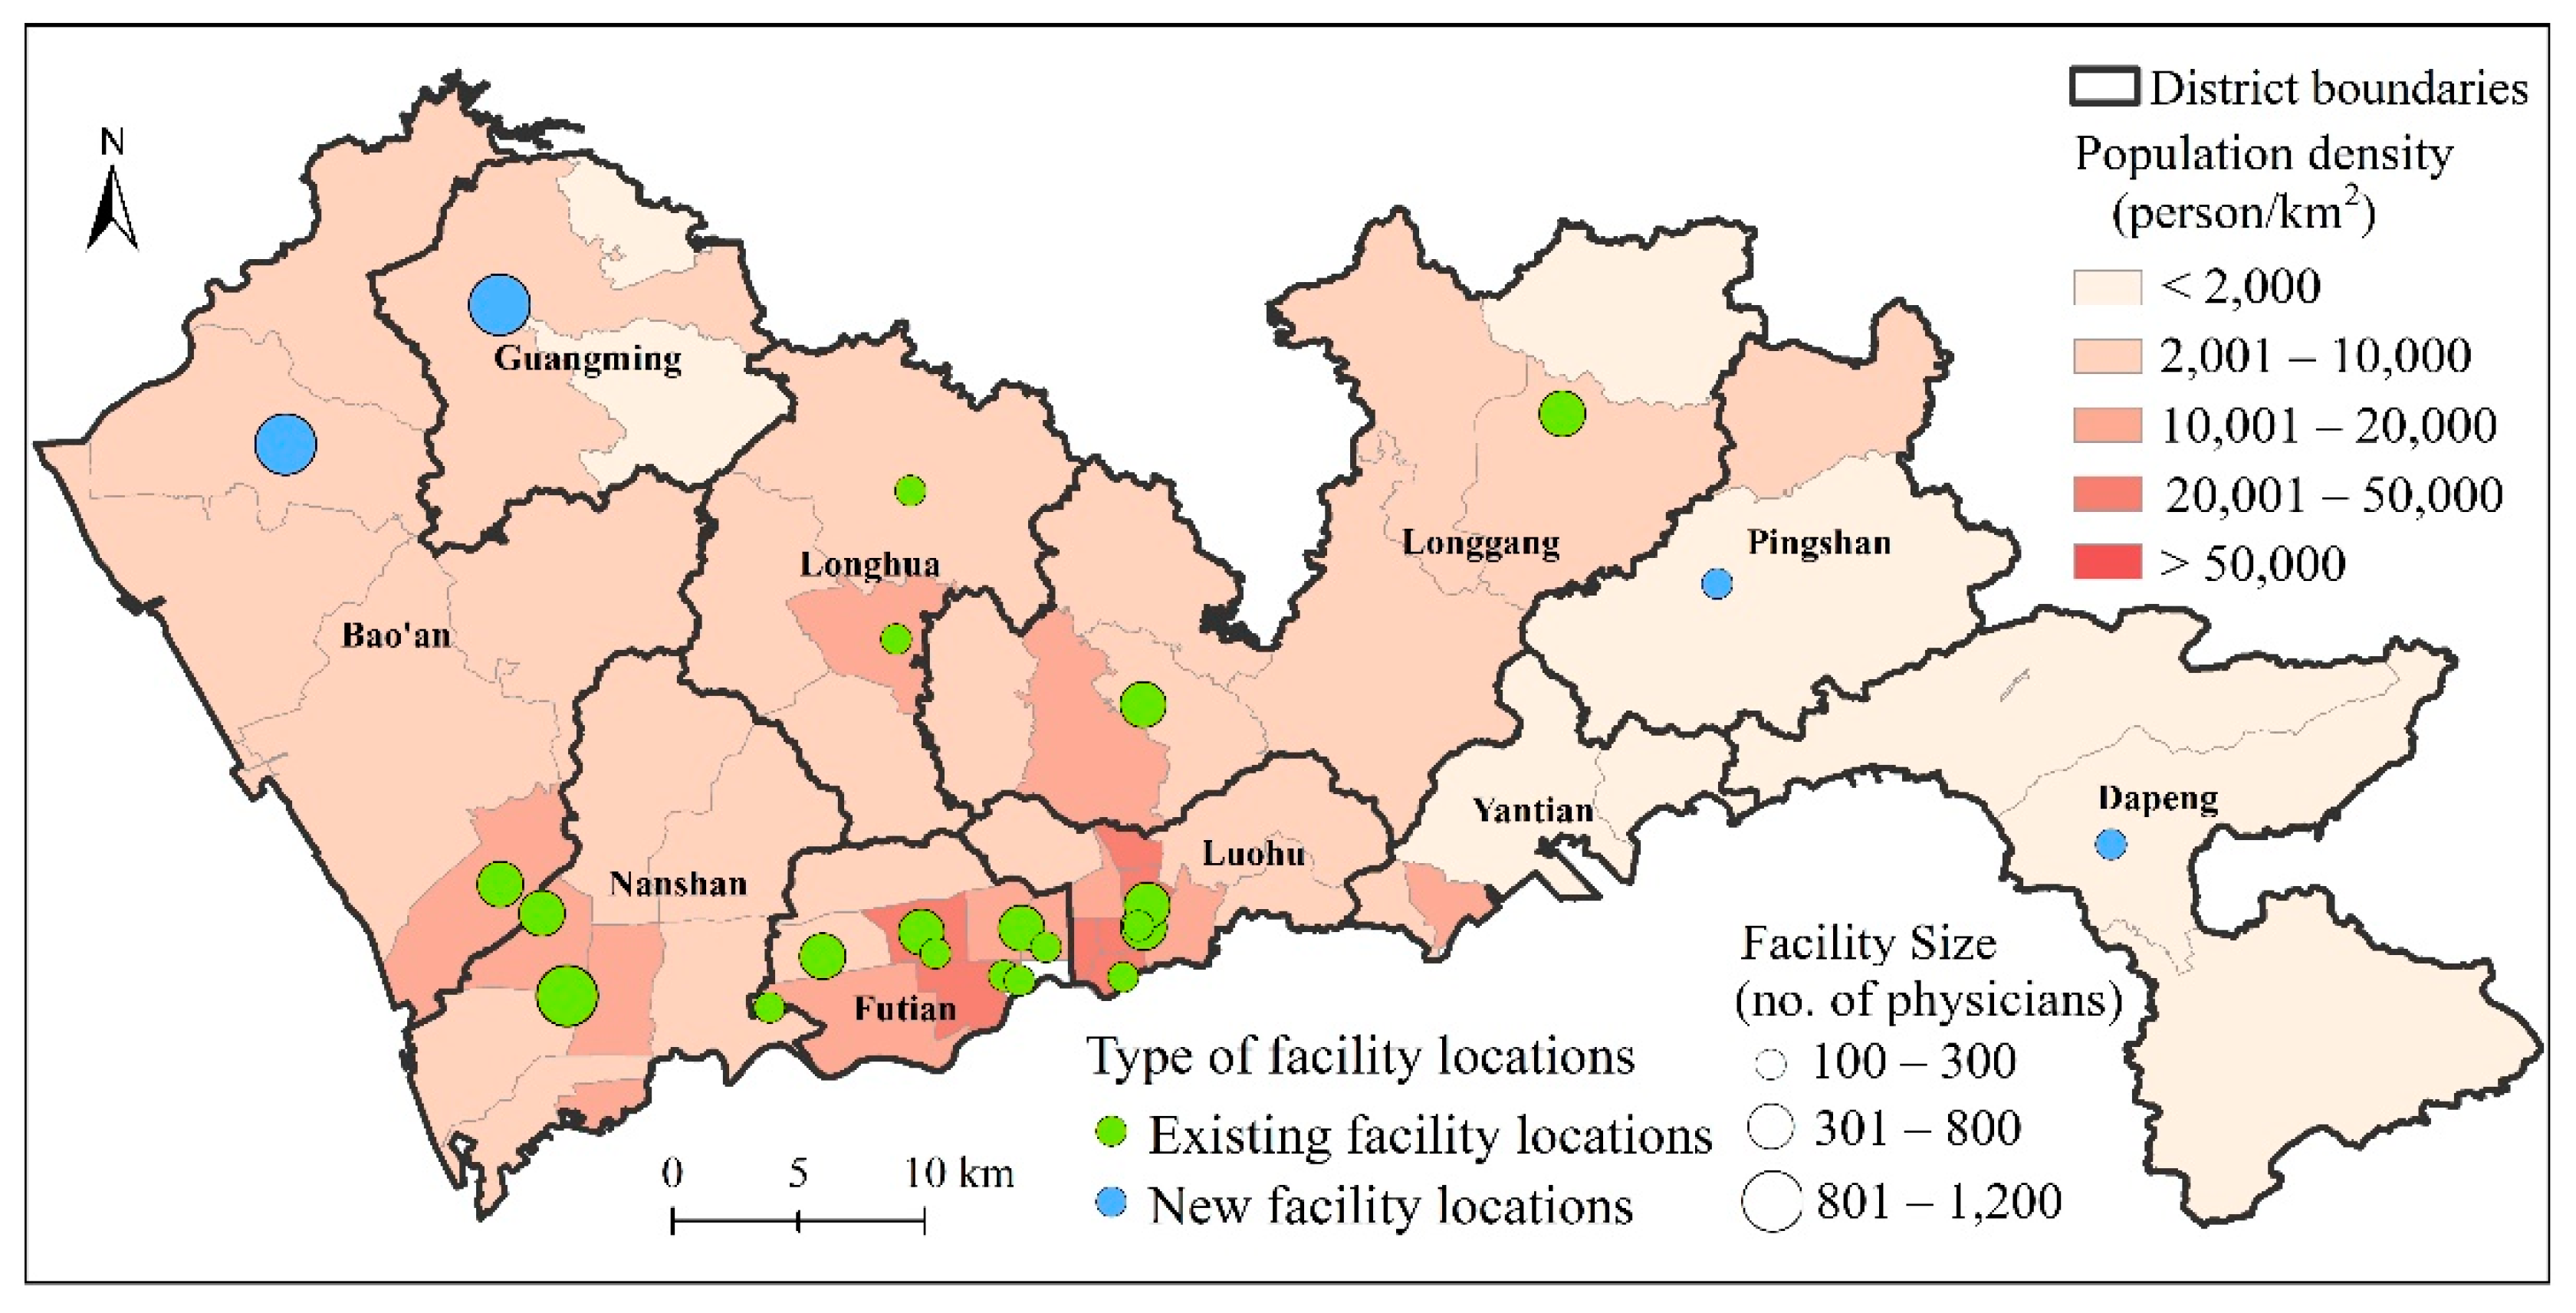
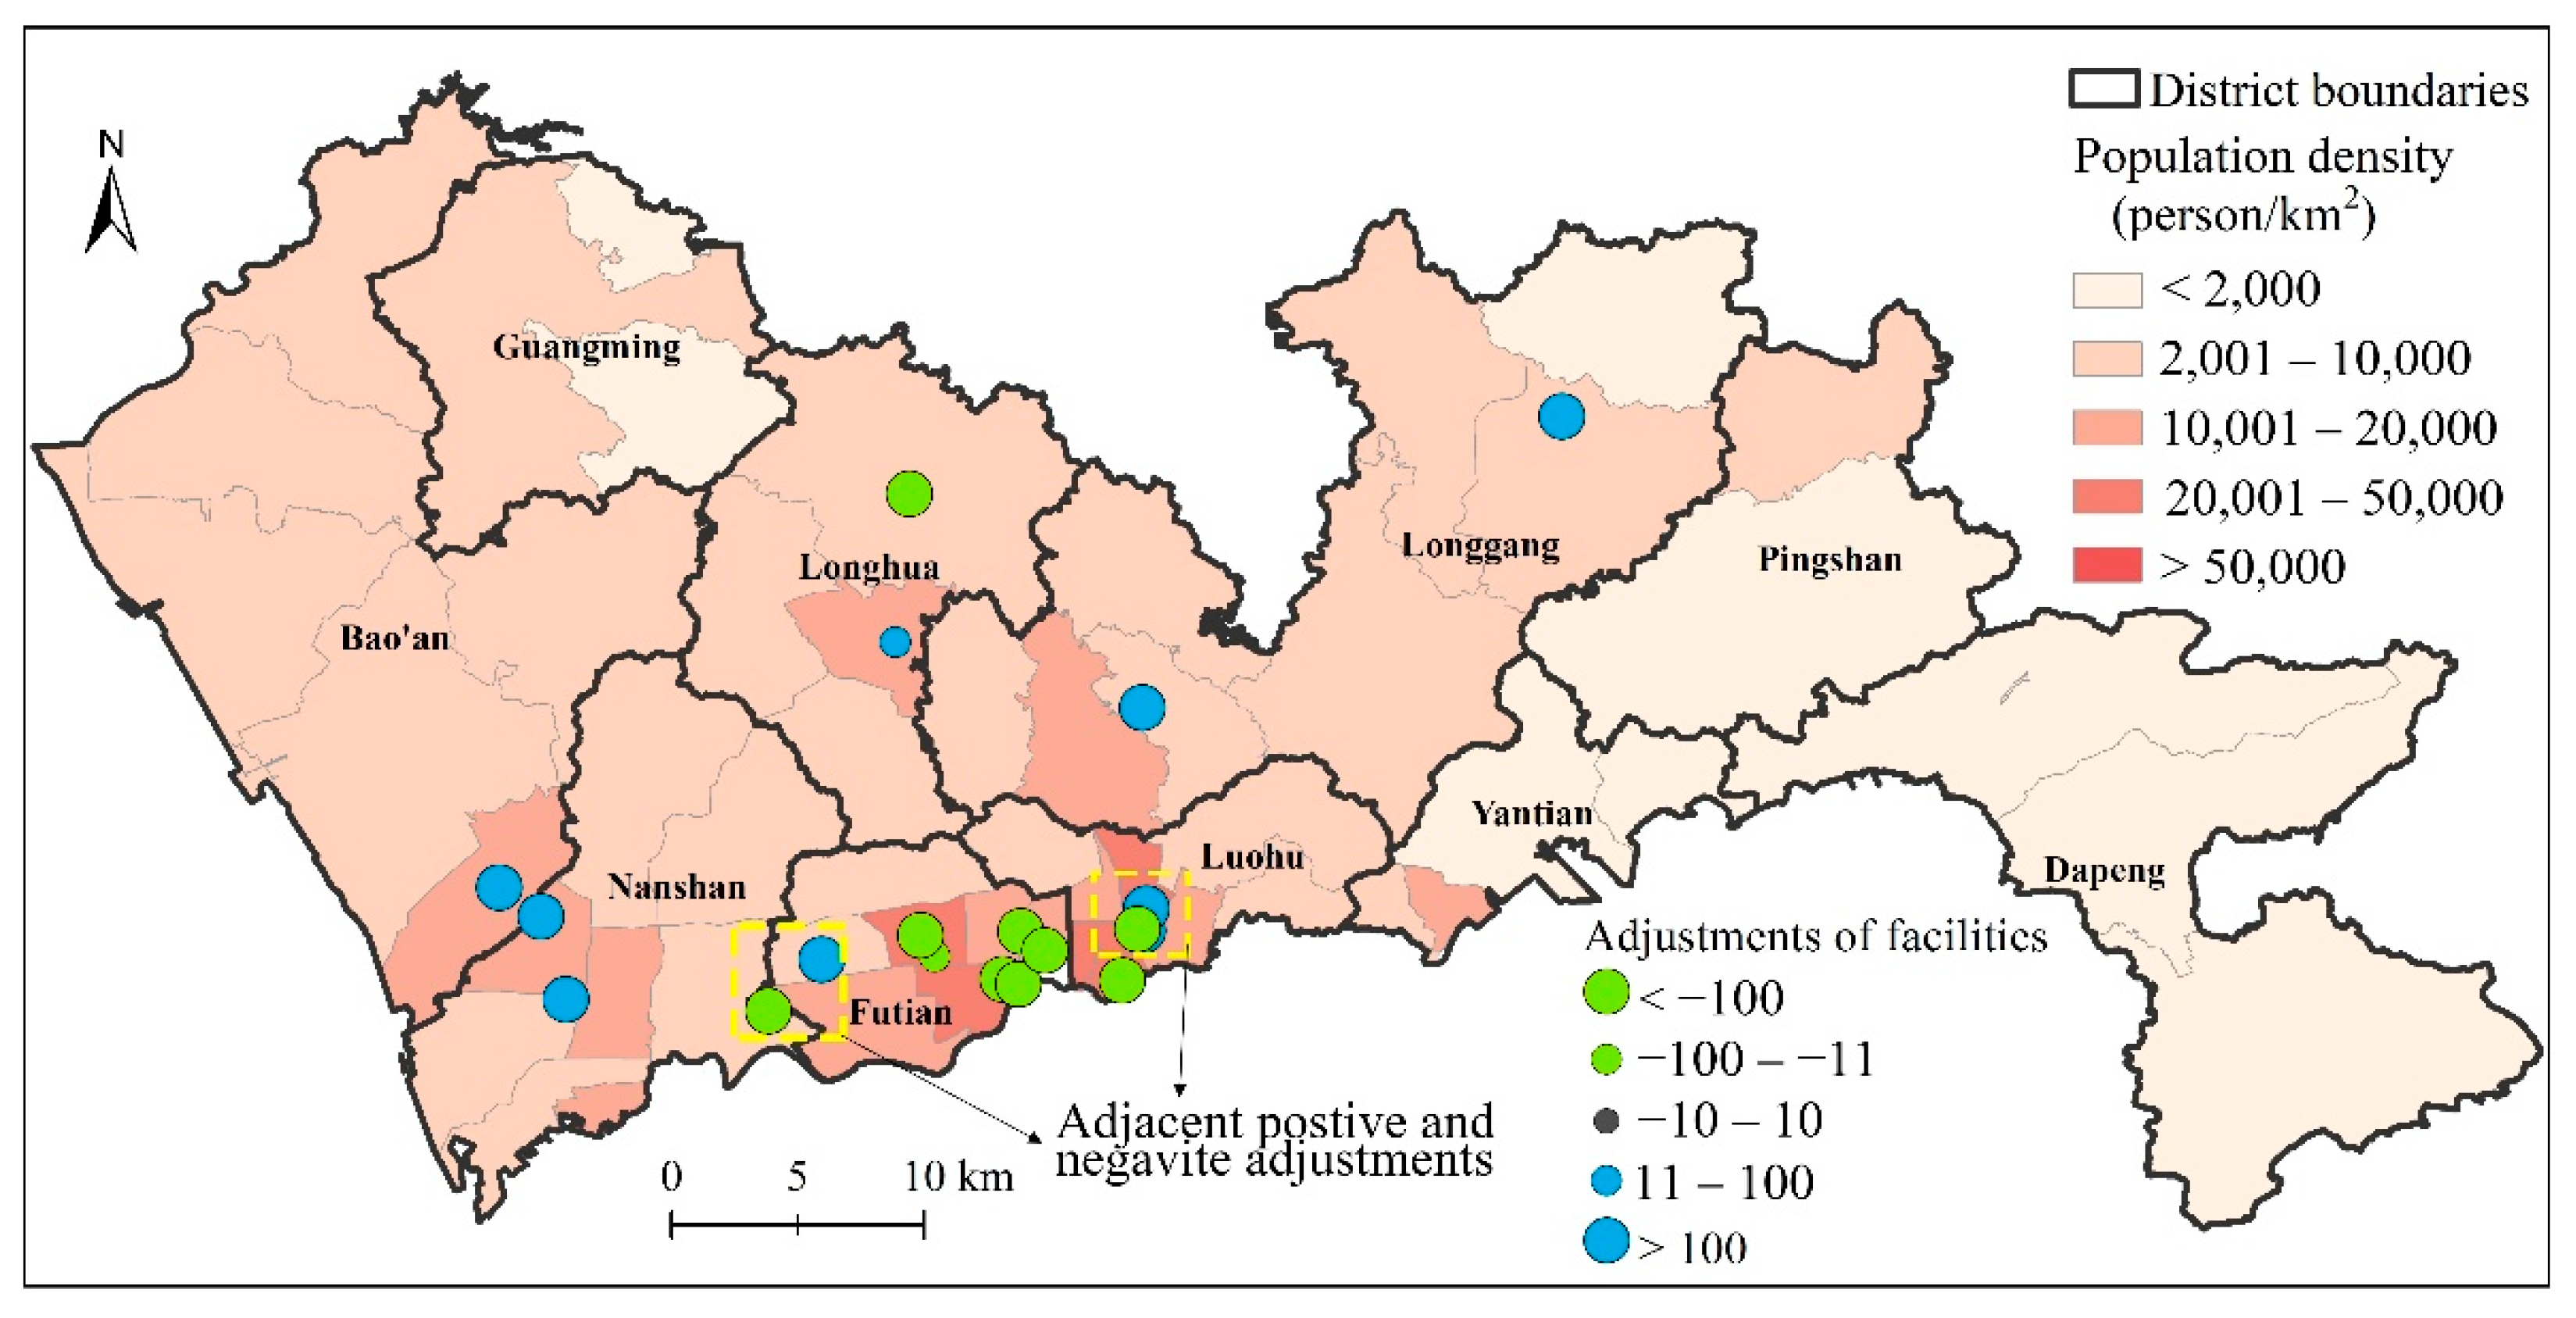
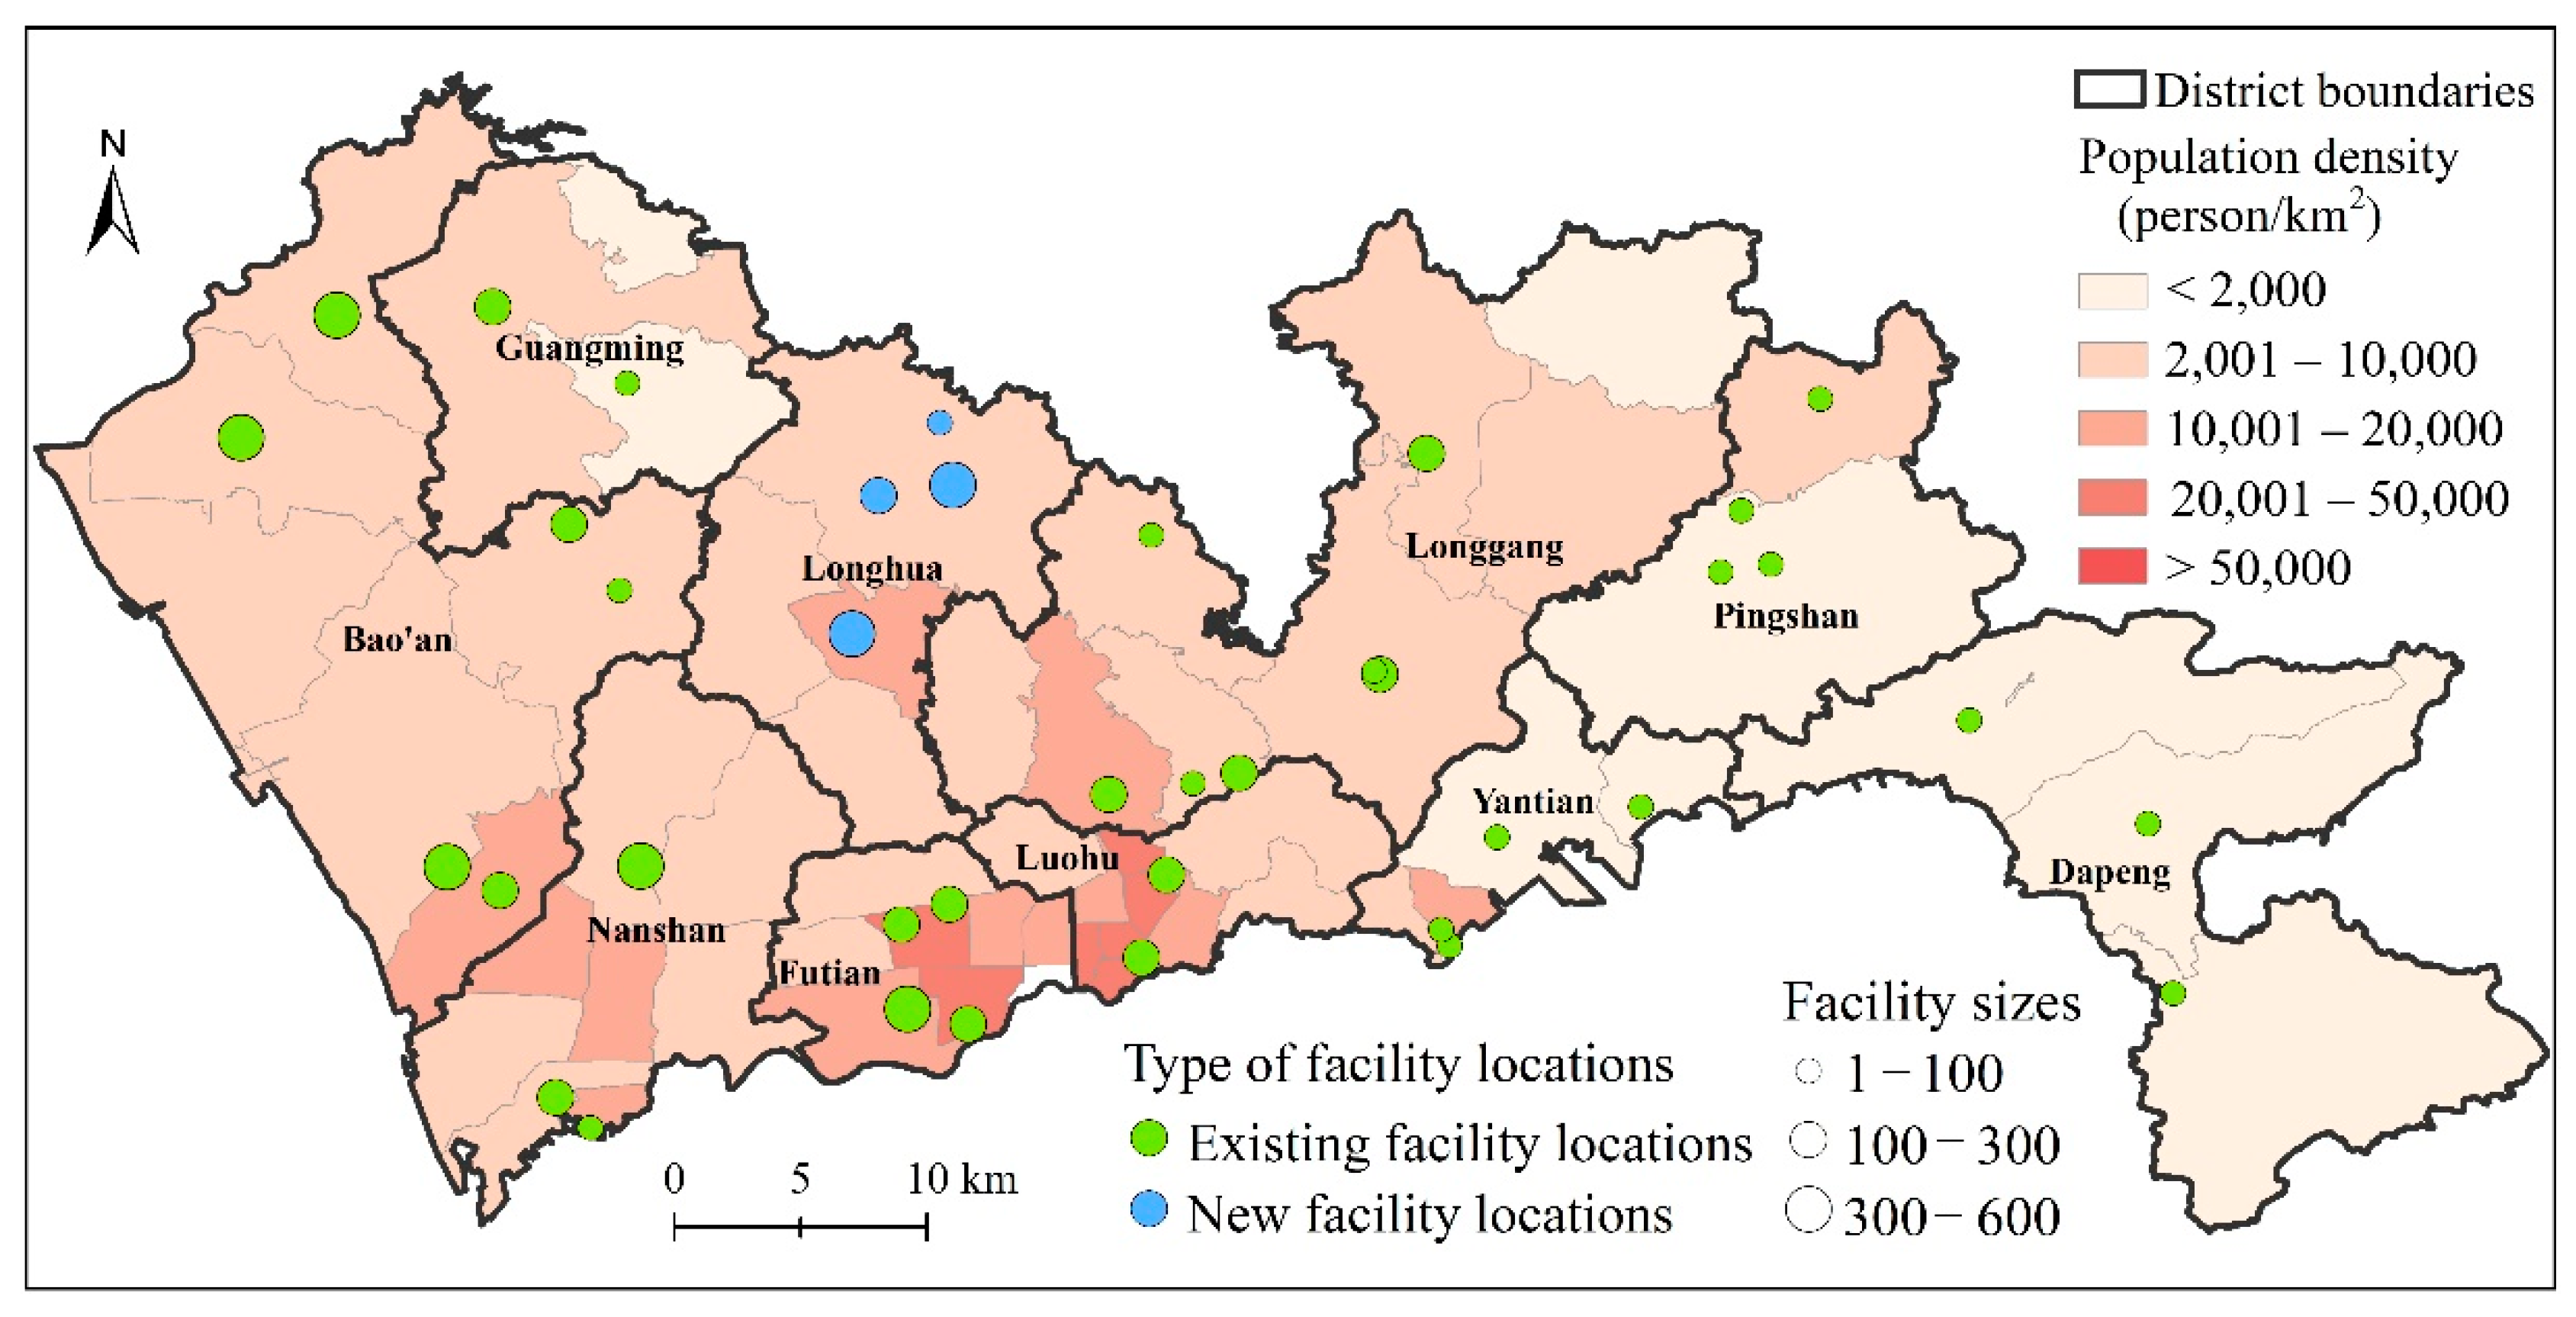
4.1. Optimal Distribution of Tertiary Healthcare Facilities
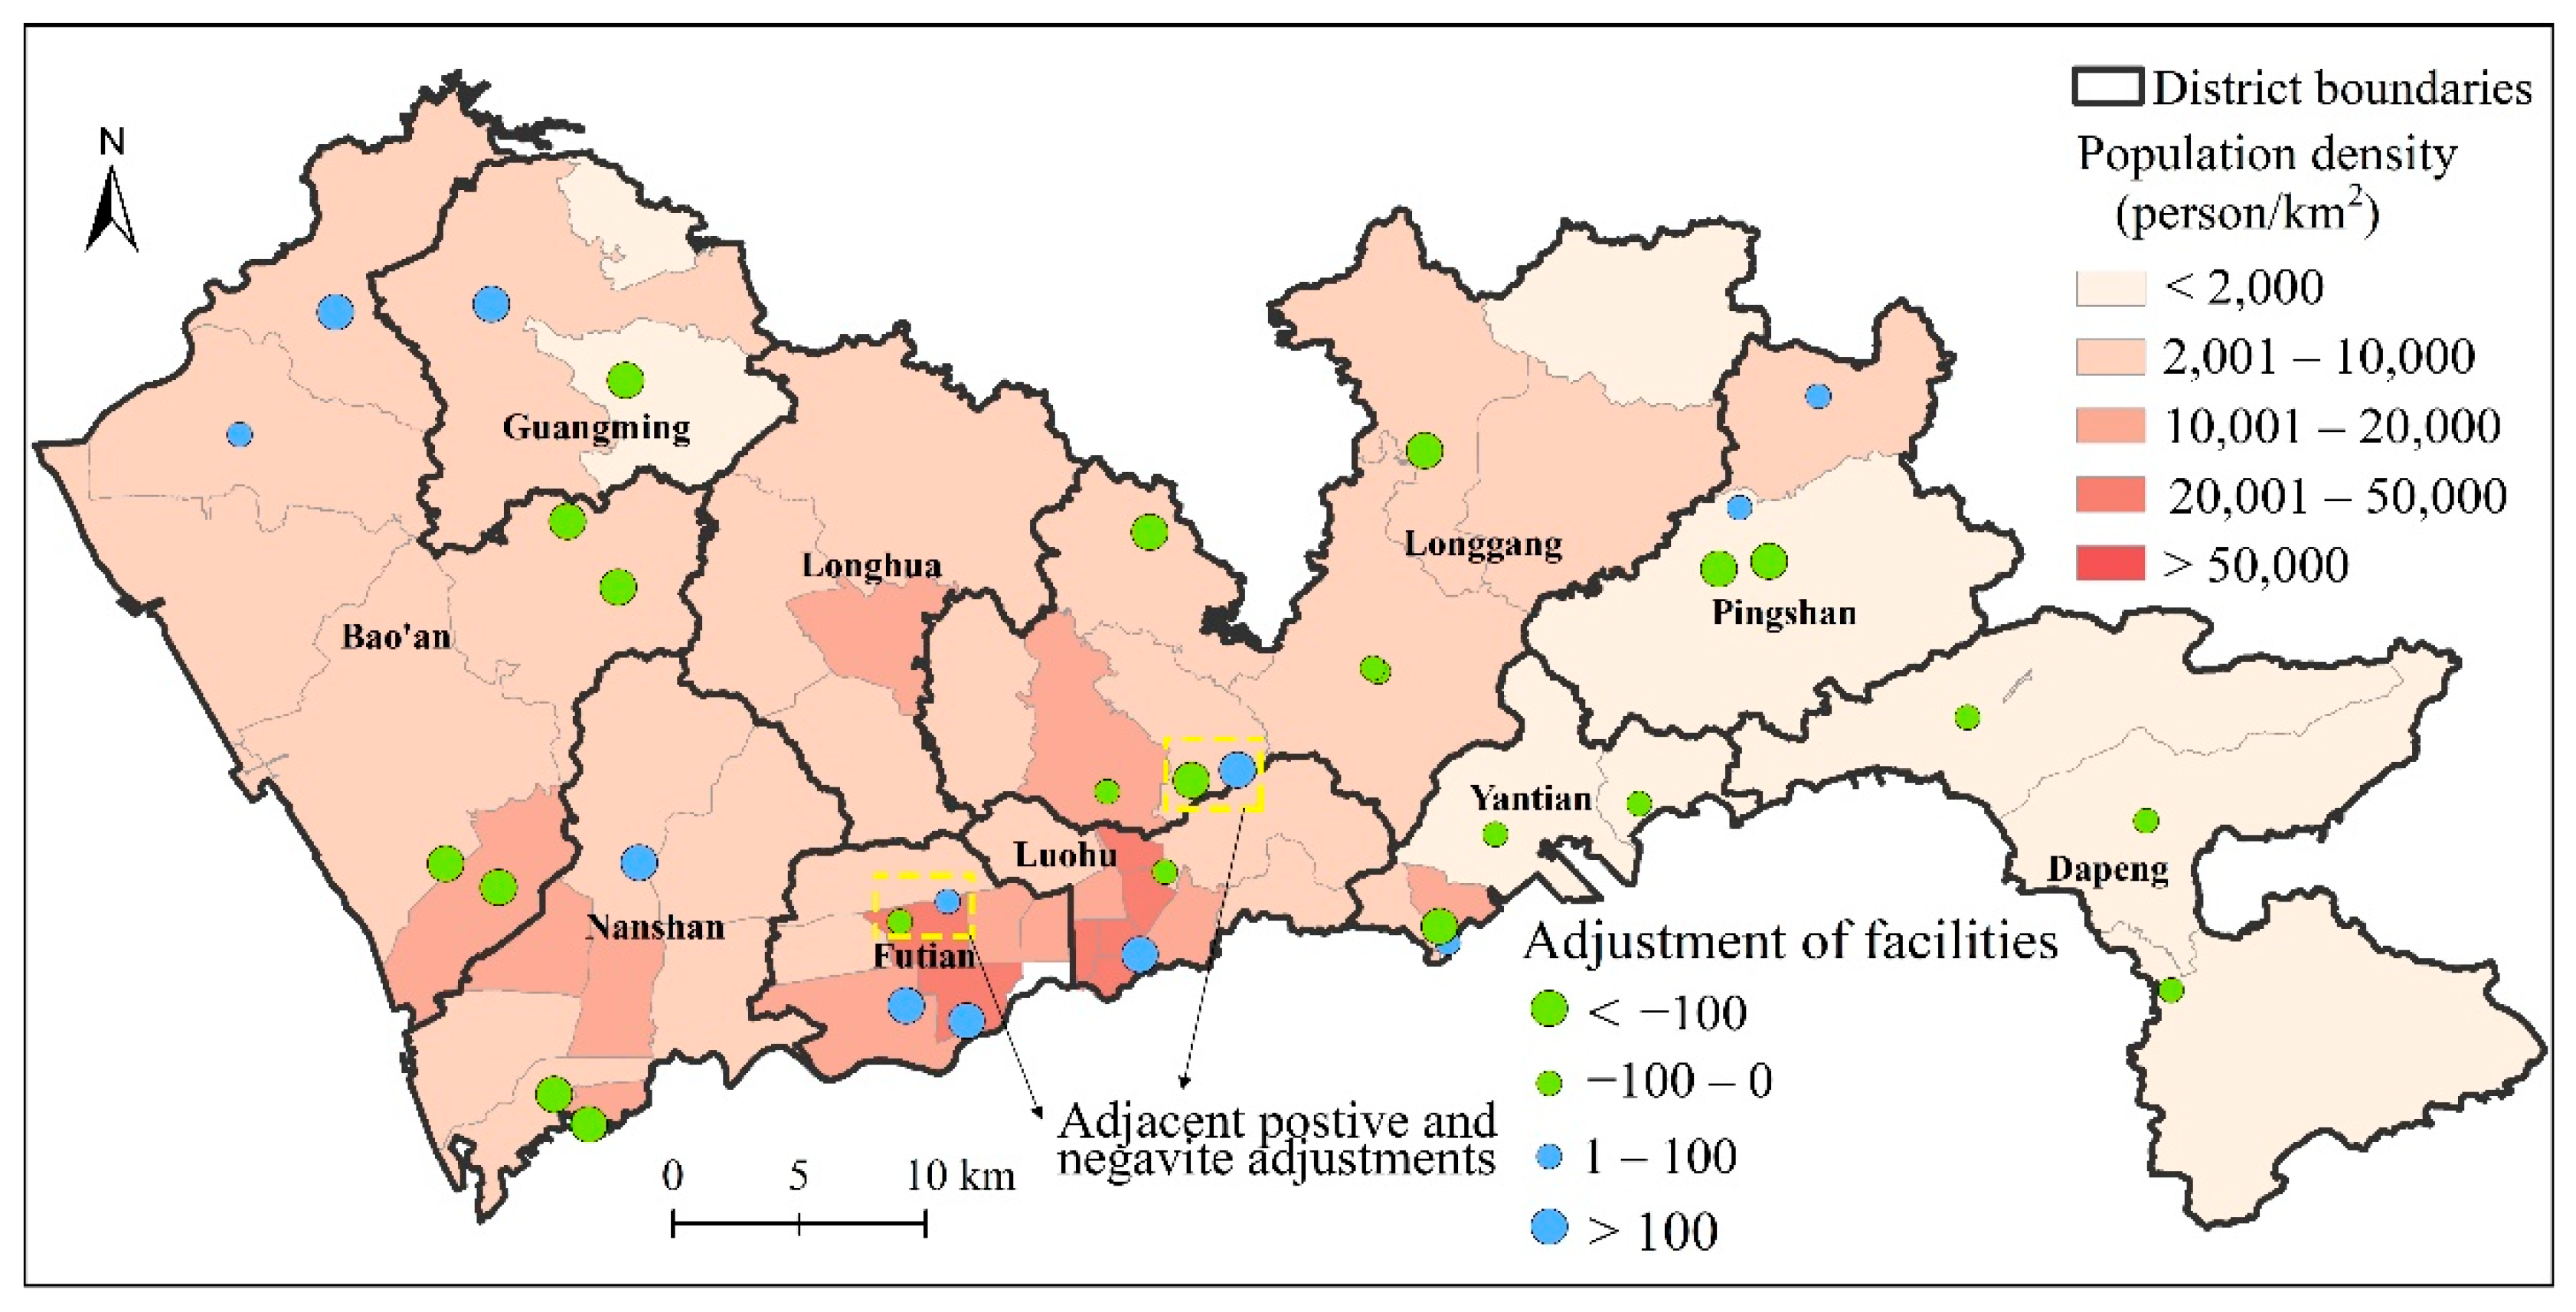
4.2. Optimal Distribution of Secondary Healthcare Facilities
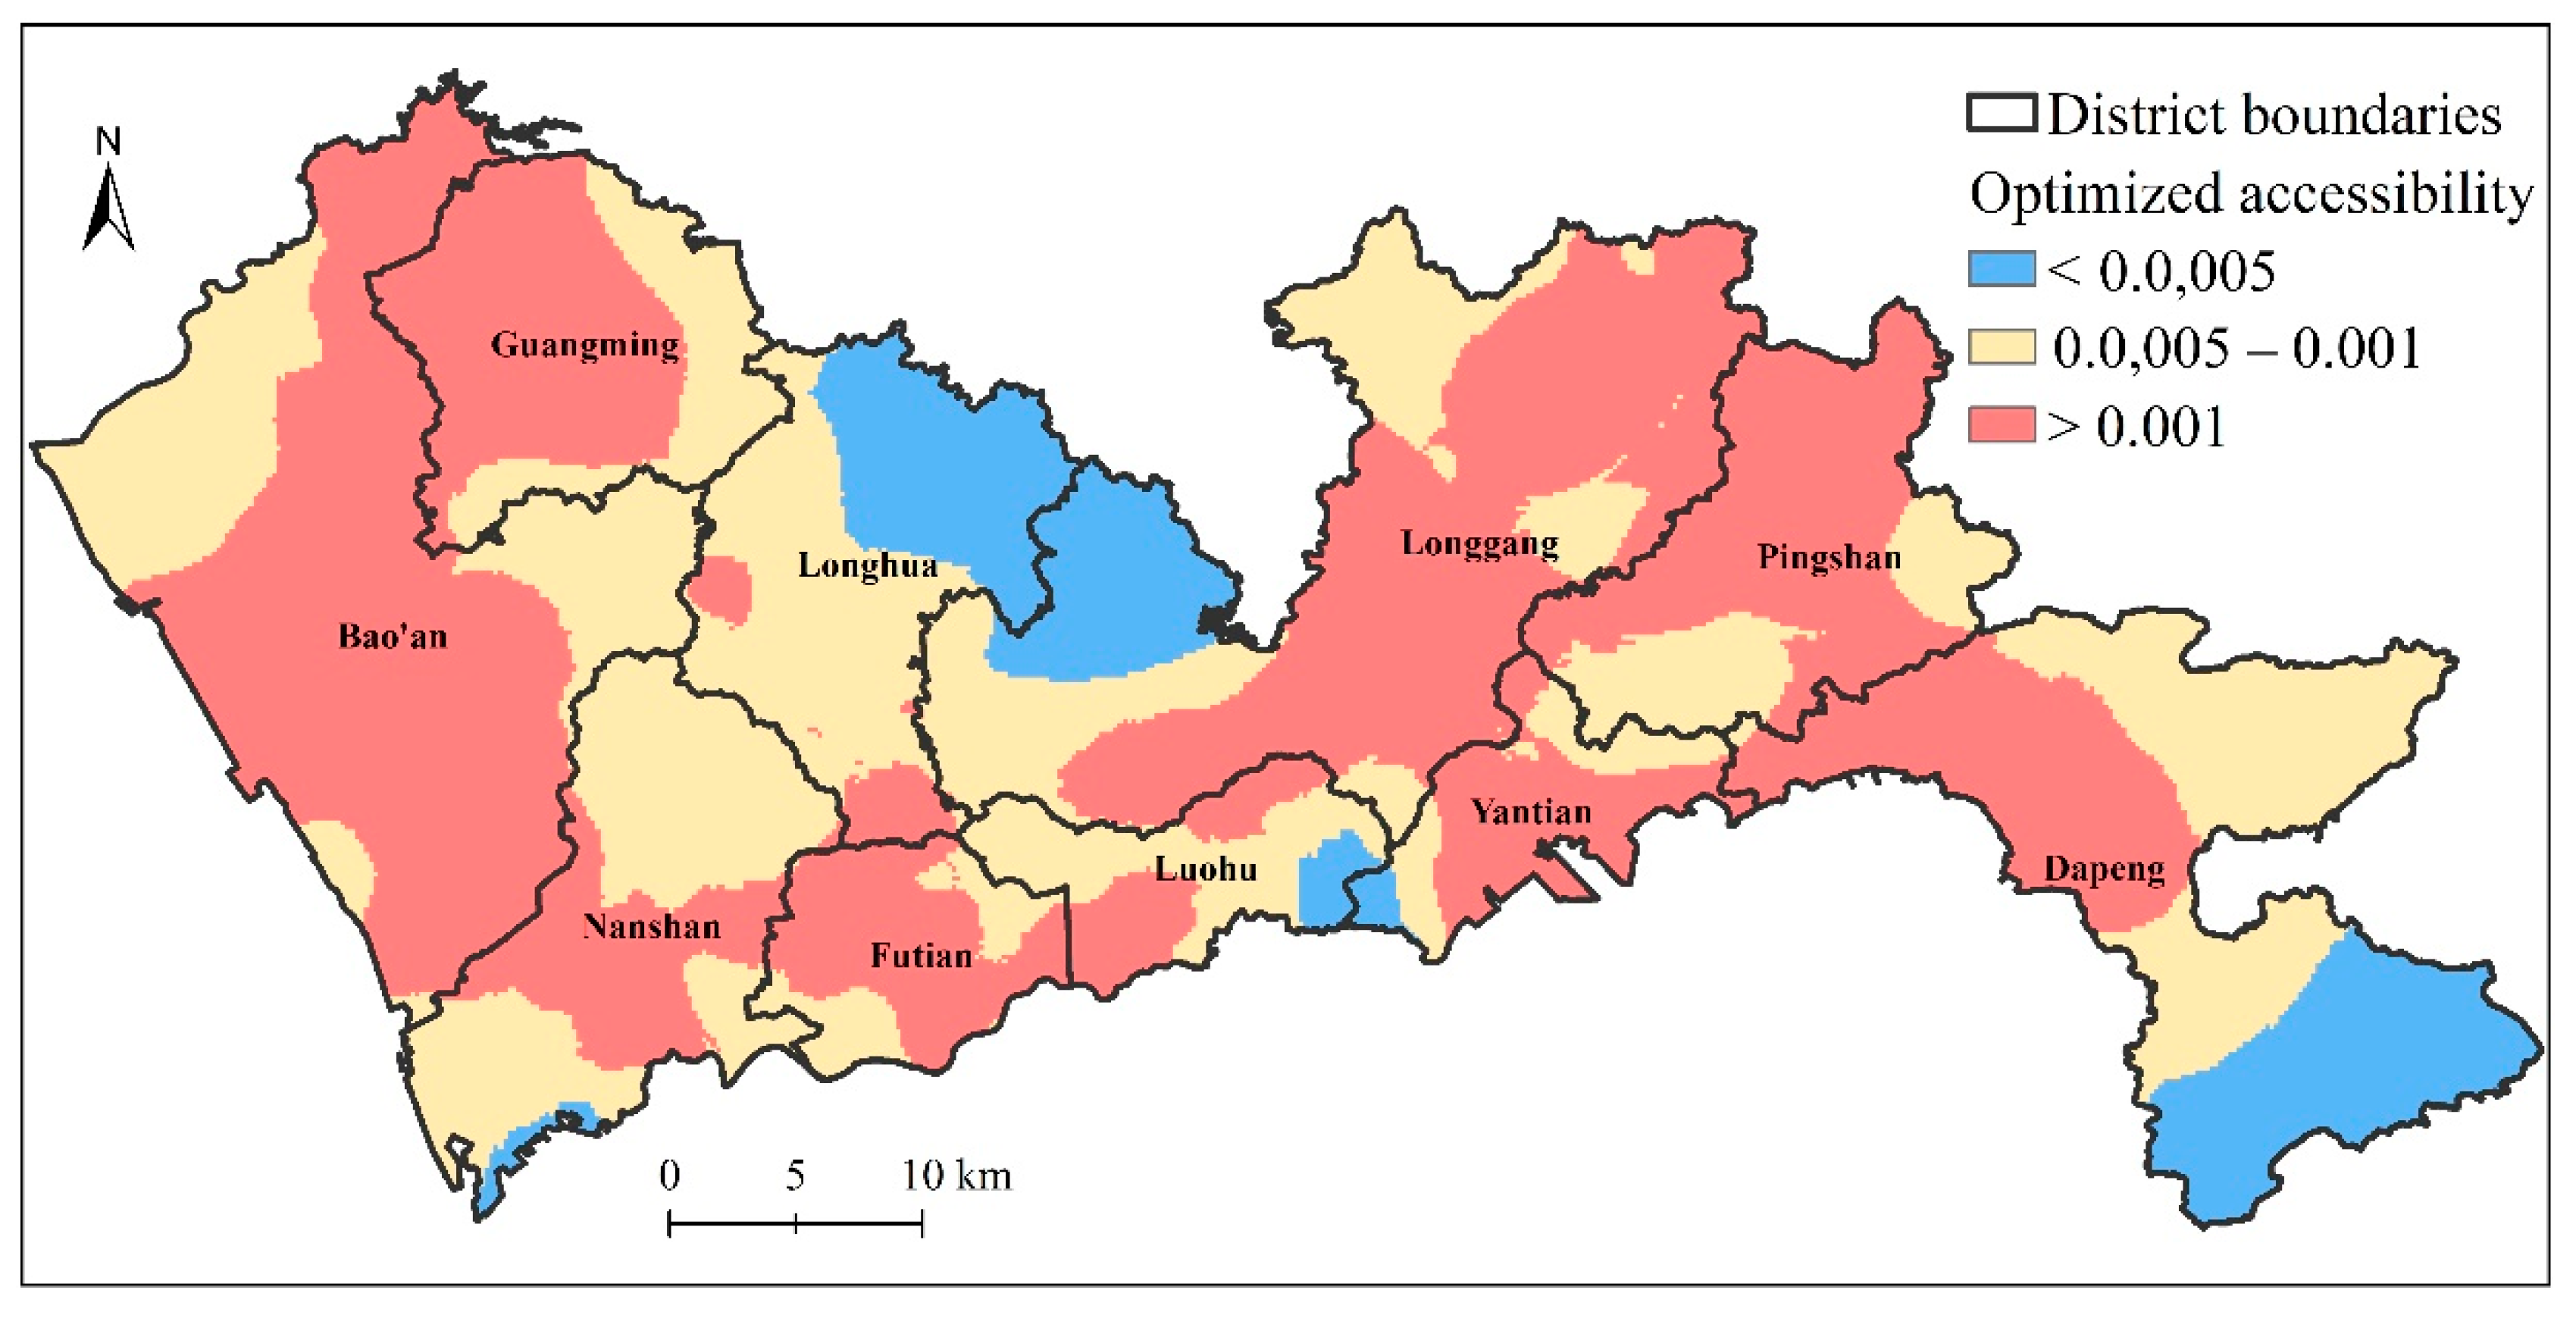
4.3. Examining the Improvement of Accessibility Equality
5. Discussion
6. Conclusions
Author Contributions
Funding
Institutional Review Board Statement
Informed Consent Statement
Data Availability Statement
Acknowledgments
Conflicts of Interest
References
- Corburn, J. Toward the Healthy City: People, Places, and the Politics of Urban Planning; The MIT Press: Cambridge, MA, USA, 2009. [Google Scholar]
- Fujita, M.; Sato, Y.; Nagashima, K.; Takahashi, S.; Hata, A. Impact of geographic accessibility on utilization of the annual health check-ups by income level in Japan: A multilevel analysis. PLoS ONE 2017, 12, e0177091. [Google Scholar]
- Onega, T.; Duell, E.J.; Shi, X.; Wang, D.; Demidenko, E.; Goodman, D. Geographic access to cancer care in the U.S. Cancer 2008, 112, 909–918. [Google Scholar] [CrossRef]
- Wang, F. Measurement, optimization and impact of healthcare accessibility: A methodological review. Ann. Assoc. Am. Geogr. 2012, 102, 1104–1112. [Google Scholar] [CrossRef] [Green Version]
- Khan, A.A. An integrated approach to measuring potential spatial access to health care services. Socioecon. Plan. Sci. 1992, 26, 275–287. [Google Scholar] [CrossRef]
- Wang, F.; Luo, W. Assessing spatial and nonspatial factors for healthcare access: Towards an integrated approach to defining health professional shortage areas. Health Place 2005, 11, 131–146. [Google Scholar] [CrossRef]
- Hansen, W.G. How Accessibility Shapes Land Use. J. Am. Inst. Plan. 1959, 25, 73–76. [Google Scholar] [CrossRef]
- Falchetta, G.; Hammad, A.; Shayegh, S. Planning universal accessibility to public health care in sub-Saharan Africa. Proc. Natl. Acad. Sci. USA 2020, 117, 31760–31769. [Google Scholar] [CrossRef]
- Weiss, D.J.; Nelson, A.; Vargas-Ruiz, C.A.; Gligorić, K.; Bavadekar, S.; Gabrilovich, E.; Bertozzi-Villa, A.; Rozier, J.; Gibson, H.S.; Shekel, T.; et al. Global maps of travel time to healthcare facilities. Nat. Med. 2020, 26, 1835–1838. [Google Scholar] [CrossRef] [PubMed]
- The State Council of the People’s Republic of China. The Guiding Opinions on Promoting the Construction of Hierarchical Medical System. 2015. Available online: http://www.gov.cn/xinwen/2016-10/25/content_5124174.htm (accessed on 12 April 2020).
- The State Council of the People’s Republic of China. The Outline of the Healthy China 2030 Plan. 2016. Available online: http://www.gov.cn/zhengce/content/2015-09/11/content_10158.htm (accessed on 12 April 2020).
- Kang, J.-Y.; Michels, A.; Lyu, F.; Wang, S.; Agbodo, N.; Freeman, V.L.; Wang, S. Rapidly measuring spatial accessibility of COVID-19 healthcare resources: A case study of Illinois, USA. Int. J. Health Geogr. 2020, 19, 36. [Google Scholar] [CrossRef]
- Pereira, R.H.M.; Braga, C.K.V.; Servo, L.M.; Serra, B.; Amaral, P.; Gouveia, N.; Paez, A. Geographic access to COVID-19 healthcare in Brazil using a balanced float catchment area approach. Soc. Sci. Med. 2021, 273, 113773. [Google Scholar] [CrossRef]
- McGrail, M.R.; Humphreys, J.S. Measuring spatial accessibility to primary health care services: Utilising dynamic catchment sizes. Appl. Geogr. 2014, 54, 182–188. [Google Scholar] [CrossRef]
- Polzin, P.; Borges, J.; Coelho, A.N. An extended kernel density two-step floating catchment area method to analyze access to health care. Environ. Plan. B Plan. Des. 2014, 41, 717–735. [Google Scholar] [CrossRef]
- Tao, Z.; Liu, Z.; Cheng, Y. Hierarchical two-step floating catchment area (2SFCA) method: Measuring the spatial accessibility to hierarchical healthcare facilities in Shenzhen, China. Int. J. Equity Health 2020, 19, 164. [Google Scholar] [CrossRef]
- Dai, D. Racial/ethnic and socioeconomic disparities in urban green space accessibility: Where to intervene? Landsc. Urban Plan. 2011, 102, 234–244. [Google Scholar] [CrossRef]
- Langford, M.; Higgs, G.; Fry, R. Multi-modal two-step floating catchment area analysis of primary health care accessibility. Health Place 2016, 38, 70–81. [Google Scholar] [CrossRef]
- Tao, Z.; Cheng, Y. Modelling the spatial accessibility of the elderly to healthcare services in Beijing, China. Environ. Plan. B Urban Anal. City Sci. 2019, 46, 1132–1147. [Google Scholar] [CrossRef]
- Neutens, T. Accessibility, equity and health care: Review and research directions for transport geographers. J. Transp. Geogr. 2015, 43, 14–27. [Google Scholar] [CrossRef]
- Cheng, G.; Zeng, X.; Duan, L.; Lu, X.; Sun, H.; Jiang, T.; Li, Y. Spatial difference analysis for accessibility to high level hospitals based on travel time in Shenzhen, China. Habitat Int. 2016, 53, 485–494. [Google Scholar] [CrossRef] [Green Version]
- Drezner, Z.; Hamacher, H.W. Facility Location: Applications and Theory; Springer: New York, NY, USA, 2002. [Google Scholar]
- Tong, D.; Murray, A.T. Spatial Optimization in Geography. Ann. Assoc. Am. Geogr. 2012, 102, 1290–1309. [Google Scholar] [CrossRef]
- Owen, S.H.; Daskin, M.S. Strategic facility location: A review. Eur. J. Oper. Res. 1998, 111, 423–447. [Google Scholar] [CrossRef]
- Kontodimopoulos, N.; Nanos, P.; Niakas, D. Balancing efficiency of health services and equity of access in remote areas in Greece. Health Policy 2006, 76, 49–57. [Google Scholar] [CrossRef]
- Church, R.L. Location modelling and GIS. In Geographical Information Systems; Longley, P.A., Goodchild, M., Maguire, D., Rhind, D., Eds.; John Wiley: New York, NY, USA, 1999; pp. 293–303. [Google Scholar]
- Murray, A.T. Maximal Coverage Location Problem. Int. Reg. Sci. Rev. 2015, 39, 5–27. [Google Scholar] [CrossRef]
- Wang, F.; Tang, Q. Planning toward equal accessibility to services: A quadratic programming approach. Environ. Plan. B Plan. Des. 2013, 40, 195–212. [Google Scholar] [CrossRef]
- Tao, Z.; Cheng, Y.; Dai, T.; Rosenberg, M.W. Spatial optimization of residential care facility locations in Beijing, China: Maximum equity in accessibility. Int. J. Health Geogr. 2014, 13, 33. [Google Scholar] [CrossRef] [Green Version]
- Luo, J.; Tian, L.; Luo, L.; Yi, H.; Wang, F. Two-Step Optimization for Spatial Accessibility Improvement: A Case Study of Health Care Planning in Rural China. BioMed Res. Int. 2017, 2017, 1–12. [Google Scholar] [CrossRef] [PubMed] [Green Version]
- Dai, T.; Liu, Z.; Liao, C.; Cai, H. Toward Equal Opportunity of Primary Education: Introducing a Lottery into China’s Proximity-Based Enrollment System. Prof. Geogr. 2019, 71, 210–220. [Google Scholar] [CrossRef]
- Jin, M.; Liu, L.; Tong, D.; Gong, Y.; Liu, Y. Evaluating the Spatial Accessibility and Distribution Balance of Multi-Level Medical Service Facilities. Int. J. Environ. Res. Public Health 2019, 16, 1150. [Google Scholar] [CrossRef] [Green Version]
- Zhang, S.; Song, X.; Wei, Y.; Deng, W. Spatial Equity of Multilevel Healthcare in the Metropolis of Chengdu, China: A New Assessment Approach. Int. J. Environ. Res. Public Health 2019, 16, 493. [Google Scholar] [CrossRef] [PubMed] [Green Version]
- Ma, X.; Ren, F.; Du, Q.; Liu, P.; Li, L.; Xi, Y.; Jia, P. Incorporating multiple travel modes into a floating catchment area framework to analyse patterns of accessibility to hierarchical healthcare facilities. J. Transp. Health 2019, 15, 100675. [Google Scholar] [CrossRef]
- Hodgson, M.J. Alternative Approaches to Hierarchical Location-Allocation Systems. Geogr. Anal. 1984, 16, 275–281. [Google Scholar] [CrossRef]
- Şahin, G.; Süral, H. A review of hierarchical facility location models. Comput. Oper. Res. 2007, 34, 2310–2331. [Google Scholar] [CrossRef]
- Farahani, R.Z.; Hekmatfar, M.; Fahimnia, B.; Kazemzadeh, N. Hierarchical facility location problem: Models, classifications, techniques, and applications. Comput. Ind. Eng. 2014, 68, 104–117. [Google Scholar] [CrossRef]
- García-Palomares, J.C.; Gutiérrez, J.; Latorre, M. Optimizing the location of stations in bike-sharing programs: A GIS approach. Appl. Geogr. 2012, 35, 235–246. [Google Scholar] [CrossRef]
- Drezner, T.; Drezner, Z. The gravity p-median model. Eur. J. Oper. Res. 2007, 179, 1239–1251. [Google Scholar] [CrossRef]
- Narula, S.C. Hierarchical location-allocation problems: A classification scheme. Eur. J. Oper. Res. 1984, 15, 93–99. [Google Scholar] [CrossRef]
- Espejo, L.G.A.; Galv, O.R.D.; Boffey, B. Dual-based heuristics for a hierarchical covering location problem. Comput. Oper. Res. 2003, 30, 165–180. [Google Scholar] [CrossRef]
- Teixeira, J.C.; Antunes, A.P. A hierarchical location model for public facility planning. Eur. J. Oper. Res. 2008, 185, 92–104. [Google Scholar] [CrossRef] [Green Version]
- Wang, F.; Fu, C.; Shi, X. Planning towards maximum equality in accessibility to NCI cancer centers in the U.S. In Spatial Analysis in Health Geography; Kanaroglou, P., Delmelle, E., Ghosh, D., Paez, A., Eds.; Ashgate Publishing: Farnham, UK, 2015; pp. 261–274. [Google Scholar]
- Li, X.; Wang, F.; Yi, H. A two-step approach to planning new facilities towards equal accessibility. Environ. Plan. B Urban Anal. City Sci. 2017, 44, 994–1011. [Google Scholar] [CrossRef]
- Shenzhen Municipal Health Commission. List of Healthcare Facilities in Shenzhen. 2020. Available online: http://wjw.sz.gov.cn/bmfw/wycx/fwyl/yycx/index.html (accessed on 9 October 2020).
- Baidu Map. Development Document of Baidu Map Route Plan Web API. 2020. Available online: http://lbsyun.baidu.com/index.php?title=jspopular/guide/routeplan (accessed on 9 October 2020).
- Wang, F.; Xu, Y. Estimating O-D travel time matrix by Google Maps API: Implementation, advantages, and implications. Ann. GIS 2011, 17, 199–209. [Google Scholar] [CrossRef]
- Dony, C.C.; Delmelle, E.M.; Delmelle, E.C. Re-conceptualizing accessibility to parks in multi-modal cities: A Variable-width Floating Catchment Area (VFCA) method. Landsc. Urban Plan. 2015, 143, 90–99. [Google Scholar] [CrossRef]
- Chu, H.-J.; Lin, B.-C.; Yu, M.-R.; Chan, T.-C. Minimizing Spatial Variability of Healthcare Spatial Accessibility—The Case of a Dengue Fever Outbreak. Int. J. Environ. Res. Public Health 2016, 13, 1235. [Google Scholar] [CrossRef] [PubMed]
- Kennedy, J.; Eberhart, R.C. Particle swarm optimization. In Proceedings of the ICNN’95—International Conference on Neural Networks, Perth, WA, Australia, 27 November–1 December 1995. [Google Scholar]
- Birge, B. Particle Swarm Optimization Toolbox. 2006. Available online: https://ww2.mathworks.cn/matlabcentral/fileexchange/7506-particle-swarm-optimization-toolbox (accessed on 5 October 2020).

| Facility Levels | Number of Facilities | Total Physicians | Average Physicians |
|---|---|---|---|
| Primary facilities | 612 | 3672 | 6 |
| Secondary facilities | 35 | 6377 | 182 |
| Tertiary facilities | 19 | 8012 | 474 |
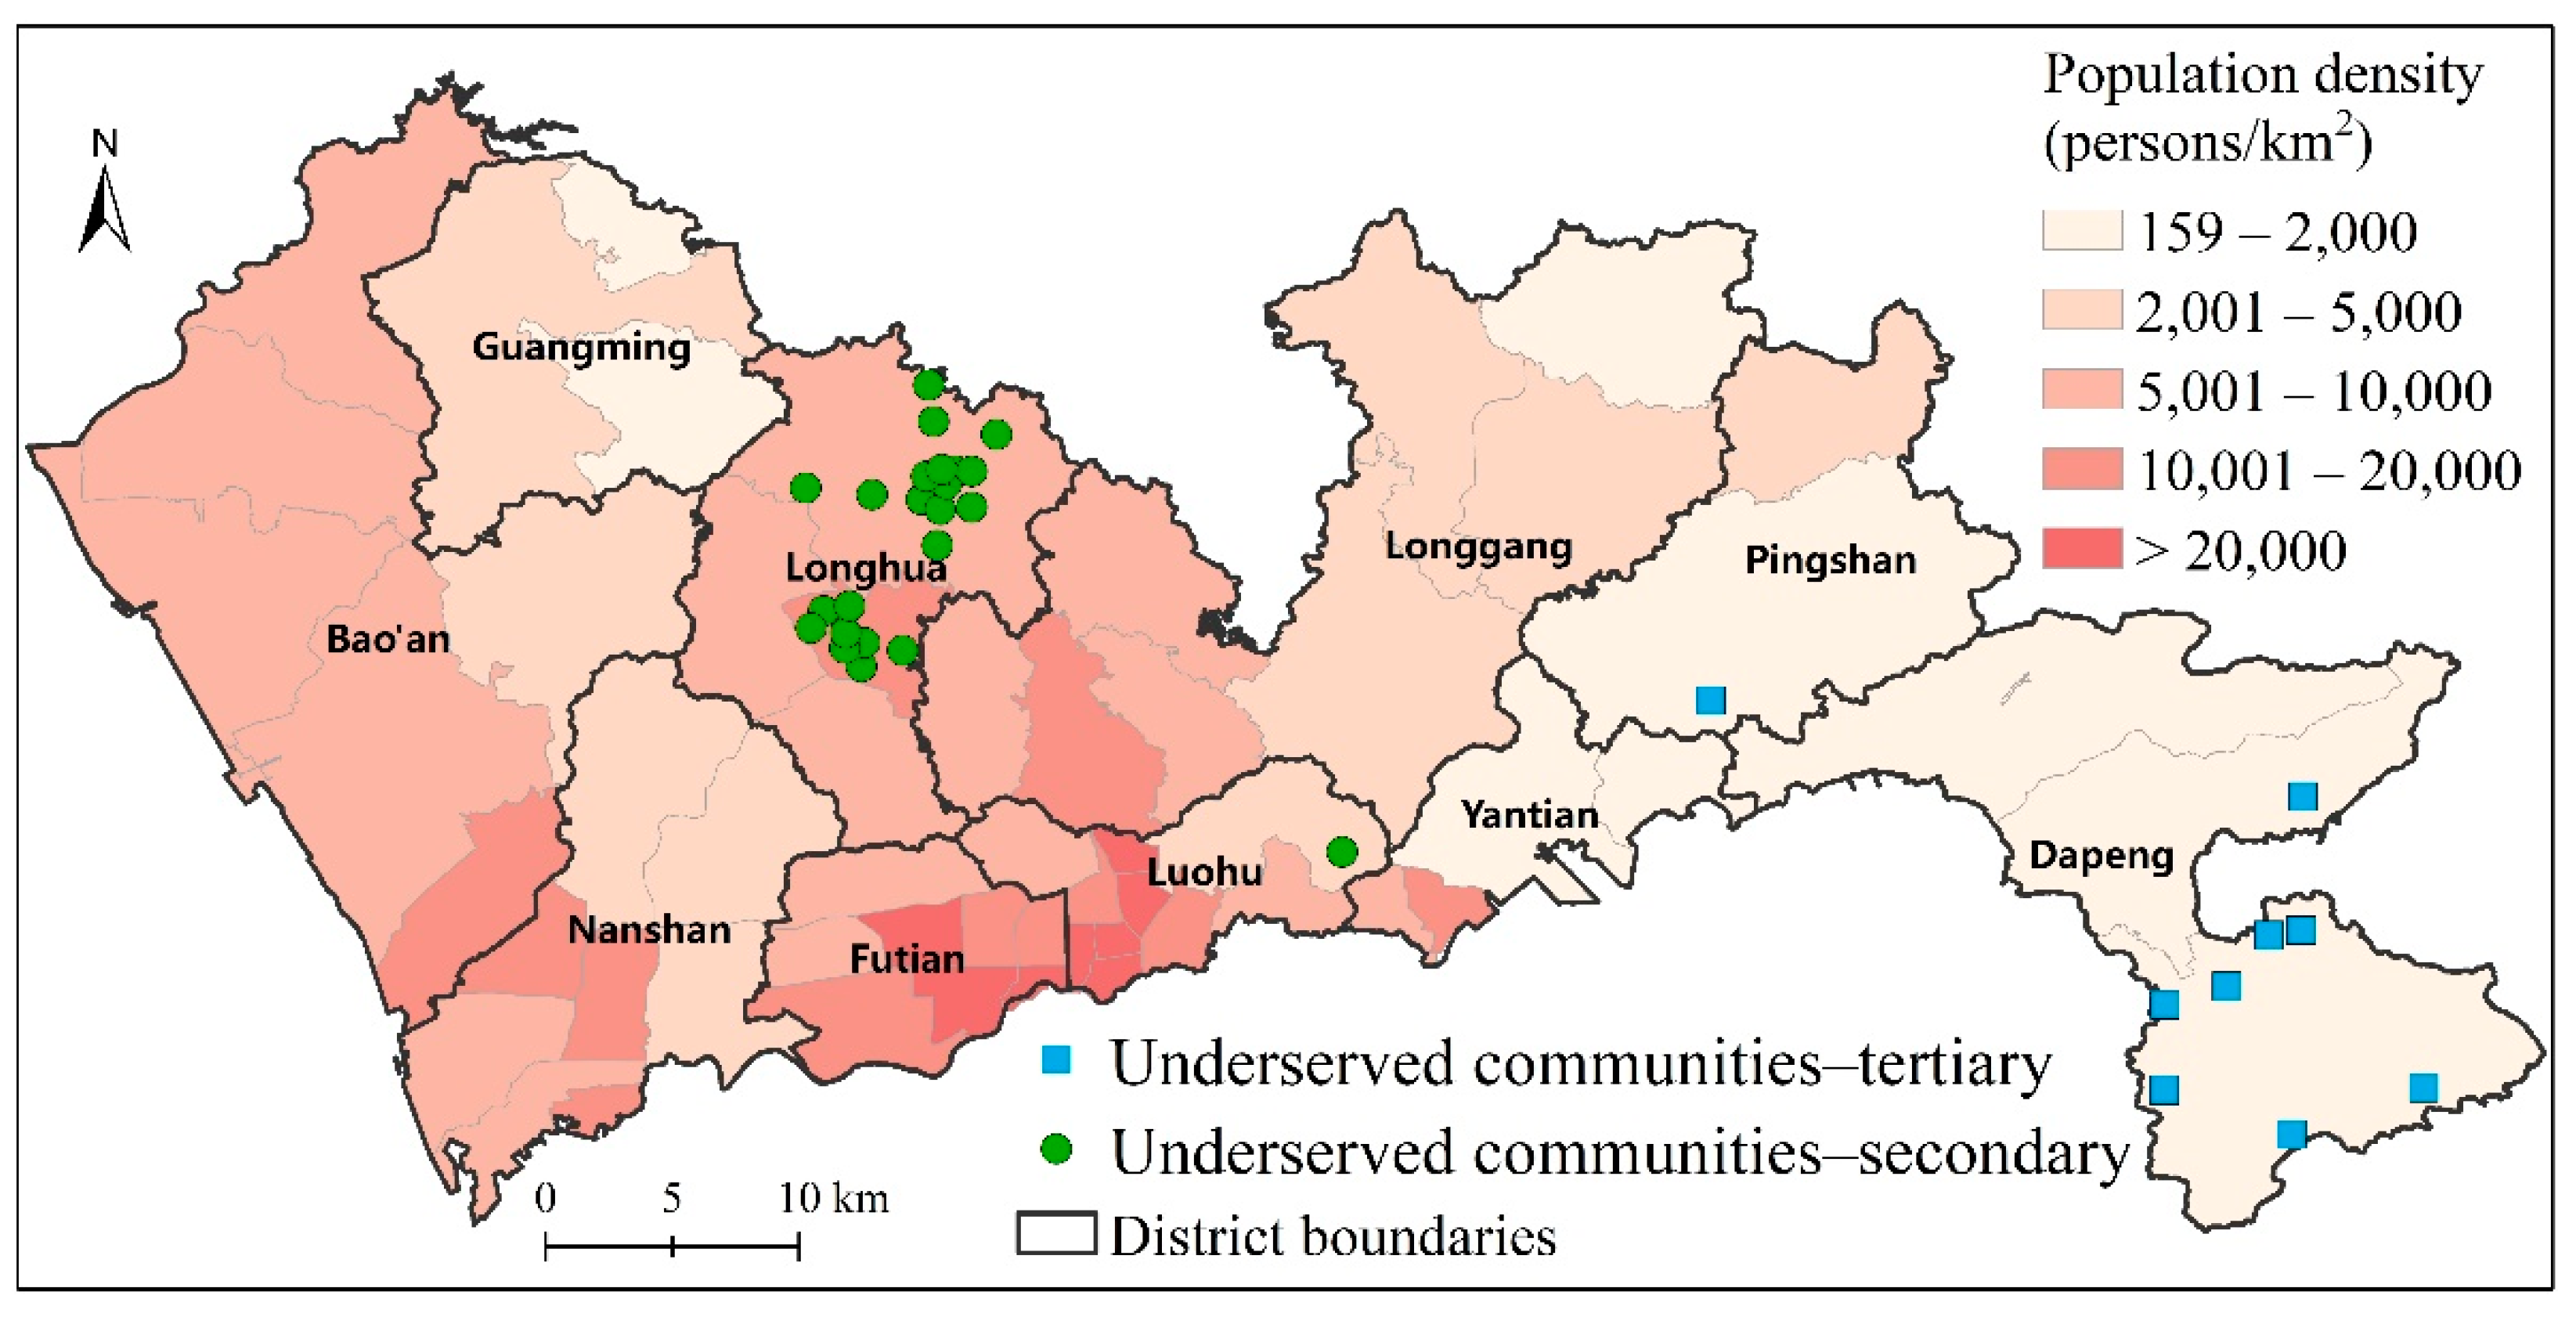
| Facility Level | Catchment Size | Number of Underserved Communities | Number of Candidate Locations | Total Physicians |
|---|---|---|---|---|
| Secondary facilities | 40 min | 23 | 39 | 7100 |
| Tertiary facilities | 70 min | 9 | 23 | 9700 |
| Facility Level | Actual | Optimized | Improvement |
|---|---|---|---|
| Secondary facilities | 0.58 | 0.36 | 38% |
| Tertiary facilities | 0.53 | 0.32 | 40% |
Publisher’s Note: MDPI stays neutral with regard to jurisdictional claims in published maps and institutional affiliations. |
© 2021 by the authors. Licensee MDPI, Basel, Switzerland. This article is an open access article distributed under the terms and conditions of the Creative Commons Attribution (CC BY) license (https://creativecommons.org/licenses/by/4.0/).
Share and Cite
Tao, Z.; Wang, Q.; Han, W. Towards Health Equality: Optimizing Hierarchical Healthcare Facilities towards Maximal Accessibility Equality in Shenzhen, China. Appl. Sci. 2021, 11, 10282. https://doi.org/10.3390/app112110282
Tao Z, Wang Q, Han W. Towards Health Equality: Optimizing Hierarchical Healthcare Facilities towards Maximal Accessibility Equality in Shenzhen, China. Applied Sciences. 2021; 11(21):10282. https://doi.org/10.3390/app112110282
Chicago/Turabian StyleTao, Zhuolin, Qi Wang, and Wenchao Han. 2021. "Towards Health Equality: Optimizing Hierarchical Healthcare Facilities towards Maximal Accessibility Equality in Shenzhen, China" Applied Sciences 11, no. 21: 10282. https://doi.org/10.3390/app112110282
APA StyleTao, Z., Wang, Q., & Han, W. (2021). Towards Health Equality: Optimizing Hierarchical Healthcare Facilities towards Maximal Accessibility Equality in Shenzhen, China. Applied Sciences, 11(21), 10282. https://doi.org/10.3390/app112110282