Abstract
In this paper, the preparation method and reasonable mix ratio of non-calcination brick with rock powder, cement, lime and fly ash ceramsite (FAC) as the raw materials were experimentally evaluated. To better understand the effects of each component on the performance of non-calcination rock powder brick (NCRPB), an orthogonal experimental design was conducted with the water–cement ratio (W/C), rock powder–cement ratio (R/C), lime content (wl) and FAC content (wf) as the main factors, which involved four factors and three factor levels. According to the orthogonal experimental design, the compressive strength, water resistance and bulk density of nine groups of NCRPB specimens were tested. The results show that R/C was the most important factor affecting the compressive strength and water resistance, while the FAC content influenced the bulk density of NCRPB greatly. In this study, the reasonable mix of W/C, R/C, wl, and wf in weight was 0.6, 3.0, 30% and 21%, respectively. In addition, the microstructure and strength formation mechanism of NCRPB were analyzed by using SEM and XRD. The test results show that the rock powder having pozzolanic activity could react with the additional Ca(OH)2 to produce hydration products, leading to the improvement of the performance of NCRPB.
1. Introduction
Construction materials serve as one of the most basic materials of a building structure and are an important component of the construction industry. As the development of society and humans progresses, the Earth’s land resources, energy and environment are under a great challenge. To satisfy the needs of sustainable development of the Earth’s resources and ecological protection, the requirements for construction materials are constantly changing from traditional construction materials to new construction materials [1,2,3,4,5].
As a widely used construction material, brick is made of clay and fired at a high temperature, and it has been proven that sintered bricks have been used in human history for thousand years [6]. Currently, brick remains the most common material in buildings for masonry construction. According to statistics by the National Bureau of Statistics, in China, approximately 200 billion sintered bricks were used in construction in 2008 [7]. Traditional sintered bricks are cumbersome to prepare and have serious environmental pollution problems. The massive amount of carbon dioxide produced in the sintering process will contribute to acid rain and global warming [8].
Non-calcination brick is a new type of construction material that can satisfy the safety and durability requirements of masonry construction without sintering. Non-calcination brick is mainly made of various types of tailings and chemical industrial waste slag as the main raw material and cement as the main cementing material after natural curing or steam curing [9,10]. The production of non-calcination brick does not require clay, which saves land resources. In addition, the bricks do not need to go through high-temperature sintering in the forming process, which reduces energy consumption and carbon dioxide emissions. However, the possible health issues of chemical industrial waste for use as a construction material cannot be ignored [11,12,13]. Liu used steel slag, blast furnace slag, fly ash and gypsum to prepare solid waste cementitious materials, and steel slag granular powder was used as an aggregate to prepare steel slag-based eco-unburned permeable bricks. The solid waste utilization rate was 96%, the flexural strength was 4.5 MPa, and the water permeability coefficient was 10.5–10−2 cm/s [14]. Zhang produced non-fired compressed masonry units from brick clay mill residues by alkali activation. The compressive strength, linear shrinkage, bulk density and microstructure were measured, and the effects of curing temperature and curing time on the properties were compared. The results show that the compressive strength of the non-fired brick can reach 24–48 MPa at 28 d [15]. Tuani Zat et al. used sludge as a raw material to produce red ceramic tiles by extrusion and investigated the technological changes due to the plasticity of the mixture and its subsequent extrusion properties during the plastic forming process of sludge. The results show that blending 15% sewage sludge by weight into clay mixtures to produce extruded ceramic bricks is very feasible [16]. Liu studied the feasibility of producing unburned brick from sludge produced by coagulation of dye wastewater with Portland cement, Portland cement clinker, alumina cement and slag cement, and the interaction between sludge and cement was analyzed. The results show that the cement-solidified sludge can reach all performance indices of unburned brick, and the compressive strength of alumina-solidified sludge is 40 MPa under a cement/dry sludge/water ratio of 1:0.5–0.8:0.5–0.8 [17]. Zhao used mud and calcium sulfoaluminate cement to prepare unburned bricks and tested the influence of the mud content on the performance of unburned bricks. The results show that when the mud content increases, the fluidity of the slurry decreases, the water consumption reaches normal consistency, and the solidification time shortens. In addition, mud incorporation can reduce the porosity of unburned brick and increase its strength [18].
Rock powder is a powdery particle produced during rock processing. Due to the limitations of renewable technologies, rock powder is usually randomly dumped in rivers or waste disposal sites in coastal areas. However, this method of disposing of rock powder results in the occupation of a large amount of land resources and imposes a heavy burden on the local ecological environment [19]. Therefore, how to regenerate rock powder through a reasonable process has become an urgent research problem. At present, research on the application of rock powder mainly focuses on the treatment of foundation soil and green concrete production [20,21,22], while research on the application of rock powder in non-calcination bricks is relatively lacking. Thus, this study considers the use of rock powder as the main component, cement and lime as cementitious materials, and ceramic pellets as auxiliary materials to make non-calcination bricks.
The mix ratio design is an important part of the production and application of non-calcination bricks. A reasonable mix ratio can obtain good economic benefits and introduce a series of social benefits, such as saving resources and protecting the environment. However, many factors affect the properties of non-calcination brick, and the relationship among these factors is complex, so it is difficult to design a high-performance and low-cost mixing ratio based on experience alone. Thus, four main factors were considered in this paper: the water–cement ratio, rock powder–cement ratio, lime content and FAC content. Nine sets of specimens were designed and prepared by the orthogonal test method, and the compressive strength, water resistance and bulk density were tested. The influence law of each factor was analyzed, and a reasonable preferred proportioning scheme was proposed. In addition, scanning electron microscopy (SEM) and X-ray diffraction (XRD) were used to analyze the microstructure and phase composition of the non-calcination brick, and the strength formation mechanism was discussed.
2. Materials and Methods
2.1. Materials
The raw materials in this study were rock powder, lime, cement and FAC, as shown in Figure 1. Rock powder was provided by a concrete plant in Shantou City, Guangdong Province, and the particle size was less than 1 mm after sieving (Figure 1a). The XRD patterns (Figure 2a) show that the main mineral composition of rock powder is quartz (SiO2), albite (NaAlSi3O8) and a small amount of petalite (AlLi(Si2O5)2), orthoclase (KAlSi3O8), sanidine (KAlSi3O8) and aluminum phosphate (AlPO4). The lime in the test is industrial slaked lime powder (Figure 1c), the main component is portlandite (Ca(OH)2), and the specific XRD pattern is shown in Figure 2b. Ordinary Portland cement of 32.5 grade was used, and ceramsite was produced in a building material factory in Guangdong Province. The main component was fly ash, the particle size was 5~10 mm, and the apparent density was 816.7 kg/m3.
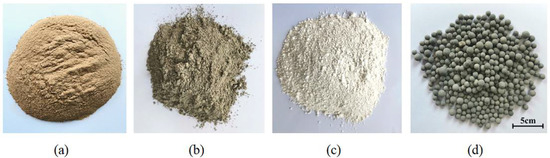
Figure 1.
The raw materials: rock power (a), cement (b), lime (c) and FAC (d).
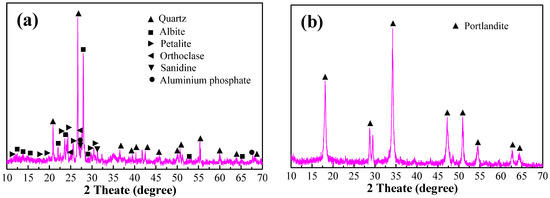
Figure 2.
XRD patterns of rock power (a) and lime (b).
2.2. Specimen Molding and Curing Method
The extrusion molding technique was used in the NCRPB production. In the pressurized state, sliding displacement occurs under the interaction among the particles of the cementing material, and smaller particles are pressed into and fill the voids of the larger particles, so the blank achieves high compactness and high strength. In this test, 15 MPa was chosen as the forming pressure of NCRPB based on safety and economic considerations. After forming, the specimens were placed in a natural environment to cure for 28 d. Figure 3 shows the process of material addition, mixing, compaction molding and curing of NCRPB (the specimen forming size is 120 × 150 × 300 mm3). Figure 4 shows the forming equipment and prepared samples of NCRPB.
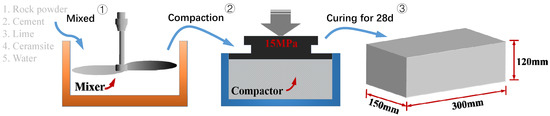
Figure 3.
Diagram of the production process of NCRPB.
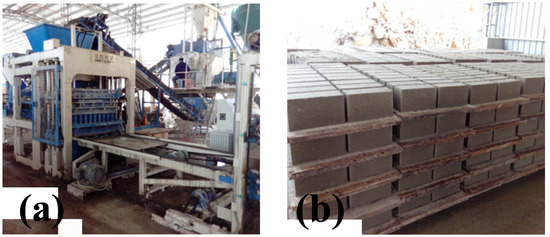
Figure 4.
Forming equipment (a) and samples (b) of NCRPB.
2.3. Orthogonal Experimental Design
To analyse the influence of the mix ratio on the mechanical properties of NCRPB, the following main influencing factors were considered: A―W/C, B―R/C, C―wl, and D―wf. For each influencing factor, three levels were set for the orthogonal analysis, and the specific factor level combinations are shown in Table 1. The levels of the factors were combined according to the orthogonal design to derive the corresponding orthogonal Table L9(34), based on which the doping of each component was calculated according to the mass method. The details are listed in Table 2.

Table 1.
Factors and levels.
Table 2.
Orthogonal test.
2.4. Experimental Methods
2.4.1. Compressive Strength
The compressive strength test of NCRPB is based on the Chinese standard (GB/T 21144-2007) [23]. Each mix ratio consists of 10 specimens for testing and maintains a speed of 4–5 kN/s when loading. Through the test, the failure loads of NCRPB specimens with different mix ratios were obtained, and the compressive strength was calculated according to Equation (1).
where Rp is the compressive strength, F is the failure load, and L and B are the length and width of the compression surface, respectively.
2.4.2. Water Absorption and Softening Coefficient
The water absorption test of NCRPB was performed according to the Chinese standard (GB 11970-1989) [24]. Three samples were tested in each group. The dry weights (G0) and saturation weights (Gg) were tested, and the water absorption rate W was determined by Equation (2).
After the water absorption test, the specimens were immediately placed on a universal machine for testing, and the softening coefficient was calculated by Equation (3).
where K is the softening coefficient, and Rg and R0 are the compressive strength of NCRPB specimens in the dry and water-absorbing saturated states, respectively.
2.4.3. Bulk Density
The bulk density test was performed according to the Chinese standard (GB/T 2542-2012) [25]. Five samples were prepared in each group, and the specimen was dried to a constant weight using an oven at 105 ± 5 °C, after which the volume (V) and dry weight (G0) of the samples were measured by brick caliper and electronic scale, respectively. The bulk density was calculated according to Equation (4).
2.4.4. Scanning Electron Microscopy (SEM)
The microstructure of NCRPB specimens was investigated by using a ZEISS Gemini 300 field emission scanning electron microscope (FESEM), which was manufactured by Zeiss, Germany. The samples were soaked in absolute ethanol to stop hydration before testing. During the test, the gold-sprayed specimens were placed on a shelf in an ultravacuum environment for observation, and an accelerating voltage of 3 KV was selected for the test.
2.4.5. X-ray Diffraction (XRD)
The phase analysis of rock powder, lime and NCRPB samples was performed by using a D8-ADVANCE X-ray powder diffractometer (XRD) produced by the German Bruker Company. The diffraction angle was 5–75°, and the scan speed was 10° per minute.
3. Results and Discussions
According to the design of the orthogonal experiment in Table 2, nine sets of specimens were prepared, and the compressive strength, water absorption, softening coefficient and bulk density of NCRPB at 28 d of age were tested. The specific test results are shown in Figure 5.
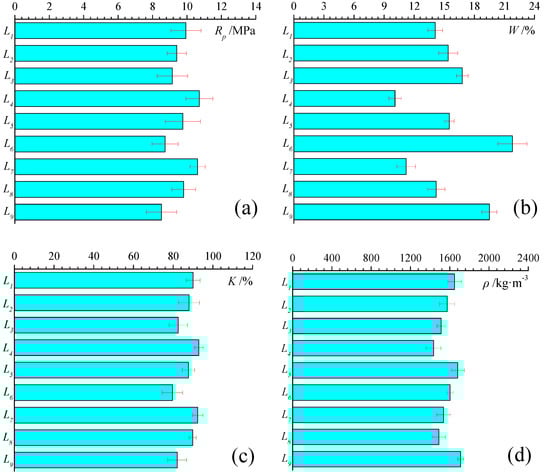
Figure 5.
Orthogonal test results of compressive strength (a), water absorption rate (b), softening coefficient (c) and bulk density (d).
Based on the experimental test results, the corresponding range and variance values of four factors were calculated and compared, as shown in Table 3 and Table 4, and the law and importance of the influence of each factor on the performance of NCRPB can be obtained.
Table 3.
Range analysis of the orthogonal test.
Table 4.
Variance analysis of the orthogonal test.
3.1. Failure Process and Failure Mode of the Specimens
In order to compare the failure mode of NCRPB with and without FAC, the control group was prepared and tested by using the L4 mix ratio as standard and only removed FAC. As shown in Figure 6a,b, the compressive damage process of NCRPB with and without FAC addition was basically identical. At the early stage of loading, no cracks were found on the surface of the specimens. When the load increased, cracks started to appear on the surface of one side of the specimen, and the cracks expanded thereafter. In the middle position of the specimen height, the cracks developed vertically upward and downward and gradually turned to the corner, which formed a positive-inverse connected V-shaped crack. With further increase in load, V-shaped cracks gradually formed on the other side of the surface, new cracks gradually developed inward, and the surface concrete bulged and cracked. The observations of the damage shows that the specimens containing FAC can produce more cracks during the failure process to absorb the damage energy. The damage of the specimen section without FAC is mainly in the form of cement shedding, while the damage surface of the specimen with FAC also contains the fragmentation of ceramic particles, as shown in Figure 6c,d.
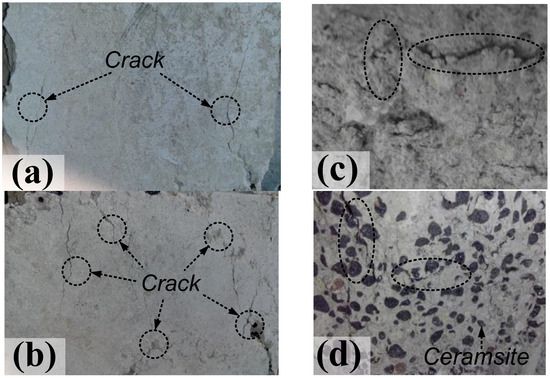
Figure 6.
The failure mode of the NCRPB sample without FAC (a,c) and with FAC (b,d).
3.2. Analysis of the Influencing Factors of Compressive Strength
Figure 5 shows that Rp of NCRPB with nine groups is 8.5–10.7 MPA, and the highest compressive strength of L4 is 10.7 MPA. The influencing factors were analyzed according to the extreme difference values of the compressive strength of each group, as shown in Figure 7. In Figure 7, the change in R/C had the most significant effect on the compressive strength of NCRPB, and the compressive strength significantly decreased with the increase in R/C. Rp of NCRPB decreased by 15.4% when R/C increased from 3.0 to 5.0. In addition, the variation in wf, wl and W/C affected the compressive strength of NCRPB, but it was not as significant as that of W/C. The compressive strength of NCRPB slowly increased with increasing FAC and lime content. With increasing W/C (0.5~0.7), the compressive strength of NCRPB first increased and subsequently decreased. When W/C is less than 0.6, the saturation water consumption of the hydration reaction is not reached, so the reaction is not sufficient. After the saturation water consumption is exceeded, the compressive strength will significantly decrease if W/C is increased. Through the comparison of Rp values of each group, the best combination scheme of NCRPB is A2B1C3D3, but the mix ratio of this group does not appear in the orthogonal combination. In addition, considering that high lime dosing will reduce the utilization rate of rock powder and increase the cost, this paper selects A2B1C2D3 as the optimal group, and its compressive strength is 10.7 MPa, which is higher than the 10 MPa (MU10) specified in the Chinese wall brick specification, so this group has practical engineering significance. In addition, the extreme difference analysis of compressive strength (in Table 4) shows that the F values of the four influencing factors are 0.07, 3.43, 0.18 and 0.31, and only R/C has a greater F value than the critical value of extreme difference F0.1 = 3.11 to reach the significance level, which further illustrates the significance of the influence of R/C.
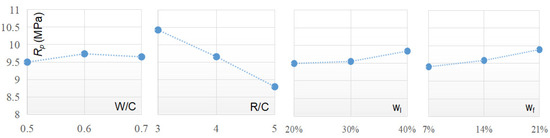
Figure 7.
Intuitive analysis of the compressive strength of four factors.
3.3. Analysis of Influencing Factors on Water Resistance Performance
The water absorption rate and softening coefficient of NCRPB with different mix ratios are shown in Figure 4 (each mix ratio consists of 10 specimens for testing). The extreme difference and variance values of the effects of the factors were compared, and the W and K visual analysis graphs of NCRPB under different influencing factors are shown in Figure 8 and Figure 9. Figure 8 and Figure 9 show that the change in R/C has the most significant effect on the water resistance of NCRPB. When R/C increases from 3.0 to 5.0, the water absorption rate of NCRPB increases by 64.1%, and its softening coefficient decreases by 11.3%. Therefore, the amount of rock powder admixture in the NCRPB must be strictly controlled to ensure its economic efficiency and not to have too much influence on its water resistance. However, the other three factors only slightly affect the water resistance of NCRPB. The results in Figure 5 show that the optimal water resistance can be obtained for Group L4, whose water absorption rate is only 10.09%, which satisfies the requirement that the water absorption rate must be less than 15% for wall bricks, as stipulated by Chinese specifications. The variance F of each factor was further analyzed, and the results are shown in Table 4. The data in the table show that R/C has the greatest influence on the water resistance performance of the rock powder brick with F value of 3.19 (W) and 3.62 (K) > F0.1 = 3.11, which reaches the level of significant influence.
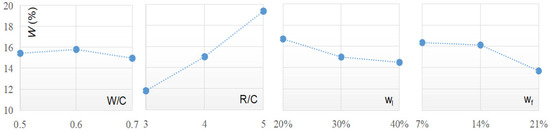
Figure 8.
Intuitive analysis of the water absorption of four factors.
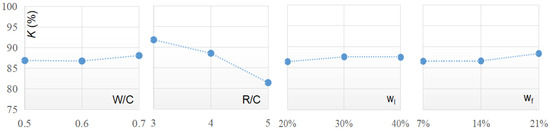
Figure 9.
Intuitive analysis of the softening coefficient of four factors.
3.4. Analysis of Influencing Factors of Bulk Density
To obtain lightweight, high-strength and environmentally friendly non-calcination bricks, this paper conducted a test on the bulk density of NCRPB (each mix ratio consists of 10 specimens for testing) and analyzed its extreme difference and variance values. Figure 10 shows the results of the extreme variance analysis of the bulk density of NCRPB, and the data in Figure 10 show that the FAC content is the main factor that affects the bulk density of NCRPB. When wf increased from 7% to 21%, the bulk density of NCRPB decreased by as much as 12% and reached 1479 kg/m3. The reason of this phenomenon is that the apparent density of FAC (816.7 kg/m3) is much lower than that of rock powder (1572.3 kg/m3). With increasing R/C, the bulk density of NCRPB increased. However, there was almost no effect on the bulk density of NCRPB when W/C and wl were changed. The results of the analysis of variance in Table 4 also prove the correctness of these conclusions.
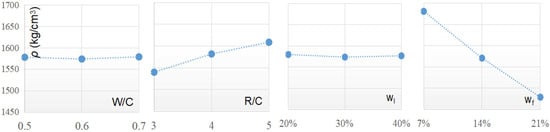
Figure 10.
Intuitive analysis of the bulk density of four factors.
4. Regression Analysis
The visual analysis results show an approximately linear correspondence between the respective response values compressive strength (Rp), water absorption rate (W), softening coefficient (K) and bulk density (ρ) of NCRPB and the four factors. Using the regression method for fitting, the following linear regression equation can be derived:
where y is the calculated value of each performance, ai (i = 0, 1, 2, 3, 4) is the regression coefficient; x1 is the W/C; x2 is the R/C; x3 is the wl; x4 is the wf; e is the experimental error.
By substituting the data into the regression model in Equation (5), the least squares estimate is obtained. The regression equation is given below.
Compressive strength (Rp) calculation formula:
Water absorption rate (W) calculation formula:
Softening coefficient (K) calculation formula:
Bulk density (ρ) calculation formula:
The orthogonal test was divided into nine groups with five variables, so the degree of freedom was 4, and the determination coefficients R2 were close to 1. This high R2 value suggests that the linear regression equation obtained is meaningful. In addition, the critical value of variance F0.05(4,5) of the regression equation is 6.256, and all variance values of the above formulas are larger than 6.256, so the obtained equation is significant.
5. Microstructure Analysis
5.1. X-ray Diffraction
The XRD patterns of rock powder mixed with lime are shown in Figure 11. By comparing with Figure 2, it was found that the rock powder embryo after doping with lime contained some sodium alum (NaAl(SO4)2·12H2O) diffraction peaks (with its main diffraction peak near 20.85°) and gismondine (CaAl2Si2O8·4H2O) peaks, in addition to the main diffraction peaks of quartz (SiO2), albite (NaAlSi3O8) and portlandite (Ca(OH)2). Thus, the alkaline environment (Ca(OH)2 incorporation) can stimulate the active components of rock powder to produce a certain amount of hydration products. The rock powder and lime products on the surface of the FAC particles are selected for testing, and the XRD pattern is shown in Figure 11b. In Figure 11b, the NaAl(SO4)2·12H2O and CaAl2Si2O8·4H2O diffraction peaks were more obvious, and there were more water silica-aluminate bulge-type diffusion peaks, while the characteristic diffraction peaks of quartz, albite and portlandite occurred significantly less. The reasons for this phenomenon may be as follows: On the surface of FAC, there is a certain amount of active fly ash, with which a large amount of free Ca(OH)2 will aggregate and bind, so the characteristic peak of Ca(OH)2 is reduced [26,27,28]. Fly ash has higher activity than rock powder, so more hydration products are generated. Moreover, some gel or semi-crystalline hydrated calcium aluminate, hydrated calcium silicate and hydrated aluminosilicate cover the surface of the rock powder particles, which reduces the diffraction ability of quartz and albite.
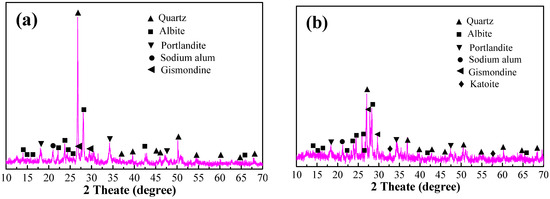
Figure 11.
The XRD patterns of (a) rock powder mixed with lime and (b) the rock powder-lime products on the surface of the FAC particles.
5.2. Scanning Electron Microscope
Figure 12 shows the internal microstructure of rock powder mixed with cement and lime at 28 d. In Figure 12, in addition to many amorphous calcium silicate gels, a lot of needle-like ettringite and many hexagonal state calcium hydroxide crystals are present in the internal microstructure of NCRPB. The ettringite and calcium silicate gels are interspersed and cross-linked to form a mesh structure, and crystal-like calcium hydroxide fills between the pores, which gives the NCRPB embryos a certain strength. However, the figure obviously shows many voids inside the NCRPB, so its strength is limited.
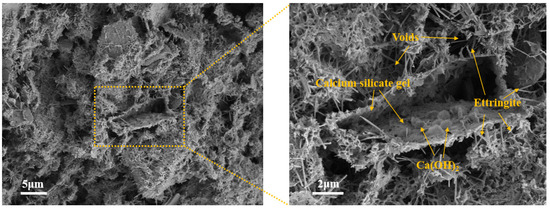
Figure 12.
Microstructure of rock powder mixed with cement and lime.
Figure 13a shows the morphology of the FAC particles inside the NCRPB. The dashed inner line in Figure 13a is measured as a spherical FAC particle, point A represents the FAC particle surface, point B represents the FAC particle boundary, and the area of point A is enlarged to obtain Figure 13b. Figure 13b shows that FAC can be coated with a large amount of amorphous calcium silicate gel on the surface, and a certain acicular ettringite cross-links with it to form a network structure. Figure 13c shows the image obtained by magnifying point B at the boundary of the FAC particles. Figure 13c shows that the FAC particles are directly connected with the rock powder by the hydration product, which forms a monolith. In addition, the magnification of the surface area C of the rock powder particle grain is shown in Figure 13d. Figure 13d shows that not only is the surface of the rock powder particle covered with a large amount of hydration products, but the internal area also generates an amount of gel under the excitation of calcium hydroxide. This result mutually corroborates the conclusion in Section 5.1 and reflects that the incorporation of calcium hydroxide indeed helps enhance the strength of NCRPB.
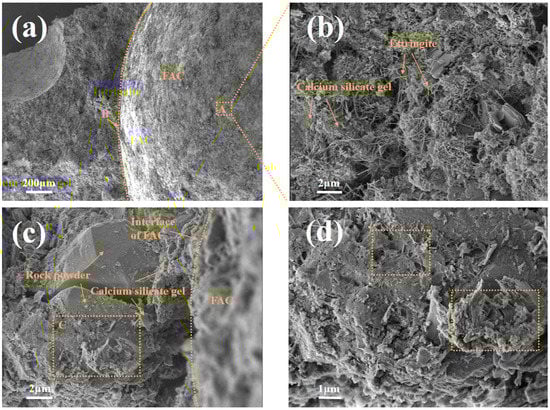
Figure 13.
SEM micrographs of the (a) FAC particles inside the NCRPB, (b) FAC particle surface, (c) FAC particle boundary and (d) magnified SEM image of the box region in (c).
6. Conclusions
In this paper, the effects of the water–cement ratio (W/C), rock powder–cement ratio (R/C), lime content (wl), and FAC content (wf) on the compressive strength, water resistance and bulk density of NCRPB were studied by orthogonal tests. The microstructure and mechanism were analyzed by XRD and SEM. The results show that:
- (1)
- The most significant factor that affects the compressive strength and water resistance of non-calcination brick is R/C. The compressive strength and water resistance of NCRPB significantly decreases with increasing R/C.
- (2)
- The FAC content is the most significant factor that affects the bulk density of NCRPB. When wf increases from 7 to 21%, the bulk density of NCRPB decreases by as much as 12%.
- (3)
- The analysis of the orthogonal test results shows that the NCRPB has the best performance when W/C is 0.6, R/C is 3:1, wl is 30%, and wf is 21%.
- (4)
- XRD and SEM results imply that rock powder under alkaline conditions (Ca(OH)2 incorporation) can produce hydration products, which improve the mechanical properties of NCRPB.
It is worth noting that the long-term stability performance of NCRPB is worthy of investigating systematically in the future for its practical engineering. In addition, further research should be applied to investigate the potential environmental issues caused by the preparation of NCRPB.
Author Contributions
Conceptualization, J.F. and G.L.; data curation Z.W.; writing of the original draft, J.F. and Z.W.; writing—review and editing, G.L. All authors have read and agreed to the published version of the manuscript.
Funding
This research was funded by the National Natural Science Foundation of PR China (No. 52178209), the project of Natural Science Research Foundation of Guizhou Province (No. ZK [2021]-283) and High-Level Talent Fund of Guizhou Institute of Technology (No. XJGC20190650). The authors are grateful for the above supporters.
Institutional Review Board Statement
Not applicable.
Informed Consent Statement
Not applicable.
Acknowledgments
The authors would like to thank shiyanjia lab for the support of SEM test.
Conflicts of Interest
The authors declare no conflict of interest.
References
- Cao, V.D.; Pilehvar, S.; Salas-Bringas, C. Thermal analysis of geopolymer concrete walls containing microencapsulated phase change materials for building applications. Sol. Energy 2018, 178, 295–307. [Google Scholar] [CrossRef]
- Chen, F.; Zhang, Y.; Liu, J. Fly ash based lightweight wall materials incorporating expanded perlite/SiO2 aerogel composite: Towards low thermal conductivity. Constr. Build. Mater. 2020, 249, 118728. [Google Scholar] [CrossRef]
- Luo, Y.; Shao, Y.; Chen, T. Study of New Wall Materials Design Based on TRIZ Integrated Innovation Method. Manag. Sci. Eng. 2012, 6, 15–29. [Google Scholar]
- Lee, H.; Jeon, D.; Song, H.; Sim, S.W.; Kim, D.; Yu, J.; Cho, K.H.; Oh, J.E. Recycling of Reverse Osmosis (RO) Reject Water as a Mixing Water of Calcium Sulfoaluminate (CSA) Cement for Brick Production. Appl. Sci. 2019, 9, 5044. [Google Scholar] [CrossRef]
- Poon, C.S.; Kou, S.C.; Lam, L. Use of recycled aggregates in molded concrete bricks and blocks. Constr. Build. Mater. 2002, 16, 281–289. [Google Scholar] [CrossRef]
- Deboucha, S.; Hashim, R. A review on bricks and stabilized compressed earth blocks. Sci. Res. Essays 2011, 6, 499–506. [Google Scholar]
- Zhou, X. New Way of energy saving and emission reduction in brick and tile industry. Brick World 2009, 3, 15–19. (In Chinese) [Google Scholar]
- Nagaraj, H.B.; Sravan, M.V.; Arun, T.G. Role of lime with cement in long-term strength of Compressed Stabilized Earth Blocks. Int. J. Sustain. Built Environ. 2014, 3, 54–61. [Google Scholar] [CrossRef]
- Oti, J.E.; Kinuthia, J.M. Stabilised unfired clay bricks for environmental and sustainable use. Appl. Clay Sci. 2012, 58, 52–59. [Google Scholar] [CrossRef]
- Zhang, L. Production of bricks from waste materials—A review. Constr. Build. Mater. 2013, 47, 643–655. [Google Scholar] [CrossRef]
- Aguilar-Penagos, A.; Gómez-Soberón, J.M.; Rojas-Valencia, M.N. Physicochemical, Mineralogical and Microscopic Evaluation of Sustainable Bricks Manufactured with Construction Wastes. Appl. Sci. 2017, 7, 1012. [Google Scholar] [CrossRef]
- Stevulova, N.; Estokova, A.; Holub, M.; Singovszka, E.; Csach, K. Characterization of Demolition Construction Waste Containing Asbestos, and the Release of Fibrous Dust Particles. Appl. Sci. 2020, 10, 4048. [Google Scholar] [CrossRef]
- Maldonado-Alameda, A.; Mañosa, J.; Giro-Paloma, J.; Formosa, J.; Chimenos, J.M. Alkali-Activated Binders Using Bottom Ash from Waste-to-Energy Plants and Aluminium Recycling Waste. Appl. Sci. 2021, 11, 3840. [Google Scholar] [CrossRef]
- Liu, L.; Cheng, X.; Miao, X. Preparation and characterization of majority solid waste based eco-unburned permeable bricks. Constr. Build. Mater. 2020, 259, 120400. [Google Scholar] [CrossRef]
- Zhang, Z.; Wong, Y.C.; Arulrajah, A. Feasibility of producing non-fired compressed masonry units from brick clay mill residues by alkali activation. J. Clean. Prod. 2021, 306, 126916. [Google Scholar] [CrossRef]
- Zat, T.; Bandieira, M.; Sattler, N. Potential re-use of sewage sludge as a raw material in the production of eco-friendly bricks. J. Environ. Manag. 2021, 297, 113238. [Google Scholar] [CrossRef]
- Liu, Z.; Chen, Q.; Xie, X. Utilization of the sludge derived from dyestuff-making wastewater coagulation for unfired bricks. Constr. Build. Mater. 2011, 25, 1699–1706. [Google Scholar] [CrossRef]
- Zhao, H.; Gou, H. Unfired bricks prepared with red mud and calcium sulfoaluminate cement: Properties and environmental impact. J. Build. Eng. 2021, 38, 102238. [Google Scholar] [CrossRef]
- Xiao, Z.; Xu, W. Assessment of strength development in cemented coastal silt admixed granite powder. Constr. Build. Mater. 2019, 206, 470–482. [Google Scholar] [CrossRef]
- Hildebrand, E.E.; Schack-Kirchner, H. Initial effects of lime and rock powder application on soil solution chemistry in a dystric cambisol- results of model experiments. Nutr. Cycl. Agroecosyst. 2000, 56, 69–78. [Google Scholar] [CrossRef]
- Lopes, O.; Carrilho, E.; Lopes-Assad, M. Effect of rock powder and vinasse on two types of soils. Rev. Bras. Ciência Do Solo 2014, 38, 1547–1557. [Google Scholar] [CrossRef][Green Version]
- Shahul, M.; Hameed, A.S.; Sekar, S. Properties of green concrete containing quarry rock dust and marble sludge powder as fine aggregate. J. Eng. Appl. Sci. 2009, 4, 1819–6608. [Google Scholar]
- GB/T 21144-2007. Solid Concrete Brick; Standardization Administration of China: Beijing, China, 2007. (In Chinese)
- GB 11970-1989. Test Method for Bulk Density, Water Content and Water Absorption of Aerated Concrete; Architecture and Building Press: Beijing, China, 1989. (In Chinese) [Google Scholar]
- GB/T 2542-2012. Test Method for Wall bricks; Architecture and Building Press: Beijing, China, 2012. (In Chinese) [Google Scholar]
- Singh, G.; Subramanian, K.V.L. Quantitative XRD study of amorphous phase in alkali activated low calcium siliceous fly ash. Constr. Build. Mater. 2016, 124, 139–147. [Google Scholar] [CrossRef]
- Weerdt, K.D.; Haha, M.B.; Saout, G.L. Hydration mechanisms of ternary Portland cements containing limestone powder and fly ash. Cem. Concr. Res. 2011, 41, 279–291. [Google Scholar] [CrossRef]
- Zhao, D.; Gao, Y.; Nie, S. Self-assembly of honeycomb-like calcium-aluminum-silicate-hydrate (C-A-S-H) on ceramsite sand and its application in photocatalysis. Chem. Eng. J. 2018, 15, 583–593. [Google Scholar] [CrossRef]
Publisher’s Note: MDPI stays neutral with regard to jurisdictional claims in published maps and institutional affiliations. |
© 2021 by the authors. Licensee MDPI, Basel, Switzerland. This article is an open access article distributed under the terms and conditions of the Creative Commons Attribution (CC BY) license (https://creativecommons.org/licenses/by/4.0/).